Great Neck Gardens, NY
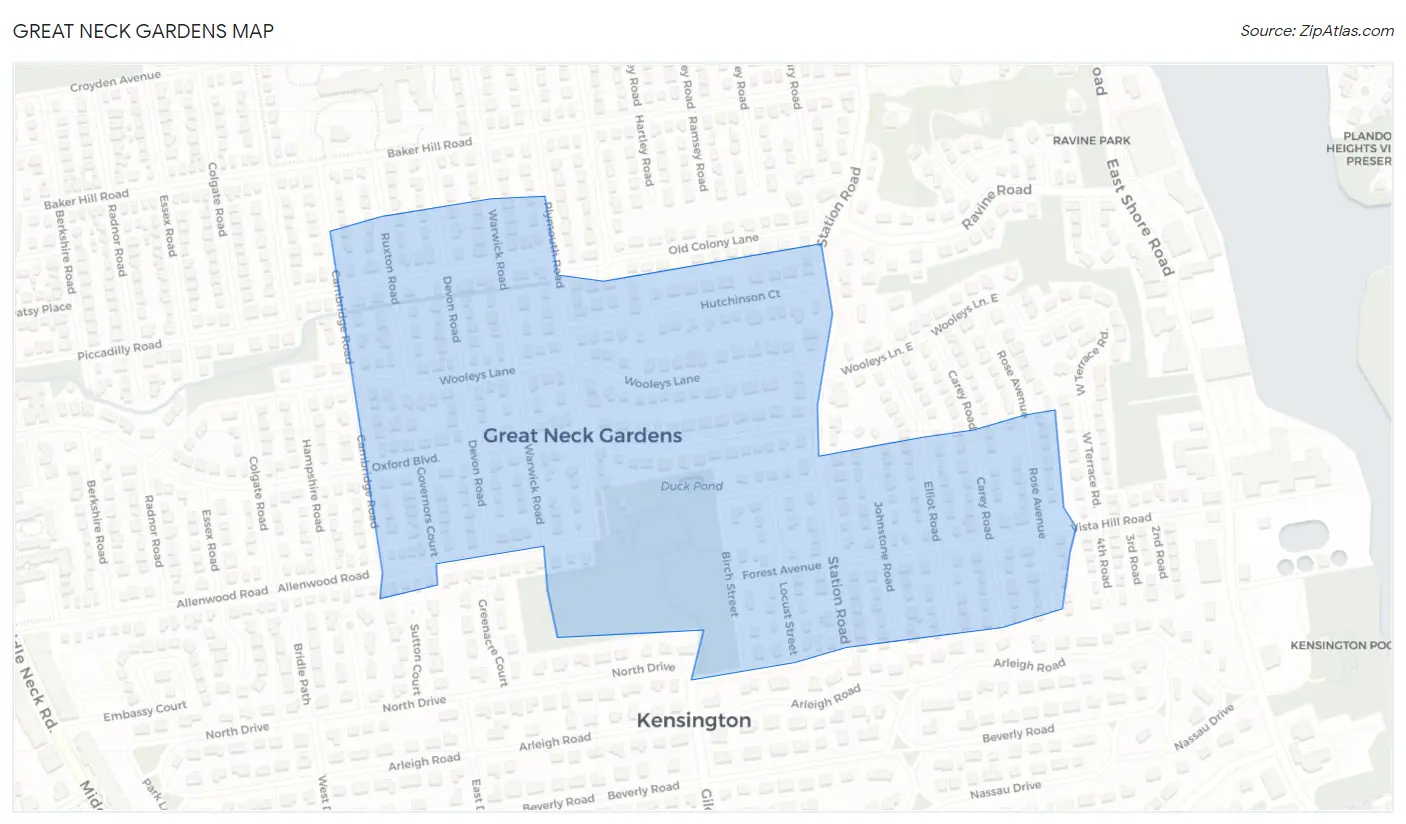
Great Neck Gardens Map
Great Neck Gardens Overview
1,139
TOTAL POPULATION
440
MALE POPULATION
699
FEMALE POPULATION
62.95
MALES / 100 FEMALES
158.86
FEMALES / 100 MALES
58.9
MEDIAN AGE
4.2
AVG FAMILY SIZE
3.0
AVG HOUSEHOLD SIZE
$77,915
PER CAPITA INCOME
$222,159
AVG FAMILY INCOME
0.60
INEQUALITY / GINI INDEX
623
LABOR FORCE [ PEOPLE ]
62.0%
PERCENT IN LABOR FORCE
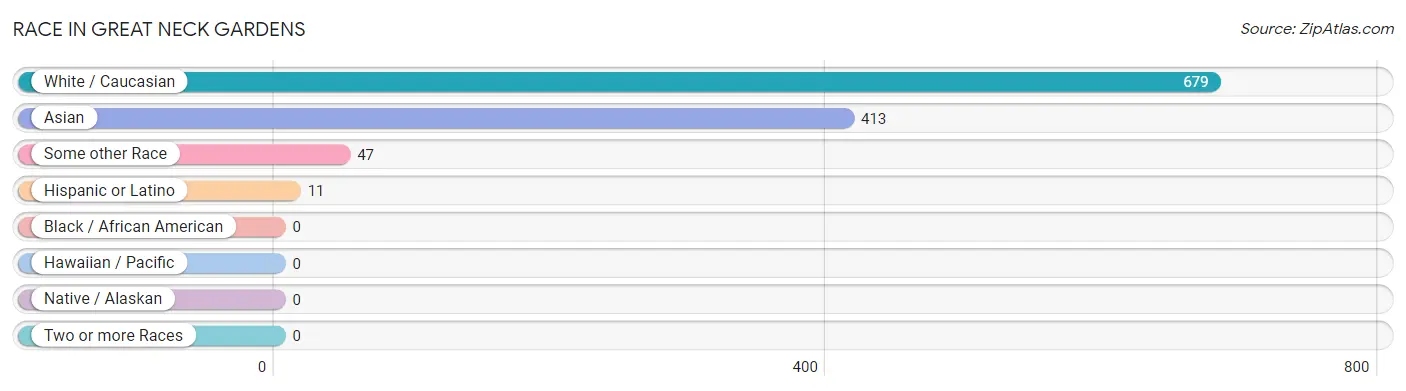
Race in Great Neck Gardens
The most populous races in Great Neck Gardens are White / Caucasian (679 | 59.6%), Asian (413 | 36.3%), and Some other Race (47 | 4.1%).
| Race | # Population | % Population |
| Asian | 413 | 36.3% |
| Black / African American | 0 | 0.0% |
| Hawaiian / Pacific | 0 | 0.0% |
| Hispanic or Latino | 11 | 1.0% |
| Native / Alaskan | 0 | 0.0% |
| White / Caucasian | 679 | 59.6% |
| Two or more Races | 0 | 0.0% |
| Some other Race | 47 | 4.1% |
| Total | 1,139 | 100.0% |
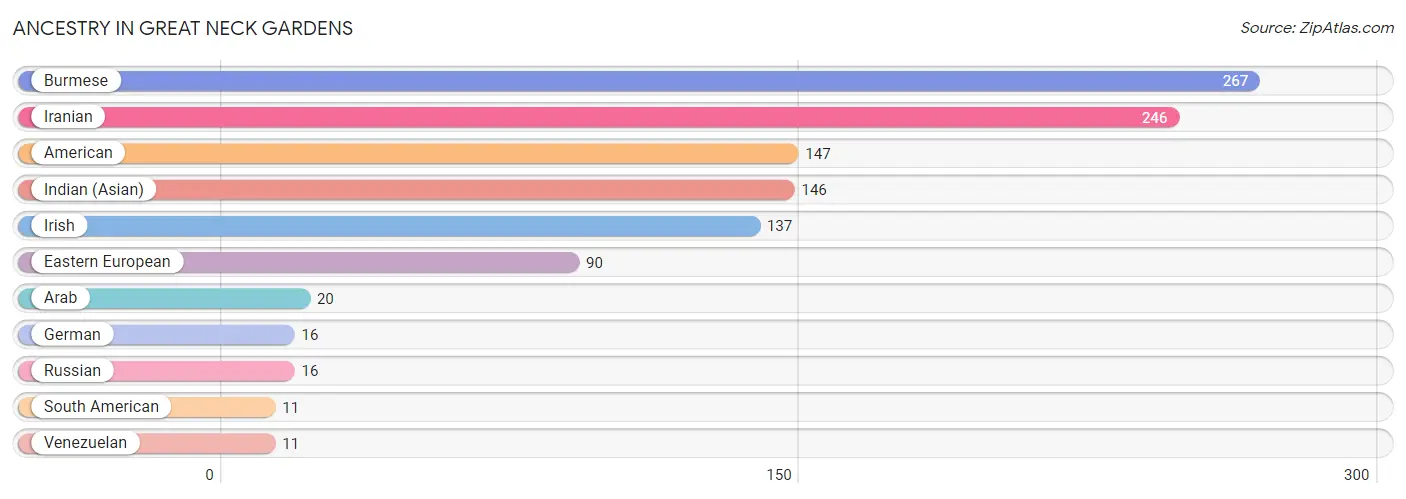
Ancestry in Great Neck Gardens
The most populous ancestries reported in Great Neck Gardens are Burmese (267 | 23.4%), Iranian (246 | 21.6%), American (147 | 12.9%), Indian (Asian) (146 | 12.8%), and Irish (137 | 12.0%), together accounting for 82.8% of all Great Neck Gardens residents.
| Ancestry | # Population | % Population |
| American | 147 | 12.9% |
| Arab | 20 | 1.8% |
| Burmese | 267 | 23.4% |
| Eastern European | 90 | 7.9% |
| German | 16 | 1.4% |
| Indian (Asian) | 146 | 12.8% |
| Iranian | 246 | 21.6% |
| Irish | 137 | 12.0% |
| Russian | 16 | 1.4% |
| South American | 11 | 1.0% |
| Venezuelan | 11 | 1.0% | View All 11 Rows |
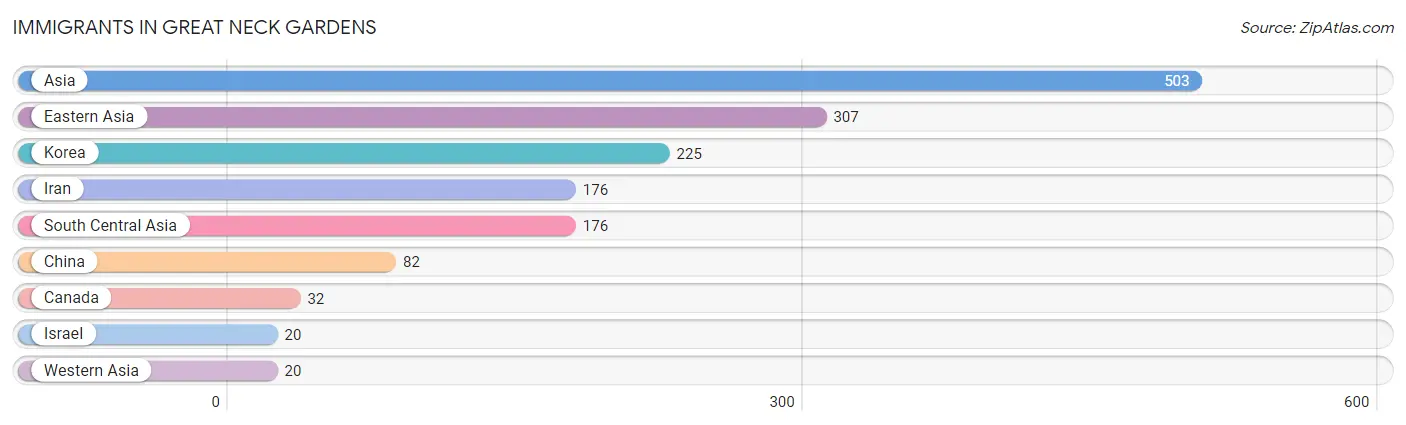
Immigrants in Great Neck Gardens
The most numerous immigrant groups reported in Great Neck Gardens came from Asia (503 | 44.2%), Eastern Asia (307 | 27.0%), Korea (225 | 19.8%), Iran (176 | 15.4%), and South Central Asia (176 | 15.4%), together accounting for 121.8% of all Great Neck Gardens residents.
| Immigration Origin | # Population | % Population |
| Asia | 503 | 44.2% |
| Canada | 32 | 2.8% |
| China | 82 | 7.2% |
| Eastern Asia | 307 | 27.0% |
| Iran | 176 | 15.4% |
| Israel | 20 | 1.8% |
| Korea | 225 | 19.8% |
| South Central Asia | 176 | 15.4% |
| Western Asia | 20 | 1.8% | View All 9 Rows |
Sex and Age in Great Neck Gardens
Sex and Age in Great Neck Gardens
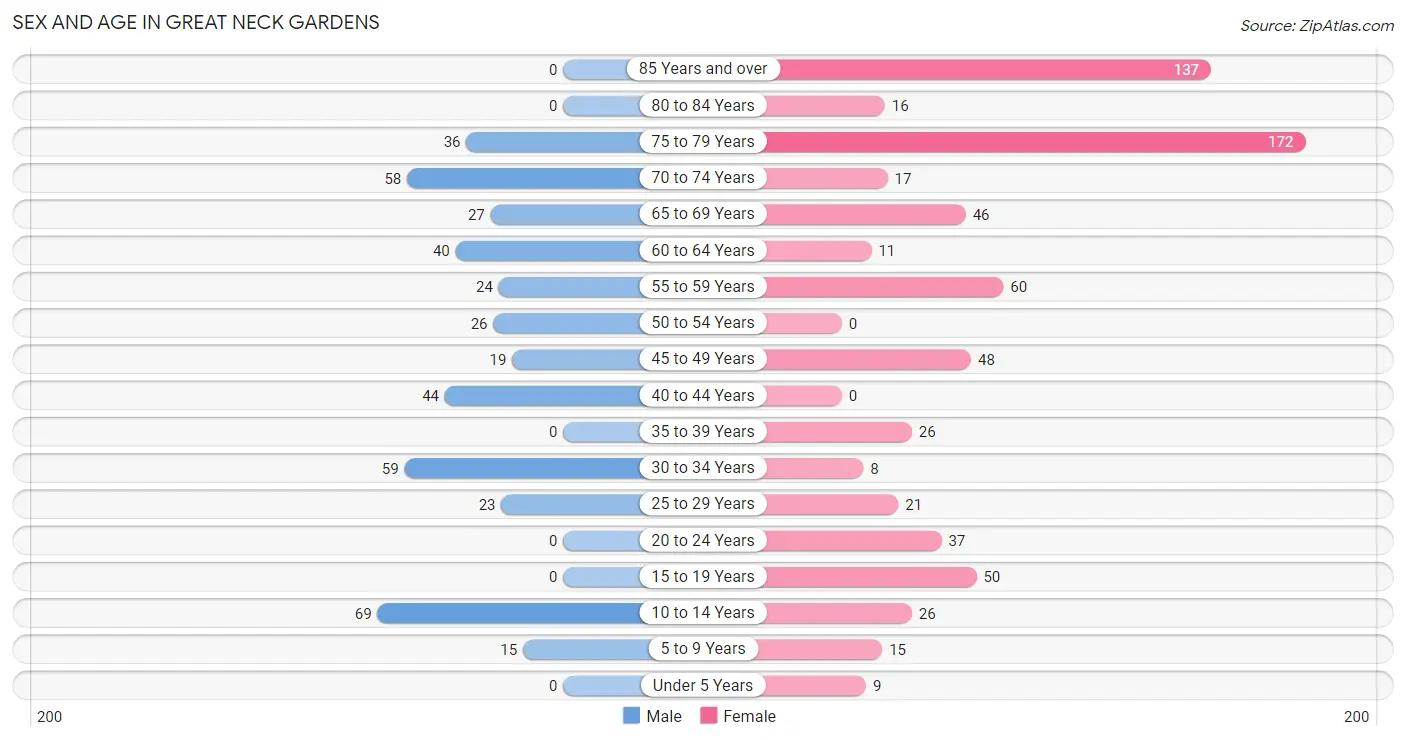
The most populous age groups in Great Neck Gardens are 10 to 14 Years (69 | 15.7%) for men and 75 to 79 Years (172 | 24.6%) for women.
| Age Bracket | Male | Female |
| Under 5 Years | 0 (0.0%) | 9 (1.3%) |
| 5 to 9 Years | 15 (3.4%) | 15 (2.1%) |
| 10 to 14 Years | 69 (15.7%) | 26 (3.7%) |
| 15 to 19 Years | 0 (0.0%) | 50 (7.1%) |
| 20 to 24 Years | 0 (0.0%) | 37 (5.3%) |
| 25 to 29 Years | 23 (5.2%) | 21 (3.0%) |
| 30 to 34 Years | 59 (13.4%) | 8 (1.1%) |
| 35 to 39 Years | 0 (0.0%) | 26 (3.7%) |
| 40 to 44 Years | 44 (10.0%) | 0 (0.0%) |
| 45 to 49 Years | 19 (4.3%) | 48 (6.9%) |
| 50 to 54 Years | 26 (5.9%) | 0 (0.0%) |
| 55 to 59 Years | 24 (5.4%) | 60 (8.6%) |
| 60 to 64 Years | 40 (9.1%) | 11 (1.6%) |
| 65 to 69 Years | 27 (6.1%) | 46 (6.6%) |
| 70 to 74 Years | 58 (13.2%) | 17 (2.4%) |
| 75 to 79 Years | 36 (8.2%) | 172 (24.6%) |
| 80 to 84 Years | 0 (0.0%) | 16 (2.3%) |
| 85 Years and over | 0 (0.0%) | 137 (19.6%) |
| Total | 440 (100.0%) | 699 (100.0%) |
Families and Households in Great Neck Gardens
Median Family Size in Great Neck Gardens
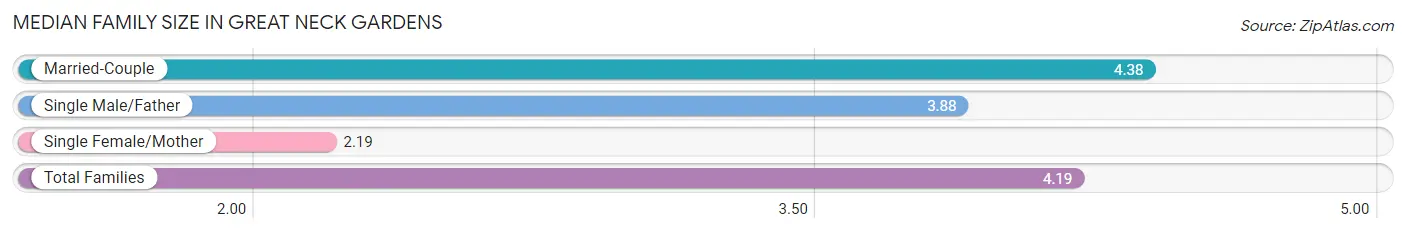
The median family size in Great Neck Gardens is 4.19 persons per family, with married-couple families (200 | 85.8%) accounting for the largest median family size of 4.38 persons per family. On the other hand, single female/mother families (16 | 6.9%) represent the smallest median family size with 2.19 persons per family.
| Family Type | # Families | Family Size |
| Married-Couple | 200 (85.8%) | 4.38 |
| Single Male/Father | 17 (7.3%) | 3.88 |
| Single Female/Mother | 16 (6.9%) | 2.19 |
| Total Families | 233 (100.0%) | 4.19 |
Median Household Size in Great Neck Gardens
| Household Type | # Households | Household Size |
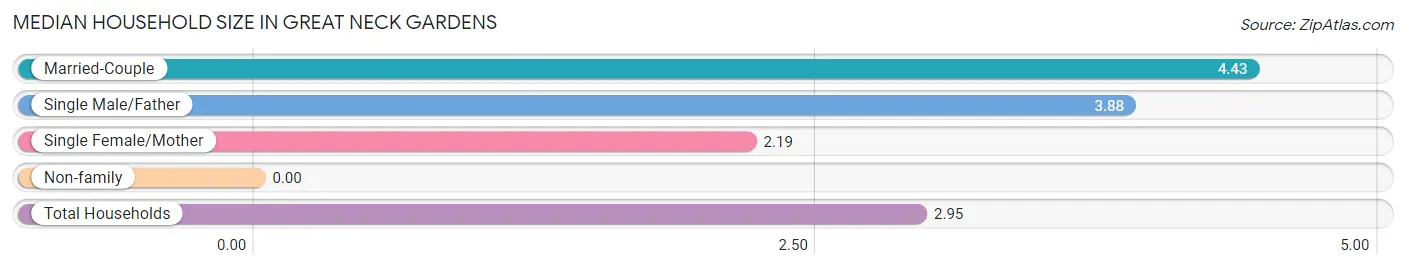
| Married-Couple | 200 (51.8%) | 4.43 |
| Single Male/Father | 17 (4.4%) | 3.88 |
| Single Female/Mother | 16 (4.2%) | 2.19 |
| Non-family | 153 (39.6%) | - |
| Total Households | 386 (100.0%) | 2.95 |
Household Size by Marriage Status in Great Neck Gardens
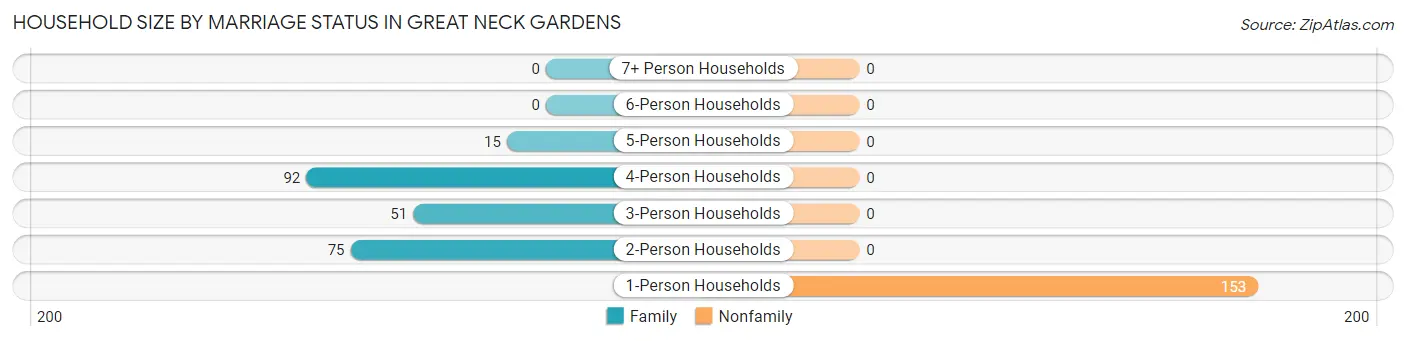
Out of a total of 386 households in Great Neck Gardens, 233 (60.4%) are family households, while 153 (39.6%) are nonfamily households. The most numerous type of family households are 4-person households, comprising 92, and the most common type of nonfamily households are 1-person households, comprising 153.
| Household Size | Family Households | Nonfamily Households |
| 1-Person Households | - | 153 (39.6%) |
| 2-Person Households | 75 (19.4%) | 0 (0.0%) |
| 3-Person Households | 51 (13.2%) | 0 (0.0%) |
| 4-Person Households | 92 (23.8%) | 0 (0.0%) |
| 5-Person Households | 15 (3.9%) | 0 (0.0%) |
| 6-Person Households | 0 (0.0%) | 0 (0.0%) |
| 7+ Person Households | 0 (0.0%) | 0 (0.0%) |
| Total | 233 (60.4%) | 153 (39.6%) |
Female Fertility in Great Neck Gardens
Fertility by Age in Great Neck Gardens
Average fertility rate in Great Neck Gardens is 42.0 births per 1,000 women. Women in the age bracket of 20 to 34 years have the highest fertility rate with 121.0 births per 1,000 women. Women in the age bracket of 20 to 34 years acount for 100.0% of all women with births.
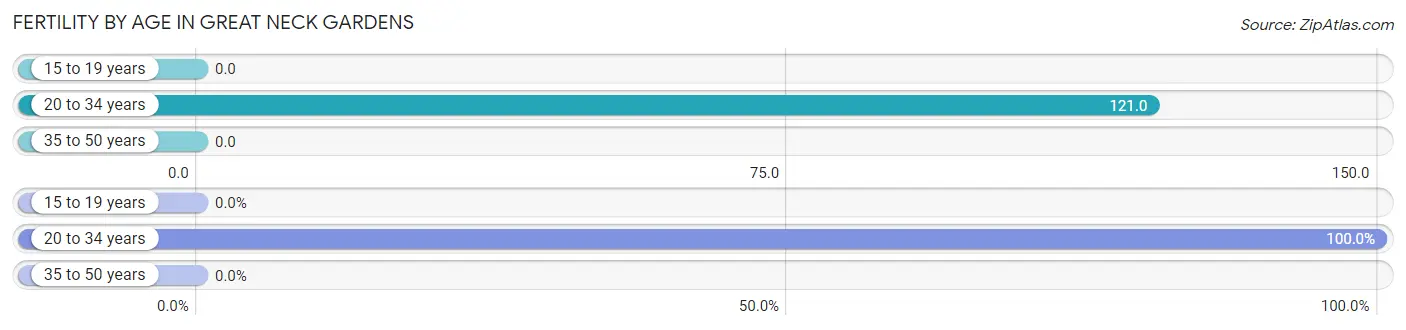
| Age Bracket | Women with Births | Births / 1,000 Women |
| 15 to 19 years | 0 (0.0%) | 0.0 |
| 20 to 34 years | 8 (100.0%) | 121.0 |
| 35 to 50 years | 0 (0.0%) | 0.0 |
| Total | 8 (100.0%) | 42.0 |
Fertility by Age by Marriage Status in Great Neck Gardens
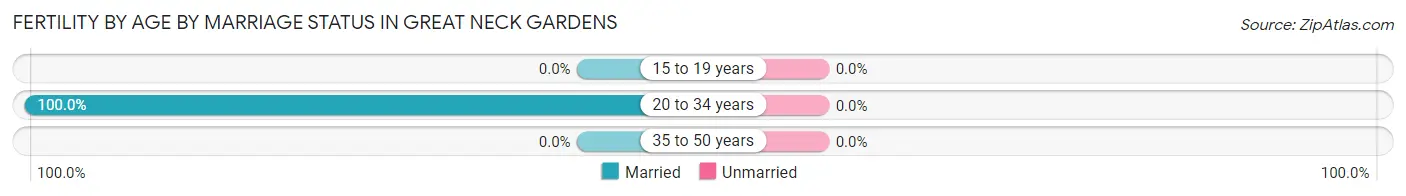
| Age Bracket | Married | Unmarried |
| 15 to 19 years | 0 (0.0%) | 0 (0.0%) |
| 20 to 34 years | 8 (100.0%) | 0 (0.0%) |
| 35 to 50 years | 0 (0.0%) | 0 (0.0%) |
| Total | 8 (100.0%) | 0 (0.0%) |
Fertility by Education in Great Neck Gardens
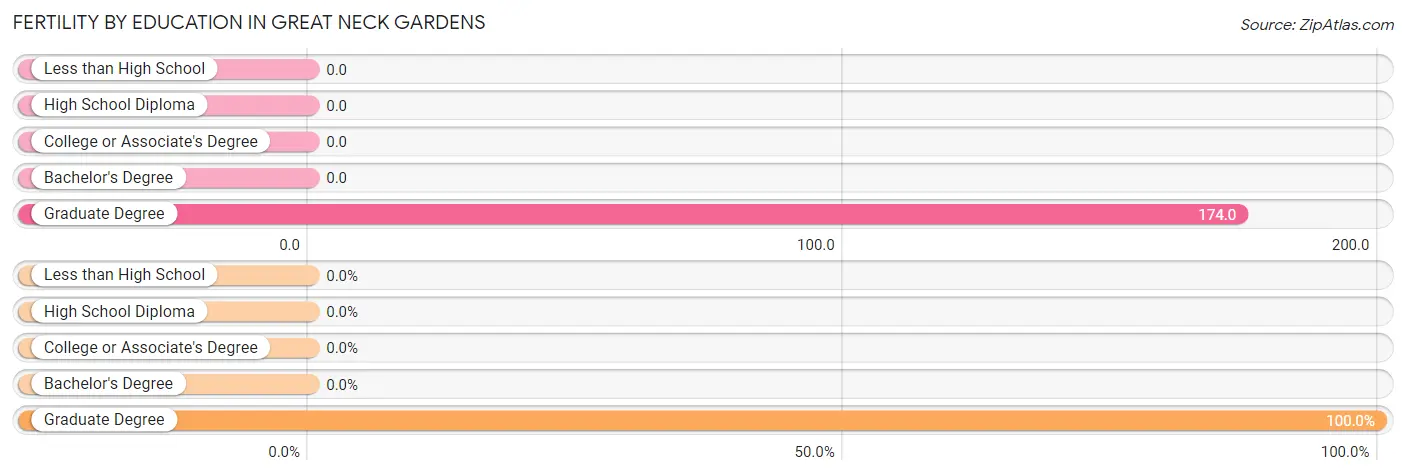
| Educational Attainment | Women with Births | Births / 1,000 Women |
| Less than High School | 0 (0.0%) | 0.0 |
| High School Diploma | 0 (0.0%) | 0.0 |
| College or Associate's Degree | 0 (0.0%) | 0.0 |
| Bachelor's Degree | 0 (0.0%) | 0.0 |
| Graduate Degree | 8 (100.0%) | 174.0 |
| Total | 8 (100.0%) | 42.0 |
Fertility by Education by Marriage Status in Great Neck Gardens
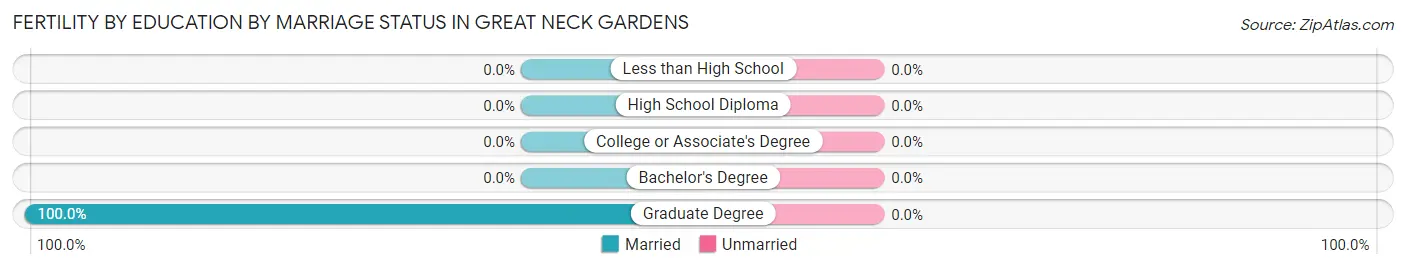
| Educational Attainment | Married | Unmarried |
| Less than High School | 0 (0.0%) | 0 (0.0%) |
| High School Diploma | 0 (0.0%) | 0 (0.0%) |
| College or Associate's Degree | 0 (0.0%) | 0 (0.0%) |
| Bachelor's Degree | 0 (0.0%) | 0 (0.0%) |
| Graduate Degree | 8 (100.0%) | 0 (0.0%) |
| Total | 8 (100.0%) | 0 (0.0%) |
Income in Great Neck Gardens
Income Overview in Great Neck Gardens
| Characteristic | Number | Measure |
| Per Capita Income | 1,139 | $77,915 |
| Median Family Income | 233 | $222,159 |
| Mean Family Income | 233 | $244,194 |
| Median Household Income | 386 | $0 |
| Mean Household Income | 386 | $156,232 |
| Income Deficit | 233 | $0 |
| Wage / Income Gap (%) | 1,139 | 0.00% |
| Wage / Income Gap ($) | 1,139 | 100.00¢ per $1 |
| Gini / Inequality Index | 1,139 | 0.60 |
Earnings by Sex in Great Neck Gardens
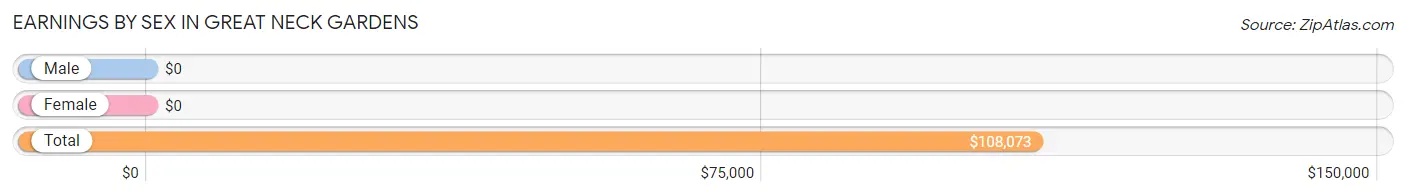
| Sex | Number | Average Earnings |
| Male | 258 (38.5%) | $0 |
| Female | 413 (61.6%) | $0 |
| Total | 671 (100.0%) | $108,073 |
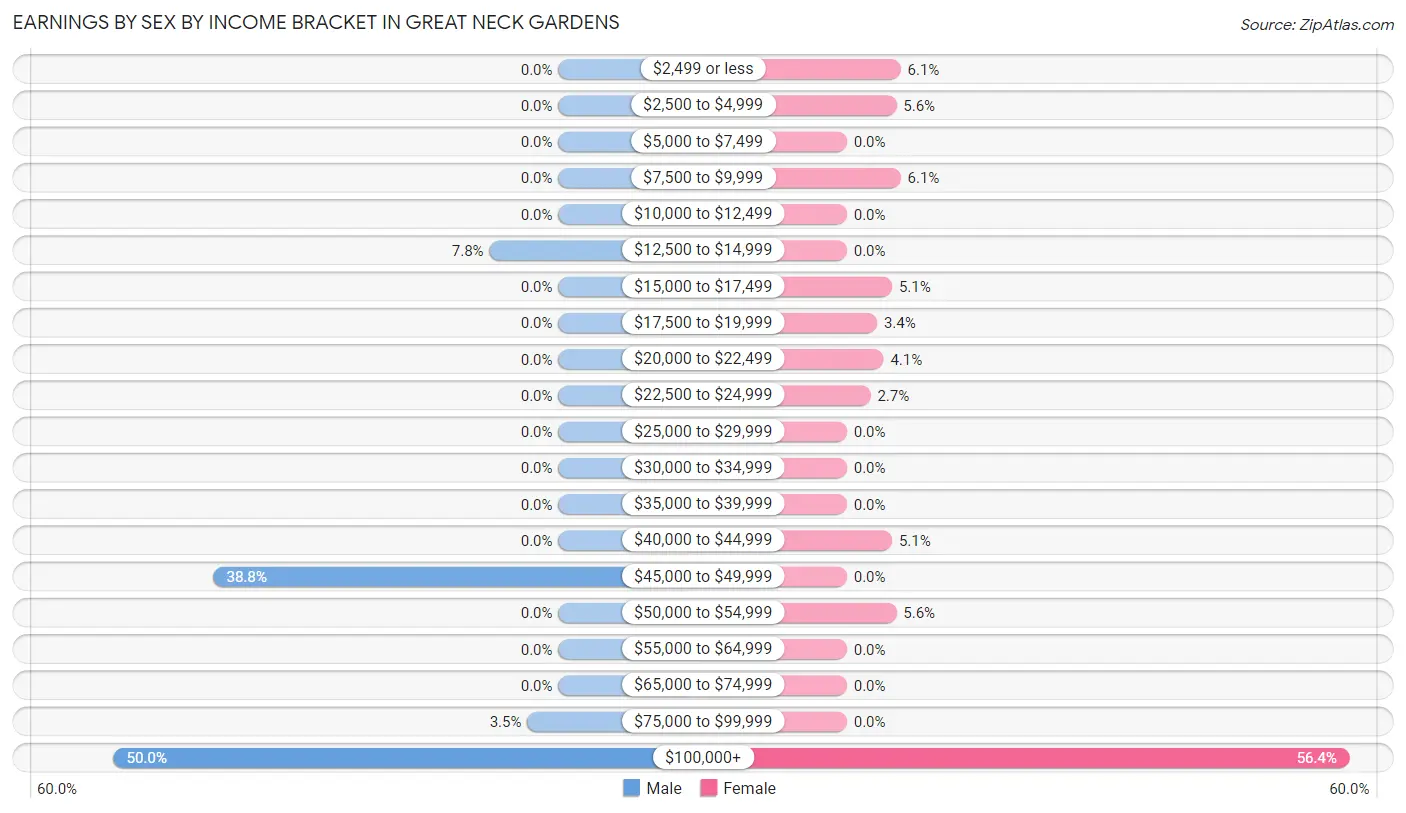
Earnings by Sex by Income Bracket in Great Neck Gardens
The most common earnings brackets in Great Neck Gardens are $100,000+ for men (129 | 50.0%) and $100,000+ for women (233 | 56.4%).
| Income | Male | Female |
| $2,499 or less | 0 (0.0%) | 25 (6.0%) |
| $2,500 to $4,999 | 0 (0.0%) | 23 (5.6%) |
| $5,000 to $7,499 | 0 (0.0%) | 0 (0.0%) |
| $7,500 to $9,999 | 0 (0.0%) | 25 (6.0%) |
| $10,000 to $12,499 | 0 (0.0%) | 0 (0.0%) |
| $12,500 to $14,999 | 20 (7.7%) | 0 (0.0%) |
| $15,000 to $17,499 | 0 (0.0%) | 21 (5.1%) |
| $17,500 to $19,999 | 0 (0.0%) | 14 (3.4%) |
| $20,000 to $22,499 | 0 (0.0%) | 17 (4.1%) |
| $22,500 to $24,999 | 0 (0.0%) | 11 (2.7%) |
| $25,000 to $29,999 | 0 (0.0%) | 0 (0.0%) |
| $30,000 to $34,999 | 0 (0.0%) | 0 (0.0%) |
| $35,000 to $39,999 | 0 (0.0%) | 0 (0.0%) |
| $40,000 to $44,999 | 0 (0.0%) | 21 (5.1%) |
| $45,000 to $49,999 | 100 (38.8%) | 0 (0.0%) |
| $50,000 to $54,999 | 0 (0.0%) | 23 (5.6%) |
| $55,000 to $64,999 | 0 (0.0%) | 0 (0.0%) |
| $65,000 to $74,999 | 0 (0.0%) | 0 (0.0%) |
| $75,000 to $99,999 | 9 (3.5%) | 0 (0.0%) |
| $100,000+ | 129 (50.0%) | 233 (56.4%) |
| Total | 258 (100.0%) | 413 (100.0%) |
Earnings by Sex by Educational Attainment in Great Neck Gardens
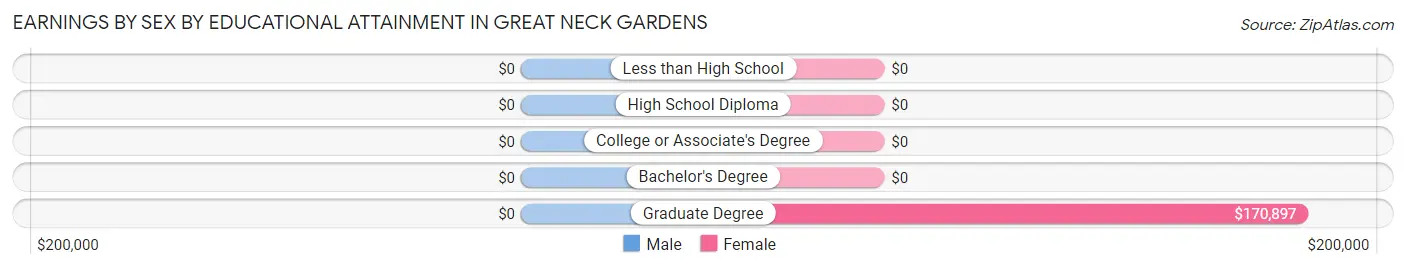
| Educational Attainment | Male Income | Female Income |
| Less than High School | - | - |
| High School Diploma | - | - |
| College or Associate's Degree | - | - |
| Bachelor's Degree | - | - |
| Graduate Degree | - | - |
| Total | - | - |
Family Income in Great Neck Gardens
Family Income Brackets in Great Neck Gardens
According to the Great Neck Gardens family income data, there are 126 families falling into the $200,000+ income range, which is the most common income bracket and makes up 54.1% of all families.
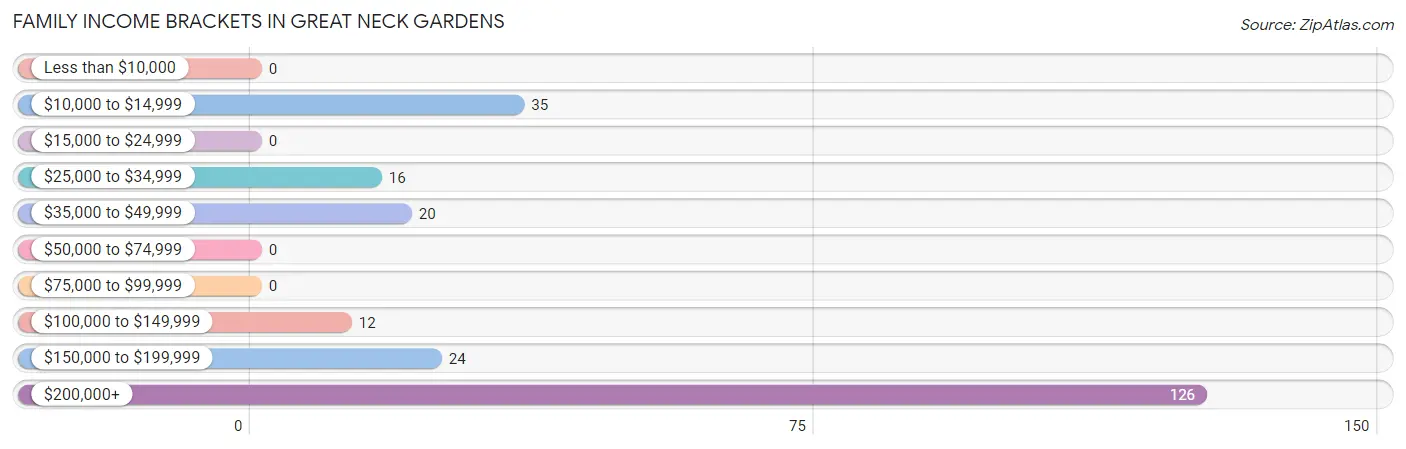
| Income Bracket | # Families | % Families |
| Less than $10,000 | 0 | 0.0% |
| $10,000 to $14,999 | 35 | 15.0% |
| $15,000 to $24,999 | 0 | 0.0% |
| $25,000 to $34,999 | 16 | 6.9% |
| $35,000 to $49,999 | 20 | 8.6% |
| $50,000 to $74,999 | 0 | 0.0% |
| $75,000 to $99,999 | 0 | 0.0% |
| $100,000 to $149,999 | 12 | 5.2% |
| $150,000 to $199,999 | 24 | 10.3% |
| $200,000+ | 126 | 54.1% |
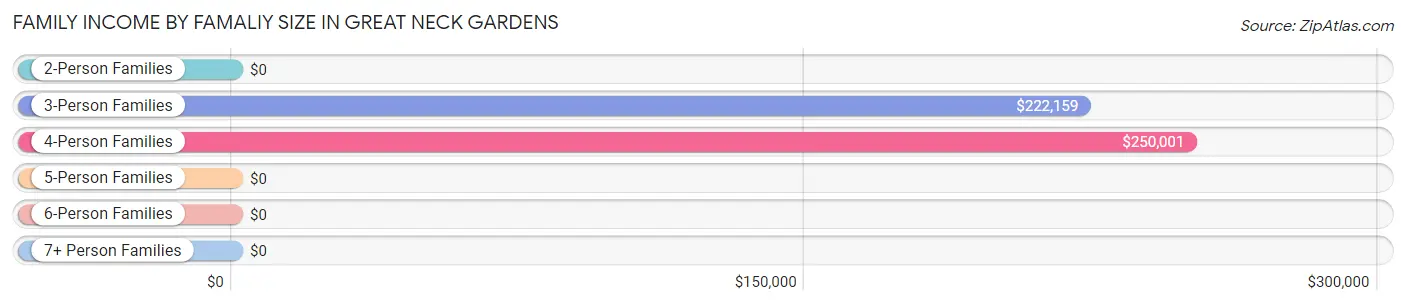
Family Income by Famaliy Size in Great Neck Gardens
4-person families (84 | 36.0%) account for the highest median family income in Great Neck Gardens with $250,001 per family, while 3-person families (59 | 25.3%) have the highest median income of $74,053 per family member.
| Income Bracket | # Families | Median Income |
| 2-Person Families | 75 (32.2%) | $0 |
| 3-Person Families | 59 (25.3%) | $222,159 |
| 4-Person Families | 84 (36.0%) | $250,001 |
| 5-Person Families | 15 (6.4%) | $0 |
| 6-Person Families | 0 (0.0%) | $0 |
| 7+ Person Families | 0 (0.0%) | $0 |
| Total | 233 (100.0%) | $222,159 |
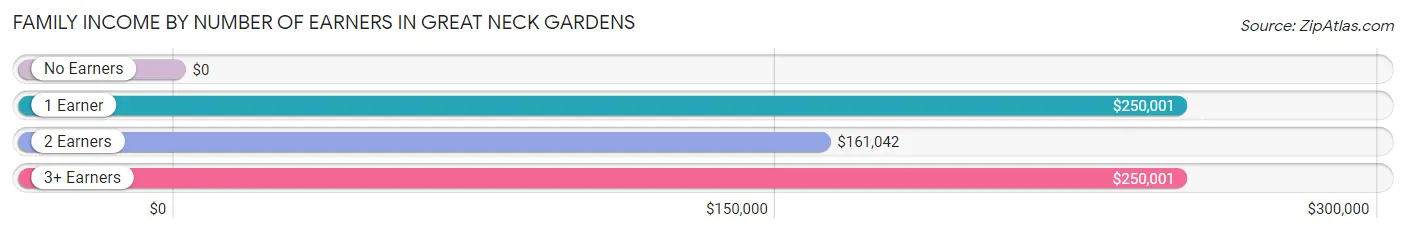
Family Income by Number of Earners in Great Neck Gardens
| Number of Earners | # Families | Median Income |
| No Earners | 51 (21.9%) | $0 |
| 1 Earner | 52 (22.3%) | $250,001 |
| 2 Earners | 44 (18.9%) | $161,042 |
| 3+ Earners | 86 (36.9%) | $250,001 |
| Total | 233 (100.0%) | $222,159 |
Household Income in Great Neck Gardens
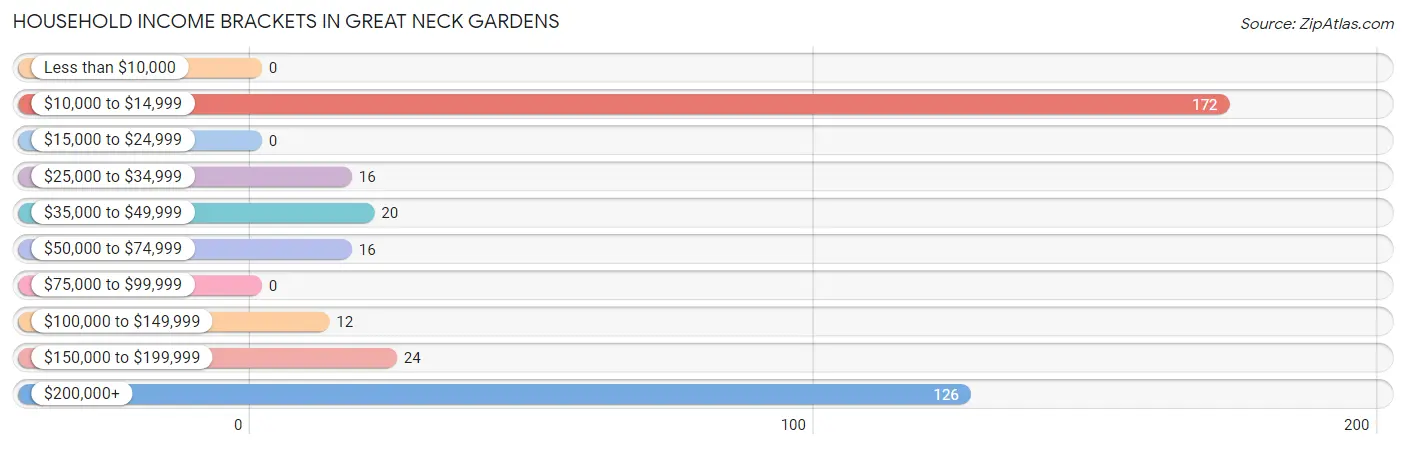
Household Income Brackets in Great Neck Gardens
With 172 households falling in the category, the $10,000 to $14,999 income range is the most frequent in Great Neck Gardens, accounting for 44.6% of all households.
| Income Bracket | # Households | % Households |
| Less than $10,000 | 0 | 0.0% |
| $10,000 to $14,999 | 172 | 44.6% |
| $15,000 to $24,999 | 0 | 0.0% |
| $25,000 to $34,999 | 16 | 4.1% |
| $35,000 to $49,999 | 20 | 5.2% |
| $50,000 to $74,999 | 16 | 4.1% |
| $75,000 to $99,999 | 0 | 0.0% |
| $100,000 to $149,999 | 12 | 3.1% |
| $150,000 to $199,999 | 24 | 6.2% |
| $200,000+ | 126 | 32.6% |
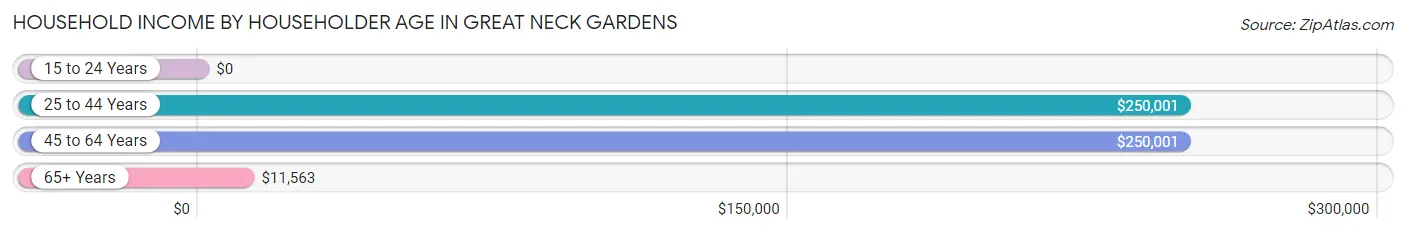
Household Income by Householder Age in Great Neck Gardens
The median household income in Great Neck Gardens is $0, with the highest median household income of $250,001 found in the 25 to 44 years age bracket for the primary householder. A total of 52 households (13.5%) fall into this category.
| Income Bracket | # Households | Median Income |
| 15 to 24 Years | 0 (0.0%) | $0 |
| 25 to 44 Years | 52 (13.5%) | $250,001 |
| 45 to 64 Years | 119 (30.8%) | $250,001 |
| 65+ Years | 215 (55.7%) | $11,563 |
| Total | 386 (100.0%) | $0 |
Poverty in Great Neck Gardens
Income Below Poverty by Sex and Age in Great Neck Gardens
With 8.2% poverty level for males and 24.6% for females among the residents of Great Neck Gardens, 75 year old and over males and 65 to 74 year old females are the most vulnerable to poverty, with 36 males (100.0%) and 35 females (55.6%) in their respective age groups living below the poverty level.
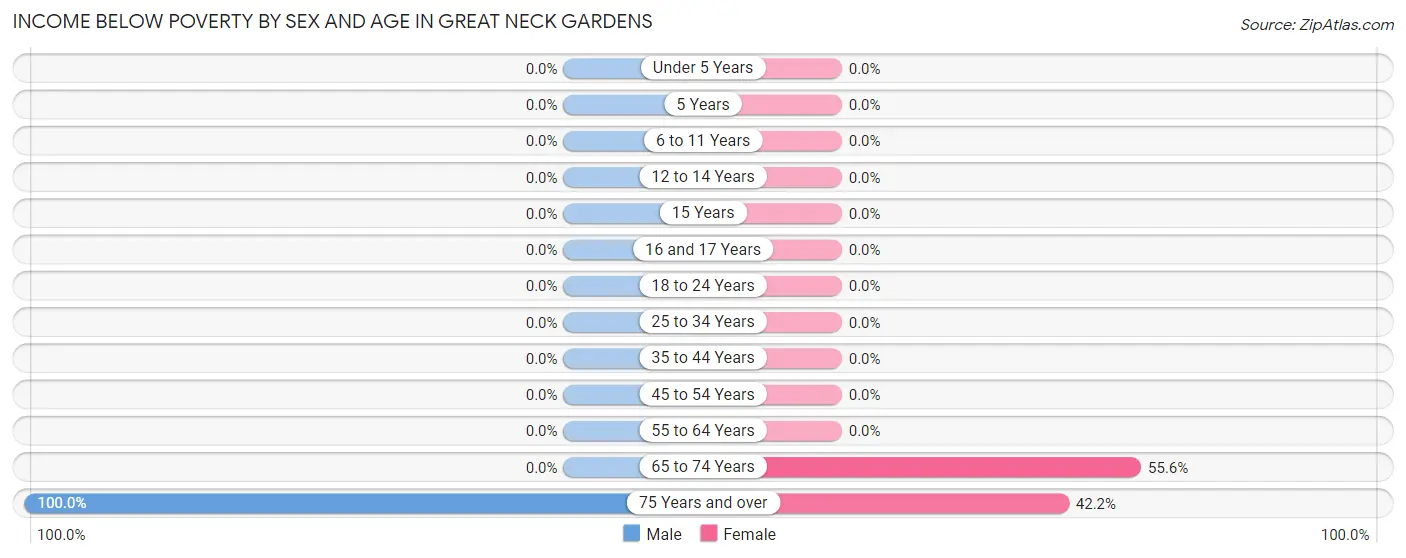
| Age Bracket | Male | Female |
| Under 5 Years | 0 (0.0%) | 0 (0.0%) |
| 5 Years | 0 (0.0%) | 0 (0.0%) |
| 6 to 11 Years | 0 (0.0%) | 0 (0.0%) |
| 12 to 14 Years | 0 (0.0%) | 0 (0.0%) |
| 15 Years | 0 (0.0%) | 0 (0.0%) |
| 16 and 17 Years | 0 (0.0%) | 0 (0.0%) |
| 18 to 24 Years | 0 (0.0%) | 0 (0.0%) |
| 25 to 34 Years | 0 (0.0%) | 0 (0.0%) |
| 35 to 44 Years | 0 (0.0%) | 0 (0.0%) |
| 45 to 54 Years | 0 (0.0%) | 0 (0.0%) |
| 55 to 64 Years | 0 (0.0%) | 0 (0.0%) |
| 65 to 74 Years | 0 (0.0%) | 35 (55.6%) |
| 75 Years and over | 36 (100.0%) | 137 (42.1%) |
| Total | 36 (8.2%) | 172 (24.6%) |
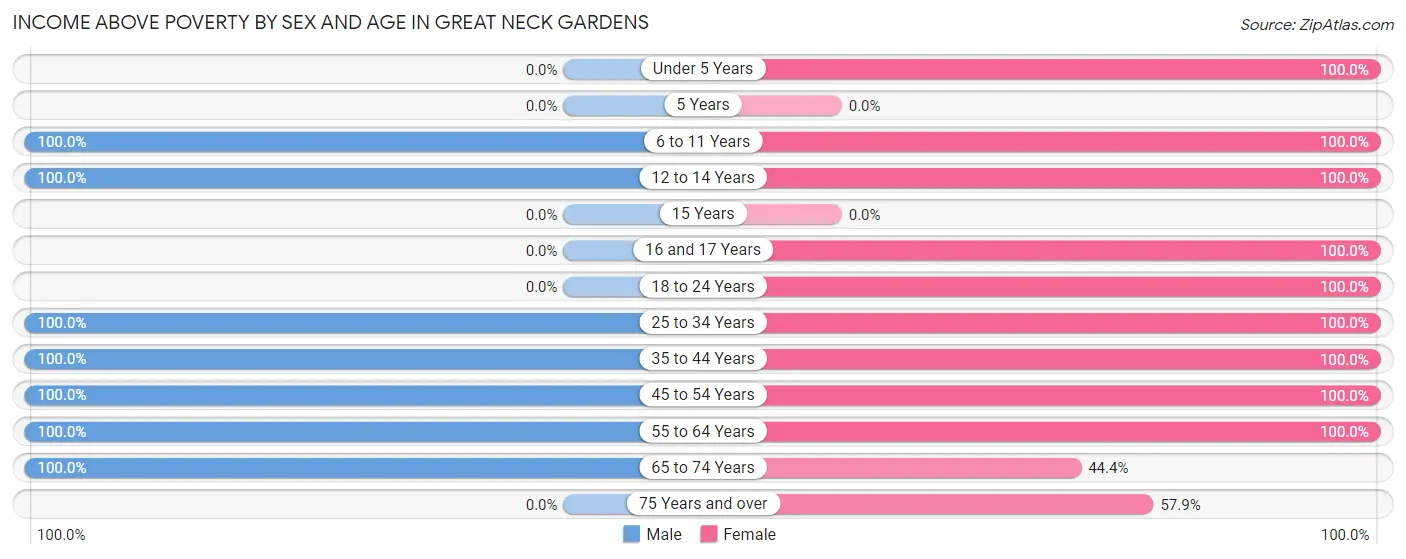
Income Above Poverty by Sex and Age in Great Neck Gardens
According to the poverty statistics in Great Neck Gardens, males aged 6 to 11 years and females aged under 5 years are the age groups that are most secure financially, with 100.0% of males and 100.0% of females in these age groups living above the poverty line.
| Age Bracket | Male | Female |
| Under 5 Years | 0 (0.0%) | 9 (100.0%) |
| 5 Years | 0 (0.0%) | 0 (0.0%) |
| 6 to 11 Years | 44 (100.0%) | 26 (100.0%) |
| 12 to 14 Years | 40 (100.0%) | 15 (100.0%) |
| 15 Years | 0 (0.0%) | 0 (0.0%) |
| 16 and 17 Years | 0 (0.0%) | 25 (100.0%) |
| 18 to 24 Years | 0 (0.0%) | 62 (100.0%) |
| 25 to 34 Years | 82 (100.0%) | 29 (100.0%) |
| 35 to 44 Years | 44 (100.0%) | 26 (100.0%) |
| 45 to 54 Years | 45 (100.0%) | 48 (100.0%) |
| 55 to 64 Years | 64 (100.0%) | 71 (100.0%) |
| 65 to 74 Years | 85 (100.0%) | 28 (44.4%) |
| 75 Years and over | 0 (0.0%) | 188 (57.9%) |
| Total | 404 (91.8%) | 527 (75.4%) |
Income Below Poverty Among Married-Couple Families in Great Neck Gardens
The poverty statistics for married-couple families in Great Neck Gardens show that 17.5% or 35 of the total 200 families live below the poverty line. Families with no children have the highest poverty rate of 25.4%, comprising of 35 families. On the other hand, families with 1 or 2 children have the lowest poverty rate of 0.0%, which includes 0 families.
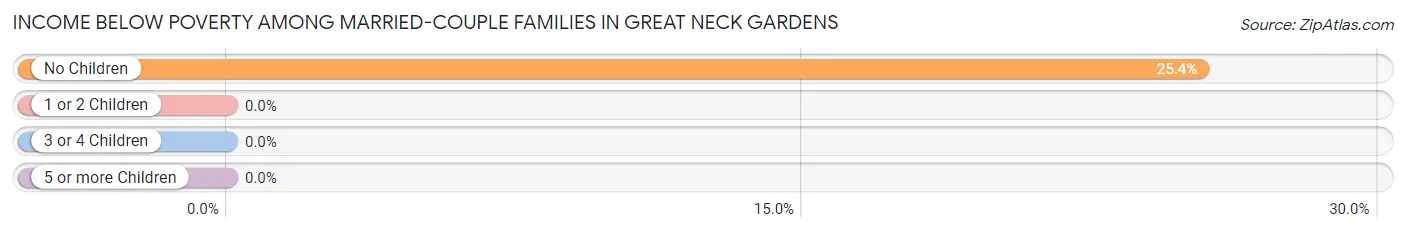
| Children | Above Poverty | Below Poverty |
| No Children | 103 (74.6%) | 35 (25.4%) |
| 1 or 2 Children | 47 (100.0%) | 0 (0.0%) |
| 3 or 4 Children | 15 (100.0%) | 0 (0.0%) |
| 5 or more Children | 0 (0.0%) | 0 (0.0%) |
| Total | 165 (82.5%) | 35 (17.5%) |
Income Below Poverty Among Single-Parent Households in Great Neck Gardens
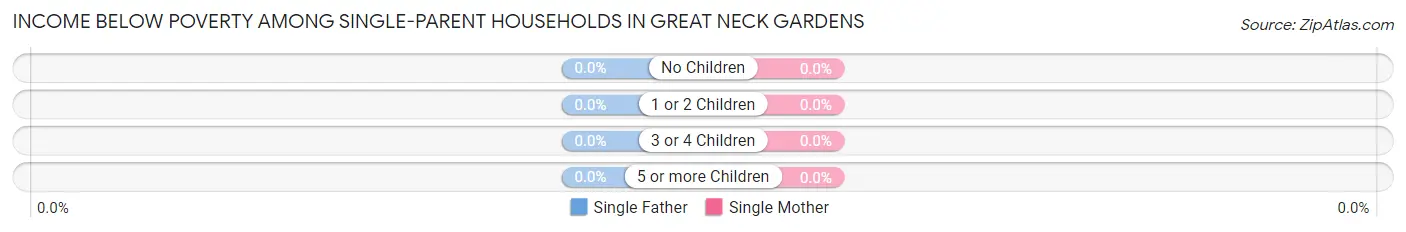
| Children | Single Father | Single Mother |
| No Children | 0 (0.0%) | 0 (0.0%) |
| 1 or 2 Children | 0 (0.0%) | 0 (0.0%) |
| 3 or 4 Children | 0 (0.0%) | 0 (0.0%) |
| 5 or more Children | 0 (0.0%) | 0 (0.0%) |
| Total | 0 (0.0%) | 0 (0.0%) |
Income Below Poverty Among Married-Couple vs Single-Parent Households in Great Neck Gardens
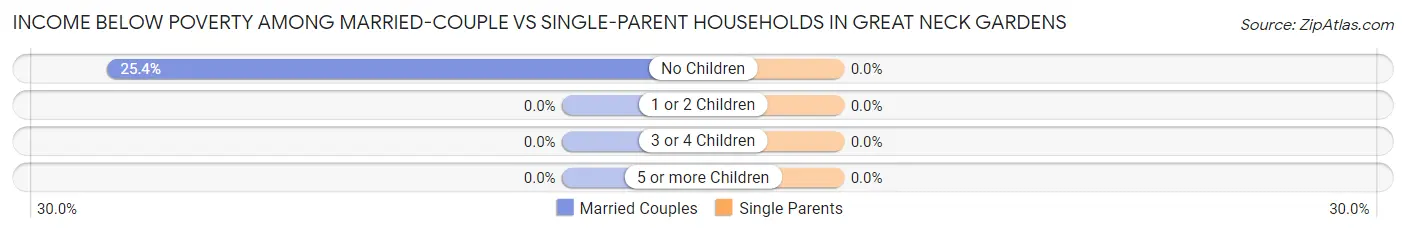
| Children | Married-Couple Families | Single-Parent Households |
| No Children | 35 (25.4%) | 0 (0.0%) |
| 1 or 2 Children | 0 (0.0%) | 0 (0.0%) |
| 3 or 4 Children | 0 (0.0%) | 0 (0.0%) |
| 5 or more Children | 0 (0.0%) | 0 (0.0%) |
| Total | 35 (17.5%) | 0 (0.0%) |
Employment Characteristics in Great Neck Gardens
Employment by Class of Employer in Great Neck Gardens
Among the 623 employed individuals in Great Neck Gardens, private company employees (450 | 72.2%), self-employed (incorporated) (74 | 11.9%), and local government employees (52 | 8.4%) make up the most common classes of employment.
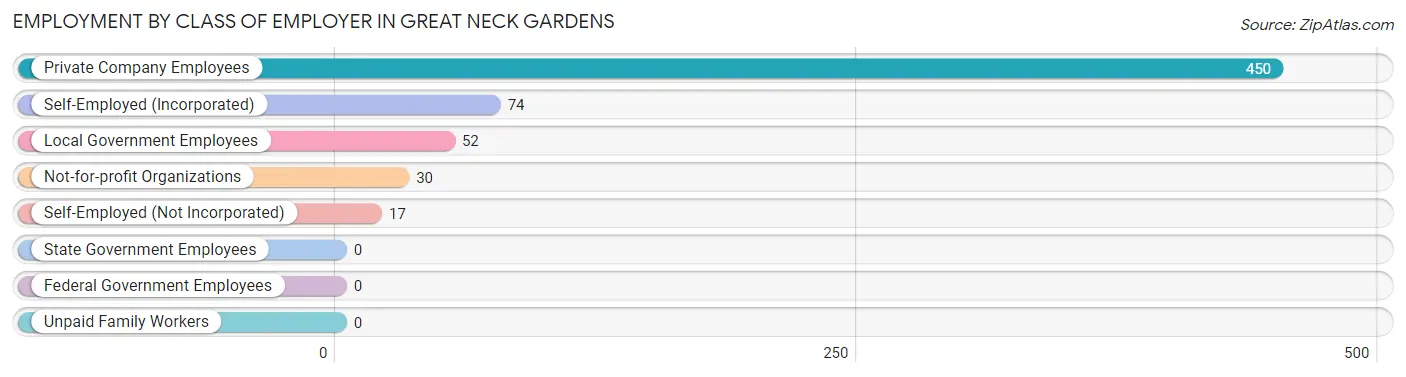
| Employer Class | # Employees | % Employees |
| Private Company Employees | 450 | 72.2% |
| Self-Employed (Incorporated) | 74 | 11.9% |
| Self-Employed (Not Incorporated) | 17 | 2.7% |
| Not-for-profit Organizations | 30 | 4.8% |
| Local Government Employees | 52 | 8.4% |
| State Government Employees | 0 | 0.0% |
| Federal Government Employees | 0 | 0.0% |
| Unpaid Family Workers | 0 | 0.0% |
| Total | 623 | 100.0% |
Employment Status by Age in Great Neck Gardens
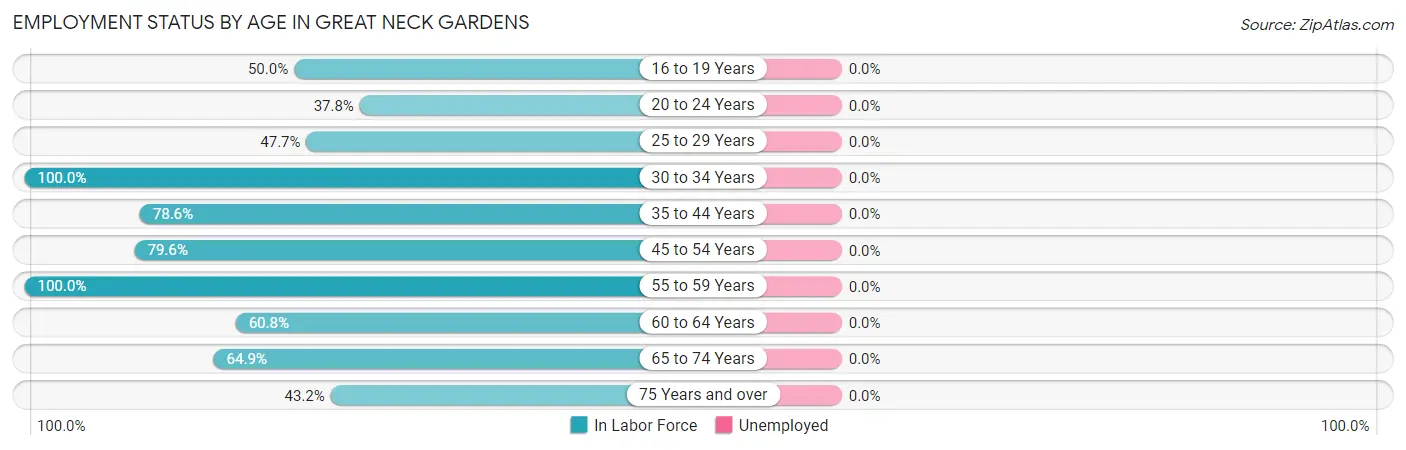
| Age Bracket | In Labor Force | Unemployed |
| 16 to 19 Years | 25 (50.0%) | 0 (0.0%) |
| 20 to 24 Years | 14 (37.8%) | 0 (0.0%) |
| 25 to 29 Years | 21 (47.7%) | 0 (0.0%) |
| 30 to 34 Years | 67 (100.0%) | 0 (0.0%) |
| 35 to 44 Years | 55 (78.6%) | 0 (0.0%) |
| 45 to 54 Years | 74 (79.6%) | 0 (0.0%) |
| 55 to 59 Years | 84 (100.0%) | 0 (0.0%) |
| 60 to 64 Years | 31 (60.8%) | 0 (0.0%) |
| 65 to 74 Years | 96 (64.9%) | 0 (0.0%) |
| 75 Years and over | 156 (43.2%) | 0 (0.0%) |
| Total | 623 (62.0%) | 0 (0.0%) |
Employment Status by Educational Attainment in Great Neck Gardens
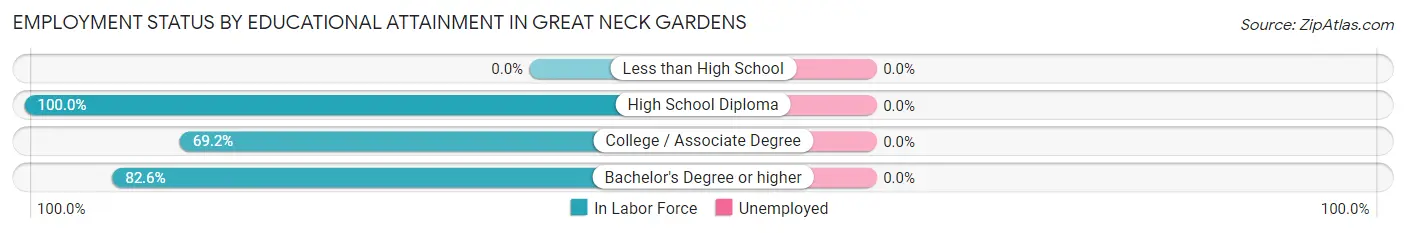
| Educational Attainment | In Labor Force | Unemployed |
| Less than High School | 0 (0.0%) | 0 (0.0%) |
| High School Diploma | 17 (100.0%) | 0 (0.0%) |
| College / Associate Degree | 45 (69.2%) | 0 (0.0%) |
| Bachelor's Degree or higher | 270 (82.6%) | 0 (0.0%) |
| Total | 332 (81.2%) | 0 (0.0%) |
Employment Occupations by Sex in Great Neck Gardens
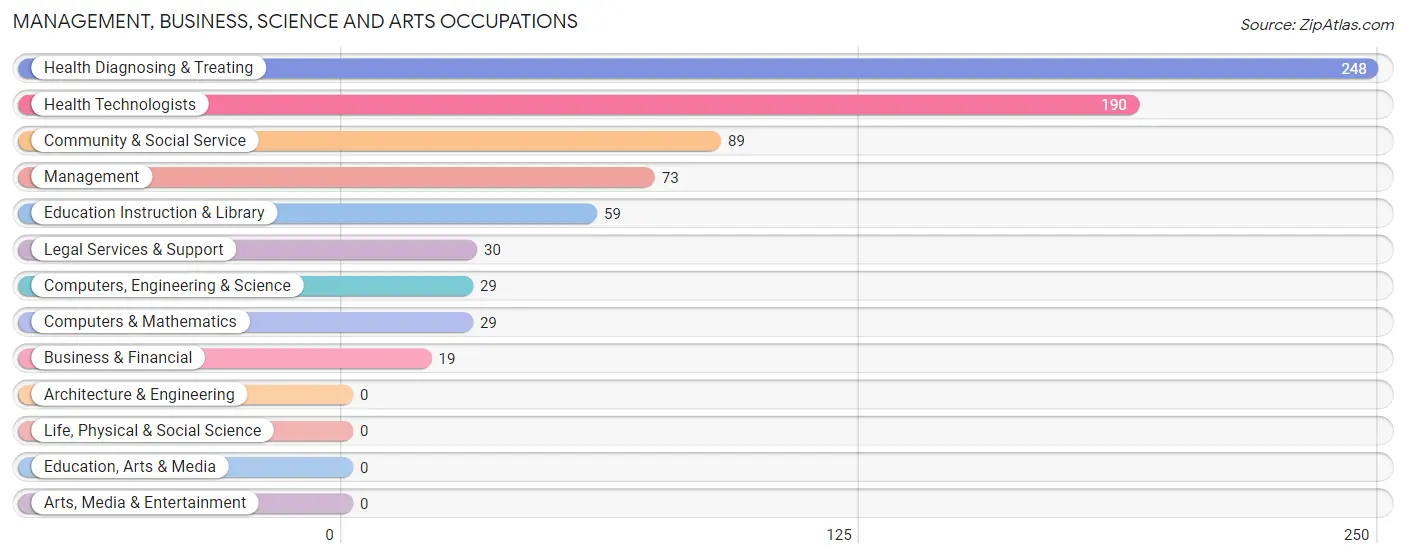
Management, Business, Science and Arts Occupations
The most common Management, Business, Science and Arts occupations in Great Neck Gardens are Health Diagnosing & Treating (248 | 39.8%), Health Technologists (190 | 30.5%), Community & Social Service (89 | 14.3%), Management (73 | 11.7%), and Education Instruction & Library (59 | 9.5%).
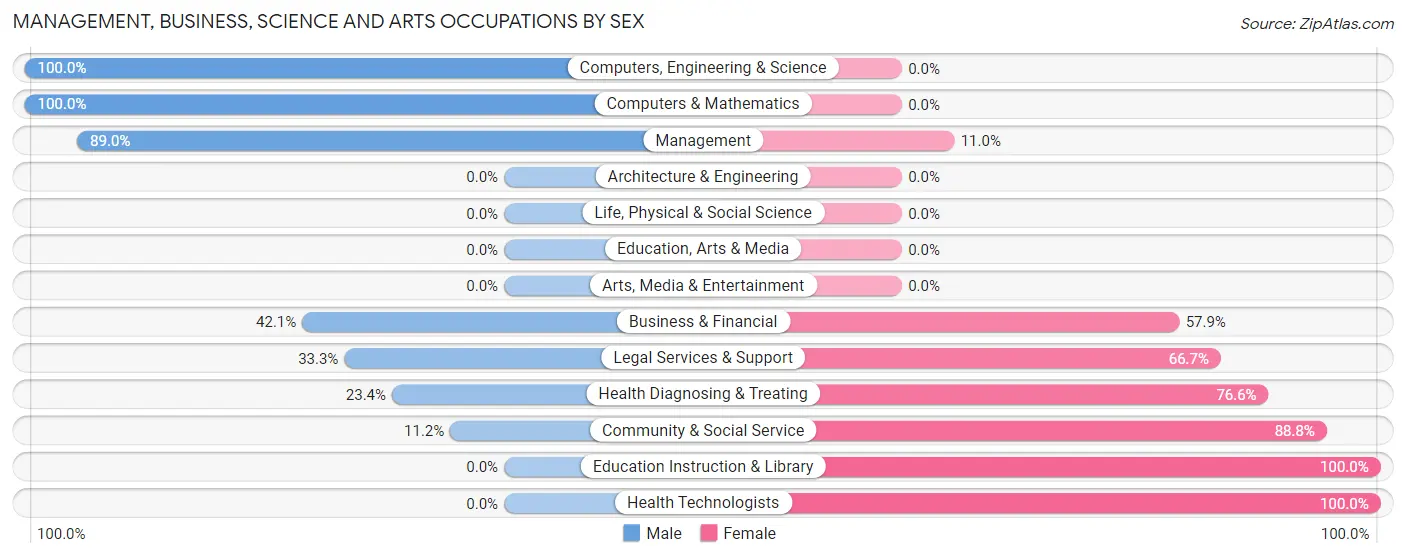
Management, Business, Science and Arts Occupations by Sex
Within the Management, Business, Science and Arts occupations in Great Neck Gardens, the most male-oriented occupations are Computers, Engineering & Science (100.0%), Computers & Mathematics (100.0%), and Management (89.0%), while the most female-oriented occupations are Education Instruction & Library (100.0%), Health Technologists (100.0%), and Community & Social Service (88.8%).
| Occupation | Male | Female |
| Management | 65 (89.0%) | 8 (11.0%) |
| Business & Financial | 8 (42.1%) | 11 (57.9%) |
| Computers, Engineering & Science | 29 (100.0%) | 0 (0.0%) |
| Computers & Mathematics | 29 (100.0%) | 0 (0.0%) |
| Architecture & Engineering | 0 (0.0%) | 0 (0.0%) |
| Life, Physical & Social Science | 0 (0.0%) | 0 (0.0%) |
| Community & Social Service | 10 (11.2%) | 79 (88.8%) |
| Education, Arts & Media | 0 (0.0%) | 0 (0.0%) |
| Legal Services & Support | 10 (33.3%) | 20 (66.7%) |
| Education Instruction & Library | 0 (0.0%) | 59 (100.0%) |
| Arts, Media & Entertainment | 0 (0.0%) | 0 (0.0%) |
| Health Diagnosing & Treating | 58 (23.4%) | 190 (76.6%) |
| Health Technologists | 0 (0.0%) | 190 (100.0%) |
| Total (Category) | 170 (37.1%) | 288 (62.9%) |
| Total (Overall) | 258 (41.4%) | 365 (58.6%) |
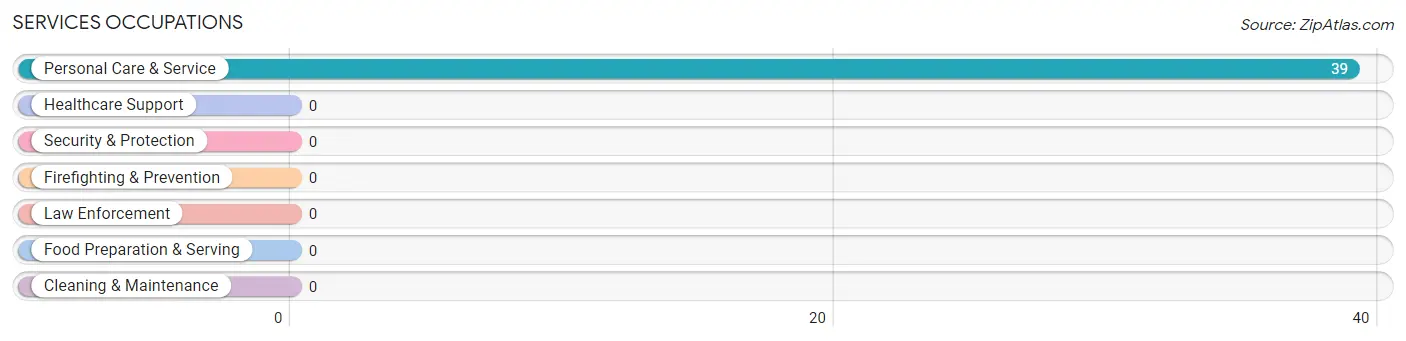
Services Occupations
The most common Services occupations in Great Neck Gardens are , and Personal Care & Service (39 | 6.3%).
Services Occupations by Sex
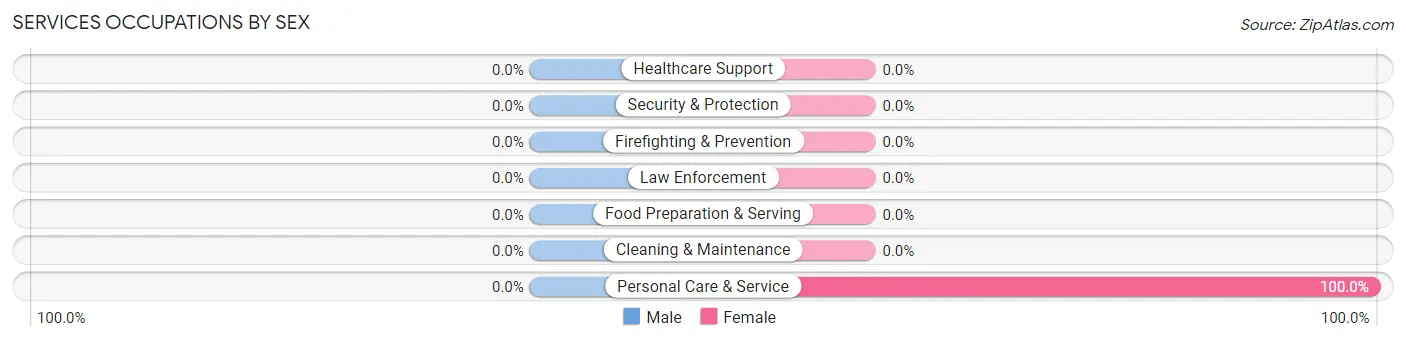
| Occupation | Male | Female |
| Healthcare Support | 0 (0.0%) | 0 (0.0%) |
| Security & Protection | 0 (0.0%) | 0 (0.0%) |
| Firefighting & Prevention | 0 (0.0%) | 0 (0.0%) |
| Law Enforcement | 0 (0.0%) | 0 (0.0%) |
| Food Preparation & Serving | 0 (0.0%) | 0 (0.0%) |
| Cleaning & Maintenance | 0 (0.0%) | 0 (0.0%) |
| Personal Care & Service | 0 (0.0%) | 39 (100.0%) |
| Total (Category) | 0 (0.0%) | 39 (100.0%) |
| Total (Overall) | 258 (41.4%) | 365 (58.6%) |
Sales and Office Occupations
The most common Sales and Office occupations in Great Neck Gardens are Office & Administration (80 | 12.8%), and Sales & Related (46 | 7.4%).
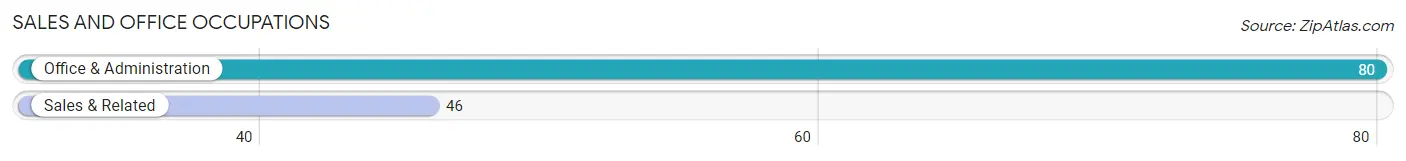
Sales and Office Occupations by Sex

| Occupation | Male | Female |
| Sales & Related | 46 (100.0%) | 0 (0.0%) |
| Office & Administration | 42 (52.5%) | 38 (47.5%) |
| Total (Category) | 88 (69.8%) | 38 (30.2%) |
| Total (Overall) | 258 (41.4%) | 365 (58.6%) |
Natural Resources, Construction and Maintenance Occupations
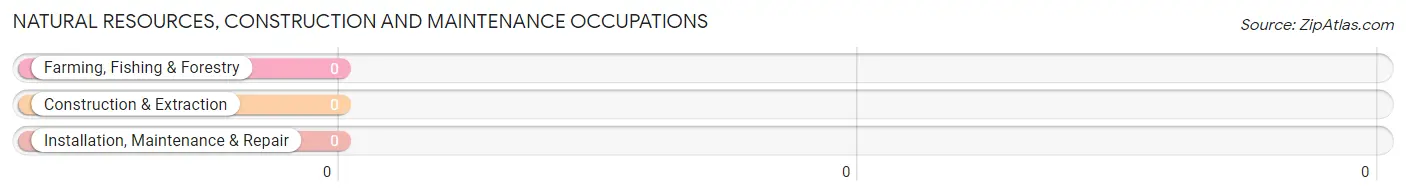
Natural Resources, Construction and Maintenance Occupations by Sex
| Occupation | Male | Female |
| Farming, Fishing & Forestry | 0 (0.0%) | 0 (0.0%) |
| Construction & Extraction | 0 (0.0%) | 0 (0.0%) |
| Installation, Maintenance & Repair | 0 (0.0%) | 0 (0.0%) |
| Total (Category) | 0 (0.0%) | 0 (0.0%) |
| Total (Overall) | 258 (41.4%) | 365 (58.6%) |
Production, Transportation and Moving Occupations
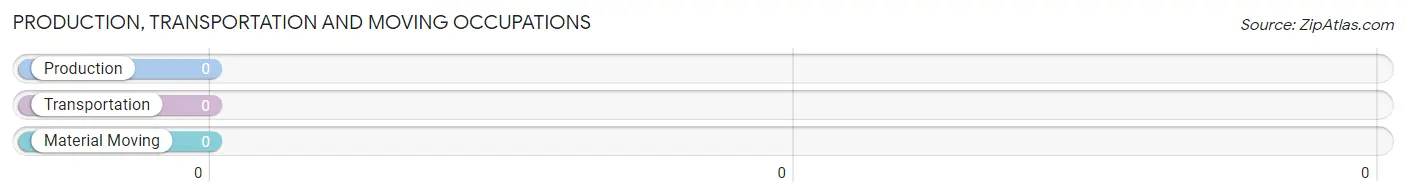
Production, Transportation and Moving Occupations by Sex
| Occupation | Male | Female |
| Production | 0 (0.0%) | 0 (0.0%) |
| Transportation | 0 (0.0%) | 0 (0.0%) |
| Material Moving | 0 (0.0%) | 0 (0.0%) |
| Total (Category) | 0 (0.0%) | 0 (0.0%) |
| Total (Overall) | 258 (41.4%) | 365 (58.6%) |
Employment Industries by Sex in Great Neck Gardens
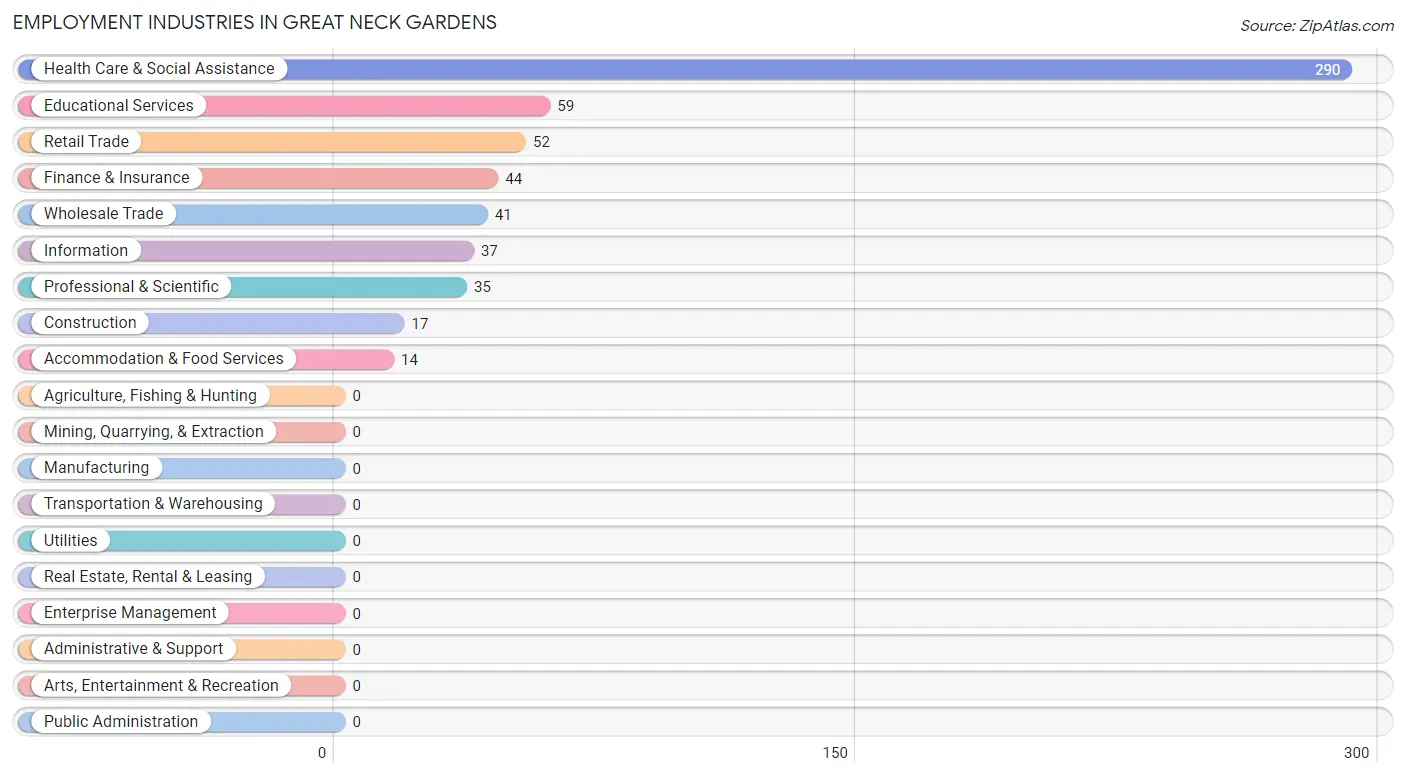
Employment Industries in Great Neck Gardens
The major employment industries in Great Neck Gardens include Health Care & Social Assistance (290 | 46.6%), Educational Services (59 | 9.5%), Retail Trade (52 | 8.4%), Finance & Insurance (44 | 7.1%), and Wholesale Trade (41 | 6.6%).
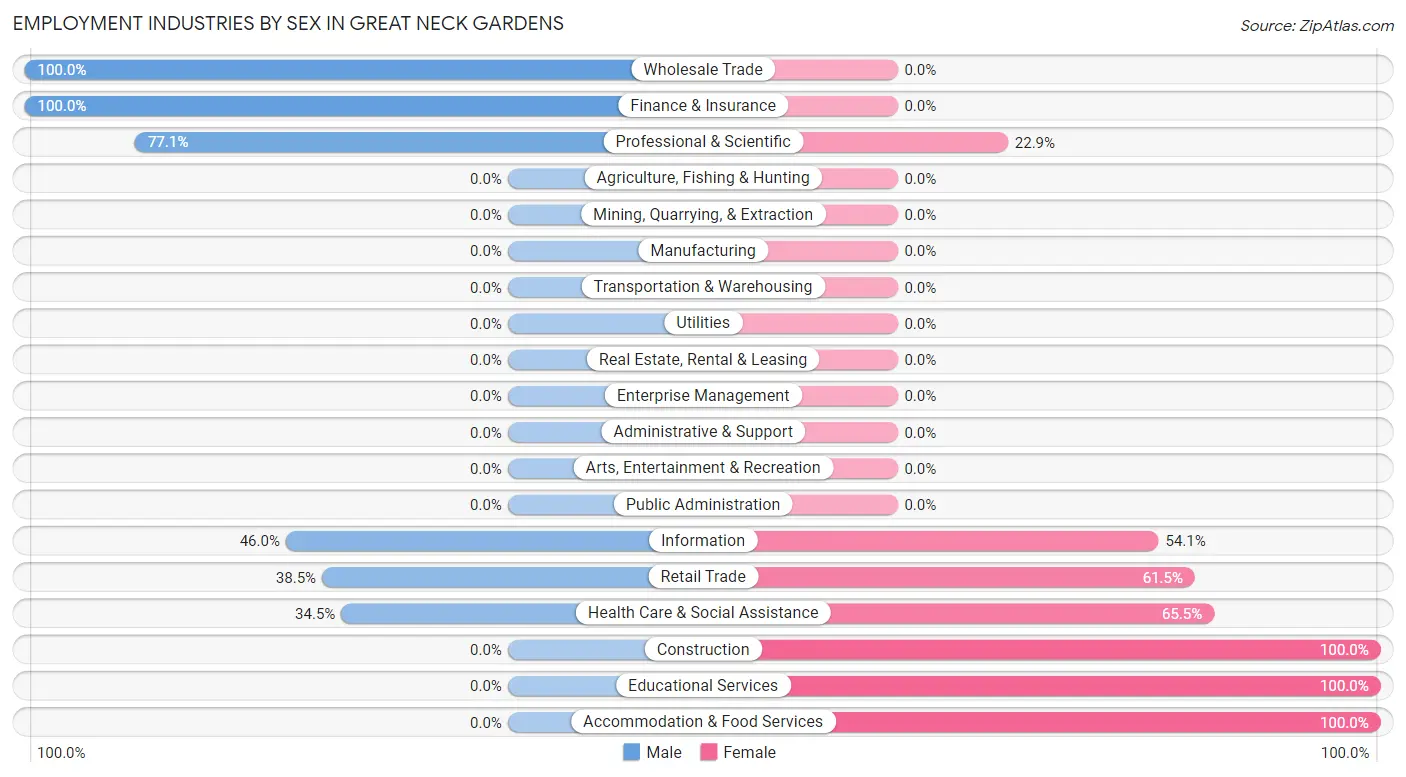
Employment Industries by Sex in Great Neck Gardens
The Great Neck Gardens industries that see more men than women are Wholesale Trade (100.0%), Finance & Insurance (100.0%), and Professional & Scientific (77.1%), whereas the industries that tend to have a higher number of women are Construction (100.0%), Educational Services (100.0%), and Accommodation & Food Services (100.0%).
| Industry | Male | Female |
| Agriculture, Fishing & Hunting | 0 (0.0%) | 0 (0.0%) |
| Mining, Quarrying, & Extraction | 0 (0.0%) | 0 (0.0%) |
| Construction | 0 (0.0%) | 17 (100.0%) |
| Manufacturing | 0 (0.0%) | 0 (0.0%) |
| Wholesale Trade | 41 (100.0%) | 0 (0.0%) |
| Retail Trade | 20 (38.5%) | 32 (61.5%) |
| Transportation & Warehousing | 0 (0.0%) | 0 (0.0%) |
| Utilities | 0 (0.0%) | 0 (0.0%) |
| Information | 17 (46.0%) | 20 (54.0%) |
| Finance & Insurance | 44 (100.0%) | 0 (0.0%) |
| Real Estate, Rental & Leasing | 0 (0.0%) | 0 (0.0%) |
| Professional & Scientific | 27 (77.1%) | 8 (22.9%) |
| Enterprise Management | 0 (0.0%) | 0 (0.0%) |
| Administrative & Support | 0 (0.0%) | 0 (0.0%) |
| Educational Services | 0 (0.0%) | 59 (100.0%) |
| Health Care & Social Assistance | 100 (34.5%) | 190 (65.5%) |
| Arts, Entertainment & Recreation | 0 (0.0%) | 0 (0.0%) |
| Accommodation & Food Services | 0 (0.0%) | 14 (100.0%) |
| Public Administration | 0 (0.0%) | 0 (0.0%) |
| Total | 258 (41.4%) | 365 (58.6%) |
Education in Great Neck Gardens
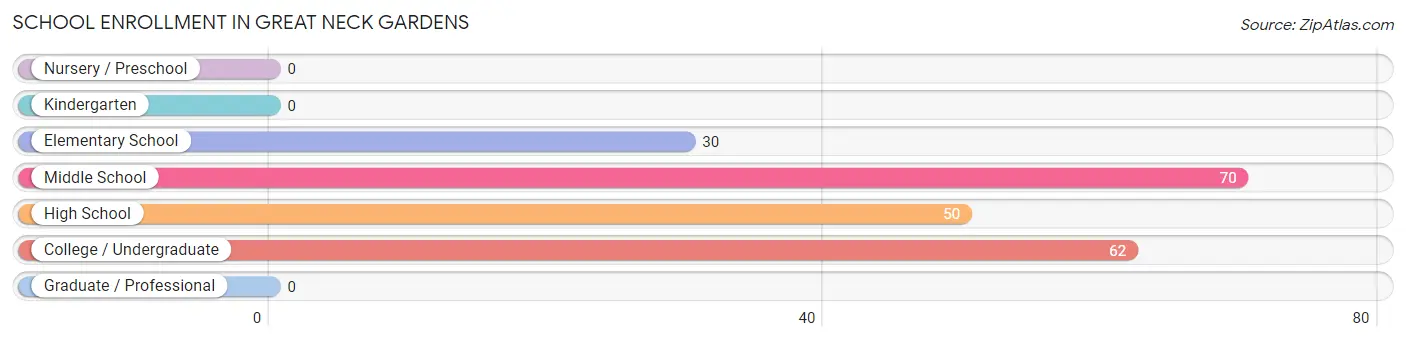
School Enrollment in Great Neck Gardens
The most common levels of schooling among the 212 students in Great Neck Gardens are middle school (70 | 33.0%), college / undergraduate (62 | 29.2%), and high school (50 | 23.6%).
| School Level | # Students | % Students |
| Nursery / Preschool | 0 | 0.0% |
| Kindergarten | 0 | 0.0% |
| Elementary School | 30 | 14.1% |
| Middle School | 70 | 33.0% |
| High School | 50 | 23.6% |
| College / Undergraduate | 62 | 29.2% |
| Graduate / Professional | 0 | 0.0% |
| Total | 212 | 100.0% |
School Enrollment by Age by Funding Source in Great Neck Gardens
Out of a total of 212 students who are enrolled in schools in Great Neck Gardens, 129 (60.8%) attend a private institution, while the remaining 83 (39.2%) are enrolled in public schools. The age group of 15 to 17 year olds has the highest likelihood of being enrolled in private schools, with 25 (100.0% in the age bracket) enrolled. Conversely, the age group of 18 to 19 year olds has the lowest likelihood of being enrolled in a private school, with 25 (100.0% in the age bracket) attending a public institution.
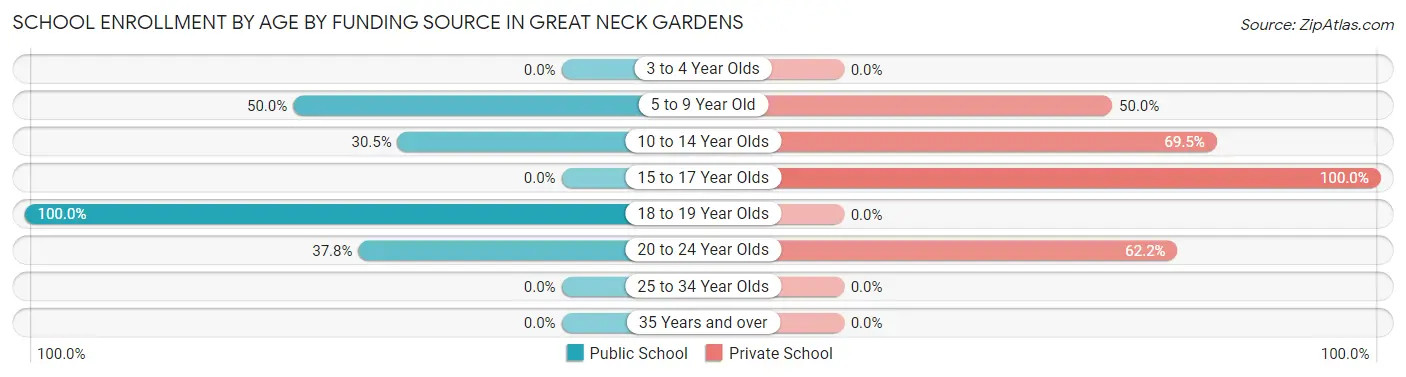
| Age Bracket | Public School | Private School |
| 3 to 4 Year Olds | 0 (0.0%) | 0 (0.0%) |
| 5 to 9 Year Old | 15 (50.0%) | 15 (50.0%) |
| 10 to 14 Year Olds | 29 (30.5%) | 66 (69.5%) |
| 15 to 17 Year Olds | 0 (0.0%) | 25 (100.0%) |
| 18 to 19 Year Olds | 25 (100.0%) | 0 (0.0%) |
| 20 to 24 Year Olds | 14 (37.8%) | 23 (62.2%) |
| 25 to 34 Year Olds | 0 (0.0%) | 0 (0.0%) |
| 35 Years and over | 0 (0.0%) | 0 (0.0%) |
| Total | 83 (39.2%) | 129 (60.8%) |
Educational Attainment by Field of Study in Great Neck Gardens
Science & technology (194 | 30.9%), psychology (114 | 18.1%), bio, nature & agricultural (67 | 10.7%), social sciences (61 | 9.7%), and computers & mathematics (51 | 8.1%) are the most common fields of study among 628 individuals in Great Neck Gardens who have obtained a bachelor's degree or higher.
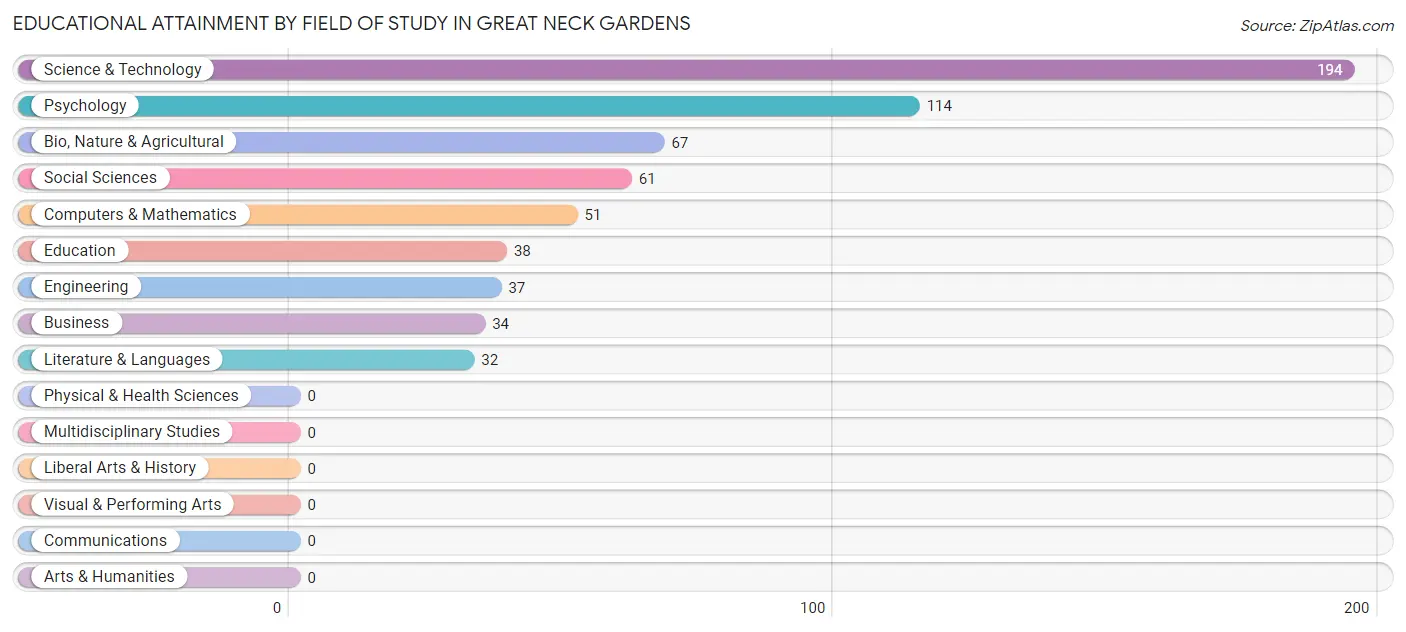
| Field of Study | # Graduates | % Graduates |
| Computers & Mathematics | 51 | 8.1% |
| Bio, Nature & Agricultural | 67 | 10.7% |
| Physical & Health Sciences | 0 | 0.0% |
| Psychology | 114 | 18.1% |
| Social Sciences | 61 | 9.7% |
| Engineering | 37 | 5.9% |
| Multidisciplinary Studies | 0 | 0.0% |
| Science & Technology | 194 | 30.9% |
| Business | 34 | 5.4% |
| Education | 38 | 6.0% |
| Literature & Languages | 32 | 5.1% |
| Liberal Arts & History | 0 | 0.0% |
| Visual & Performing Arts | 0 | 0.0% |
| Communications | 0 | 0.0% |
| Arts & Humanities | 0 | 0.0% |
| Total | 628 | 100.0% |
Transportation & Commute in Great Neck Gardens
Vehicle Availability by Sex in Great Neck Gardens
The most prevalent vehicle ownership categories in Great Neck Gardens are males with 3 vehicles (141, accounting for 54.6%) and females with 3 vehicles (228, making up 38.6%).
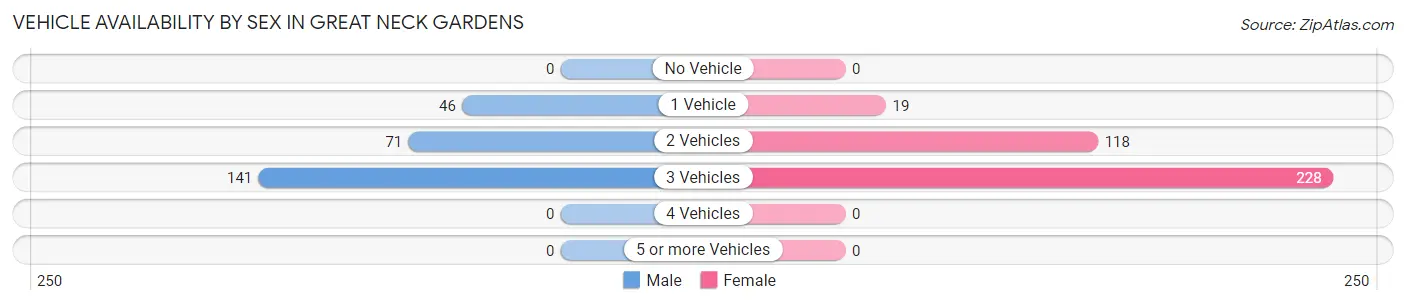
| Vehicles Available | Male | Female |
| No Vehicle | 0 (0.0%) | 0 (0.0%) |
| 1 Vehicle | 46 (17.8%) | 19 (5.2%) |
| 2 Vehicles | 71 (27.5%) | 118 (32.3%) |
| 3 Vehicles | 141 (54.6%) | 228 (62.5%) |
| 4 Vehicles | 0 (0.0%) | 0 (0.0%) |
| 5 or more Vehicles | 0 (0.0%) | 0 (0.0%) |
| Total | 258 (100.0%) | 365 (100.0%) |
Commute Time in Great Neck Gardens
The most frequently occuring commute durations in Great Neck Gardens are 30 to 34 minutes (266 commuters, 45.8%), 10 to 14 minutes (148 commuters, 25.5%), and 45 to 59 minutes (75 commuters, 12.9%).
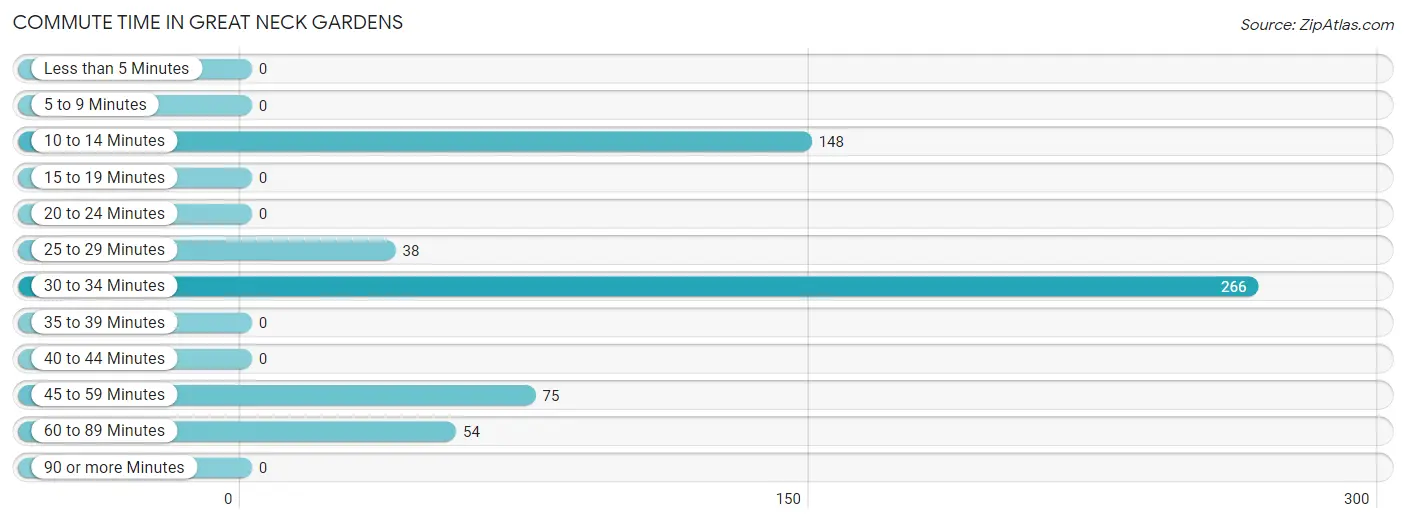
| Commute Time | # Commuters | % Commuters |
| Less than 5 Minutes | 0 | 0.0% |
| 5 to 9 Minutes | 0 | 0.0% |
| 10 to 14 Minutes | 148 | 25.5% |
| 15 to 19 Minutes | 0 | 0.0% |
| 20 to 24 Minutes | 0 | 0.0% |
| 25 to 29 Minutes | 38 | 6.5% |
| 30 to 34 Minutes | 266 | 45.8% |
| 35 to 39 Minutes | 0 | 0.0% |
| 40 to 44 Minutes | 0 | 0.0% |
| 45 to 59 Minutes | 75 | 12.9% |
| 60 to 89 Minutes | 54 | 9.3% |
| 90 or more Minutes | 0 | 0.0% |
Commute Time by Sex in Great Neck Gardens
The most common commute times in Great Neck Gardens are 30 to 34 minutes (110 commuters, 42.6%) for males and 30 to 34 minutes (156 commuters, 48.3%) for females.
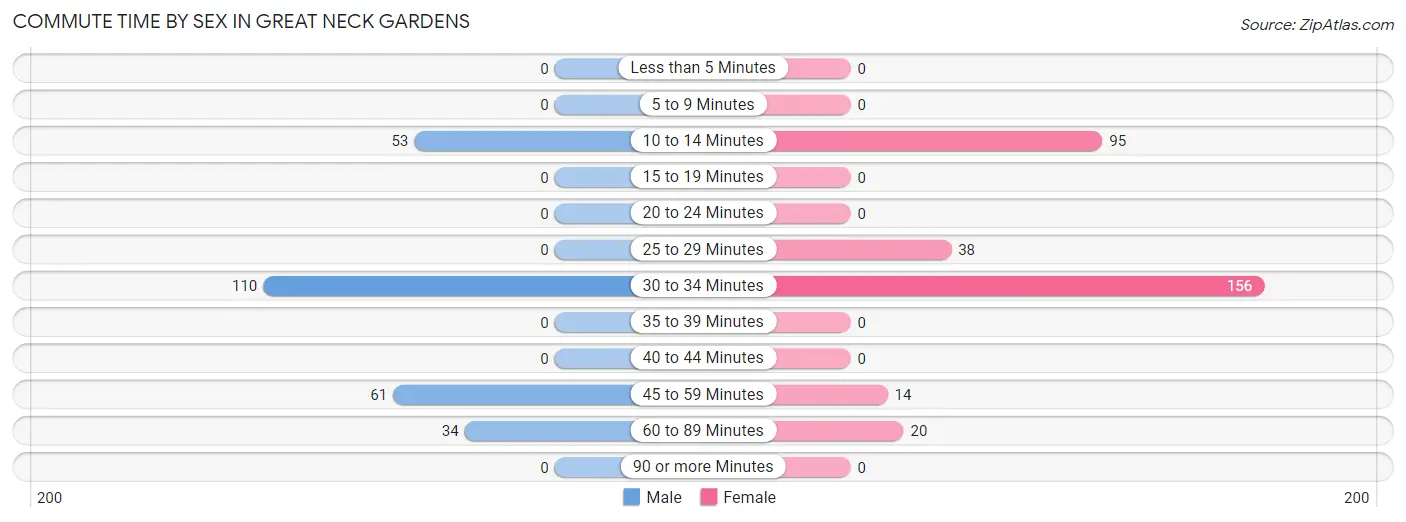
| Commute Time | Male | Female |
| Less than 5 Minutes | 0 (0.0%) | 0 (0.0%) |
| 5 to 9 Minutes | 0 (0.0%) | 0 (0.0%) |
| 10 to 14 Minutes | 53 (20.5%) | 95 (29.4%) |
| 15 to 19 Minutes | 0 (0.0%) | 0 (0.0%) |
| 20 to 24 Minutes | 0 (0.0%) | 0 (0.0%) |
| 25 to 29 Minutes | 0 (0.0%) | 38 (11.8%) |
| 30 to 34 Minutes | 110 (42.6%) | 156 (48.3%) |
| 35 to 39 Minutes | 0 (0.0%) | 0 (0.0%) |
| 40 to 44 Minutes | 0 (0.0%) | 0 (0.0%) |
| 45 to 59 Minutes | 61 (23.6%) | 14 (4.3%) |
| 60 to 89 Minutes | 34 (13.2%) | 20 (6.2%) |
| 90 or more Minutes | 0 (0.0%) | 0 (0.0%) |
Time of Departure to Work by Sex in Great Neck Gardens
The most frequent times of departure to work in Great Neck Gardens are 8:30 AM to 8:59 AM (68, 26.4%) for males and 8:00 AM to 8:29 AM (176, 54.5%) for females.
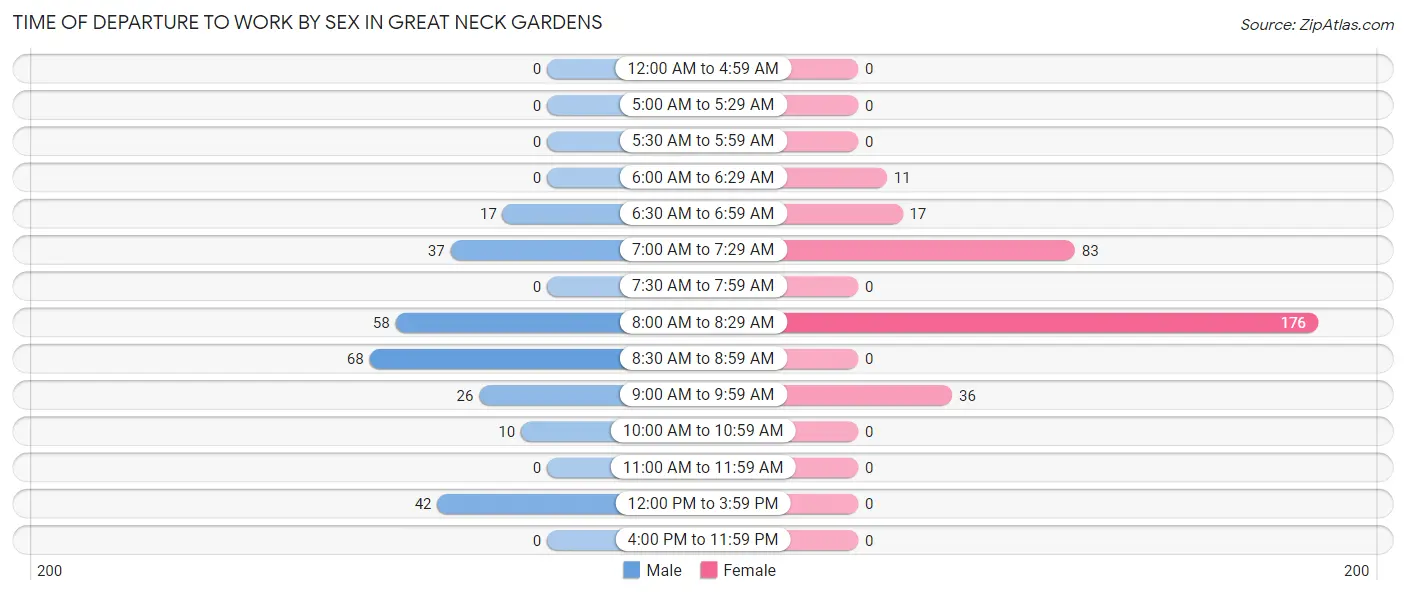
| Time of Departure | Male | Female |
| 12:00 AM to 4:59 AM | 0 (0.0%) | 0 (0.0%) |
| 5:00 AM to 5:29 AM | 0 (0.0%) | 0 (0.0%) |
| 5:30 AM to 5:59 AM | 0 (0.0%) | 0 (0.0%) |
| 6:00 AM to 6:29 AM | 0 (0.0%) | 11 (3.4%) |
| 6:30 AM to 6:59 AM | 17 (6.6%) | 17 (5.3%) |
| 7:00 AM to 7:29 AM | 37 (14.3%) | 83 (25.7%) |
| 7:30 AM to 7:59 AM | 0 (0.0%) | 0 (0.0%) |
| 8:00 AM to 8:29 AM | 58 (22.5%) | 176 (54.5%) |
| 8:30 AM to 8:59 AM | 68 (26.4%) | 0 (0.0%) |
| 9:00 AM to 9:59 AM | 26 (10.1%) | 36 (11.2%) |
| 10:00 AM to 10:59 AM | 10 (3.9%) | 0 (0.0%) |
| 11:00 AM to 11:59 AM | 0 (0.0%) | 0 (0.0%) |
| 12:00 PM to 3:59 PM | 42 (16.3%) | 0 (0.0%) |
| 4:00 PM to 11:59 PM | 0 (0.0%) | 0 (0.0%) |
| Total | 258 (100.0%) | 323 (100.0%) |
Housing Occupancy in Great Neck Gardens
Occupancy by Ownership in Great Neck Gardens
Of the total 386 dwellings in Great Neck Gardens, owner-occupied units account for 249 (64.5%), while renter-occupied units make up 137 (35.5%).
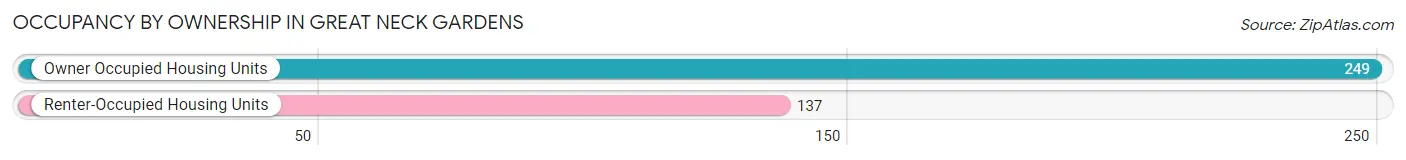
| Occupancy | # Housing Units | % Housing Units |
| Owner Occupied Housing Units | 249 | 64.5% |
| Renter-Occupied Housing Units | 137 | 35.5% |
| Total Occupied Housing Units | 386 | 100.0% |
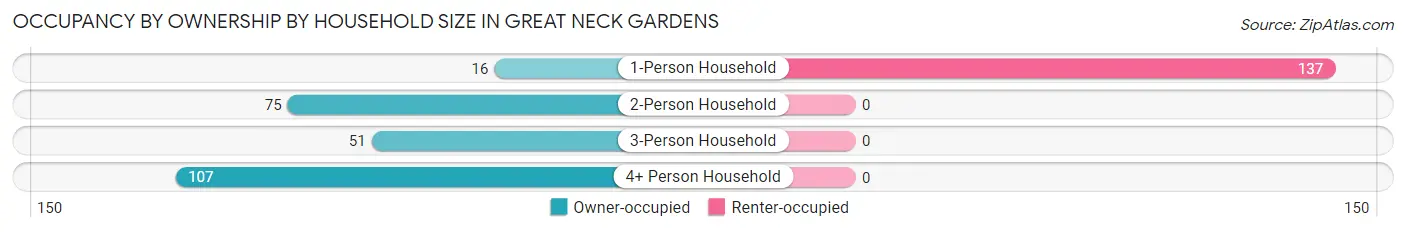
Occupancy by Household Size in Great Neck Gardens
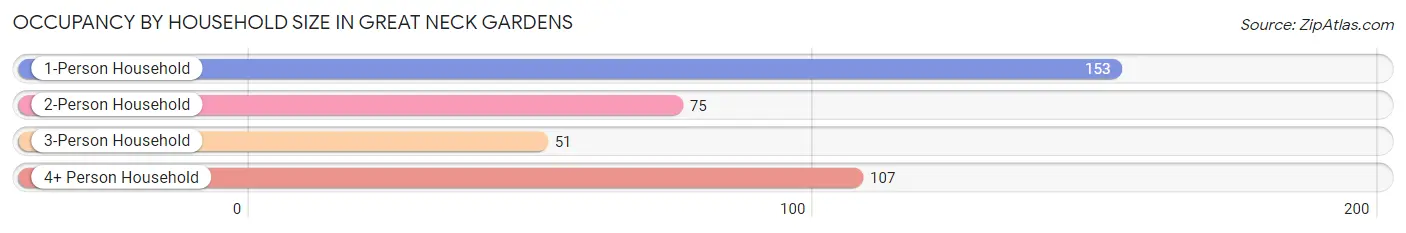
| Household Size | # Housing Units | % Housing Units |
| 1-Person Household | 153 | 39.6% |
| 2-Person Household | 75 | 19.4% |
| 3-Person Household | 51 | 13.2% |
| 4+ Person Household | 107 | 27.7% |
| Total Housing Units | 386 | 100.0% |
Occupancy by Ownership by Household Size in Great Neck Gardens
| Household Size | Owner-occupied | Renter-occupied |
| 1-Person Household | 16 (10.5%) | 137 (89.5%) |
| 2-Person Household | 75 (100.0%) | 0 (0.0%) |
| 3-Person Household | 51 (100.0%) | 0 (0.0%) |
| 4+ Person Household | 107 (100.0%) | 0 (0.0%) |
| Total Housing Units | 249 (64.5%) | 137 (35.5%) |
Occupancy by Educational Attainment in Great Neck Gardens
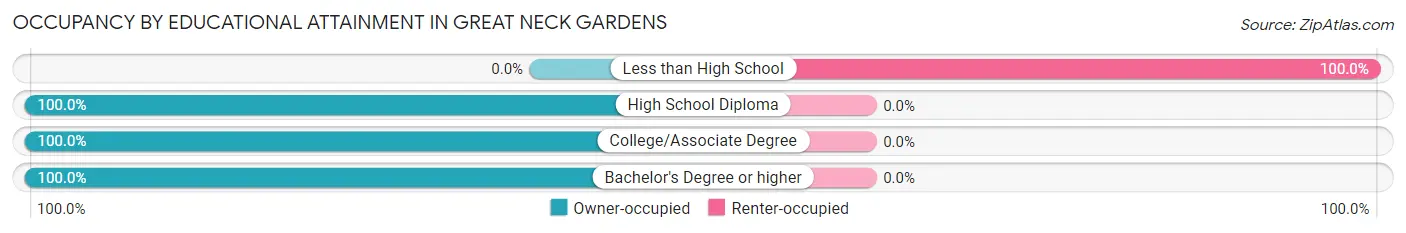
| Household Size | Owner-occupied | Renter-occupied |
| Less than High School | 0 (0.0%) | 137 (100.0%) |
| High School Diploma | 52 (100.0%) | 0 (0.0%) |
| College/Associate Degree | 24 (100.0%) | 0 (0.0%) |
| Bachelor's Degree or higher | 173 (100.0%) | 0 (0.0%) |
Occupancy by Age of Householder in Great Neck Gardens
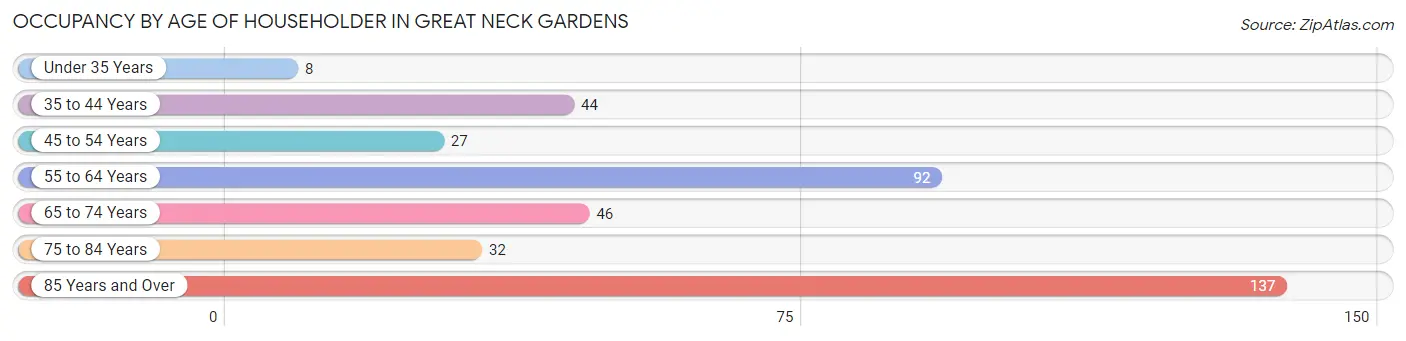
| Age Bracket | # Households | % Households |
| Under 35 Years | 8 | 2.1% |
| 35 to 44 Years | 44 | 11.4% |
| 45 to 54 Years | 27 | 7.0% |
| 55 to 64 Years | 92 | 23.8% |
| 65 to 74 Years | 46 | 11.9% |
| 75 to 84 Years | 32 | 8.3% |
| 85 Years and Over | 137 | 35.5% |
| Total | 386 | 100.0% |
Housing Finances in Great Neck Gardens
Median Income by Occupancy in Great Neck Gardens
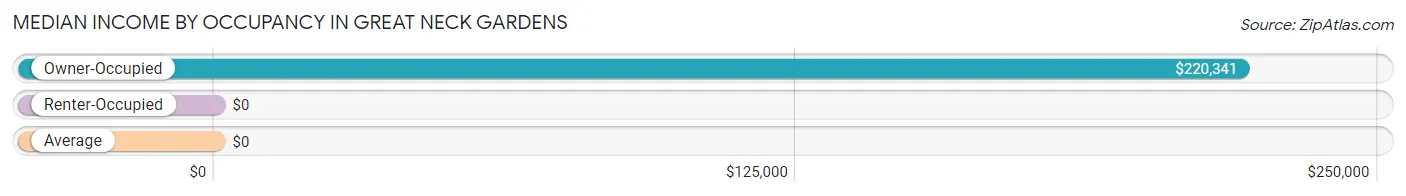
| Occupancy Type | # Households | Median Income |
| Owner-Occupied | 249 (64.5%) | $220,341 |
| Renter-Occupied | 137 (35.5%) | $0 |
| Average | 386 (100.0%) | $0 |
Occupancy by Householder Income Bracket in Great Neck Gardens
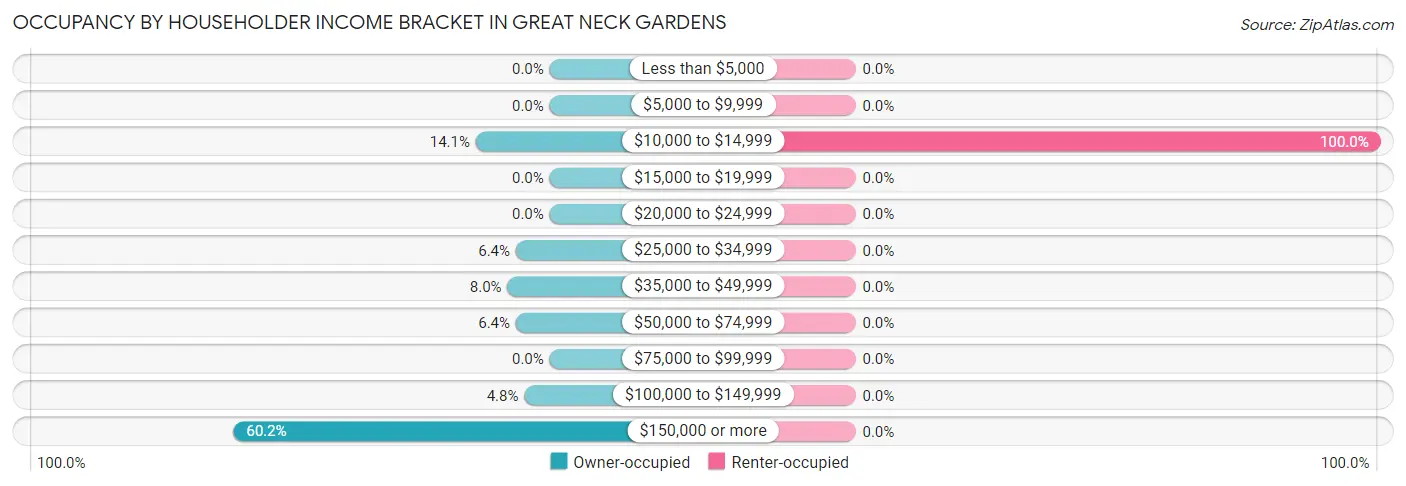
| Income Bracket | Owner-occupied | Renter-occupied |
| Less than $5,000 | 0 (0.0%) | 0 (0.0%) |
| $5,000 to $9,999 | 0 (0.0%) | 0 (0.0%) |
| $10,000 to $14,999 | 35 (14.1%) | 137 (100.0%) |
| $15,000 to $19,999 | 0 (0.0%) | 0 (0.0%) |
| $20,000 to $24,999 | 0 (0.0%) | 0 (0.0%) |
| $25,000 to $34,999 | 16 (6.4%) | 0 (0.0%) |
| $35,000 to $49,999 | 20 (8.0%) | 0 (0.0%) |
| $50,000 to $74,999 | 16 (6.4%) | 0 (0.0%) |
| $75,000 to $99,999 | 0 (0.0%) | 0 (0.0%) |
| $100,000 to $149,999 | 12 (4.8%) | 0 (0.0%) |
| $150,000 or more | 150 (60.2%) | 0 (0.0%) |
| Total | 249 (100.0%) | 137 (100.0%) |
Monthly Housing Cost Tiers in Great Neck Gardens
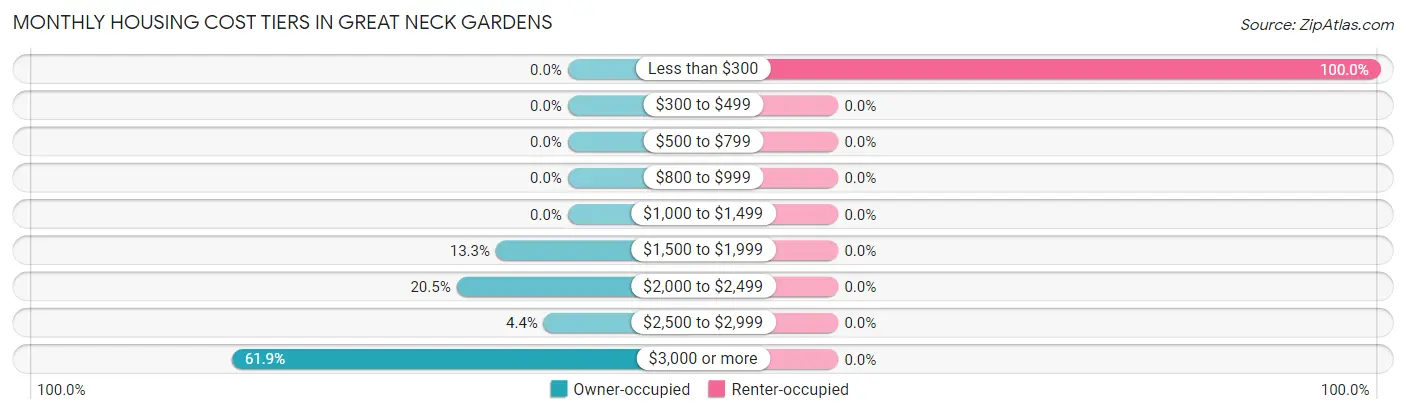
| Monthly Cost | Owner-occupied | Renter-occupied |
| Less than $300 | 0 (0.0%) | 137 (100.0%) |
| $300 to $499 | 0 (0.0%) | 0 (0.0%) |
| $500 to $799 | 0 (0.0%) | 0 (0.0%) |
| $800 to $999 | 0 (0.0%) | 0 (0.0%) |
| $1,000 to $1,499 | 0 (0.0%) | 0 (0.0%) |
| $1,500 to $1,999 | 33 (13.3%) | 0 (0.0%) |
| $2,000 to $2,499 | 51 (20.5%) | 0 (0.0%) |
| $2,500 to $2,999 | 11 (4.4%) | 0 (0.0%) |
| $3,000 or more | 154 (61.9%) | 0 (0.0%) |
| Total | 249 (100.0%) | 137 (100.0%) |
Physical Housing Characteristics in Great Neck Gardens
Housing Structures in Great Neck Gardens
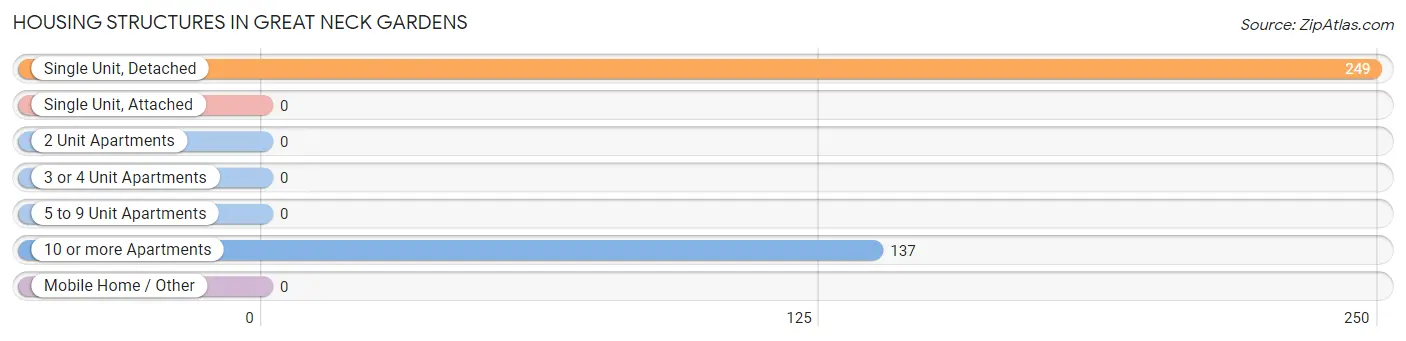
| Structure Type | # Housing Units | % Housing Units |
| Single Unit, Detached | 249 | 64.5% |
| Single Unit, Attached | 0 | 0.0% |
| 2 Unit Apartments | 0 | 0.0% |
| 3 or 4 Unit Apartments | 0 | 0.0% |
| 5 to 9 Unit Apartments | 0 | 0.0% |
| 10 or more Apartments | 137 | 35.5% |
| Mobile Home / Other | 0 | 0.0% |
| Total | 386 | 100.0% |
Housing Structures by Occupancy in Great Neck Gardens
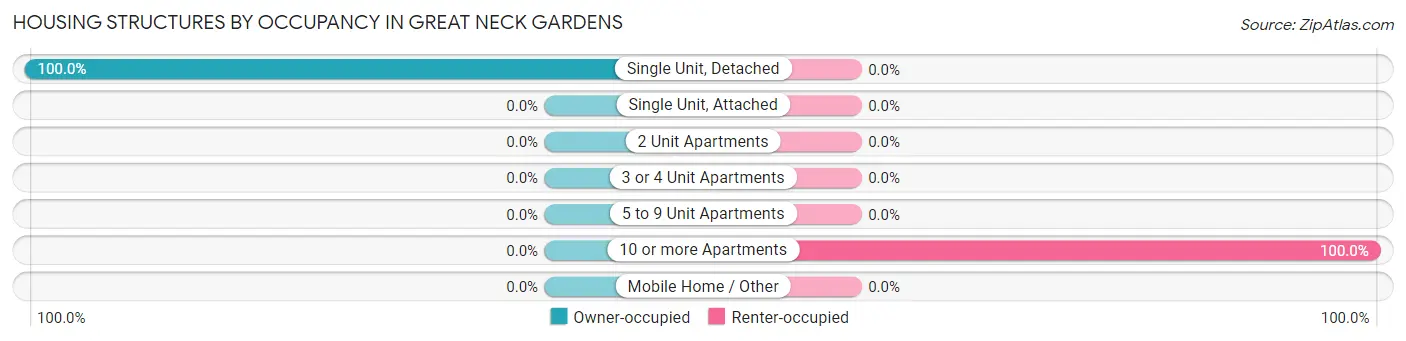
| Structure Type | Owner-occupied | Renter-occupied |
| Single Unit, Detached | 249 (100.0%) | 0 (0.0%) |
| Single Unit, Attached | 0 (0.0%) | 0 (0.0%) |
| 2 Unit Apartments | 0 (0.0%) | 0 (0.0%) |
| 3 or 4 Unit Apartments | 0 (0.0%) | 0 (0.0%) |
| 5 to 9 Unit Apartments | 0 (0.0%) | 0 (0.0%) |
| 10 or more Apartments | 0 (0.0%) | 137 (100.0%) |
| Mobile Home / Other | 0 (0.0%) | 0 (0.0%) |
| Total | 249 (64.5%) | 137 (35.5%) |
Housing Structures by Number of Rooms in Great Neck Gardens
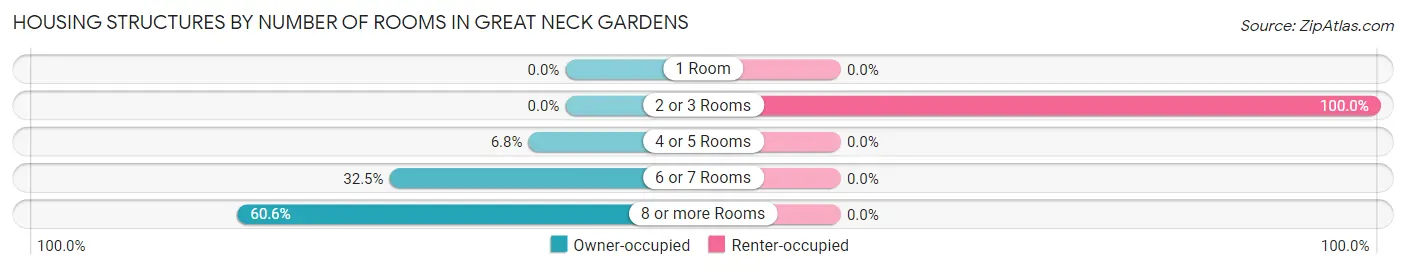
| Number of Rooms | Owner-occupied | Renter-occupied |
| 1 Room | 0 (0.0%) | 0 (0.0%) |
| 2 or 3 Rooms | 0 (0.0%) | 137 (100.0%) |
| 4 or 5 Rooms | 17 (6.8%) | 0 (0.0%) |
| 6 or 7 Rooms | 81 (32.5%) | 0 (0.0%) |
| 8 or more Rooms | 151 (60.6%) | 0 (0.0%) |
| Total | 249 (100.0%) | 137 (100.0%) |
Housing Structure by Heating Type in Great Neck Gardens
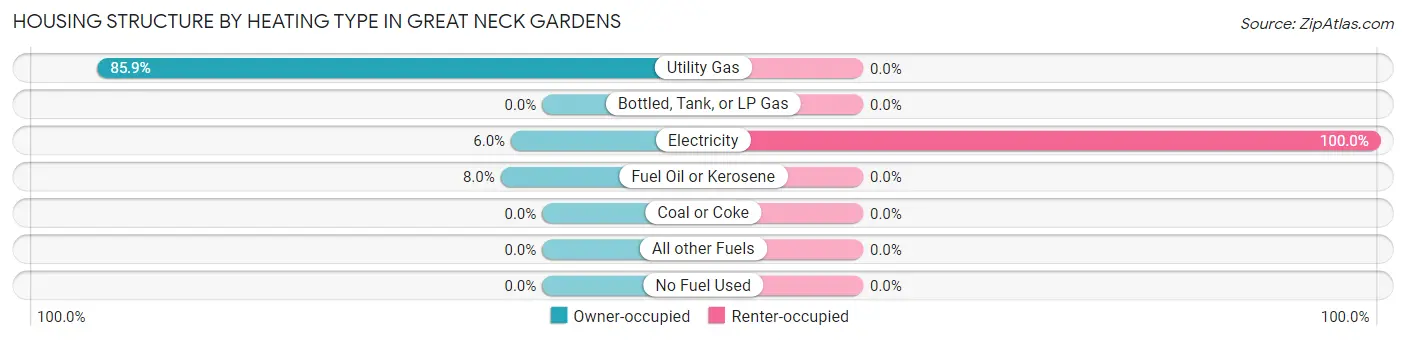
| Heating Type | Owner-occupied | Renter-occupied |
| Utility Gas | 214 (85.9%) | 0 (0.0%) |
| Bottled, Tank, or LP Gas | 0 (0.0%) | 0 (0.0%) |
| Electricity | 15 (6.0%) | 137 (100.0%) |
| Fuel Oil or Kerosene | 20 (8.0%) | 0 (0.0%) |
| Coal or Coke | 0 (0.0%) | 0 (0.0%) |
| All other Fuels | 0 (0.0%) | 0 (0.0%) |
| No Fuel Used | 0 (0.0%) | 0 (0.0%) |
| Total | 249 (100.0%) | 137 (100.0%) |
Household Vehicle Usage in Great Neck Gardens
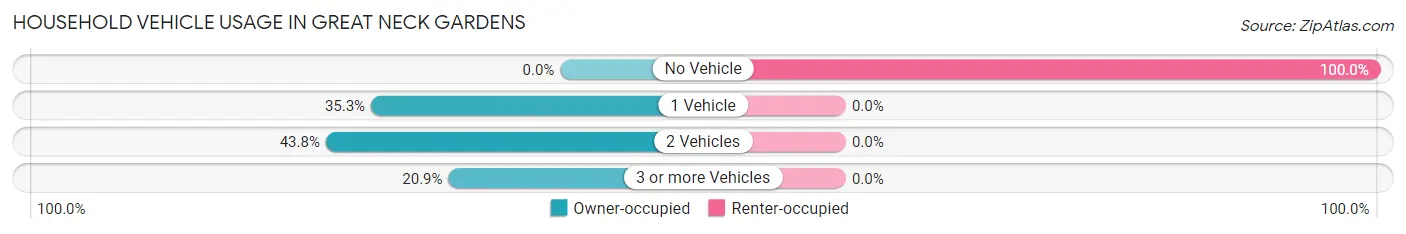
| Vehicles per Household | Owner-occupied | Renter-occupied |
| No Vehicle | 0 (0.0%) | 137 (100.0%) |
| 1 Vehicle | 88 (35.3%) | 0 (0.0%) |
| 2 Vehicles | 109 (43.8%) | 0 (0.0%) |
| 3 or more Vehicles | 52 (20.9%) | 0 (0.0%) |
| Total | 249 (100.0%) | 137 (100.0%) |
Real Estate & Mortgages in Great Neck Gardens
Real Estate and Mortgage Overview in Great Neck Gardens
| Characteristic | Without Mortgage | With Mortgage |
| Housing Units | 115 | 134 |
| Median Property Value | $1,117,900 | $1,158,800 |
| Median Household Income | $220,341 | $67 |
| Monthly Housing Costs | $1,501 | $134 |
| Real Estate Taxes | $10,001 | $0 |
Property Value by Mortgage Status in Great Neck Gardens
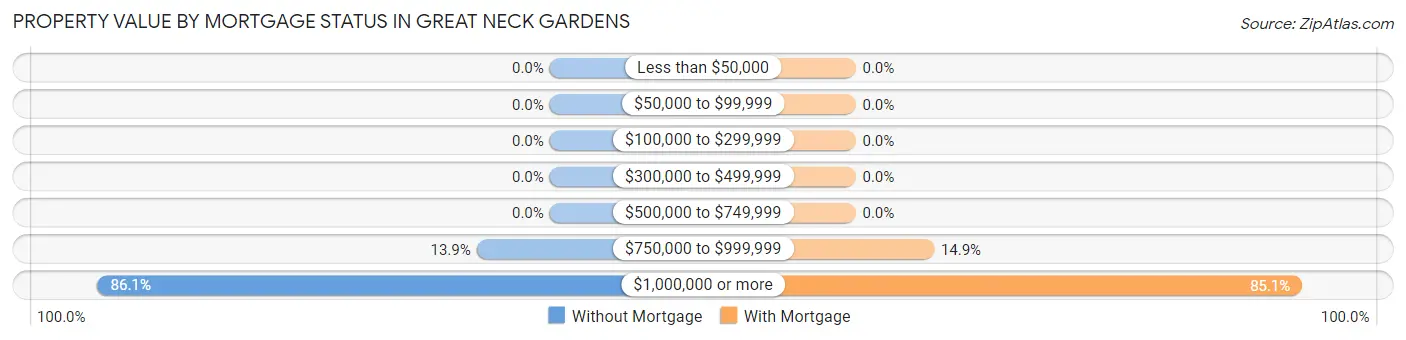
| Property Value | Without Mortgage | With Mortgage |
| Less than $50,000 | 0 (0.0%) | 0 (0.0%) |
| $50,000 to $99,999 | 0 (0.0%) | 0 (0.0%) |
| $100,000 to $299,999 | 0 (0.0%) | 0 (0.0%) |
| $300,000 to $499,999 | 0 (0.0%) | 0 (0.0%) |
| $500,000 to $749,999 | 0 (0.0%) | 0 (0.0%) |
| $750,000 to $999,999 | 16 (13.9%) | 20 (14.9%) |
| $1,000,000 or more | 99 (86.1%) | 114 (85.1%) |
| Total | 115 (100.0%) | 134 (100.0%) |
Household Income by Mortgage Status in Great Neck Gardens
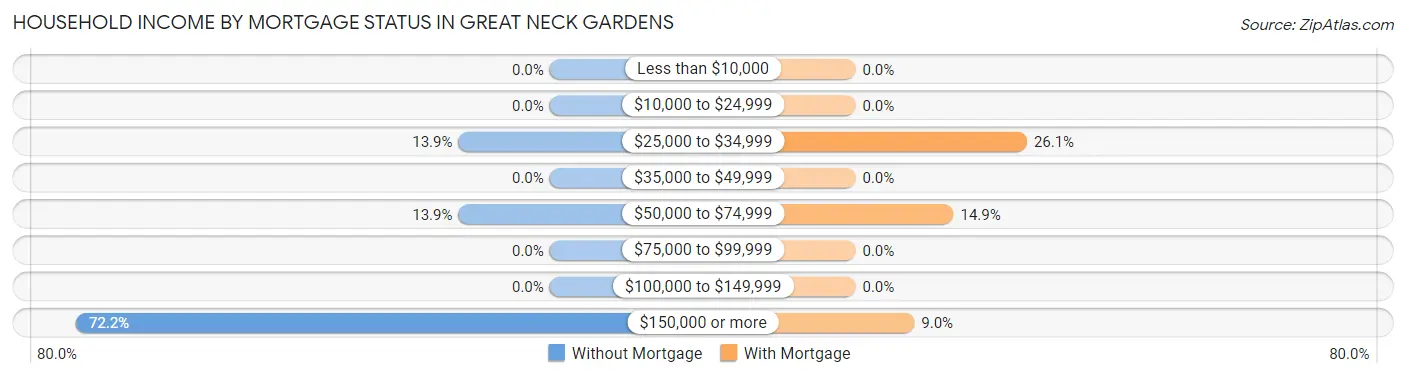
| Household Income | Without Mortgage | With Mortgage |
| Less than $10,000 | 0 (0.0%) | 0 (0.0%) |
| $10,000 to $24,999 | 0 (0.0%) | 0 (0.0%) |
| $25,000 to $34,999 | 16 (13.9%) | 35 (26.1%) |
| $35,000 to $49,999 | 0 (0.0%) | 0 (0.0%) |
| $50,000 to $74,999 | 16 (13.9%) | 20 (14.9%) |
| $75,000 to $99,999 | 0 (0.0%) | 0 (0.0%) |
| $100,000 to $149,999 | 0 (0.0%) | 0 (0.0%) |
| $150,000 or more | 83 (72.2%) | 12 (9.0%) |
| Total | 115 (100.0%) | 134 (100.0%) |
Property Value to Household Income Ratio in Great Neck Gardens
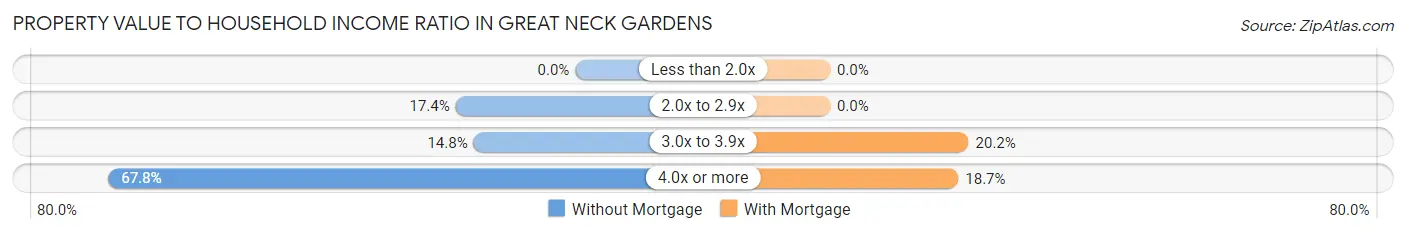
| Value-to-Income Ratio | Without Mortgage | With Mortgage |
| Less than 2.0x | 0 (0.0%) | 0 (0.0%) |
| 2.0x to 2.9x | 20 (17.4%) | 0 (0.0%) |
| 3.0x to 3.9x | 17 (14.8%) | 27 (20.2%) |
| 4.0x or more | 78 (67.8%) | 25 (18.7%) |
| Total | 115 (100.0%) | 134 (100.0%) |
Real Estate Taxes by Mortgage Status in Great Neck Gardens
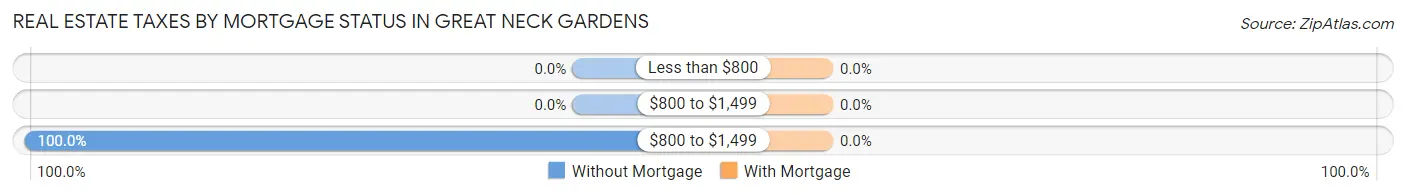
| Property Taxes | Without Mortgage | With Mortgage |
| Less than $800 | 0 (0.0%) | 0 (0.0%) |
| $800 to $1,499 | 0 (0.0%) | 0 (0.0%) |
| $800 to $1,499 | 115 (100.0%) | 0 (0.0%) |
| Total | 115 (100.0%) | 134 (100.0%) |
Health & Disability in Great Neck Gardens
Health Insurance Coverage by Age in Great Neck Gardens
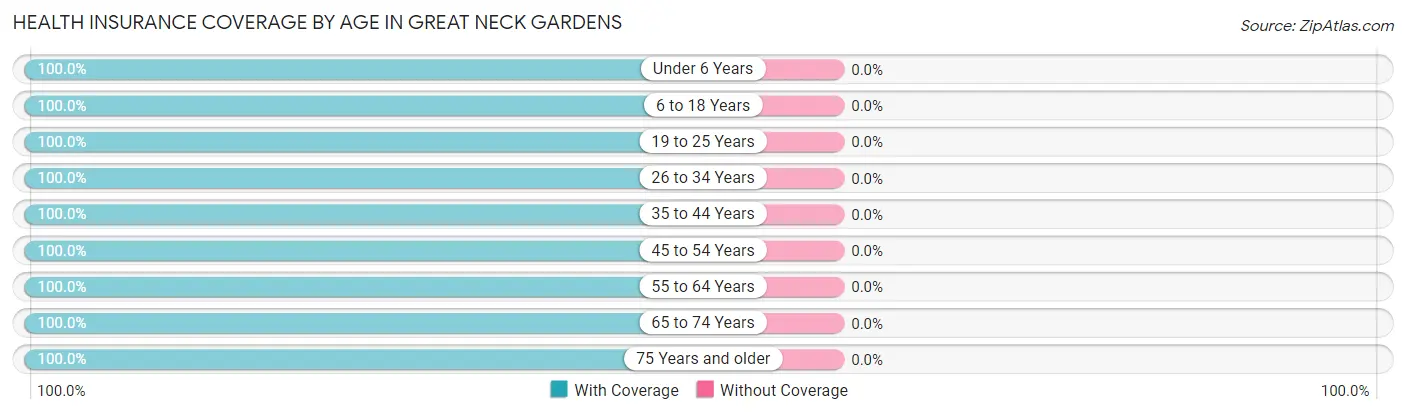
| Age Bracket | With Coverage | Without Coverage |
| Under 6 Years | 9 (100.0%) | 0 (0.0%) |
| 6 to 18 Years | 150 (100.0%) | 0 (0.0%) |
| 19 to 25 Years | 62 (100.0%) | 0 (0.0%) |
| 26 to 34 Years | 111 (100.0%) | 0 (0.0%) |
| 35 to 44 Years | 70 (100.0%) | 0 (0.0%) |
| 45 to 54 Years | 93 (100.0%) | 0 (0.0%) |
| 55 to 64 Years | 135 (100.0%) | 0 (0.0%) |
| 65 to 74 Years | 148 (100.0%) | 0 (0.0%) |
| 75 Years and older | 361 (100.0%) | 0 (0.0%) |
| Total | 1,139 (100.0%) | 0 (0.0%) |
Health Insurance Coverage by Citizenship Status in Great Neck Gardens
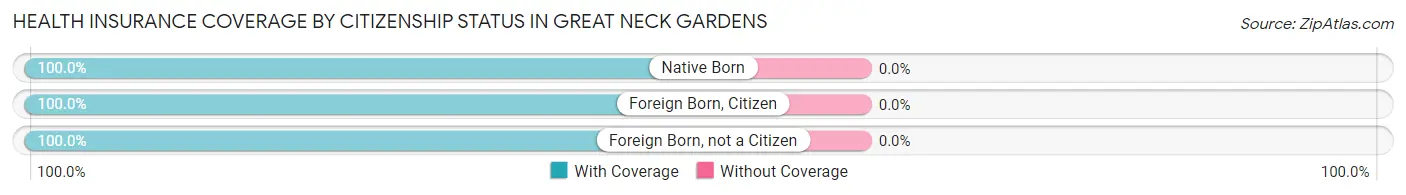
| Citizenship Status | With Coverage | Without Coverage |
| Native Born | 9 (100.0%) | 0 (0.0%) |
| Foreign Born, Citizen | 150 (100.0%) | 0 (0.0%) |
| Foreign Born, not a Citizen | 62 (100.0%) | 0 (0.0%) |
Health Insurance Coverage by Household Income in Great Neck Gardens
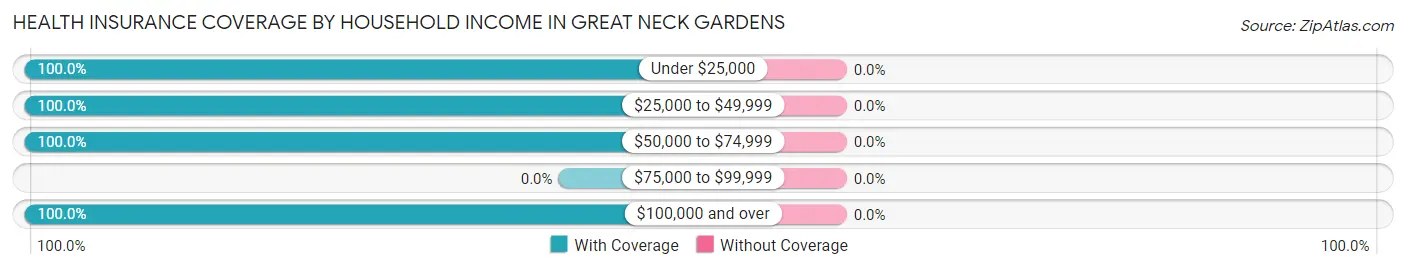
| Household Income | With Coverage | Without Coverage |
| Under $25,000 | 208 (100.0%) | 0 (0.0%) |
| $25,000 to $49,999 | 101 (100.0%) | 0 (0.0%) |
| $50,000 to $74,999 | 16 (100.0%) | 0 (0.0%) |
| $75,000 to $99,999 | 0 (0.0%) | 0 (0.0%) |
| $100,000 and over | 814 (100.0%) | 0 (0.0%) |
Public vs Private Health Insurance Coverage by Age in Great Neck Gardens
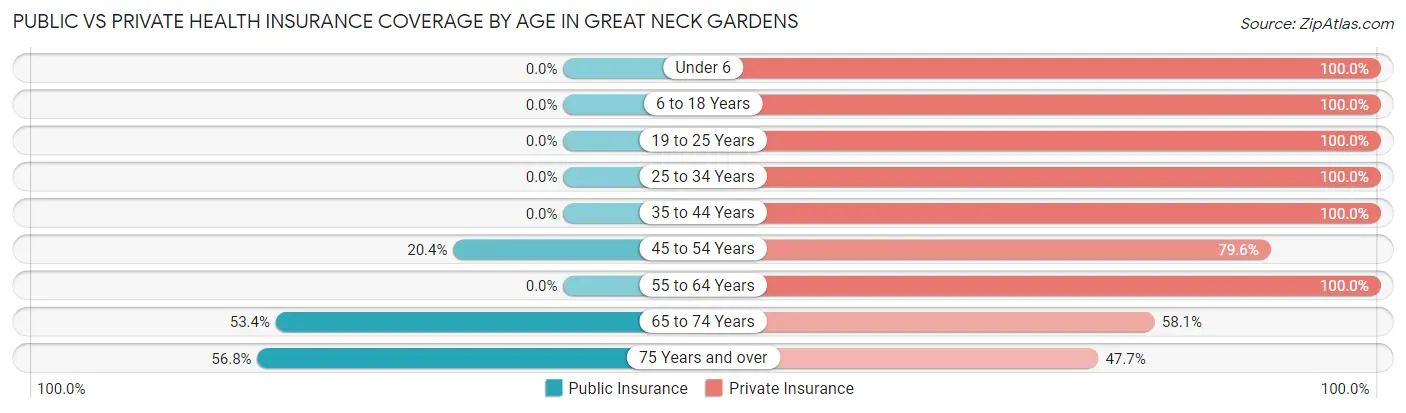
| Age Bracket | Public Insurance | Private Insurance |
| Under 6 | 0 (0.0%) | 9 (100.0%) |
| 6 to 18 Years | 0 (0.0%) | 150 (100.0%) |
| 19 to 25 Years | 0 (0.0%) | 62 (100.0%) |
| 25 to 34 Years | 0 (0.0%) | 111 (100.0%) |
| 35 to 44 Years | 0 (0.0%) | 70 (100.0%) |
| 45 to 54 Years | 19 (20.4%) | 74 (79.6%) |
| 55 to 64 Years | 0 (0.0%) | 135 (100.0%) |
| 65 to 74 Years | 79 (53.4%) | 86 (58.1%) |
| 75 Years and over | 205 (56.8%) | 172 (47.6%) |
| Total | 303 (26.6%) | 869 (76.3%) |
Disability Status by Sex by Age in Great Neck Gardens
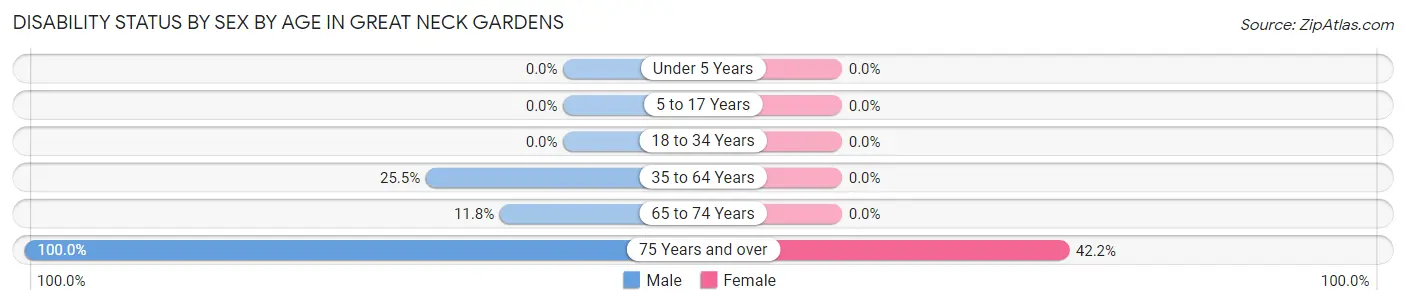
| Age Bracket | Male | Female |
| Under 5 Years | 0 (0.0%) | 0 (0.0%) |
| 5 to 17 Years | 0 (0.0%) | 0 (0.0%) |
| 18 to 34 Years | 0 (0.0%) | 0 (0.0%) |
| 35 to 64 Years | 39 (25.5%) | 0 (0.0%) |
| 65 to 74 Years | 10 (11.8%) | 0 (0.0%) |
| 75 Years and over | 36 (100.0%) | 137 (42.1%) |
Disability Class by Sex by Age in Great Neck Gardens
Disability Class: Hearing Difficulty
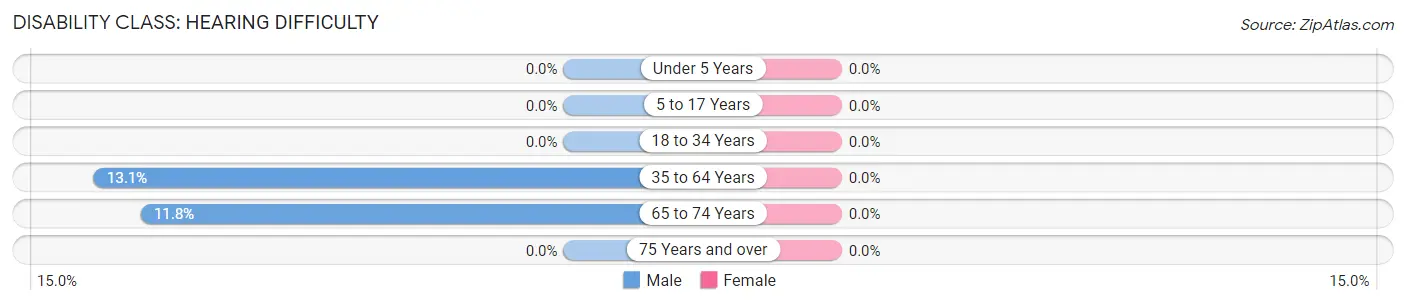
| Age Bracket | Male | Female |
| Under 5 Years | 0 (0.0%) | 0 (0.0%) |
| 5 to 17 Years | 0 (0.0%) | 0 (0.0%) |
| 18 to 34 Years | 0 (0.0%) | 0 (0.0%) |
| 35 to 64 Years | 20 (13.1%) | 0 (0.0%) |
| 65 to 74 Years | 10 (11.8%) | 0 (0.0%) |
| 75 Years and over | 0 (0.0%) | 0 (0.0%) |
Disability Class: Vision Difficulty
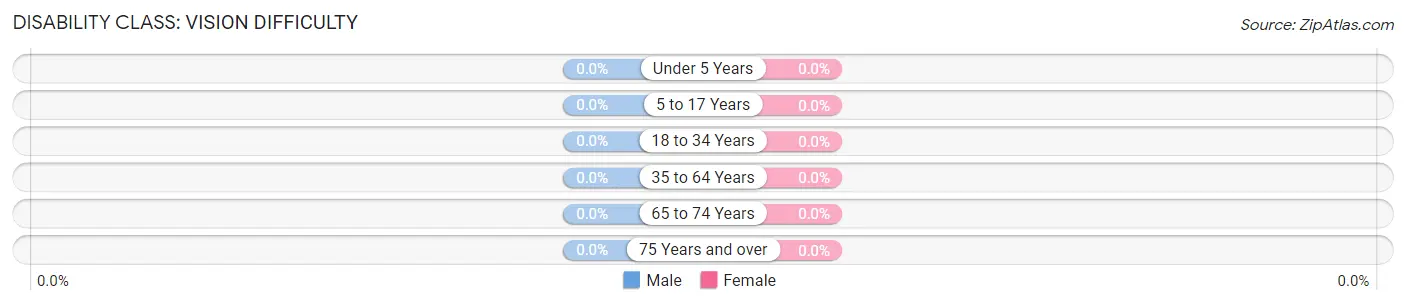
| Age Bracket | Male | Female |
| Under 5 Years | 0 (0.0%) | 0 (0.0%) |
| 5 to 17 Years | 0 (0.0%) | 0 (0.0%) |
| 18 to 34 Years | 0 (0.0%) | 0 (0.0%) |
| 35 to 64 Years | 0 (0.0%) | 0 (0.0%) |
| 65 to 74 Years | 0 (0.0%) | 0 (0.0%) |
| 75 Years and over | 0 (0.0%) | 0 (0.0%) |
Disability Class: Cognitive Difficulty
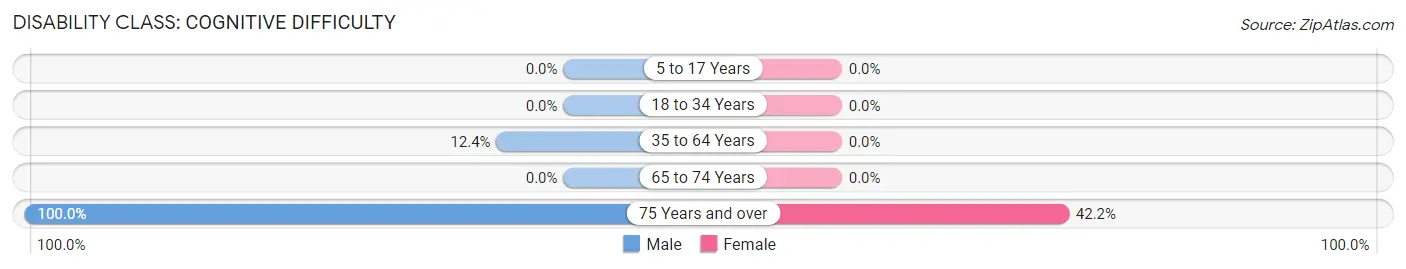
| Age Bracket | Male | Female |
| 5 to 17 Years | 0 (0.0%) | 0 (0.0%) |
| 18 to 34 Years | 0 (0.0%) | 0 (0.0%) |
| 35 to 64 Years | 19 (12.4%) | 0 (0.0%) |
| 65 to 74 Years | 0 (0.0%) | 0 (0.0%) |
| 75 Years and over | 36 (100.0%) | 137 (42.1%) |
Disability Class: Ambulatory Difficulty
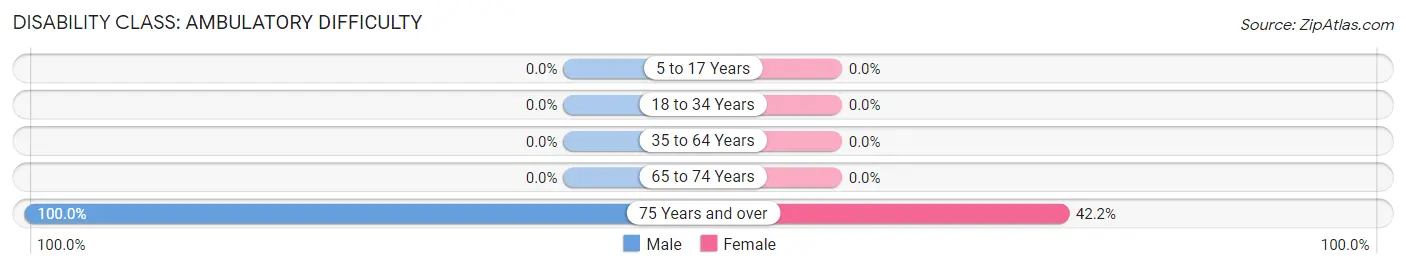
| Age Bracket | Male | Female |
| 5 to 17 Years | 0 (0.0%) | 0 (0.0%) |
| 18 to 34 Years | 0 (0.0%) | 0 (0.0%) |
| 35 to 64 Years | 0 (0.0%) | 0 (0.0%) |
| 65 to 74 Years | 0 (0.0%) | 0 (0.0%) |
| 75 Years and over | 36 (100.0%) | 137 (42.1%) |
Disability Class: Self-Care Difficulty
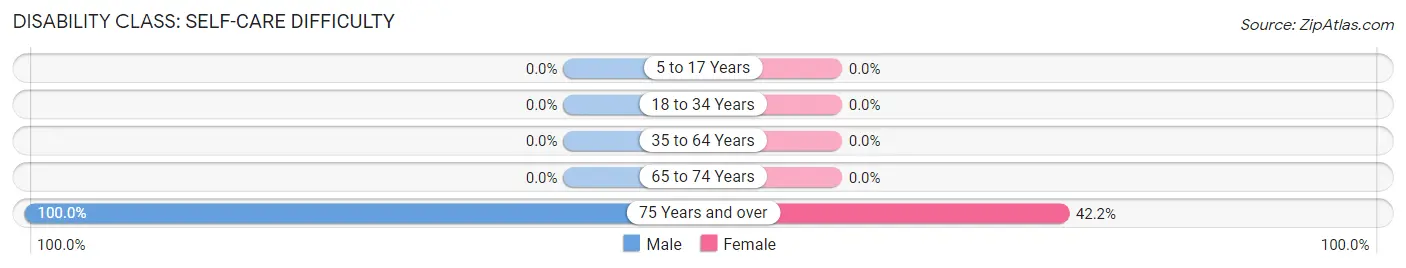
| Age Bracket | Male | Female |
| 5 to 17 Years | 0 (0.0%) | 0 (0.0%) |
| 18 to 34 Years | 0 (0.0%) | 0 (0.0%) |
| 35 to 64 Years | 0 (0.0%) | 0 (0.0%) |
| 65 to 74 Years | 0 (0.0%) | 0 (0.0%) |
| 75 Years and over | 36 (100.0%) | 137 (42.1%) |
Technology Access in Great Neck Gardens
Computing Device Access in Great Neck Gardens
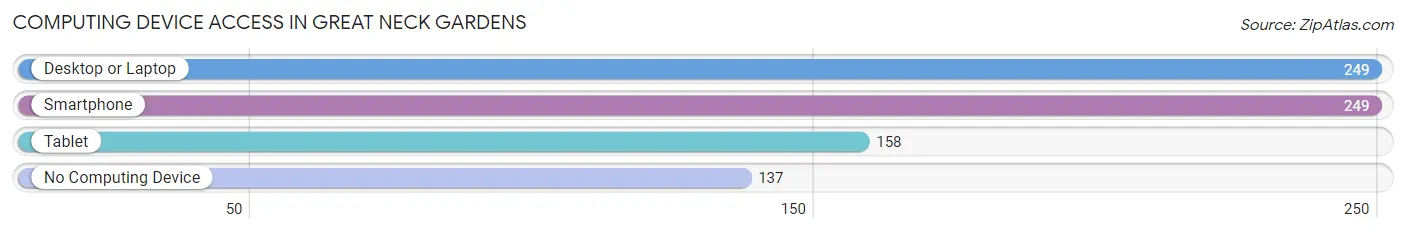
| Device Type | # Households | % Households |
| Desktop or Laptop | 249 | 64.5% |
| Smartphone | 249 | 64.5% |
| Tablet | 158 | 40.9% |
| No Computing Device | 137 | 35.5% |
| Total | 386 | 100.0% |
Internet Access in Great Neck Gardens
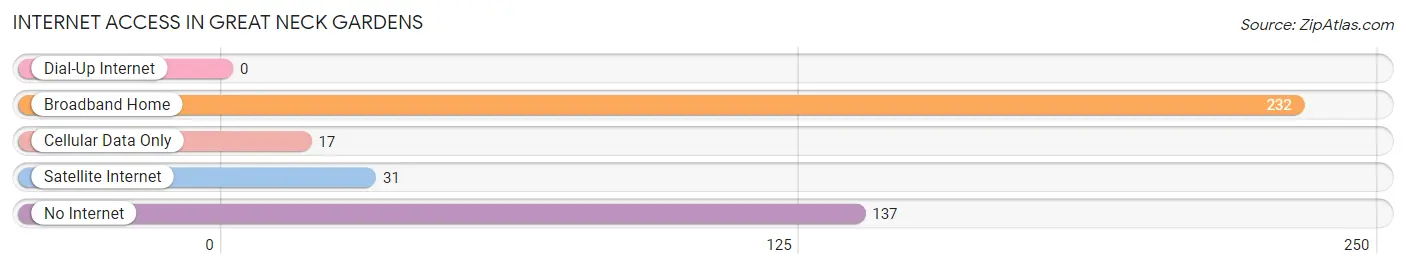
| Internet Type | # Households | % Households |
| Dial-Up Internet | 0 | 0.0% |
| Broadband Home | 232 | 60.1% |
| Cellular Data Only | 17 | 4.4% |
| Satellite Internet | 31 | 8.0% |
| No Internet | 137 | 35.5% |
| Total | 386 | 100.0% |
Great Neck Gardens Summary
Introduction
Great Neck Gardens is a hamlet located in the Town of North Hempstead in Nassau County, New York. It is situated on the Great Neck Peninsula, which is part of the North Shore of Long Island. The hamlet is bordered by the villages of Great Neck, Great Neck Estates, and Kensington. It is home to a diverse population of approximately 4,000 people.
History
The area that is now Great Neck Gardens was originally inhabited by the Matinecock Native American tribe. The first European settlers arrived in the area in the 1640s. The area was initially part of the Town of Hempstead, but was later annexed by the Town of North Hempstead in the late 19th century.
The hamlet was originally known as “Little Neck” and was home to a small farming community. In the early 20th century, the area began to develop rapidly and was eventually renamed “Great Neck Gardens” in the 1920s. The name was chosen to reflect the area’s lush gardens and landscaping.
Geography
Great Neck Gardens is located on the Great Neck Peninsula, which is part of the North Shore of Long Island. It is bordered by the villages of Great Neck, Great Neck Estates, and Kensington. The hamlet is situated on the western side of the peninsula, and is approximately 25 miles east of Manhattan.
The area is characterized by its rolling hills and lush vegetation. It is home to several parks and recreational areas, including the Great Neck Estates Park, the Great Neck Plaza Park, and the Great Neck Gardens Park.
Economy
Great Neck Gardens is primarily a residential community, and the majority of its residents are employed in the nearby cities of New York City and Long Island. The hamlet is home to several small businesses, including restaurants, retail stores, and professional services.
Demographics
As of the 2010 census, Great Neck Gardens had a population of 4,000 people. The racial makeup of the hamlet was 73.3% White, 11.2% Asian, 8.2% African American, and 5.3% Hispanic or Latino. The median household income was $90,000, and the median home value was $845,000.
Conclusion
Great Neck Gardens is a hamlet located in the Town of North Hempstead in Nassau County, New York. It is situated on the Great Neck Peninsula, which is part of the North Shore of Long Island. The hamlet is home to a diverse population of approximately 4,000 people, and is primarily a residential community. The area is characterized by its rolling hills and lush vegetation, and is home to several parks and recreational areas. The hamlet is home to several small businesses, and the majority of its residents are employed in the nearby cities of New York City and Long Island.
Common Questions
What is the Total Population of Great Neck Gardens?
Total Population of Great Neck Gardens is 1,139.
What is the Total Male Population of Great Neck Gardens?
Total Male Population of Great Neck Gardens is 440.
What is the Total Female Population of Great Neck Gardens?
Total Female Population of Great Neck Gardens is 699.
What is the Ratio of Males per 100 Females in Great Neck Gardens?
There are 62.95 Males per 100 Females in Great Neck Gardens.
What is the Ratio of Females per 100 Males in Great Neck Gardens?
There are 158.86 Females per 100 Males in Great Neck Gardens.
What is the Median Population Age in Great Neck Gardens?
Median Population Age in Great Neck Gardens is 58.9 Years.
What is the Average Family Size in Great Neck Gardens
Average Family Size in Great Neck Gardens is 4.2 People.
What is the Average Household Size in Great Neck Gardens
Average Household Size in Great Neck Gardens is 3.0 People.
What is Per Capita Income in Great Neck Gardens?
Per Capita income in Great Neck Gardens is $77,915.
What is the Median Family Income in Great Neck Gardens?
Median Family Income in Great Neck Gardens is $222,159.
What is Inequality or Gini Index in Great Neck Gardens?
Inequality or Gini Index in Great Neck Gardens is 0.60.
How Large is the Labor Force in Great Neck Gardens?
There are 623 People in the Labor Forcein in Great Neck Gardens.
What is the Percentage of People in the Labor Force in Great Neck Gardens?
62.0% of People are in the Labor Force in Great Neck Gardens.