Cities with the Highest Percentage of Immigrants from Vietnam in Virginia
RELATED REPORTS & OPTIONS
Vietnam
Virginia
Compare Cities
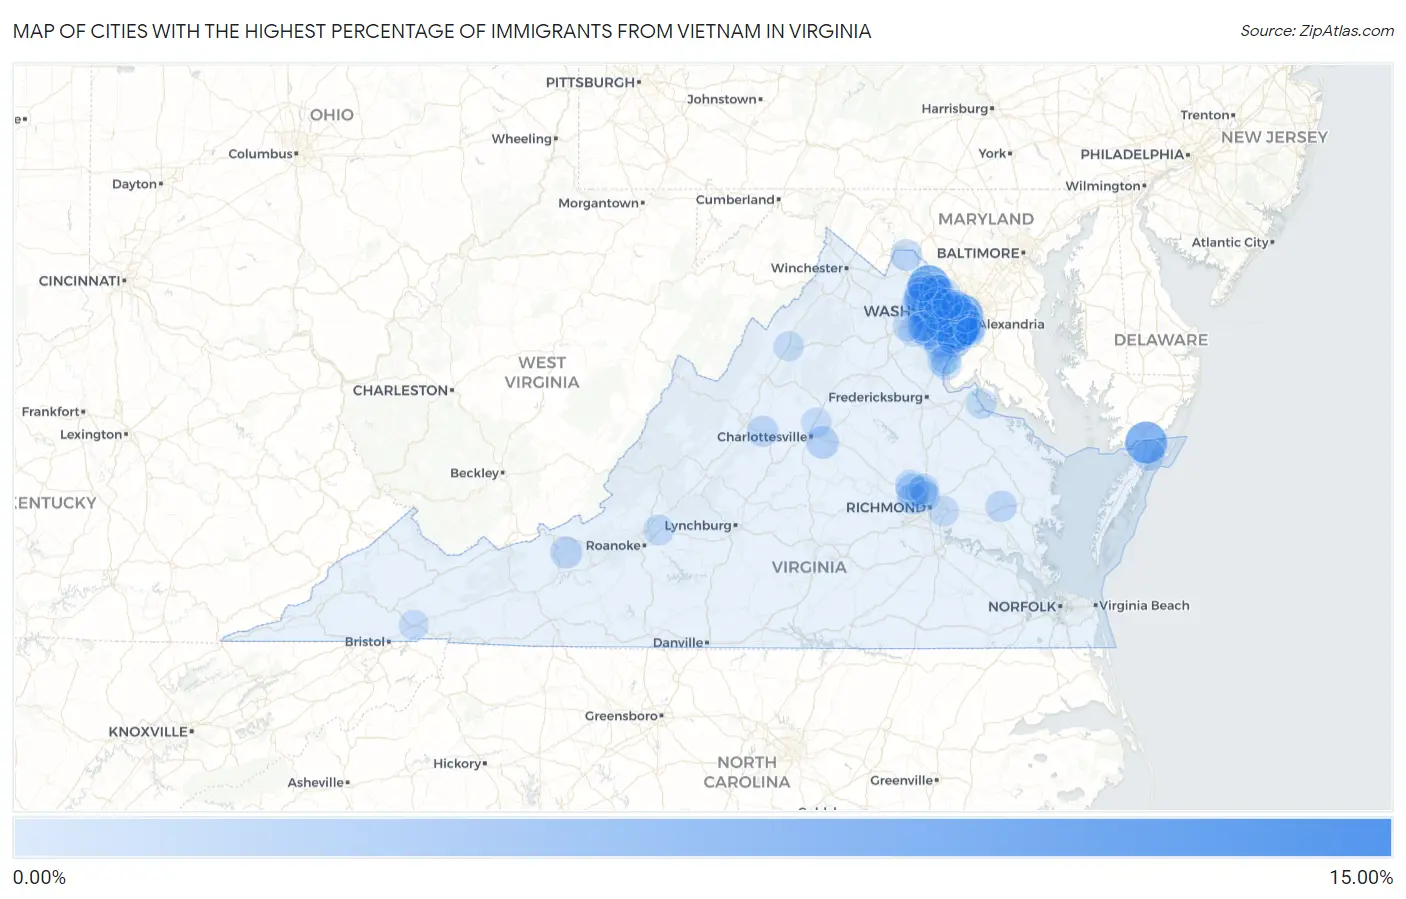
Map of Cities with the Highest Percentage of Immigrants from Vietnam in Virginia
0.00%
15.00%
Cities with the Highest Percentage of Immigrants from Vietnam in Virginia
| City | Vietnam | vs State | vs National | |
| 1. | Ravensworth | 12.40% | 0.53%(+11.9)#-1 | 0.41%(+12.0)#0 |
| 2. | North Springfield | 11.93% | 0.53%(+11.4)#0 | 0.41%(+11.5)#1 |
| 3. | University Center | 7.81% | 0.53%(+7.28)#1 | 0.41%(+7.41)#2 |
| 4. | New Church | 7.60% | 0.53%(+7.07)#2 | 0.41%(+7.19)#3 |
| 5. | Union Mill | 7.16% | 0.53%(+6.63)#3 | 0.41%(+6.75)#4 |
| 6. | Seven Corners | 7.12% | 0.53%(+6.59)#4 | 0.41%(+6.71)#5 |
| 7. | Springfield | 6.91% | 0.53%(+6.38)#20 | 0.41%(+6.50)#560 |
| 8. | Annandale | 6.29% | 0.53%(+5.76)#34 | 0.41%(+5.88)#824 |
| 9. | West Falls Church | 6.09% | 0.53%(+5.56)#35 | 0.41%(+5.68)#825 |
| 10. | Chantilly | 4.64% | 0.53%(+4.11)#94 | 0.41%(+4.23)#2,127 |
| 11. | Lake Barcroft | 3.76% | 0.53%(+3.23)#95 | 0.41%(+3.35)#2,128 |
| 12. | Newington | 3.68% | 0.53%(+3.15)#96 | 0.41%(+3.27)#2,129 |
| 13. | Franconia | 3.63% | 0.53%(+3.10)#97 | 0.41%(+3.22)#2,130 |
| 14. | Fair Lakes | 3.48% | 0.53%(+2.95)#98 | 0.41%(+3.07)#2,131 |
| 15. | Manassas Park | 3.36% | 0.53%(+2.83)#99 | 0.41%(+2.95)#2,132 |
| 16. | Pimmit Hills | 3.17% | 0.53%(+2.64)#100 | 0.41%(+2.76)#2,133 |
| 17. | County Center | 2.98% | 0.53%(+2.45)#101 | 0.41%(+2.57)#2,134 |
| 18. | Woodburn | 2.96% | 0.53%(+2.43)#102 | 0.41%(+2.55)#2,135 |
| 19. | Lorton | 2.94% | 0.53%(+2.41)#103 | 0.41%(+2.54)#2,136 |
| 20. | Kings Park | 2.72% | 0.53%(+2.19)#104 | 0.41%(+2.32)#2,137 |
| 21. | Newington Forest | 2.69% | 0.53%(+2.16)#105 | 0.41%(+2.28)#2,138 |
| 22. | Lincolnia | 2.63% | 0.53%(+2.10)#106 | 0.41%(+2.22)#2,139 |
| 23. | Oak Grove | 2.49% | 0.53%(+1.96)#107 | 0.41%(+2.08)#2,140 |
| 24. | Braddock | 2.41% | 0.53%(+1.88)#108 | 0.41%(+2.00)#2,141 |
| 25. | Fairfax | 2.32% | 0.53%(+1.79)#109 | 0.41%(+1.91)#2,142 |
| 26. | Sterling | 2.28% | 0.53%(+1.75)#110 | 0.41%(+1.87)#2,143 |
| 27. | Idylwood | 2.27% | 0.53%(+1.74)#111 | 0.41%(+1.86)#2,144 |
| 28. | One Loudoun | 2.23% | 0.53%(+1.70)#112 | 0.41%(+1.82)#2,145 |
| 29. | West Springfield | 2.19% | 0.53%(+1.66)#113 | 0.41%(+1.79)#2,146 |
| 30. | South Riding | 2.17% | 0.53%(+1.64)#114 | 0.41%(+1.77)#2,147 |
| 31. | Sugarland Run | 2.12% | 0.53%(+1.59)#115 | 0.41%(+1.71)#2,148 |
| 32. | Dulles Town Center | 2.07% | 0.53%(+1.54)#116 | 0.41%(+1.67)#2,149 |
| 33. | Innsbrook | 2.06% | 0.53%(+1.53)#117 | 0.41%(+1.65)#2,150 |
| 34. | Rivanna | 2.01% | 0.53%(+1.48)#118 | 0.41%(+1.60)#2,151 |
| 35. | Burke Centre | 1.83% | 0.53%(+1.30)#119 | 0.41%(+1.42)#2,152 |
| 36. | Dunn Loring | 1.76% | 0.53%(+1.23)#120 | 0.41%(+1.35)#2,153 |
| 37. | Centreville | 1.76% | 0.53%(+1.23)#121 | 0.41%(+1.35)#2,154 |
| 38. | Merrifield | 1.76% | 0.53%(+1.23)#122 | 0.41%(+1.35)#2,155 |
| 39. | Burke | 1.73% | 0.53%(+1.20)#123 | 0.41%(+1.32)#2,156 |
| 40. | Parrott | 1.71% | 0.53%(+1.18)#124 | 0.41%(+1.31)#2,157 |
| 41. | Laurel | 1.68% | 0.53%(+1.15)#125 | 0.41%(+1.27)#2,710 |
| 42. | Loudoun Valley Estates | 1.65% | 0.53%(+1.11)#126 | 0.41%(+1.24)#2,711 |
| 43. | Atlantic | 1.61% | 0.53%(+1.08)#127 | 0.41%(+1.20)#2,712 |
| 44. | Long Branch | 1.58% | 0.53%(+1.05)#128 | 0.41%(+1.18)#2,713 |
| 45. | Goose Creek | 1.54% | 0.53%(+1.01)#129 | 0.41%(+1.14)#2,714 |
| 46. | Navy | 1.54% | 0.53%(+1.01)#130 | 0.41%(+1.13)#2,715 |
| 47. | Vienna | 1.47% | 0.53%(+0.939)#131 | 0.41%(+1.06)#2,716 |
| 48. | Oakton | 1.46% | 0.53%(+0.934)#132 | 0.41%(+1.06)#2,717 |
| 49. | Lovettsville | 1.43% | 0.53%(+0.895)#133 | 0.41%(+1.02)#2,718 |
| 50. | Stone Ridge | 1.33% | 0.53%(+0.803)#134 | 0.41%(+0.926)#2,719 |
| 51. | Rose Hill Cdp Fairfax County | 1.31% | 0.53%(+0.776)#135 | 0.41%(+0.899)#2,720 |
| 52. | Ashburn | 1.31% | 0.53%(+0.776)#136 | 0.41%(+0.898)#2,721 |
| 53. | Herndon | 1.30% | 0.53%(+0.766)#137 | 0.41%(+0.889)#2,722 |
| 54. | Waynesboro | 1.29% | 0.53%(+0.759)#138 | 0.41%(+0.881)#2,723 |
| 55. | West Point | 1.27% | 0.53%(+0.736)#139 | 0.41%(+0.859)#2,724 |
| 56. | Yorkshire | 1.26% | 0.53%(+0.729)#140 | 0.41%(+0.851)#2,725 |
| 57. | Midlothian | 1.26% | 0.53%(+0.725)#141 | 0.41%(+0.847)#2,726 |
| 58. | Woodlawn Cdp Fairfax County | 1.25% | 0.53%(+0.719)#142 | 0.41%(+0.842)#2,727 |
| 59. | Broadlands | 1.23% | 0.53%(+0.704)#143 | 0.41%(+0.827)#2,728 |
| 60. | Cascades | 1.21% | 0.53%(+0.681)#144 | 0.41%(+0.804)#2,729 |
| 61. | Tuckahoe | 1.20% | 0.53%(+0.668)#145 | 0.41%(+0.791)#2,730 |
| 62. | Brambleton | 1.20% | 0.53%(+0.667)#146 | 0.41%(+0.790)#2,731 |
| 63. | Floris | 1.12% | 0.53%(+0.589)#147 | 0.41%(+0.711)#2,732 |
| 64. | Linton Hall | 1.11% | 0.53%(+0.580)#148 | 0.41%(+0.702)#2,733 |
| 65. | Mantua | 1.05% | 0.53%(+0.519)#149 | 0.41%(+0.641)#2,734 |
| 66. | Kings Park West | 1.04% | 0.53%(+0.511)#150 | 0.41%(+0.634)#2,735 |
| 67. | Blue Ridge | 1.04% | 0.53%(+0.505)#151 | 0.41%(+0.628)#2,736 |
| 68. | Dale City | 1.01% | 0.53%(+0.484)#152 | 0.41%(+0.607)#2,737 |
| 69. | Bull Run | 1.01% | 0.53%(+0.480)#153 | 0.41%(+0.603)#2,738 |
| 70. | Great Falls | 0.98% | 0.53%(+0.452)#154 | 0.41%(+0.574)#2,739 |
| 71. | Buckhall | 0.93% | 0.53%(+0.400)#155 | 0.41%(+0.523)#2,740 |
| 72. | Quantico | 0.92% | 0.53%(+0.390)#156 | 0.41%(+0.513)#2,741 |
| 73. | Tysons | 0.92% | 0.53%(+0.386)#157 | 0.41%(+0.508)#2,742 |
| 74. | Hayfield | 0.91% | 0.53%(+0.381)#158 | 0.41%(+0.504)#2,765 |
| 75. | Colonial Beach | 0.90% | 0.53%(+0.368)#159 | 0.41%(+0.491)#2,766 |
| 76. | Lowes Island | 0.90% | 0.53%(+0.366)#160 | 0.41%(+0.489)#2,767 |
| 77. | Fairfax Station | 0.90% | 0.53%(+0.366)#161 | 0.41%(+0.488)#2,768 |
| 78. | Wyndham | 0.88% | 0.53%(+0.353)#162 | 0.41%(+0.476)#2,769 |
| 79. | Sandston | 0.85% | 0.53%(+0.322)#163 | 0.41%(+0.445)#2,770 |
| 80. | Cherry Hill | 0.84% | 0.53%(+0.305)#164 | 0.41%(+0.428)#2,771 |
| 81. | Lakeside | 0.80% | 0.53%(+0.270)#165 | 0.41%(+0.392)#2,772 |
| 82. | Franklin Farm | 0.80% | 0.53%(+0.268)#166 | 0.41%(+0.391)#2,773 |
| 83. | Huntington | 0.80% | 0.53%(+0.267)#167 | 0.41%(+0.390)#2,774 |
| 84. | Reston | 0.77% | 0.53%(+0.241)#168 | 0.41%(+0.364)#2,775 |
| 85. | Fair Oaks | 0.77% | 0.53%(+0.235)#169 | 0.41%(+0.358)#2,776 |
| 86. | Laurel Hill | 0.74% | 0.53%(+0.205)#170 | 0.41%(+0.328)#2,777 |
| 87. | Triangle | 0.73% | 0.53%(+0.204)#171 | 0.41%(+0.327)#2,778 |
| 88. | Gainesville | 0.71% | 0.53%(+0.177)#172 | 0.41%(+0.299)#2,779 |
| 89. | Sully Square | 0.70% | 0.53%(+0.173)#173 | 0.41%(+0.295)#2,780 |
| 90. | Groveton | 0.70% | 0.53%(+0.167)#174 | 0.41%(+0.290)#2,781 |
| 91. | Hollymead | 0.69% | 0.53%(+0.156)#175 | 0.41%(+0.279)#2,782 |
| 92. | Bailey S Crossroads | 0.67% | 0.53%(+0.135)#176 | 0.41%(+0.258)#2,783 |
| 93. | Glen Allen | 0.66% | 0.53%(+0.134)#177 | 0.41%(+0.257)#2,784 |
| 94. | Sudley | 0.66% | 0.53%(+0.133)#178 | 0.41%(+0.256)#2,785 |
| 95. | New Market | 0.65% | 0.53%(+0.117)#179 | 0.41%(+0.240)#2,786 |
| 96. | Mclean | 0.64% | 0.53%(+0.107)#180 | 0.41%(+0.230)#2,787 |
| 97. | Hybla Valley | 0.62% | 0.53%(+0.094)#181 | 0.41%(+0.217)#2,788 |
| 98. | Wolf Trap | 0.62% | 0.53%(+0.093)#182 | 0.41%(+0.216)#2,789 |
| 99. | Abingdon | 0.62% | 0.53%(+0.093)#183 | 0.41%(+0.215)#2,790 |
| 100. | Belmont | 0.61% | 0.53%(+0.076)#184 | 0.41%(+0.199)#2,791 |
Common Questions
What are the Top 10 Cities with the Highest Percentage of Immigrants from Vietnam in Virginia?
Top 10 Cities with the Highest Percentage of Immigrants from Vietnam in Virginia are:
#1
12.40%
#2
11.93%
#3
7.81%
#4
7.60%
#5
7.12%
#6
6.91%
#7
6.29%
#8
6.09%
#9
4.64%
#10
3.76%
What city has the Highest Percentage of Immigrants from Vietnam in Virginia?
Ravensworth has the Highest Percentage of Immigrants from Vietnam in Virginia with 12.40%.
What is the Percentage of Immigrants from Vietnam in the State of Virginia?
Percentage of Immigrants from Vietnam in Virginia is 0.53%.
What is the Percentage of Immigrants from Vietnam in the United States?
Percentage of Immigrants from Vietnam in the United States is 0.41%.