Cities with the Highest Percentage of Immigrants from Vietnam in Oregon
RELATED REPORTS & OPTIONS
Vietnam
Oregon
Compare Cities
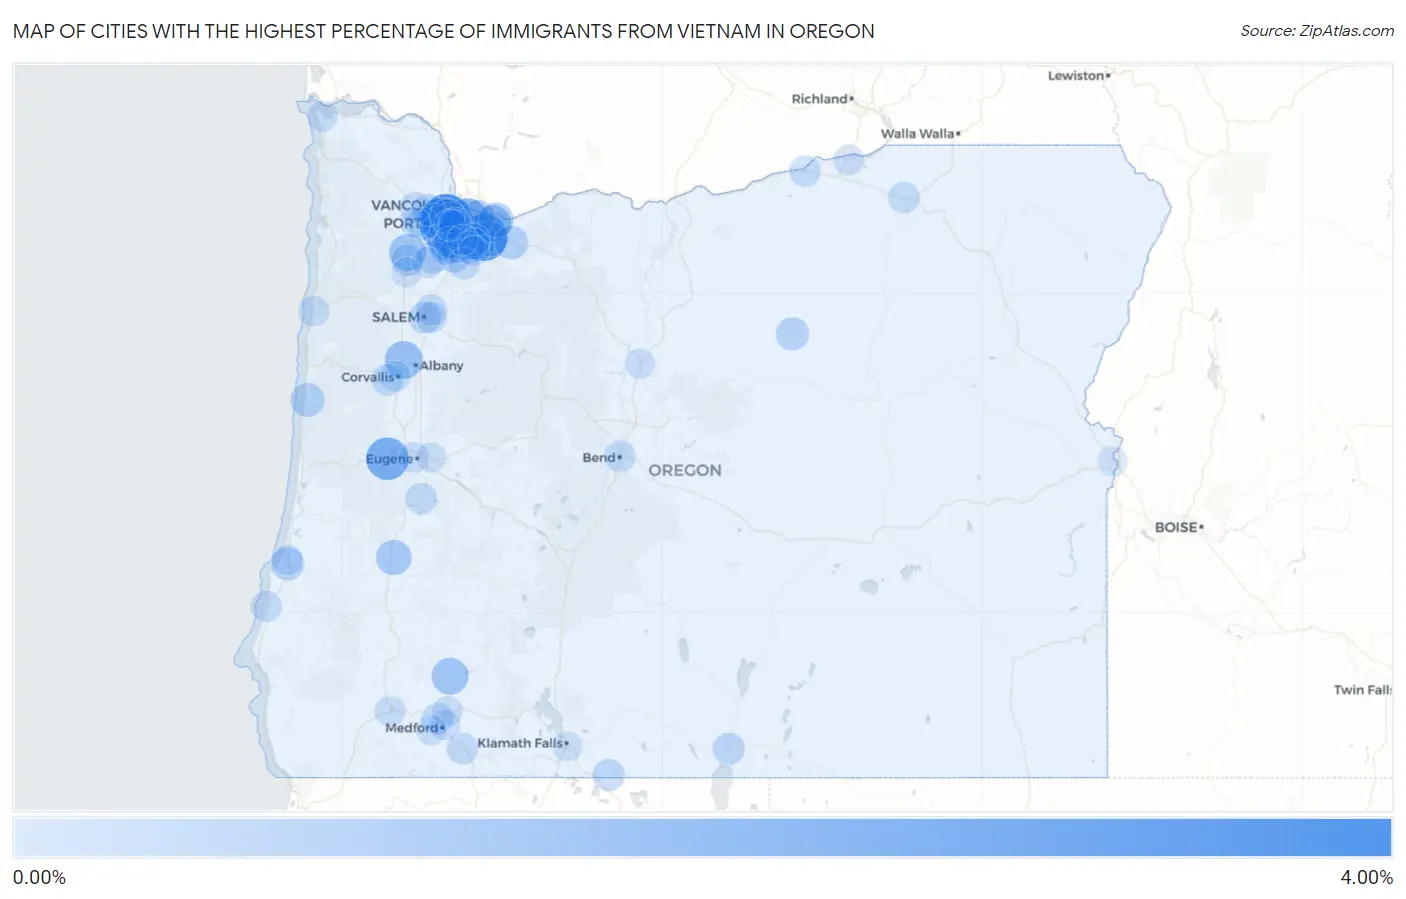
Map of Cities with the Highest Percentage of Immigrants from Vietnam in Oregon
0.00%
4.00%
Cities with the Highest Percentage of Immigrants from Vietnam in Oregon
| City | Vietnam | vs State | vs National | |
| 1. | Oak Hills | 3.25% | 0.53%(+2.72)#-1 | 0.41%(+2.84)#0 |
| 2. | Happy Valley | 2.86% | 0.53%(+2.33)#21 | 0.41%(+2.45)#1,438 |
| 3. | Aloha | 2.35% | 0.53%(+1.81)#38 | 0.41%(+1.94)#2,050 |
| 4. | Veneta | 2.05% | 0.53%(+1.51)#39 | 0.41%(+1.64)#2,051 |
| 5. | Portland | 1.76% | 0.53%(+1.23)#40 | 0.41%(+1.36)#2,052 |
| 6. | Bull Mountain | 1.62% | 0.53%(+1.09)#41 | 0.41%(+1.21)#2,053 |
| 7. | Rockcreek | 1.55% | 0.53%(+1.02)#42 | 0.41%(+1.14)#2,054 |
| 8. | Johnson City | 1.40% | 0.53%(+0.862)#43 | 0.41%(+0.988)#2,055 |
| 9. | Marlene | 1.38% | 0.53%(+0.848)#44 | 0.41%(+0.973)#2,056 |
| 10. | Adair Village | 1.27% | 0.53%(+0.732)#45 | 0.41%(+0.858)#2,057 |
| 11. | Cherry Grove | 1.23% | 0.53%(+0.694)#46 | 0.41%(+0.819)#2,058 |
| 12. | Beaverton | 1.17% | 0.53%(+0.636)#47 | 0.41%(+0.762)#2,059 |
| 13. | Raleigh Hills | 1.13% | 0.53%(+0.595)#48 | 0.41%(+0.720)#2,060 |
| 14. | Gresham | 1.12% | 0.53%(+0.590)#49 | 0.41%(+0.715)#2,061 |
| 15. | Yamhill | 1.10% | 0.53%(+0.564)#50 | 0.41%(+0.690)#2,062 |
| 16. | Trail | 1.09% | 0.53%(+0.553)#51 | 0.41%(+0.679)#2,063 |
| 17. | Tigard | 1.00% | 0.53%(+0.471)#52 | 0.41%(+0.597)#2,166 |
| 18. | Cedar Mill | 0.87% | 0.53%(+0.339)#53 | 0.41%(+0.464)#2,167 |
| 19. | Oakland | 0.85% | 0.53%(+0.321)#54 | 0.41%(+0.446)#2,168 |
| 20. | Heceta Beach | 0.85% | 0.53%(+0.315)#55 | 0.41%(+0.441)#2,169 |
| 21. | Damascus | 0.81% | 0.53%(+0.281)#56 | 0.41%(+0.407)#2,170 |
| 22. | Hillsboro | 0.80% | 0.53%(+0.268)#57 | 0.41%(+0.394)#2,755 |
| 23. | Maywood Park | 0.77% | 0.53%(+0.234)#58 | 0.41%(+0.359)#2,756 |
| 24. | Troutdale | 0.75% | 0.53%(+0.216)#59 | 0.41%(+0.342)#2,757 |
| 25. | Bethany | 0.73% | 0.53%(+0.196)#60 | 0.41%(+0.322)#2,758 |
| 26. | Rivergrove | 0.72% | 0.53%(+0.183)#61 | 0.41%(+0.309)#2,759 |
| 27. | Sandy | 0.62% | 0.53%(+0.086)#62 | 0.41%(+0.212)#2,760 |
| 28. | Waldport | 0.62% | 0.53%(+0.082)#63 | 0.41%(+0.208)#2,761 |
| 29. | Tualatin | 0.59% | 0.53%(+0.053)#64 | 0.41%(+0.179)#2,762 |
| 30. | Spray | 0.50% | 0.53%(-0.031)#65 | 0.41%(+0.095)#2,763 |
| 31. | Coos Bay | 0.48% | 0.53%(-0.057)#66 | 0.41%(+0.069)#2,764 |
| 32. | West Slope | 0.42% | 0.53%(-0.113)#67 | 0.41%(+0.013)#2,765 |
| 33. | Newberg | 0.41% | 0.53%(-0.128)#68 | 0.41%(-0.002)#2,766 |
| 34. | Oatfield | 0.41% | 0.53%(-0.128)#69 | 0.41%(-0.002)#2,767 |
| 35. | Cornelius | 0.39% | 0.53%(-0.141)#70 | 0.41%(-0.015)#2,768 |
| 36. | Wilsonville | 0.38% | 0.53%(-0.156)#71 | 0.41%(-0.031)#2,769 |
| 37. | Sherwood | 0.35% | 0.53%(-0.183)#72 | 0.41%(-0.058)#2,770 |
| 38. | Malin | 0.34% | 0.53%(-0.193)#73 | 0.41%(-0.067)#2,771 |
| 39. | Lakeview | 0.34% | 0.53%(-0.194)#74 | 0.41%(-0.068)#2,772 |
| 40. | West Haven Sylvan | 0.32% | 0.53%(-0.211)#75 | 0.41%(-0.085)#2,773 |
| 41. | King City | 0.32% | 0.53%(-0.217)#76 | 0.41%(-0.092)#2,774 |
| 42. | Salem | 0.31% | 0.53%(-0.221)#77 | 0.41%(-0.095)#2,775 |
| 43. | Carlton | 0.30% | 0.53%(-0.234)#78 | 0.41%(-0.108)#2,776 |
| 44. | West Linn | 0.29% | 0.53%(-0.246)#79 | 0.41%(-0.121)#2,777 |
| 45. | Canby | 0.27% | 0.53%(-0.263)#80 | 0.41%(-0.137)#2,778 |
| 46. | North Plains | 0.27% | 0.53%(-0.266)#81 | 0.41%(-0.140)#2,779 |
| 47. | Philomath | 0.26% | 0.53%(-0.276)#82 | 0.41%(-0.150)#2,780 |
| 48. | Hayesville | 0.24% | 0.53%(-0.295)#83 | 0.41%(-0.169)#2,781 |
| 49. | Pendleton | 0.24% | 0.53%(-0.298)#84 | 0.41%(-0.172)#2,782 |
| 50. | Ashland | 0.23% | 0.53%(-0.300)#85 | 0.41%(-0.174)#2,783 |
| 51. | Cedar Hills | 0.23% | 0.53%(-0.302)#86 | 0.41%(-0.176)#2,914 |
| 52. | Cottage Grove | 0.23% | 0.53%(-0.307)#87 | 0.41%(-0.181)#2,915 |
| 53. | Bend | 0.22% | 0.53%(-0.315)#88 | 0.41%(-0.189)#2,916 |
| 54. | Central Point | 0.21% | 0.53%(-0.324)#89 | 0.41%(-0.198)#2,917 |
| 55. | Boardman | 0.21% | 0.53%(-0.325)#90 | 0.41%(-0.199)#2,918 |
| 56. | Gladstone | 0.20% | 0.53%(-0.333)#91 | 0.41%(-0.208)#2,919 |
| 57. | Banks | 0.20% | 0.53%(-0.338)#92 | 0.41%(-0.212)#2,920 |
| 58. | Bandon | 0.18% | 0.53%(-0.353)#93 | 0.41%(-0.227)#2,921 |
| 59. | Four Corners | 0.15% | 0.53%(-0.379)#94 | 0.41%(-0.253)#2,922 |
| 60. | Corvallis | 0.15% | 0.53%(-0.387)#95 | 0.41%(-0.261)#2,923 |
| 61. | Umatilla | 0.13% | 0.53%(-0.399)#96 | 0.41%(-0.273)#2,924 |
| 62. | Dundee | 0.12% | 0.53%(-0.409)#97 | 0.41%(-0.284)#2,925 |
| 63. | Lincoln City | 0.12% | 0.53%(-0.411)#98 | 0.41%(-0.285)#2,926 |
| 64. | Grants Pass | 0.11% | 0.53%(-0.421)#99 | 0.41%(-0.295)#2,927 |
| 65. | Warrenton | 0.11% | 0.53%(-0.422)#100 | 0.41%(-0.296)#2,928 |
| 66. | North Bend | 0.098% | 0.53%(-0.436)#101 | 0.41%(-0.310)#2,929 |
| 67. | Eugene | 0.091% | 0.53%(-0.443)#102 | 0.41%(-0.317)#2,930 |
| 68. | Lake Oswego | 0.077% | 0.53%(-0.457)#103 | 0.41%(-0.331)#2,931 |
| 69. | Medford | 0.075% | 0.53%(-0.459)#104 | 0.41%(-0.333)#2,932 |
| 70. | Oregon City | 0.072% | 0.53%(-0.461)#105 | 0.41%(-0.335)#2,933 |
| 71. | Madras | 0.067% | 0.53%(-0.467)#106 | 0.41%(-0.341)#2,934 |
| 72. | White City | 0.036% | 0.53%(-0.498)#107 | 0.41%(-0.372)#2,935 |
| 73. | Jacksonville | 0.033% | 0.53%(-0.500)#108 | 0.41%(-0.374)#2,936 |
| 74. | River Road | 0.023% | 0.53%(-0.510)#109 | 0.41%(-0.385)#2,937 |
| 75. | Springfield | 0.023% | 0.53%(-0.511)#110 | 0.41%(-0.385)#2,938 |
| 76. | Klamath Falls | 0.018% | 0.53%(-0.515)#111 | 0.41%(-0.389)#2,939 |
| 77. | Forest Grove | 0.015% | 0.53%(-0.518)#112 | 0.41%(-0.392)#2,940 |
| 78. | Mcminnville | 0.015% | 0.53%(-0.519)#113 | 0.41%(-0.393)#2,941 |
| 79. | Ontario | 0.0086% | 0.53%(-0.525)#114 | 0.41%(-0.399)#2,942 |
Common Questions
What are the Top 10 Cities with the Highest Percentage of Immigrants from Vietnam in Oregon?
Top 10 Cities with the Highest Percentage of Immigrants from Vietnam in Oregon are:
#1
3.25%
#2
2.86%
#3
2.35%
#4
2.05%
#5
1.76%
#6
1.62%
#7
1.55%
#8
1.40%
#9
1.27%
#10
1.17%
What city has the Highest Percentage of Immigrants from Vietnam in Oregon?
Oak Hills has the Highest Percentage of Immigrants from Vietnam in Oregon with 3.25%.
What is the Percentage of Immigrants from Vietnam in the State of Oregon?
Percentage of Immigrants from Vietnam in Oregon is 0.53%.
What is the Percentage of Immigrants from Vietnam in the United States?
Percentage of Immigrants from Vietnam in the United States is 0.41%.