Cities with the Highest Percentage of Immigrants from Vietnam in Missouri
RELATED REPORTS & OPTIONS
Vietnam
Missouri
Compare Cities
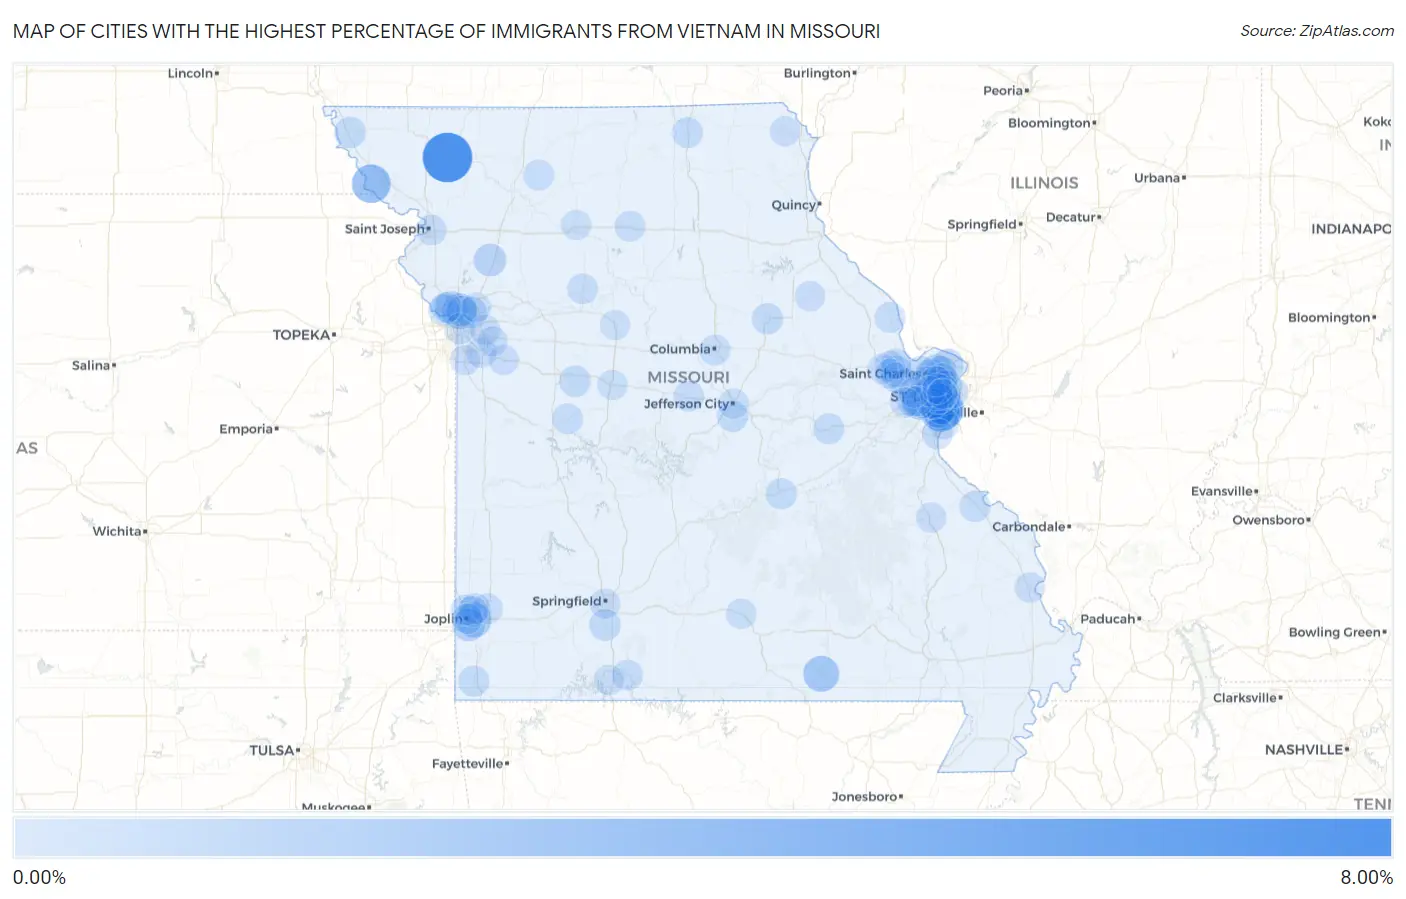
Map of Cities with the Highest Percentage of Immigrants from Vietnam in Missouri
0.00%
8.00%
Cities with the Highest Percentage of Immigrants from Vietnam in Missouri
| City | Vietnam | vs State | vs National | |
| 1. | Conception | 6.77% | 0.17%(+6.59)#-1 | 0.41%(+6.36)#0 |
| 2. | Green Park | 3.65% | 0.17%(+3.47)#0 | 0.41%(+3.24)#1 |
| 3. | Big Lake | 2.90% | 0.17%(+2.72)#1 | 0.41%(+2.49)#2 |
| 4. | Winchester | 2.23% | 0.17%(+2.05)#32 | 0.41%(+1.82)#1,471 |
| 5. | Alton | 1.97% | 0.17%(+1.80)#33 | 0.41%(+1.56)#1,472 |
| 6. | Wilbur Park | 1.88% | 0.17%(+1.70)#34 | 0.41%(+1.47)#1,473 |
| 7. | Oakview | 1.81% | 0.17%(+1.64)#35 | 0.41%(+1.41)#1,474 |
| 8. | Marlborough | 1.81% | 0.17%(+1.63)#36 | 0.41%(+1.40)#1,475 |
| 9. | Duquesne | 1.70% | 0.17%(+1.52)#37 | 0.41%(+1.29)#1,476 |
| 10. | Affton | 1.57% | 0.17%(+1.40)#38 | 0.41%(+1.16)#1,477 |
| 11. | Lemay | 1.19% | 0.17%(+1.02)#54 | 0.41%(+0.783)#2,820 |
| 12. | Hazelwood | 1.05% | 0.17%(+0.876)#55 | 0.41%(+0.642)#2,821 |
| 13. | St John | 1.03% | 0.17%(+0.859)#56 | 0.41%(+0.625)#2,822 |
| 14. | Platte Woods | 0.99% | 0.17%(+0.820)#57 | 0.41%(+0.586)#2,823 |
| 15. | Mehlville | 0.90% | 0.17%(+0.730)#58 | 0.41%(+0.496)#2,824 |
| 16. | Leawood | 0.87% | 0.17%(+0.693)#59 | 0.41%(+0.459)#2,825 |
| 17. | Lathrop | 0.86% | 0.17%(+0.690)#60 | 0.41%(+0.456)#2,826 |
| 18. | Bridgeton | 0.82% | 0.17%(+0.649)#61 | 0.41%(+0.415)#2,827 |
| 19. | Overland | 0.82% | 0.17%(+0.647)#62 | 0.41%(+0.413)#2,828 |
| 20. | Old Jamestown | 0.78% | 0.17%(+0.611)#63 | 0.41%(+0.377)#2,829 |
| 21. | Sappington | 0.71% | 0.17%(+0.536)#64 | 0.41%(+0.303)#2,830 |
| 22. | Velda City | 0.64% | 0.17%(+0.464)#65 | 0.41%(+0.230)#2,831 |
| 23. | Maryland Heights | 0.62% | 0.17%(+0.442)#66 | 0.41%(+0.208)#2,832 |
| 24. | Maplewood | 0.60% | 0.17%(+0.423)#67 | 0.41%(+0.190)#2,833 |
| 25. | O Fallon | 0.56% | 0.17%(+0.385)#68 | 0.41%(+0.151)#2,834 |
| 26. | Claycomo | 0.50% | 0.17%(+0.322)#69 | 0.41%(+0.088)#2,835 |
| 27. | Whiteman Afb | 0.49% | 0.17%(+0.312)#70 | 0.41%(+0.078)#2,836 |
| 28. | Rock Port | 0.47% | 0.17%(+0.297)#71 | 0.41%(+0.063)#2,837 |
| 29. | Nixa | 0.45% | 0.17%(+0.281)#72 | 0.41%(+0.047)#2,838 |
| 30. | St Louis | 0.45% | 0.17%(+0.272)#73 | 0.41%(+0.038)#2,839 |
| 31. | Florissant | 0.43% | 0.17%(+0.254)#74 | 0.41%(+0.020)#2,840 |
| 32. | Manchester | 0.42% | 0.17%(+0.248)#75 | 0.41%(+0.015)#2,841 |
| 33. | Brentwood | 0.42% | 0.17%(+0.242)#76 | 0.41%(+0.008)#2,842 |
| 34. | Mexico | 0.40% | 0.17%(+0.226)#77 | 0.41%(-0.008)#2,843 |
| 35. | Wardsville | 0.37% | 0.17%(+0.193)#78 | 0.41%(-0.041)#2,844 |
| 36. | University City | 0.36% | 0.17%(+0.191)#79 | 0.41%(-0.043)#2,845 |
| 37. | Ozora | 0.36% | 0.17%(+0.190)#80 | 0.41%(-0.044)#2,846 |
| 38. | Concord | 0.35% | 0.17%(+0.181)#81 | 0.41%(-0.053)#2,847 |
| 39. | Parkville | 0.35% | 0.17%(+0.178)#82 | 0.41%(-0.056)#2,848 |
| 40. | Lakeshire | 0.35% | 0.17%(+0.178)#83 | 0.41%(-0.056)#2,849 |
| 41. | Anderson | 0.35% | 0.17%(+0.178)#84 | 0.41%(-0.056)#2,850 |
| 42. | Rolla | 0.33% | 0.17%(+0.161)#85 | 0.41%(-0.073)#2,851 |
| 43. | Gerald | 0.33% | 0.17%(+0.160)#86 | 0.41%(-0.073)#2,852 |
| 44. | Kansas City | 0.33% | 0.17%(+0.156)#87 | 0.41%(-0.078)#2,853 |
| 45. | Carterville | 0.31% | 0.17%(+0.134)#88 | 0.41%(-0.100)#2,854 |
| 46. | Airport Drive | 0.30% | 0.17%(+0.122)#89 | 0.41%(-0.111)#2,855 |
| 47. | Queen City | 0.28% | 0.17%(+0.109)#90 | 0.41%(-0.125)#2,856 |
| 48. | Lee S Summit | 0.28% | 0.17%(+0.106)#91 | 0.41%(-0.127)#2,857 |
| 49. | Calhoun | 0.28% | 0.17%(+0.106)#92 | 0.41%(-0.128)#2,858 |
| 50. | Berkeley | 0.28% | 0.17%(+0.106)#93 | 0.41%(-0.128)#2,859 |
| 51. | Josephville | 0.27% | 0.17%(+0.101)#94 | 0.41%(-0.133)#2,860 |
| 52. | Columbia | 0.27% | 0.17%(+0.100)#95 | 0.41%(-0.134)#2,861 |
| 53. | Elsberry | 0.25% | 0.17%(+0.079)#96 | 0.41%(-0.154)#2,862 |
| 54. | Gladstone | 0.25% | 0.17%(+0.078)#97 | 0.41%(-0.155)#2,863 |
| 55. | Carthage | 0.25% | 0.17%(+0.078)#98 | 0.41%(-0.156)#2,864 |
| 56. | Weatherby Lake | 0.25% | 0.17%(+0.074)#99 | 0.41%(-0.160)#2,865 |
| 57. | Webb City | 0.25% | 0.17%(+0.072)#100 | 0.41%(-0.162)#2,866 |
| 58. | Oakville | 0.25% | 0.17%(+0.072)#101 | 0.41%(-0.162)#2,867 |
| 59. | California | 0.24% | 0.17%(+0.070)#102 | 0.41%(-0.164)#2,868 |
| 60. | Gilman City | 0.24% | 0.17%(+0.069)#103 | 0.41%(-0.165)#2,869 |
| 61. | Brookfield | 0.24% | 0.17%(+0.068)#104 | 0.41%(-0.166)#2,870 |
| 62. | Imperial | 0.24% | 0.17%(+0.068)#105 | 0.41%(-0.166)#2,871 |
| 63. | Weldon Spring | 0.23% | 0.17%(+0.052)#106 | 0.41%(-0.182)#2,872 |
| 64. | Ladue | 0.22% | 0.17%(+0.050)#107 | 0.41%(-0.184)#2,873 |
| 65. | Forsyth | 0.22% | 0.17%(+0.046)#108 | 0.41%(-0.188)#2,874 |
| 66. | Joplin | 0.21% | 0.17%(+0.040)#109 | 0.41%(-0.194)#2,875 |
| 67. | St Joseph | 0.20% | 0.17%(+0.031)#110 | 0.41%(-0.203)#2,876 |
| 68. | Richmond Heights | 0.20% | 0.17%(+0.022)#111 | 0.41%(-0.212)#2,877 |
| 69. | Carrollton | 0.17% | 0.17%(-0.000)#112 | 0.41%(-0.234)#2,878 |
| 70. | St Charles | 0.17% | 0.17%(-0.001)#113 | 0.41%(-0.235)#2,879 |
| 71. | Ellisville | 0.17% | 0.17%(-0.002)#114 | 0.41%(-0.236)#2,880 |
| 72. | Rock Hill | 0.17% | 0.17%(-0.005)#115 | 0.41%(-0.238)#2,881 |
| 73. | St Paul | 0.16% | 0.17%(-0.015)#116 | 0.41%(-0.249)#2,882 |
| 74. | Kirkwood | 0.16% | 0.17%(-0.017)#117 | 0.41%(-0.251)#2,883 |
| 75. | Creve Coeur | 0.16% | 0.17%(-0.019)#118 | 0.41%(-0.252)#2,884 |
| 76. | Lone Jack | 0.15% | 0.17%(-0.023)#119 | 0.41%(-0.257)#2,885 |
| 77. | Springfield | 0.14% | 0.17%(-0.031)#120 | 0.41%(-0.265)#2,886 |
| 78. | Cape Girardeau | 0.13% | 0.17%(-0.041)#121 | 0.41%(-0.274)#2,887 |
| 79. | Jefferson City | 0.13% | 0.17%(-0.043)#122 | 0.41%(-0.276)#2,888 |
| 80. | Chesterfield | 0.12% | 0.17%(-0.049)#123 | 0.41%(-0.283)#2,889 |
| 81. | Independence | 0.12% | 0.17%(-0.049)#124 | 0.41%(-0.283)#2,890 |
| 82. | Chillicothe | 0.12% | 0.17%(-0.053)#125 | 0.41%(-0.287)#2,891 |
| 83. | Cabool | 0.12% | 0.17%(-0.056)#126 | 0.41%(-0.290)#2,892 |
| 84. | Dardenne Prairie | 0.12% | 0.17%(-0.058)#127 | 0.41%(-0.291)#2,893 |
| 85. | Ballwin | 0.11% | 0.17%(-0.061)#128 | 0.41%(-0.295)#2,894 |
| 86. | Olivette | 0.11% | 0.17%(-0.067)#129 | 0.41%(-0.301)#2,895 |
| 87. | Kahoka | 0.094% | 0.17%(-0.080)#130 | 0.41%(-0.314)#2,896 |
| 88. | St Ann | 0.093% | 0.17%(-0.081)#131 | 0.41%(-0.315)#2,897 |
| 89. | Vandalia | 0.089% | 0.17%(-0.085)#132 | 0.41%(-0.319)#2,898 |
| 90. | Wildwood | 0.082% | 0.17%(-0.092)#133 | 0.41%(-0.325)#2,899 |
| 91. | Branson | 0.079% | 0.17%(-0.095)#134 | 0.41%(-0.329)#2,900 |
| 92. | Farmington | 0.078% | 0.17%(-0.095)#135 | 0.41%(-0.329)#2,901 |
| 93. | Sedalia | 0.078% | 0.17%(-0.096)#136 | 0.41%(-0.330)#2,902 |
| 94. | Clayton | 0.070% | 0.17%(-0.104)#137 | 0.41%(-0.338)#2,963 |
| 95. | Blue Springs | 0.068% | 0.17%(-0.106)#138 | 0.41%(-0.340)#2,964 |
| 96. | Grandview | 0.058% | 0.17%(-0.116)#139 | 0.41%(-0.350)#2,965 |
| 97. | Liberty | 0.056% | 0.17%(-0.118)#140 | 0.41%(-0.352)#2,966 |
| 98. | Wentzville | 0.054% | 0.17%(-0.120)#141 | 0.41%(-0.354)#2,967 |
| 99. | Marshall | 0.051% | 0.17%(-0.123)#142 | 0.41%(-0.356)#2,968 |
| 100. | Lake St Louis | 0.047% | 0.17%(-0.127)#143 | 0.41%(-0.361)#2,969 |
Common Questions
What are the Top 10 Cities with the Highest Percentage of Immigrants from Vietnam in Missouri?
Top 10 Cities with the Highest Percentage of Immigrants from Vietnam in Missouri are:
#1
6.77%
#2
3.65%
#3
2.90%
#4
2.23%
#5
1.97%
#6
1.88%
#7
1.81%
#8
1.81%
#9
1.70%
#10
1.57%
What city has the Highest Percentage of Immigrants from Vietnam in Missouri?
Conception has the Highest Percentage of Immigrants from Vietnam in Missouri with 6.77%.
What is the Percentage of Immigrants from Vietnam in the State of Missouri?
Percentage of Immigrants from Vietnam in Missouri is 0.17%.
What is the Percentage of Immigrants from Vietnam in the United States?
Percentage of Immigrants from Vietnam in the United States is 0.41%.