Cities with the Highest Percentage of Immigrants from Eastern Africa in Virginia
RELATED REPORTS & OPTIONS
Eastern Africa
Virginia
Compare Cities
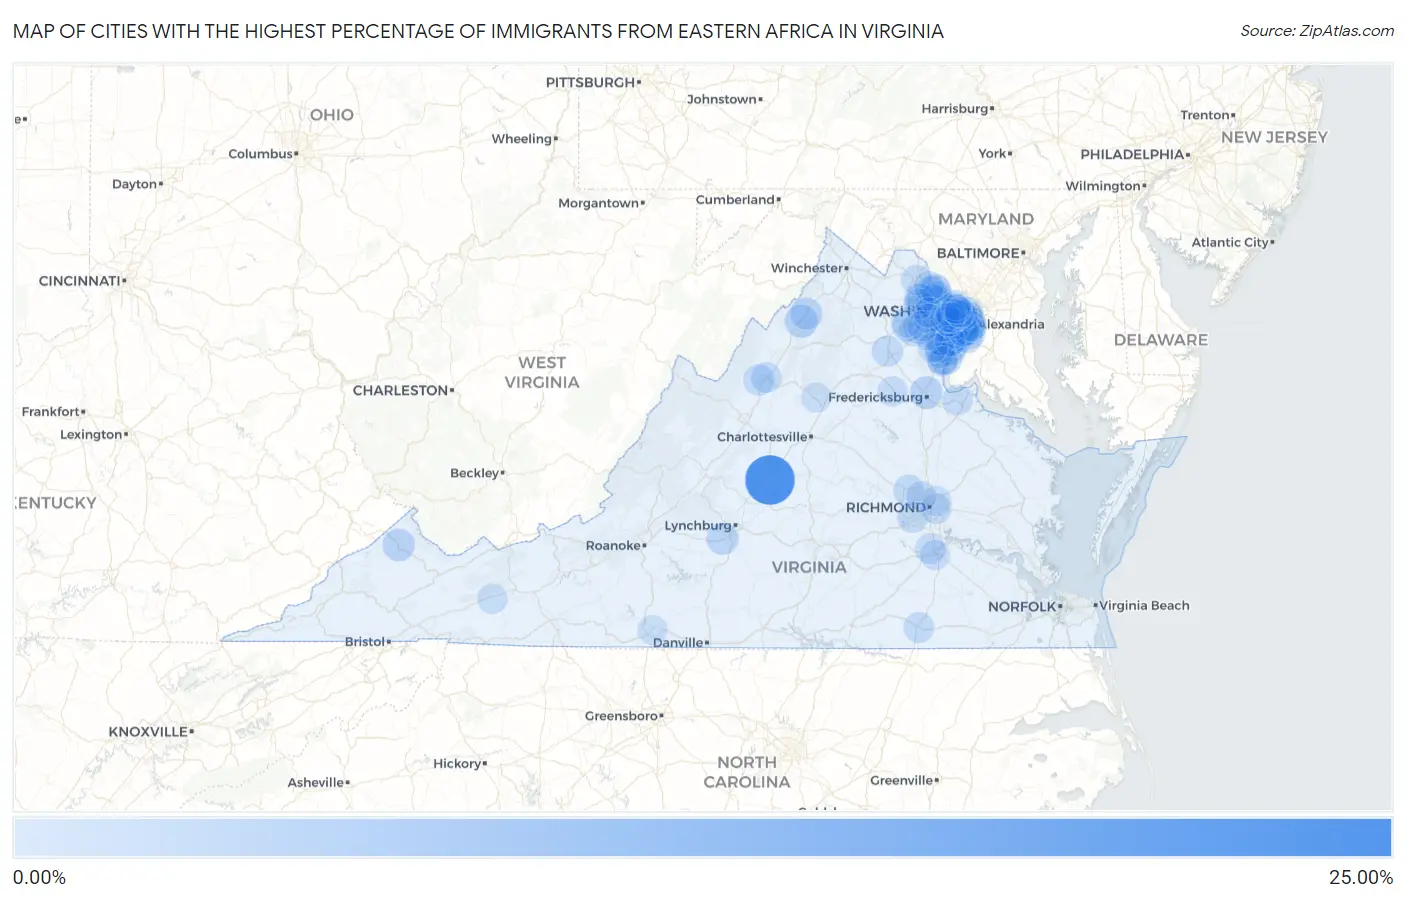
Map of Cities with the Highest Percentage of Immigrants from Eastern Africa in Virginia
0.00%
25.00%
Cities with the Highest Percentage of Immigrants from Eastern Africa in Virginia
| City | Eastern Africa | vs State | vs National | |
| 1. | Shipman | 24.37% | 0.54%(+23.8)#-1 | 0.23%(+24.1)#0 |
| 2. | Innovation | 9.94% | 0.54%(+9.40)#0 | 0.23%(+9.71)#1 |
| 3. | Lincolnia | 7.97% | 0.54%(+7.44)#1 | 0.23%(+7.75)#2 |
| 4. | Bailey S Crossroads | 7.08% | 0.54%(+6.55)#4 | 0.23%(+6.86)#52 |
| 5. | Woodlawn Cdp Fairfax County | 5.56% | 0.54%(+5.02)#5 | 0.23%(+5.33)#53 |
| 6. | Kingstowne | 4.76% | 0.54%(+4.22)#6 | 0.23%(+4.53)#54 |
| 7. | Alexandria | 4.70% | 0.54%(+4.16)#12 | 0.23%(+4.47)#199 |
| 8. | Newington | 4.56% | 0.54%(+4.03)#13 | 0.23%(+4.34)#200 |
| 9. | Woodbridge | 4.12% | 0.54%(+3.58)#14 | 0.23%(+3.89)#201 |
| 10. | Mcnair | 3.88% | 0.54%(+3.34)#15 | 0.23%(+3.65)#202 |
| 11. | Bull Run | 3.77% | 0.54%(+3.23)#16 | 0.23%(+3.54)#203 |
| 12. | Edinburg | 3.71% | 0.54%(+3.17)#17 | 0.23%(+3.48)#204 |
| 13. | Franconia | 3.66% | 0.54%(+3.13)#18 | 0.23%(+3.44)#205 |
| 14. | Lake Ridge | 3.28% | 0.54%(+2.74)#19 | 0.23%(+3.05)#259 |
| 15. | Lorton | 3.24% | 0.54%(+2.70)#20 | 0.23%(+3.01)#260 |
| 16. | Grundy | 3.09% | 0.54%(+2.55)#21 | 0.23%(+2.86)#261 |
| 17. | Falmouth | 3.05% | 0.54%(+2.51)#22 | 0.23%(+2.82)#262 |
| 18. | Laurel Hill | 2.75% | 0.54%(+2.21)#23 | 0.23%(+2.53)#263 |
| 19. | Woodstock | 2.60% | 0.54%(+2.07)#24 | 0.23%(+2.38)#264 |
| 20. | Annandale | 2.60% | 0.54%(+2.06)#25 | 0.23%(+2.37)#265 |
| 21. | Springfield | 2.60% | 0.54%(+2.06)#26 | 0.23%(+2.37)#266 |
| 22. | Cherry Hill | 2.59% | 0.54%(+2.05)#27 | 0.23%(+2.36)#267 |
| 23. | Timberlake | 2.52% | 0.54%(+1.98)#28 | 0.23%(+2.29)#268 |
| 24. | Dumfries | 2.51% | 0.54%(+1.97)#29 | 0.23%(+2.28)#269 |
| 25. | West Springfield | 2.36% | 0.54%(+1.82)#30 | 0.23%(+2.13)#270 |
| 26. | Idylwood | 2.29% | 0.54%(+1.76)#31 | 0.23%(+2.07)#271 |
| 27. | Fair Oaks | 2.22% | 0.54%(+1.68)#32 | 0.23%(+1.99)#272 |
| 28. | Lake Barcroft | 2.16% | 0.54%(+1.62)#33 | 0.23%(+1.93)#273 |
| 29. | Hybla Valley | 2.08% | 0.54%(+1.54)#34 | 0.23%(+1.86)#274 |
| 30. | Dayton | 1.67% | 0.54%(+1.13)#35 | 0.23%(+1.44)#275 |
| 31. | Burke | 1.66% | 0.54%(+1.12)#36 | 0.23%(+1.43)#276 |
| 32. | Mount Vernon | 1.62% | 0.54%(+1.08)#37 | 0.23%(+1.39)#277 |
| 33. | Opal | 1.59% | 0.54%(+1.05)#38 | 0.23%(+1.36)#278 |
| 34. | Oakton | 1.55% | 0.54%(+1.01)#39 | 0.23%(+1.32)#279 |
| 35. | Herndon | 1.55% | 0.54%(+1.01)#40 | 0.23%(+1.32)#280 |
| 36. | Arlington | 1.48% | 0.54%(+0.946)#41 | 0.23%(+1.26)#281 |
| 37. | Fair Lakes | 1.48% | 0.54%(+0.942)#42 | 0.23%(+1.25)#282 |
| 38. | Short Pump | 1.45% | 0.54%(+0.916)#43 | 0.23%(+1.23)#283 |
| 39. | Leesylvania | 1.36% | 0.54%(+0.819)#44 | 0.23%(+1.13)#284 |
| 40. | Sully Square | 1.29% | 0.54%(+0.751)#45 | 0.23%(+1.06)#285 |
| 41. | Groveton | 1.24% | 0.54%(+0.700)#46 | 0.23%(+1.01)#286 |
| 42. | Rockwood | 1.20% | 0.54%(+0.663)#47 | 0.23%(+0.974)#287 |
| 43. | Gainesville | 1.18% | 0.54%(+0.646)#48 | 0.23%(+0.957)#288 |
| 44. | Dale City | 1.13% | 0.54%(+0.587)#49 | 0.23%(+0.898)#289 |
| 45. | Vienna | 1.12% | 0.54%(+0.578)#50 | 0.23%(+0.889)#290 |
| 46. | King George | 1.08% | 0.54%(+0.540)#51 | 0.23%(+0.850)#291 |
| 47. | Harrisonburg | 1.07% | 0.54%(+0.530)#52 | 0.23%(+0.841)#292 |
| 48. | Emporia | 1.06% | 0.54%(+0.518)#53 | 0.23%(+0.829)#293 |
| 49. | Reston | 1.05% | 0.54%(+0.514)#54 | 0.23%(+0.825)#294 |
| 50. | Montclair | 1.04% | 0.54%(+0.499)#55 | 0.23%(+0.810)#295 |
| 51. | Kings Park West | 1.03% | 0.54%(+0.496)#56 | 0.23%(+0.806)#296 |
| 52. | Newington Forest | 1.01% | 0.54%(+0.474)#57 | 0.23%(+0.785)#297 |
| 53. | County Center | 0.99% | 0.54%(+0.456)#58 | 0.23%(+0.767)#298 |
| 54. | Fairfax Station | 0.99% | 0.54%(+0.448)#59 | 0.23%(+0.758)#299 |
| 55. | Sugarland Run | 0.98% | 0.54%(+0.445)#60 | 0.23%(+0.756)#300 |
| 56. | Burke Centre | 0.93% | 0.54%(+0.388)#61 | 0.23%(+0.699)#301 |
| 57. | North Springfield | 0.93% | 0.54%(+0.387)#62 | 0.23%(+0.698)#302 |
| 58. | Navy | 0.91% | 0.54%(+0.369)#63 | 0.23%(+0.680)#303 |
| 59. | Linton Hall | 0.88% | 0.54%(+0.338)#64 | 0.23%(+0.649)#304 |
| 60. | Dulles Town Center | 0.87% | 0.54%(+0.329)#65 | 0.23%(+0.640)#305 |
| 61. | Hayfield | 0.87% | 0.54%(+0.328)#66 | 0.23%(+0.638)#306 |
| 62. | Seven Corners | 0.86% | 0.54%(+0.326)#67 | 0.23%(+0.637)#307 |
| 63. | South Riding | 0.85% | 0.54%(+0.313)#68 | 0.23%(+0.624)#308 |
| 64. | Loudoun Valley Estates | 0.81% | 0.54%(+0.270)#69 | 0.23%(+0.581)#309 |
| 65. | Montrose | 0.80% | 0.54%(+0.263)#70 | 0.23%(+0.574)#310 |
| 66. | Tysons | 0.78% | 0.54%(+0.244)#71 | 0.23%(+0.555)#311 |
| 67. | Huntington | 0.77% | 0.54%(+0.231)#72 | 0.23%(+0.542)#312 |
| 68. | Brambleton | 0.77% | 0.54%(+0.230)#73 | 0.23%(+0.540)#313 |
| 69. | Rose Hill Cdp Fairfax County | 0.75% | 0.54%(+0.207)#74 | 0.23%(+0.518)#314 |
| 70. | Hutchison | 0.73% | 0.54%(+0.196)#75 | 0.23%(+0.507)#315 |
| 71. | Dranesville | 0.72% | 0.54%(+0.186)#76 | 0.23%(+0.497)#316 |
| 72. | Woodburn | 0.72% | 0.54%(+0.185)#77 | 0.23%(+0.496)#317 |
| 73. | Leesburg | 0.70% | 0.54%(+0.157)#78 | 0.23%(+0.468)#318 |
| 74. | Lake Of The Woods | 0.69% | 0.54%(+0.156)#79 | 0.23%(+0.467)#319 |
| 75. | Ettrick | 0.69% | 0.54%(+0.154)#80 | 0.23%(+0.465)#320 |
| 76. | Buckhall | 0.67% | 0.54%(+0.129)#81 | 0.23%(+0.440)#321 |
| 77. | Arcola | 0.66% | 0.54%(+0.119)#82 | 0.23%(+0.429)#322 |
| 78. | West Falls Church | 0.63% | 0.54%(+0.092)#83 | 0.23%(+0.403)#323 |
| 79. | East Highland Park | 0.59% | 0.54%(+0.056)#84 | 0.23%(+0.367)#324 |
| 80. | Haymarket | 0.57% | 0.54%(+0.035)#85 | 0.23%(+0.345)#325 |
| 81. | Occoquan | 0.56% | 0.54%(+0.022)#86 | 0.23%(+0.332)#326 |
| 82. | Cascades | 0.53% | 0.54%(-0.012)#87 | 0.23%(+0.299)#327 |
| 83. | Centreville | 0.51% | 0.54%(-0.026)#88 | 0.23%(+0.285)#328 |
| 84. | Sudley | 0.51% | 0.54%(-0.030)#89 | 0.23%(+0.281)#329 |
| 85. | Long Branch | 0.50% | 0.54%(-0.040)#90 | 0.23%(+0.270)#330 |
| 86. | Rural Retreat | 0.46% | 0.54%(-0.081)#91 | 0.23%(+0.230)#331 |
| 87. | University Center | 0.45% | 0.54%(-0.088)#92 | 0.23%(+0.223)#332 |
| 88. | Merrifield | 0.45% | 0.54%(-0.091)#93 | 0.23%(+0.219)#333 |
| 89. | Martinsville | 0.44% | 0.54%(-0.095)#94 | 0.23%(+0.216)#334 |
| 90. | Fairfax | 0.42% | 0.54%(-0.113)#95 | 0.23%(+0.198)#335 |
| 91. | Triangle | 0.41% | 0.54%(-0.125)#96 | 0.23%(+0.186)#336 |
| 92. | Stanardsville | 0.41% | 0.54%(-0.131)#97 | 0.23%(+0.179)#337 |
| 93. | Chantilly | 0.39% | 0.54%(-0.148)#98 | 0.23%(+0.162)#338 |
| 94. | Mclean | 0.38% | 0.54%(-0.157)#99 | 0.23%(+0.154)#339 |
| 95. | Mantua | 0.37% | 0.54%(-0.166)#100 | 0.23%(+0.145)#340 |
| 96. | Falls Church | 0.36% | 0.54%(-0.174)#101 | 0.23%(+0.136)#341 |
| 97. | Dumbarton | 0.36% | 0.54%(-0.175)#102 | 0.23%(+0.135)#342 |
| 98. | Independent Hill | 0.36% | 0.54%(-0.183)#103 | 0.23%(+0.128)#343 |
| 99. | Pimmit Hills | 0.35% | 0.54%(-0.184)#104 | 0.23%(+0.127)#344 |
| 100. | Petersburg | 0.33% | 0.54%(-0.204)#105 | 0.23%(+0.106)#345 |
Common Questions
What are the Top 10 Cities with the Highest Percentage of Immigrants from Eastern Africa in Virginia?
Top 10 Cities with the Highest Percentage of Immigrants from Eastern Africa in Virginia are:
#1
24.37%
#2
7.97%
#3
7.08%
#4
4.76%
#5
4.70%
#6
4.56%
#7
4.12%
#8
3.88%
#9
3.77%
#10
3.71%
What city has the Highest Percentage of Immigrants from Eastern Africa in Virginia?
Shipman has the Highest Percentage of Immigrants from Eastern Africa in Virginia with 24.37%.
What is the Percentage of Immigrants from Eastern Africa in the State of Virginia?
Percentage of Immigrants from Eastern Africa in Virginia is 0.54%.
What is the Percentage of Immigrants from Eastern Africa in the United States?
Percentage of Immigrants from Eastern Africa in the United States is 0.23%.