Cities with the Highest Percentage of Immigrants from Eastern Africa in Oklahoma
RELATED REPORTS & OPTIONS
Eastern Africa
Oklahoma
Compare Cities
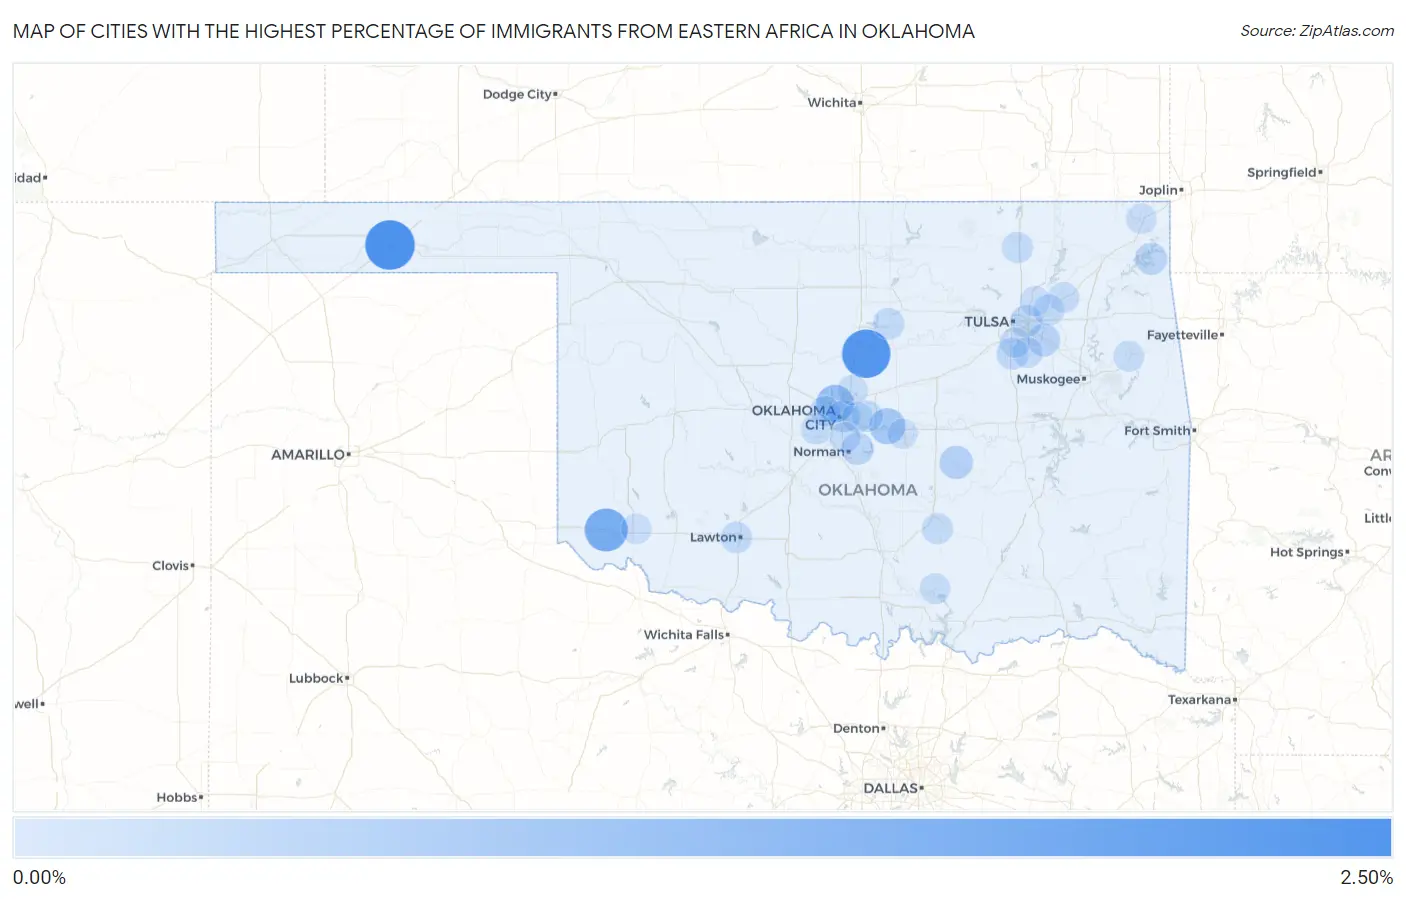
Map of Cities with the Highest Percentage of Immigrants from Eastern Africa in Oklahoma
0.00%
2.50%
Cities with the Highest Percentage of Immigrants from Eastern Africa in Oklahoma
| City | Eastern Africa | vs State | vs National | |
| 1. | Guymon | 2.21% | 0.11%(+2.10)#-1 | 0.23%(+1.98)#0 |
| 2. | Langston | 2.07% | 0.11%(+1.96)#0 | 0.23%(+1.84)#1 |
| 3. | East Duke | 1.45% | 0.11%(+1.34)#1 | 0.23%(+1.22)#2 |
| 4. | Canadian Shores | 1.07% | 0.11%(+0.961)#2 | 0.23%(+0.840)#3 |
| 5. | The Village | 0.84% | 0.11%(+0.737)#3 | 0.23%(+0.617)#4 |
| 6. | Mcloud | 0.64% | 0.11%(+0.530)#4 | 0.23%(+0.410)#5 |
| 7. | Wewoka | 0.35% | 0.11%(+0.245)#5 | 0.23%(+0.125)#6 |
| 8. | Broken Arrow | 0.28% | 0.11%(+0.171)#6 | 0.23%(+0.050)#7 |
| 9. | Norman | 0.22% | 0.11%(+0.117)#7 | 0.23%(-0.003)#8 |
| 10. | Oklahoma City | 0.22% | 0.11%(+0.116)#8 | 0.23%(-0.005)#340 |
| 11. | Tulsa | 0.22% | 0.11%(+0.109)#9 | 0.23%(-0.011)#341 |
| 12. | Grove | 0.21% | 0.11%(+0.107)#10 | 0.23%(-0.013)#342 |
| 13. | Glenpool | 0.19% | 0.11%(+0.083)#11 | 0.23%(-0.037)#343 |
| 14. | Lawton | 0.14% | 0.11%(+0.037)#12 | 0.23%(-0.083)#344 |
| 15. | Stillwater | 0.14% | 0.11%(+0.037)#13 | 0.23%(-0.083)#345 |
| 16. | Choctaw | 0.12% | 0.11%(+0.008)#14 | 0.23%(-0.112)#346 |
| 17. | Bartlesville | 0.11% | 0.11%(+0.003)#15 | 0.23%(-0.117)#347 |
| 18. | Ada | 0.10% | 0.11%(-0.004)#16 | 0.23%(-0.124)#348 |
| 19. | Mustang | 0.10% | 0.11%(-0.004)#17 | 0.23%(-0.125)#349 |
| 20. | Verdigris | 0.094% | 0.11%(-0.013)#18 | 0.23%(-0.133)#350 |
| 21. | Midwest City | 0.084% | 0.11%(-0.022)#19 | 0.23%(-0.143)#351 |
| 22. | Tahlequah | 0.079% | 0.11%(-0.027)#20 | 0.23%(-0.148)#352 |
| 23. | Moore | 0.077% | 0.11%(-0.030)#21 | 0.23%(-0.151)#353 |
| 24. | Tishomingo | 0.064% | 0.11%(-0.042)#22 | 0.23%(-0.163)#354 |
| 25. | Claremore | 0.056% | 0.11%(-0.051)#23 | 0.23%(-0.171)#355 |
| 26. | Bixby | 0.056% | 0.11%(-0.051)#24 | 0.23%(-0.172)#356 |
| 27. | Owasso | 0.050% | 0.11%(-0.057)#25 | 0.23%(-0.177)#357 |
| 28. | Edmond | 0.050% | 0.11%(-0.057)#26 | 0.23%(-0.177)#358 |
| 29. | Bethany | 0.039% | 0.11%(-0.068)#27 | 0.23%(-0.188)#359 |
| 30. | Altus | 0.037% | 0.11%(-0.069)#28 | 0.23%(-0.190)#360 |
| 31. | Jenks | 0.031% | 0.11%(-0.076)#29 | 0.23%(-0.196)#361 |
| 32. | Miami | 0.031% | 0.11%(-0.076)#30 | 0.23%(-0.196)#362 |
| 33. | Shawnee | 0.0096% | 0.11%(-0.097)#31 | 0.23%(-0.218)#363 |
Common Questions
What are the Top 10 Cities with the Highest Percentage of Immigrants from Eastern Africa in Oklahoma?
Top 10 Cities with the Highest Percentage of Immigrants from Eastern Africa in Oklahoma are:
#1
2.21%
#2
2.07%
#3
1.45%
#4
0.84%
#5
0.64%
#6
0.35%
#7
0.28%
#8
0.22%
#9
0.22%
#10
0.22%
What city has the Highest Percentage of Immigrants from Eastern Africa in Oklahoma?
Guymon has the Highest Percentage of Immigrants from Eastern Africa in Oklahoma with 2.21%.
What is the Percentage of Immigrants from Eastern Africa in the State of Oklahoma?
Percentage of Immigrants from Eastern Africa in Oklahoma is 0.11%.
What is the Percentage of Immigrants from Eastern Africa in the United States?
Percentage of Immigrants from Eastern Africa in the United States is 0.23%.