Cities with the Highest Percentage of Immigrants from Eastern Africa in Florida
RELATED REPORTS & OPTIONS
Eastern Africa
Florida
Compare Cities
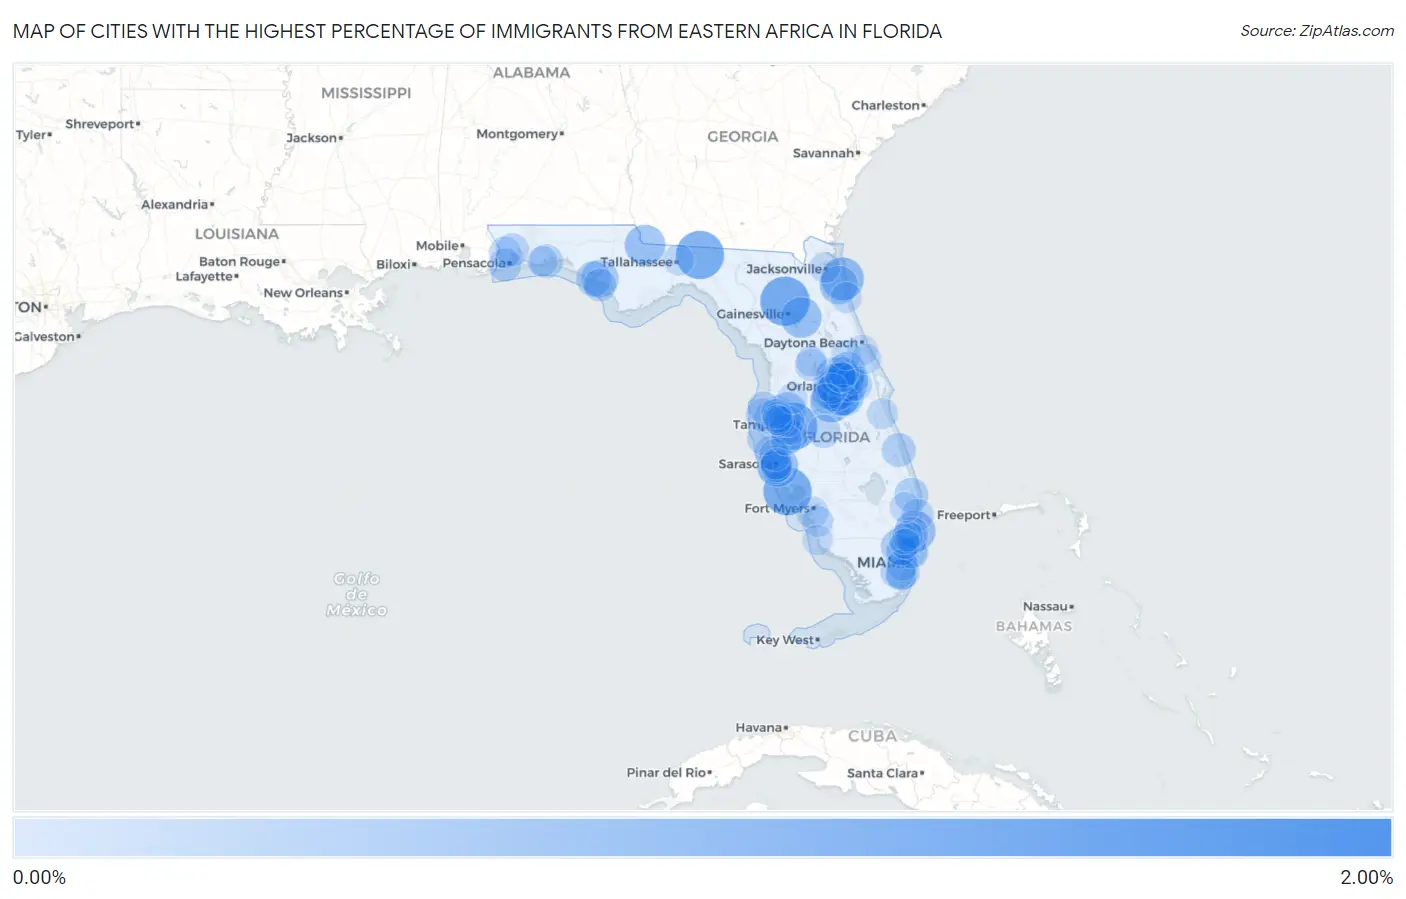
Map of Cities with the Highest Percentage of Immigrants from Eastern Africa in Florida
0.00%
2.00%
Cities with the Highest Percentage of Immigrants from Eastern Africa in Florida
| City | Eastern Africa | vs State | vs National | |
| 1. | Old Miakka | 1.84% | 0.072%(+1.77)#-1 | 0.23%(+1.61)#0 |
| 2. | La Crosse | 1.23% | 0.072%(+1.16)#0 | 0.23%(+1.000)#1 |
| 3. | Monticello | 1.16% | 0.072%(+1.09)#1 | 0.23%(+0.932)#2 |
| 4. | Grove City | 1.15% | 0.072%(+1.08)#2 | 0.23%(+0.924)#3 |
| 5. | Valrico | 1.09% | 0.072%(+1.02)#3 | 0.23%(+0.864)#4 |
| 6. | Sawgrass | 0.84% | 0.072%(+0.769)#4 | 0.23%(+0.613)#5 |
| 7. | Celebration | 0.81% | 0.072%(+0.734)#5 | 0.23%(+0.579)#6 |
| 8. | South Gate Ridge | 0.75% | 0.072%(+0.677)#6 | 0.23%(+0.522)#7 |
| 9. | Orlovista | 0.74% | 0.072%(+0.664)#7 | 0.23%(+0.508)#8 |
| 10. | Lighthouse Point | 0.73% | 0.072%(+0.662)#8 | 0.23%(+0.506)#9 |
| 11. | Hawthorne | 0.71% | 0.072%(+0.641)#9 | 0.23%(+0.486)#10 |
| 12. | Chattahoochee | 0.71% | 0.072%(+0.634)#10 | 0.23%(+0.479)#11 |
| 13. | Meadow Woods | 0.67% | 0.072%(+0.601)#11 | 0.23%(+0.446)#12 |
| 14. | Southchase | 0.63% | 0.072%(+0.557)#12 | 0.23%(+0.402)#13 |
| 15. | Winter Park | 0.61% | 0.072%(+0.542)#13 | 0.23%(+0.386)#14 |
| 16. | Oak Ridge | 0.61% | 0.072%(+0.541)#14 | 0.23%(+0.386)#15 |
| 17. | Nocatee | 0.59% | 0.072%(+0.516)#15 | 0.23%(+0.361)#16 |
| 18. | Doctor Phillips | 0.57% | 0.072%(+0.498)#16 | 0.23%(+0.343)#17 |
| 19. | Pebble Creek | 0.54% | 0.072%(+0.466)#17 | 0.23%(+0.310)#18 |
| 20. | Cedar Grove | 0.53% | 0.072%(+0.458)#18 | 0.23%(+0.303)#19 |
| 21. | Sanford | 0.47% | 0.072%(+0.393)#19 | 0.23%(+0.238)#20 |
| 22. | Union Park | 0.45% | 0.072%(+0.381)#20 | 0.23%(+0.226)#21 |
| 23. | Southwest Ranches | 0.42% | 0.072%(+0.350)#21 | 0.23%(+0.194)#22 |
| 24. | Upper Grand Lagoon | 0.40% | 0.072%(+0.332)#22 | 0.23%(+0.177)#23 |
| 25. | Apopka | 0.40% | 0.072%(+0.324)#23 | 0.23%(+0.169)#24 |
| 26. | Palm Beach Gardens | 0.35% | 0.072%(+0.277)#24 | 0.23%(+0.121)#25 |
| 27. | Lockhart | 0.35% | 0.072%(+0.274)#25 | 0.23%(+0.119)#26 |
| 28. | Three Lakes | 0.34% | 0.072%(+0.272)#26 | 0.23%(+0.116)#27 |
| 29. | Maitland | 0.34% | 0.072%(+0.271)#27 | 0.23%(+0.115)#28 |
| 30. | Westchase | 0.34% | 0.072%(+0.266)#28 | 0.23%(+0.110)#29 |
| 31. | Lakewood Park | 0.33% | 0.072%(+0.261)#29 | 0.23%(+0.106)#30 |
| 32. | Palmetto Bay | 0.33% | 0.072%(+0.258)#30 | 0.23%(+0.102)#31 |
| 33. | Winter Springs | 0.33% | 0.072%(+0.255)#31 | 0.23%(+0.100)#32 |
| 34. | Lake Lorraine | 0.32% | 0.072%(+0.249)#32 | 0.23%(+0.094)#33 |
| 35. | Ives Estates | 0.32% | 0.072%(+0.249)#33 | 0.23%(+0.094)#34 |
| 36. | Balm | 0.31% | 0.072%(+0.243)#34 | 0.23%(+0.088)#35 |
| 37. | West Bradenton | 0.30% | 0.072%(+0.233)#35 | 0.23%(+0.078)#36 |
| 38. | Southgate | 0.29% | 0.072%(+0.219)#36 | 0.23%(+0.064)#37 |
| 39. | Siesta Key | 0.29% | 0.072%(+0.217)#37 | 0.23%(+0.062)#38 |
| 40. | Alturas | 0.29% | 0.072%(+0.217)#38 | 0.23%(+0.062)#39 |
| 41. | Horizon West | 0.29% | 0.072%(+0.215)#39 | 0.23%(+0.059)#40 |
| 42. | St Pete Beach | 0.28% | 0.072%(+0.209)#40 | 0.23%(+0.054)#41 |
| 43. | Warrington | 0.28% | 0.072%(+0.206)#41 | 0.23%(+0.050)#42 |
| 44. | Pace | 0.28% | 0.072%(+0.205)#42 | 0.23%(+0.050)#43 |
| 45. | Palm Harbor | 0.28% | 0.072%(+0.204)#43 | 0.23%(+0.049)#44 |
| 46. | Tyndall Afb | 0.27% | 0.072%(+0.196)#44 | 0.23%(+0.041)#45 |
| 47. | Winter Garden | 0.24% | 0.072%(+0.169)#45 | 0.23%(+0.014)#46 |
| 48. | Heathrow | 0.24% | 0.072%(+0.168)#46 | 0.23%(+0.013)#47 |
| 49. | Progress Village | 0.24% | 0.072%(+0.166)#47 | 0.23%(+0.010)#113 |
| 50. | Ocean Ridge | 0.23% | 0.072%(+0.162)#48 | 0.23%(+0.006)#114 |
| 51. | Fruitland Park | 0.23% | 0.072%(+0.159)#49 | 0.23%(+0.004)#115 |
| 52. | Cheval | 0.23% | 0.072%(+0.156)#50 | 0.23%(+0.000)#116 |
| 53. | South Sarasota | 0.23% | 0.072%(+0.155)#51 | 0.23%(-0.001)#117 |
| 54. | Gonzalez | 0.22% | 0.072%(+0.149)#52 | 0.23%(-0.006)#118 |
| 55. | Beacon Square | 0.22% | 0.072%(+0.146)#53 | 0.23%(-0.009)#119 |
| 56. | Country Club | 0.22% | 0.072%(+0.144)#54 | 0.23%(-0.011)#120 |
| 57. | West Samoset | 0.21% | 0.072%(+0.143)#55 | 0.23%(-0.012)#121 |
| 58. | Bloomingdale | 0.21% | 0.072%(+0.140)#56 | 0.23%(-0.016)#122 |
| 59. | South Apopka | 0.21% | 0.072%(+0.137)#57 | 0.23%(-0.018)#123 |
| 60. | Whiskey Creek | 0.21% | 0.072%(+0.136)#58 | 0.23%(-0.020)#124 |
| 61. | Sunny Isles Beach | 0.20% | 0.072%(+0.131)#59 | 0.23%(-0.025)#225 |
| 62. | Oviedo | 0.20% | 0.072%(+0.128)#60 | 0.23%(-0.027)#226 |
| 63. | Bithlo | 0.20% | 0.072%(+0.127)#61 | 0.23%(-0.028)#227 |
| 64. | University Cdp Orange County | 0.19% | 0.072%(+0.120)#62 | 0.23%(-0.035)#228 |
| 65. | East Lake Orient Park | 0.19% | 0.072%(+0.116)#63 | 0.23%(-0.039)#229 |
| 66. | Coral Terrace | 0.19% | 0.072%(+0.115)#64 | 0.23%(-0.040)#230 |
| 67. | Wilton Manors | 0.18% | 0.072%(+0.111)#65 | 0.23%(-0.044)#231 |
| 68. | Sarasota | 0.18% | 0.072%(+0.110)#66 | 0.23%(-0.045)#232 |
| 69. | Cutler Bay | 0.18% | 0.072%(+0.107)#67 | 0.23%(-0.048)#233 |
| 70. | Mango | 0.18% | 0.072%(+0.105)#68 | 0.23%(-0.050)#234 |
| 71. | Pompano Beach | 0.17% | 0.072%(+0.103)#69 | 0.23%(-0.053)#235 |
| 72. | Estero | 0.17% | 0.072%(+0.097)#70 | 0.23%(-0.058)#236 |
| 73. | Tallahassee | 0.17% | 0.072%(+0.096)#71 | 0.23%(-0.059)#237 |
| 74. | Miramar | 0.17% | 0.072%(+0.095)#72 | 0.23%(-0.061)#261 |
| 75. | Sun City Center | 0.16% | 0.072%(+0.092)#73 | 0.23%(-0.063)#262 |
| 76. | Wekiwa Springs | 0.16% | 0.072%(+0.089)#74 | 0.23%(-0.067)#263 |
| 77. | Melbourne | 0.16% | 0.072%(+0.086)#75 | 0.23%(-0.070)#264 |
| 78. | St Augustine | 0.16% | 0.072%(+0.085)#76 | 0.23%(-0.070)#265 |
| 79. | Lady Lake | 0.15% | 0.072%(+0.078)#77 | 0.23%(-0.078)#266 |
| 80. | Jacksonville | 0.15% | 0.072%(+0.077)#78 | 0.23%(-0.078)#267 |
| 81. | Carrollwood | 0.14% | 0.072%(+0.072)#79 | 0.23%(-0.083)#268 |
| 82. | Wellington | 0.14% | 0.072%(+0.071)#80 | 0.23%(-0.084)#269 |
| 83. | University Cdp Hillsborough County | 0.14% | 0.072%(+0.071)#81 | 0.23%(-0.085)#270 |
| 84. | Buenaventura Lakes | 0.14% | 0.072%(+0.069)#82 | 0.23%(-0.086)#271 |
| 85. | Wright | 0.14% | 0.072%(+0.069)#83 | 0.23%(-0.086)#272 |
| 86. | Tampa | 0.14% | 0.072%(+0.067)#84 | 0.23%(-0.088)#273 |
| 87. | Sunrise | 0.13% | 0.072%(+0.063)#85 | 0.23%(-0.093)#274 |
| 88. | Naples | 0.13% | 0.072%(+0.063)#86 | 0.23%(-0.093)#275 |
| 89. | Tamarac | 0.13% | 0.072%(+0.061)#87 | 0.23%(-0.095)#276 |
| 90. | Lake Mary | 0.13% | 0.072%(+0.060)#88 | 0.23%(-0.095)#277 |
| 91. | Windermere | 0.13% | 0.072%(+0.060)#89 | 0.23%(-0.096)#278 |
| 92. | Port Orange | 0.13% | 0.072%(+0.057)#90 | 0.23%(-0.098)#279 |
| 93. | Deland | 0.13% | 0.072%(+0.053)#91 | 0.23%(-0.102)#280 |
| 94. | Altamonte Springs | 0.12% | 0.072%(+0.053)#92 | 0.23%(-0.103)#281 |
| 95. | St Leo | 0.12% | 0.072%(+0.052)#93 | 0.23%(-0.104)#282 |
| 96. | Four Corners | 0.12% | 0.072%(+0.050)#94 | 0.23%(-0.105)#283 |
| 97. | Edgewater | 0.12% | 0.072%(+0.049)#95 | 0.23%(-0.106)#284 |
| 98. | Northdale | 0.12% | 0.072%(+0.043)#96 | 0.23%(-0.112)#285 |
| 99. | Davie | 0.11% | 0.072%(+0.042)#97 | 0.23%(-0.113)#286 |
| 100. | Egypt Lake Leto | 0.11% | 0.072%(+0.042)#98 | 0.23%(-0.113)#287 |
Common Questions
What are the Top 10 Cities with the Highest Percentage of Immigrants from Eastern Africa in Florida?
Top 10 Cities with the Highest Percentage of Immigrants from Eastern Africa in Florida are:
#1
1.23%
#2
1.16%
#3
1.15%
#4
1.09%
#5
0.84%
#6
0.81%
#7
0.75%
#8
0.74%
#9
0.73%
#10
0.71%
What city has the Highest Percentage of Immigrants from Eastern Africa in Florida?
La Crosse has the Highest Percentage of Immigrants from Eastern Africa in Florida with 1.23%.
What is the Percentage of Immigrants from Eastern Africa in the State of Florida?
Percentage of Immigrants from Eastern Africa in Florida is 0.072%.
What is the Percentage of Immigrants from Eastern Africa in the United States?
Percentage of Immigrants from Eastern Africa in the United States is 0.23%.