Cities with the Highest Percentage of Immigrants from Eastern Africa in Oregon
RELATED REPORTS & OPTIONS
Eastern Africa
Oregon
Compare Cities
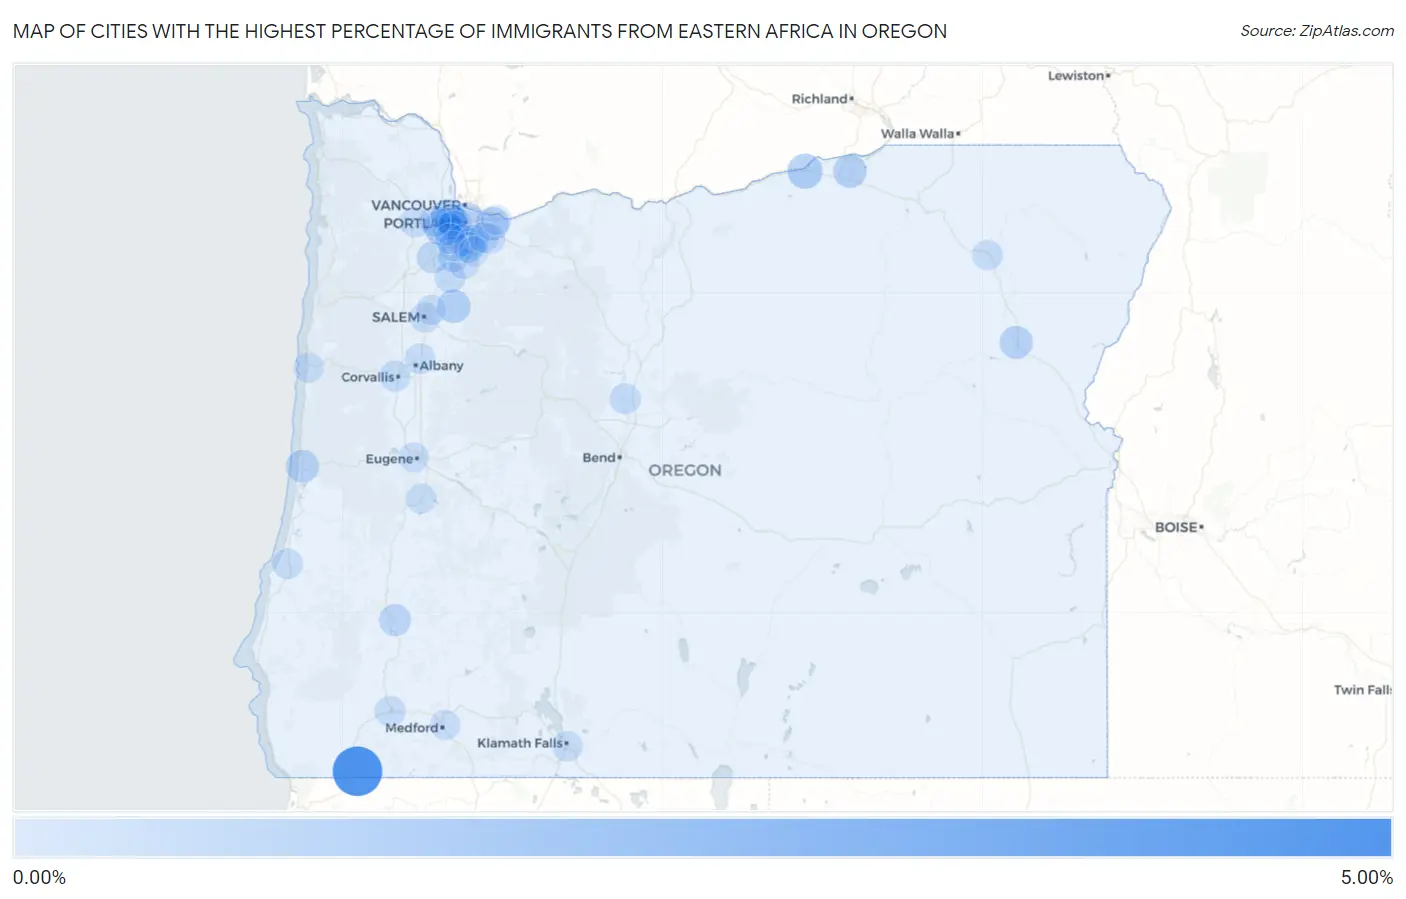
Map of Cities with the Highest Percentage of Immigrants from Eastern Africa in Oregon
0.00%
5.00%
Cities with the Highest Percentage of Immigrants from Eastern Africa in Oregon
| City | Eastern Africa | vs State | vs National | |
| 1. | Takilma | 4.11% | 0.19%(+3.92)#-1 | 0.23%(+3.88)#0 |
| 2. | Aloha | 1.31% | 0.19%(+1.12)#0 | 0.23%(+1.08)#1 |
| 3. | Boardman | 0.99% | 0.19%(+0.800)#1 | 0.23%(+0.765)#2 |
| 4. | Bethany | 0.68% | 0.19%(+0.486)#2 | 0.23%(+0.451)#3 |
| 5. | Silverton | 0.66% | 0.19%(+0.469)#3 | 0.23%(+0.434)#4 |
| 6. | Hermiston | 0.65% | 0.19%(+0.462)#4 | 0.23%(+0.427)#5 |
| 7. | Baker City | 0.61% | 0.19%(+0.421)#5 | 0.23%(+0.386)#6 |
| 8. | Florence | 0.58% | 0.19%(+0.384)#6 | 0.23%(+0.348)#7 |
| 9. | Gresham | 0.56% | 0.19%(+0.366)#7 | 0.23%(+0.330)#338 |
| 10. | West Haven Sylvan | 0.55% | 0.19%(+0.357)#8 | 0.23%(+0.322)#339 |
| 11. | Portland | 0.55% | 0.19%(+0.356)#9 | 0.23%(+0.321)#340 |
| 12. | Beaverton | 0.45% | 0.19%(+0.257)#10 | 0.23%(+0.222)#341 |
| 13. | Cedar Mill | 0.41% | 0.19%(+0.221)#11 | 0.23%(+0.185)#342 |
| 14. | Myrtle Creek | 0.40% | 0.19%(+0.210)#12 | 0.23%(+0.174)#343 |
| 15. | West Slope | 0.38% | 0.19%(+0.183)#13 | 0.23%(+0.148)#344 |
| 16. | Newberg | 0.33% | 0.19%(+0.135)#14 | 0.23%(+0.100)#345 |
| 17. | Wilsonville | 0.26% | 0.19%(+0.066)#15 | 0.23%(+0.031)#346 |
| 18. | Lake Oswego | 0.23% | 0.19%(+0.040)#16 | 0.23%(+0.005)#347 |
| 19. | Crooked River Ranch | 0.20% | 0.19%(+0.010)#17 | 0.23%(-0.026)#348 |
| 20. | Jennings Lodge | 0.20% | 0.19%(+0.004)#18 | 0.23%(-0.031)#349 |
| 21. | Corvallis | 0.18% | 0.19%(-0.012)#19 | 0.23%(-0.047)#350 |
| 22. | Hubbard | 0.18% | 0.19%(-0.017)#20 | 0.23%(-0.052)#351 |
| 23. | Hillsboro | 0.17% | 0.19%(-0.027)#21 | 0.23%(-0.062)#352 |
| 24. | Oatfield | 0.14% | 0.19%(-0.054)#22 | 0.23%(-0.090)#353 |
| 25. | Millersburg | 0.13% | 0.19%(-0.057)#23 | 0.23%(-0.092)#354 |
| 26. | Canby | 0.12% | 0.19%(-0.071)#24 | 0.23%(-0.106)#355 |
| 27. | Klamath Falls | 0.12% | 0.19%(-0.073)#25 | 0.23%(-0.108)#356 |
| 28. | Grants Pass | 0.11% | 0.19%(-0.077)#26 | 0.23%(-0.112)#357 |
| 29. | Coos Bay | 0.11% | 0.19%(-0.079)#27 | 0.23%(-0.114)#358 |
| 30. | West Linn | 0.11% | 0.19%(-0.081)#28 | 0.23%(-0.117)#359 |
| 31. | Tualatin | 0.11% | 0.19%(-0.084)#29 | 0.23%(-0.119)#360 |
| 32. | La Grande | 0.11% | 0.19%(-0.085)#30 | 0.23%(-0.120)#361 |
| 33. | Newport | 0.087% | 0.19%(-0.105)#31 | 0.23%(-0.140)#362 |
| 34. | Damascus | 0.085% | 0.19%(-0.107)#32 | 0.23%(-0.142)#363 |
| 35. | Tigard | 0.083% | 0.19%(-0.108)#33 | 0.23%(-0.144)#364 |
| 36. | Salem | 0.075% | 0.19%(-0.117)#34 | 0.23%(-0.152)#365 |
| 37. | Forest Grove | 0.069% | 0.19%(-0.123)#35 | 0.23%(-0.158)#366 |
| 38. | Medford | 0.067% | 0.19%(-0.125)#36 | 0.23%(-0.161)#367 |
| 39. | Happy Valley | 0.062% | 0.19%(-0.130)#37 | 0.23%(-0.166)#368 |
| 40. | Eugene | 0.053% | 0.19%(-0.139)#38 | 0.23%(-0.174)#369 |
| 41. | Cottage Grove | 0.047% | 0.19%(-0.145)#39 | 0.23%(-0.180)#370 |
| 42. | Oregon City | 0.021% | 0.19%(-0.170)#40 | 0.23%(-0.206)#371 |
| 43. | Troutdale | 0.0062% | 0.19%(-0.186)#41 | 0.23%(-0.221)#372 |
| 44. | Hayesville | 0.0046% | 0.19%(-0.187)#42 | 0.23%(-0.223)#373 |
Common Questions
What are the Top 10 Cities with the Highest Percentage of Immigrants from Eastern Africa in Oregon?
Top 10 Cities with the Highest Percentage of Immigrants from Eastern Africa in Oregon are:
#1
4.11%
#2
1.31%
#3
0.99%
#4
0.68%
#5
0.66%
#6
0.65%
#7
0.61%
#8
0.58%
#9
0.56%
#10
0.55%
What city has the Highest Percentage of Immigrants from Eastern Africa in Oregon?
Takilma has the Highest Percentage of Immigrants from Eastern Africa in Oregon with 4.11%.
What is the Percentage of Immigrants from Eastern Africa in the State of Oregon?
Percentage of Immigrants from Eastern Africa in Oregon is 0.19%.
What is the Percentage of Immigrants from Eastern Africa in the United States?
Percentage of Immigrants from Eastern Africa in the United States is 0.23%.