Cities with the Highest Percentage of Households Heated by Electricity in Michigan
RELATED REPORTS & OPTIONS
Electrical Heating
Michigan
Compare Cities
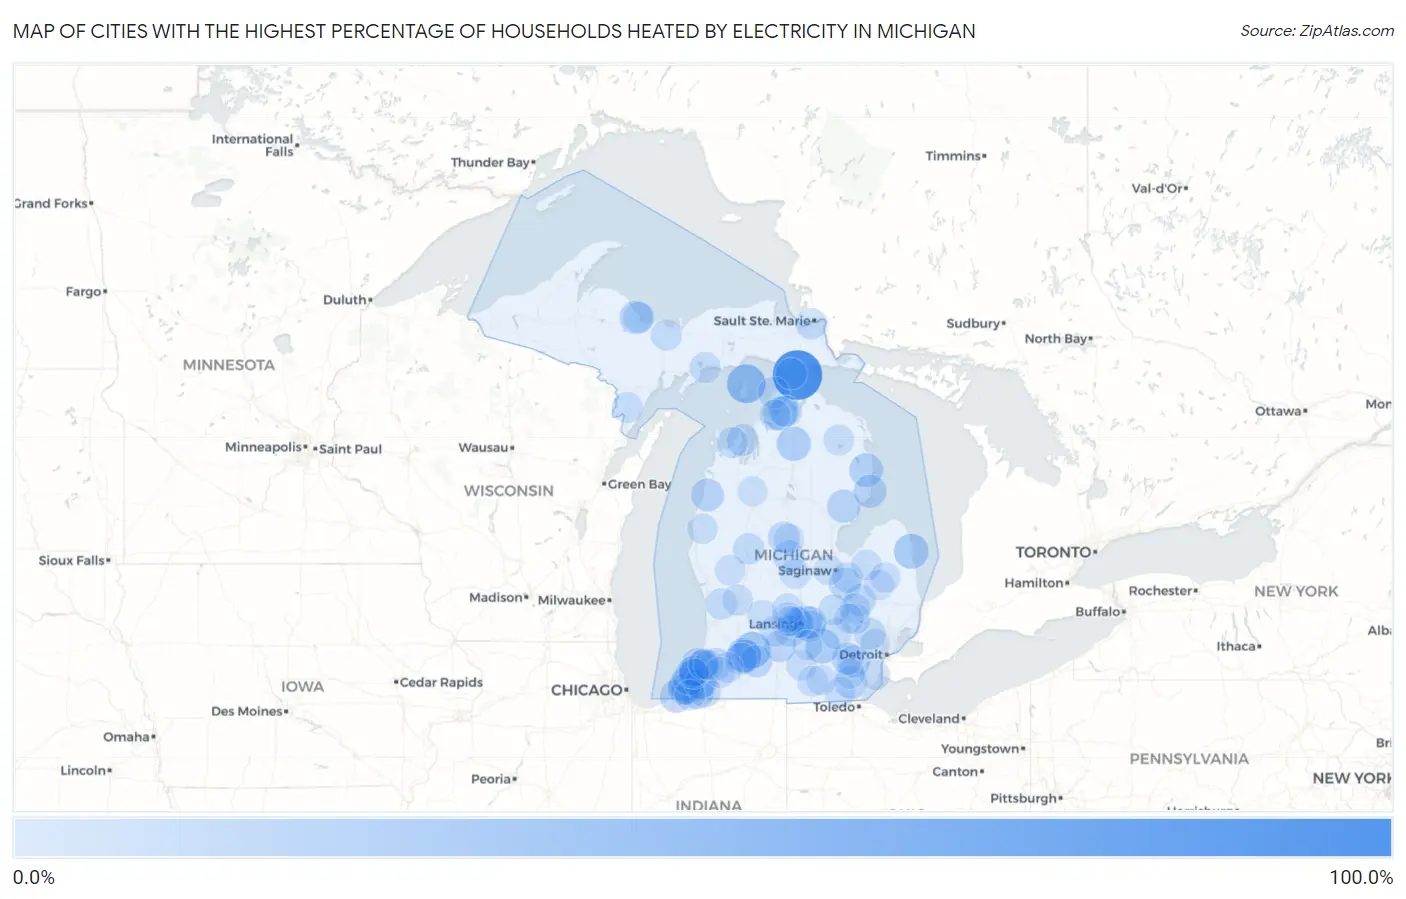
Map of Cities with the Highest Percentage of Households Heated by Electricity in Michigan
0.0%
100.0%
Cities with the Highest Percentage of Households Heated by Electricity in Michigan
| City | Electrical Heating | vs State | vs National | |
| 1. | Mackinac Island | 87.2% | 11.1%(+76.1)#1 | 40.2%(+47.0)#2,369 |
| 2. | St James | 47.5% | 11.1%(+36.4)#2 | 40.2%(+7.30)#9,791 |
| 3. | South Gull Lake | 39.3% | 11.1%(+28.2)#3 | 40.2%(-0.900)#12,039 |
| 4. | Forestville | 34.4% | 11.1%(+23.3)#4 | 40.2%(-5.80)#13,483 |
| 5. | Bridgman | 33.6% | 11.1%(+22.5)#5 | 40.2%(-6.60)#13,730 |
| 6. | Stockbridge | 33.3% | 11.1%(+22.2)#6 | 40.2%(-6.90)#13,816 |
| 7. | Gaylord | 31.7% | 11.1%(+20.6)#7 | 40.2%(-8.50)#14,392 |
| 8. | Parchment | 31.5% | 11.1%(+20.4)#8 | 40.2%(-8.70)#14,477 |
| 9. | Lincoln | 30.3% | 11.1%(+19.2)#9 | 40.2%(-9.90)#14,902 |
| 10. | East Lansing | 30.2% | 11.1%(+19.1)#10 | 40.2%(-10.0)#14,909 |
| 11. | Bay View | 29.2% | 11.1%(+18.1)#11 | 40.2%(-11.0)#15,331 |
| 12. | Trowbridge Park | 28.7% | 11.1%(+17.6)#12 | 40.2%(-11.5)#15,503 |
| 13. | Whittemore | 28.6% | 11.1%(+17.5)#13 | 40.2%(-11.6)#15,544 |
| 14. | Eau Claire | 28.2% | 11.1%(+17.1)#14 | 40.2%(-12.0)#15,690 |
| 15. | Eastwood | 28.1% | 11.1%(+17.0)#15 | 40.2%(-12.1)#15,706 |
| 16. | Oscoda | 27.8% | 11.1%(+16.7)#16 | 40.2%(-12.4)#15,817 |
| 17. | New Buffalo | 27.7% | 11.1%(+16.6)#17 | 40.2%(-12.5)#15,851 |
| 18. | Dundee | 27.2% | 11.1%(+16.1)#18 | 40.2%(-13.0)#16,034 |
| 19. | Onekama | 26.8% | 11.1%(+15.7)#19 | 40.2%(-13.4)#16,203 |
| 20. | Buchanan | 26.5% | 11.1%(+15.4)#20 | 40.2%(-13.7)#16,301 |
| 21. | New Troy | 25.8% | 11.1%(+14.7)#21 | 40.2%(-14.4)#16,608 |
| 22. | Shorewood Tower Hills Harbert | 25.4% | 11.1%(+14.3)#22 | 40.2%(-14.8)#16,766 |
| 23. | Ypsilanti | 25.3% | 11.1%(+14.2)#23 | 40.2%(-14.9)#16,783 |
| 24. | Haslett | 25.1% | 11.1%(+14.0)#24 | 40.2%(-15.1)#16,861 |
| 25. | Stevensville | 24.8% | 11.1%(+13.7)#25 | 40.2%(-15.4)#17,052 |
| 26. | Rock | 24.7% | 11.1%(+13.6)#26 | 40.2%(-15.5)#17,105 |
| 27. | Birch Run | 24.5% | 11.1%(+13.4)#27 | 40.2%(-15.7)#17,187 |
| 28. | Climax | 24.5% | 11.1%(+13.4)#28 | 40.2%(-15.7)#17,192 |
| 29. | Ann Arbor | 24.4% | 11.1%(+13.3)#29 | 40.2%(-15.8)#17,204 |
| 30. | Coloma | 24.4% | 11.1%(+13.3)#30 | 40.2%(-15.8)#17,228 |
| 31. | Olivet | 24.2% | 11.1%(+13.1)#31 | 40.2%(-16.0)#17,307 |
| 32. | Niles | 23.9% | 11.1%(+12.8)#32 | 40.2%(-16.3)#17,408 |
| 33. | Kalamazoo | 23.8% | 11.1%(+12.7)#33 | 40.2%(-16.4)#17,436 |
| 34. | Lake Michigan Beach | 23.7% | 11.1%(+12.6)#34 | 40.2%(-16.5)#17,506 |
| 35. | Mount Pleasant | 23.5% | 11.1%(+12.4)#35 | 40.2%(-16.7)#17,580 |
| 36. | Omena | 23.5% | 11.1%(+12.4)#36 | 40.2%(-16.7)#17,619 |
| 37. | Lawrence | 23.3% | 11.1%(+12.2)#37 | 40.2%(-16.9)#17,697 |
| 38. | Cross Village | 23.3% | 11.1%(+12.2)#38 | 40.2%(-16.9)#17,717 |
| 39. | Farwell | 23.2% | 11.1%(+12.1)#39 | 40.2%(-17.0)#17,747 |
| 40. | Davison | 23.1% | 11.1%(+12.0)#40 | 40.2%(-17.1)#17,784 |
| 41. | Potterville | 23.0% | 11.1%(+11.9)#41 | 40.2%(-17.2)#17,848 |
| 42. | Okemos | 22.8% | 11.1%(+11.7)#42 | 40.2%(-17.4)#17,932 |
| 43. | Ponshewaing | 22.5% | 11.1%(+11.4)#43 | 40.2%(-17.7)#18,109 |
| 44. | Sault Ste Marie | 22.4% | 11.1%(+11.3)#44 | 40.2%(-17.8)#18,117 |
| 45. | Benton Heights | 22.2% | 11.1%(+11.1)#45 | 40.2%(-18.0)#18,212 |
| 46. | Keego Harbor | 22.1% | 11.1%(+11.0)#46 | 40.2%(-18.1)#18,281 |
| 47. | Big Rapids | 21.9% | 11.1%(+10.8)#47 | 40.2%(-18.3)#18,382 |
| 48. | Waverly | 21.7% | 11.1%(+10.6)#48 | 40.2%(-18.5)#18,478 |
| 49. | St Ignace | 21.7% | 11.1%(+10.6)#49 | 40.2%(-18.5)#18,505 |
| 50. | Allendale | 21.6% | 11.1%(+10.5)#50 | 40.2%(-18.6)#18,540 |
| 51. | Edgemont Park | 21.6% | 11.1%(+10.5)#51 | 40.2%(-18.6)#18,558 |
| 52. | St Joseph | 21.5% | 11.1%(+10.4)#52 | 40.2%(-18.7)#18,609 |
| 53. | Manistique | 21.5% | 11.1%(+10.4)#53 | 40.2%(-18.7)#18,622 |
| 54. | Conway | 21.3% | 11.1%(+10.2)#54 | 40.2%(-18.9)#18,758 |
| 55. | Chatham | 21.3% | 11.1%(+10.2)#55 | 40.2%(-18.9)#18,760 |
| 56. | Berrien Springs | 20.8% | 11.1%(+9.70)#56 | 40.2%(-19.4)#18,985 |
| 57. | Marquette | 20.6% | 11.1%(+9.50)#57 | 40.2%(-19.6)#19,091 |
| 58. | Howell | 20.6% | 11.1%(+9.50)#58 | 40.2%(-19.6)#19,094 |
| 59. | Holly | 20.6% | 11.1%(+9.50)#59 | 40.2%(-19.6)#19,099 |
| 60. | Petoskey | 20.6% | 11.1%(+9.50)#60 | 40.2%(-19.6)#19,100 |
| 61. | Durand | 20.6% | 11.1%(+9.50)#61 | 40.2%(-19.6)#19,109 |
| 62. | Leland | 20.6% | 11.1%(+9.50)#62 | 40.2%(-19.6)#19,139 |
| 63. | Frankenmuth | 20.5% | 11.1%(+9.40)#63 | 40.2%(-19.7)#19,161 |
| 64. | Daggett | 20.5% | 11.1%(+9.40)#64 | 40.2%(-19.7)#19,197 |
| 65. | Watervliet | 20.3% | 11.1%(+9.20)#65 | 40.2%(-19.9)#19,293 |
| 66. | Comstock Park | 20.2% | 11.1%(+9.10)#66 | 40.2%(-20.0)#19,331 |
| 67. | Benton Harbor | 20.2% | 11.1%(+9.10)#67 | 40.2%(-20.0)#19,334 |
| 68. | Lawton | 20.2% | 11.1%(+9.10)#68 | 40.2%(-20.0)#19,351 |
| 69. | Hillman | 20.2% | 11.1%(+9.10)#69 | 40.2%(-20.0)#19,366 |
| 70. | Riverdale | 20.0% | 11.1%(+8.90)#70 | 40.2%(-20.2)#19,470 |
| 71. | Caro | 19.8% | 11.1%(+8.70)#71 | 40.2%(-20.4)#19,561 |
| 72. | Westphalia | 19.8% | 11.1%(+8.70)#72 | 40.2%(-20.4)#19,577 |
| 73. | Grand Blanc | 19.6% | 11.1%(+8.50)#73 | 40.2%(-20.6)#19,651 |
| 74. | Vermontville | 19.5% | 11.1%(+8.40)#74 | 40.2%(-20.7)#19,719 |
| 75. | Spring Arbor | 19.4% | 11.1%(+8.30)#75 | 40.2%(-20.8)#19,755 |
| 76. | Addison | 19.4% | 11.1%(+8.30)#76 | 40.2%(-20.8)#19,775 |
| 77. | Clare | 19.3% | 11.1%(+8.20)#77 | 40.2%(-20.9)#19,821 |
| 78. | Blissfield | 19.3% | 11.1%(+8.20)#78 | 40.2%(-20.9)#19,823 |
| 79. | Newaygo | 19.1% | 11.1%(+8.00)#79 | 40.2%(-21.1)#19,919 |
| 80. | North Branch | 19.0% | 11.1%(+7.90)#80 | 40.2%(-21.2)#19,970 |
| 81. | Galien | 19.0% | 11.1%(+7.90)#81 | 40.2%(-21.2)#19,977 |
| 82. | Alma | 18.9% | 11.1%(+7.80)#82 | 40.2%(-21.3)#20,008 |
| 83. | Paw Paw Lake | 18.9% | 11.1%(+7.80)#83 | 40.2%(-21.3)#20,019 |
| 84. | Decatur | 18.9% | 11.1%(+7.80)#84 | 40.2%(-21.3)#20,024 |
| 85. | Eagle | 18.9% | 11.1%(+7.80)#85 | 40.2%(-21.3)#20,045 |
| 86. | Fair Plain | 18.8% | 11.1%(+7.70)#86 | 40.2%(-21.4)#20,053 |
| 87. | South Rockwood | 18.7% | 11.1%(+7.60)#87 | 40.2%(-21.5)#20,127 |
| 88. | Scottville | 18.6% | 11.1%(+7.50)#88 | 40.2%(-21.6)#20,199 |
| 89. | Grand Ledge | 18.5% | 11.1%(+7.40)#89 | 40.2%(-21.7)#20,249 |
| 90. | Shields | 18.5% | 11.1%(+7.40)#90 | 40.2%(-21.7)#20,250 |
| 91. | Marlette | 18.4% | 11.1%(+7.30)#91 | 40.2%(-21.8)#20,336 |
| 92. | Onsted | 18.4% | 11.1%(+7.30)#92 | 40.2%(-21.8)#20,343 |
| 93. | Leslie | 18.3% | 11.1%(+7.20)#93 | 40.2%(-21.9)#20,383 |
| 94. | Clarksville | 18.3% | 11.1%(+7.20)#94 | 40.2%(-21.9)#20,400 |
| 95. | Fenton | 17.9% | 11.1%(+6.80)#95 | 40.2%(-22.3)#20,601 |
| 96. | Hartford | 17.9% | 11.1%(+6.80)#96 | 40.2%(-22.3)#20,615 |
| 97. | Manton | 17.9% | 11.1%(+6.80)#97 | 40.2%(-22.3)#20,625 |
| 98. | Millburg | 17.8% | 11.1%(+6.70)#98 | 40.2%(-22.4)#20,695 |
| 99. | Southfield | 17.7% | 11.1%(+6.60)#99 | 40.2%(-22.5)#20,712 |
| 100. | Milan | 17.7% | 11.1%(+6.60)#100 | 40.2%(-22.5)#20,722 |
Common Questions
What are the Top 10 Cities with the Highest Percentage of Households Heated by Electricity in Michigan?
Top 10 Cities with the Highest Percentage of Households Heated by Electricity in Michigan are:
#1
87.2%
#2
47.5%
#3
39.3%
#4
34.4%
#5
33.6%
#6
33.3%
#7
31.7%
#8
31.5%
#9
30.3%
#10
30.2%
What city has the Highest Percentage of Households Heated by Electricity in Michigan?
Mackinac Island has the Highest Percentage of Households Heated by Electricity in Michigan with 87.2%.
What is the Percentage of Households Heated by Electricity in the State of Michigan?
Percentage of Households Heated by Electricity in Michigan is 11.1%.
What is the Percentage of Households Heated by Electricity in the United States?
Percentage of Households Heated by Electricity in the United States is 40.2%.