Milan, MI
Milan Map
Milan Overview
6,153
TOTAL POPULATION
2,969
MALE POPULATION
3,184
FEMALE POPULATION
93.25
MALES / 100 FEMALES
107.24
FEMALES / 100 MALES
39.1
MEDIAN AGE
3.2
AVG FAMILY SIZE
2.4
AVG HOUSEHOLD SIZE
$38,735
PER CAPITA INCOME
$94,952
AVG FAMILY INCOME
$89,600
AVG HOUSEHOLD INCOME
52.2%
WAGE / INCOME GAP [ % ]
47.8¢/ $1
WAGE / INCOME GAP [ $ ]
0.36
INEQUALITY / GINI INDEX
3,587
LABOR FORCE [ PEOPLE ]
72.5%
PERCENT IN LABOR FORCE
6.5%
UNEMPLOYMENT RATE
Milan Zip Codes
Milan Area Codes
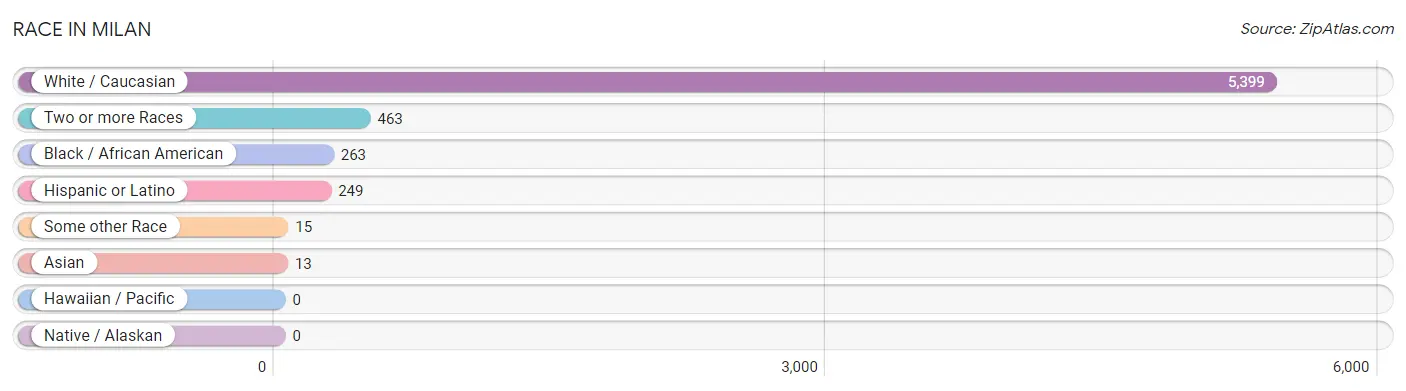
Race in Milan
The most populous races in Milan are White / Caucasian (5,399 | 87.7%), Two or more Races (463 | 7.5%), and Black / African American (263 | 4.3%).
| Race | # Population | % Population |
| Asian | 13 | 0.2% |
| Black / African American | 263 | 4.3% |
| Hawaiian / Pacific | 0 | 0.0% |
| Hispanic or Latino | 249 | 4.1% |
| Native / Alaskan | 0 | 0.0% |
| White / Caucasian | 5,399 | 87.7% |
| Two or more Races | 463 | 7.5% |
| Some other Race | 15 | 0.2% |
| Total | 6,153 | 100.0% |
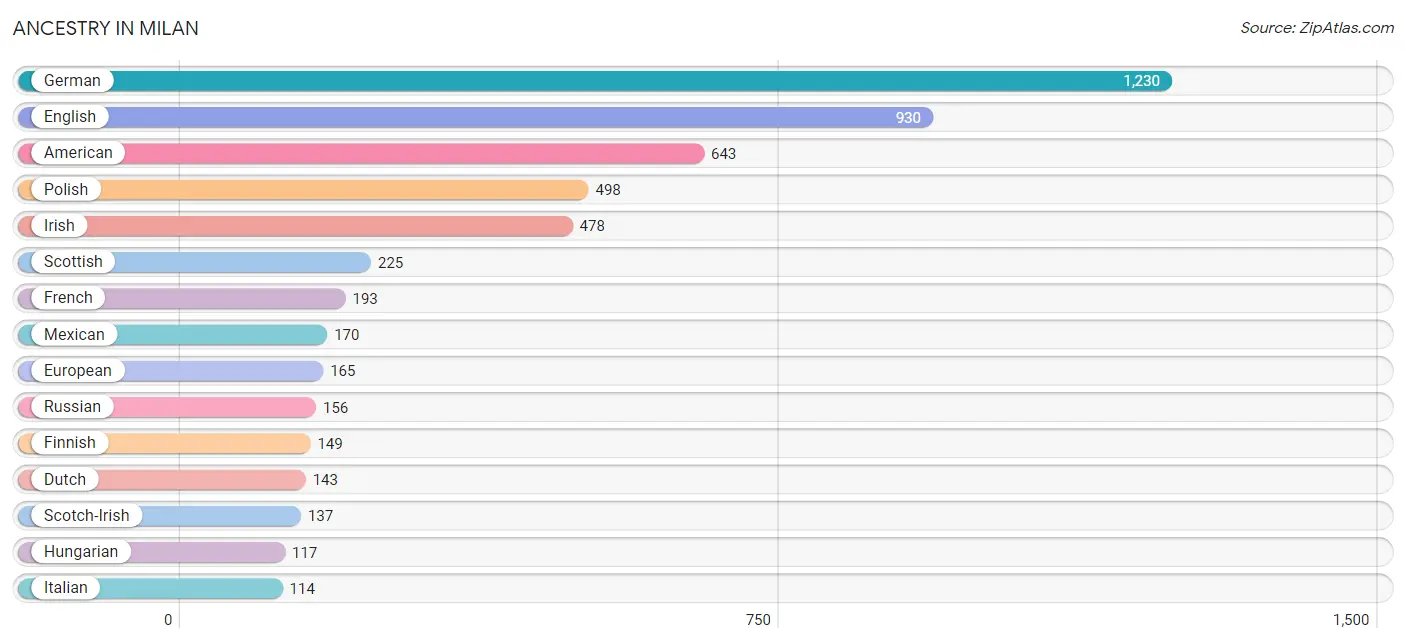
Ancestry in Milan
The most populous ancestries reported in Milan are German (1,230 | 20.0%), English (930 | 15.1%), American (643 | 10.4%), Polish (498 | 8.1%), and Irish (478 | 7.8%), together accounting for 61.4% of all Milan residents.
| Ancestry | # Population | % Population |
| American | 643 | 10.4% |
| Austrian | 16 | 0.3% |
| Basque | 12 | 0.2% |
| Belgian | 11 | 0.2% |
| Bhutanese | 13 | 0.2% |
| British | 27 | 0.4% |
| Canadian | 58 | 0.9% |
| Central American | 40 | 0.6% |
| Chippewa | 15 | 0.2% |
| Czech | 10 | 0.2% |
| Czechoslovakian | 12 | 0.2% |
| Danish | 10 | 0.2% |
| Dutch | 143 | 2.3% |
| Eastern European | 26 | 0.4% |
| English | 930 | 15.1% |
| European | 165 | 2.7% |
| Finnish | 149 | 2.4% |
| French | 193 | 3.1% |
| French Canadian | 106 | 1.7% |
| German | 1,230 | 20.0% |
| Hungarian | 117 | 1.9% |
| Irish | 478 | 7.8% |
| Italian | 114 | 1.8% |
| Lithuanian | 23 | 0.4% |
| Maltese | 32 | 0.5% |
| Mexican | 170 | 2.8% |
| Panamanian | 40 | 0.6% |
| Polish | 498 | 8.1% |
| Portuguese | 5 | 0.1% |
| Puerto Rican | 39 | 0.6% |
| Russian | 156 | 2.5% |
| Scandinavian | 7 | 0.1% |
| Scotch-Irish | 137 | 2.2% |
| Scottish | 225 | 3.7% |
| Slovak | 18 | 0.3% |
| Sri Lankan | 13 | 0.2% |
| Swedish | 71 | 1.1% |
| Swiss | 6 | 0.1% |
| Ukrainian | 34 | 0.5% |
| Welsh | 62 | 1.0% |
| West Indian | 15 | 0.2% | View All 41 Rows |
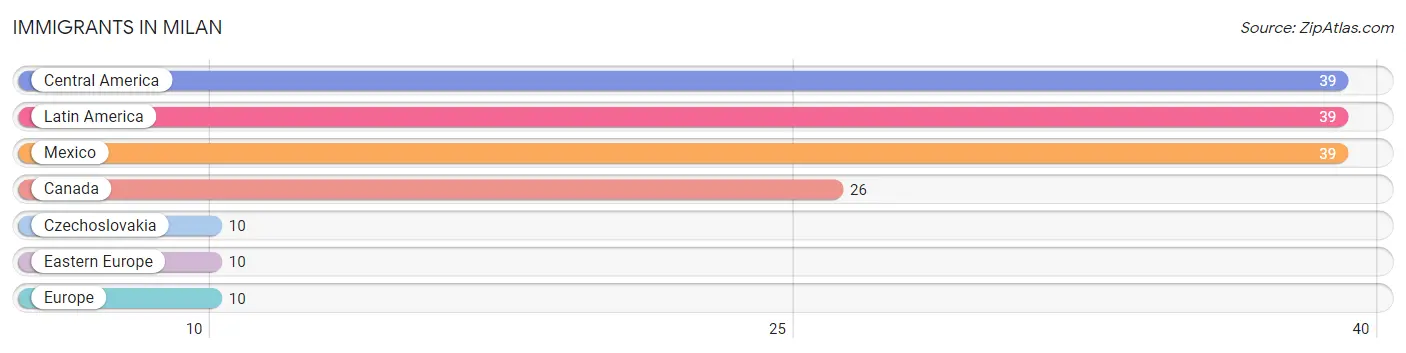
Immigrants in Milan
The most numerous immigrant groups reported in Milan came from Central America (39 | 0.6%), Latin America (39 | 0.6%), Mexico (39 | 0.6%), Canada (26 | 0.4%), and Czechoslovakia (10 | 0.2%), together accounting for 2.5% of all Milan residents.
| Immigration Origin | # Population | % Population |
| Canada | 26 | 0.4% |
| Central America | 39 | 0.6% |
| Czechoslovakia | 10 | 0.2% |
| Eastern Europe | 10 | 0.2% |
| Europe | 10 | 0.2% |
| Latin America | 39 | 0.6% |
| Mexico | 39 | 0.6% | View All 7 Rows |
Sex and Age in Milan
Sex and Age in Milan
The most populous age groups in Milan are 50 to 54 Years (311 | 10.5%) for men and 15 to 19 Years (258 | 8.1%) for women.
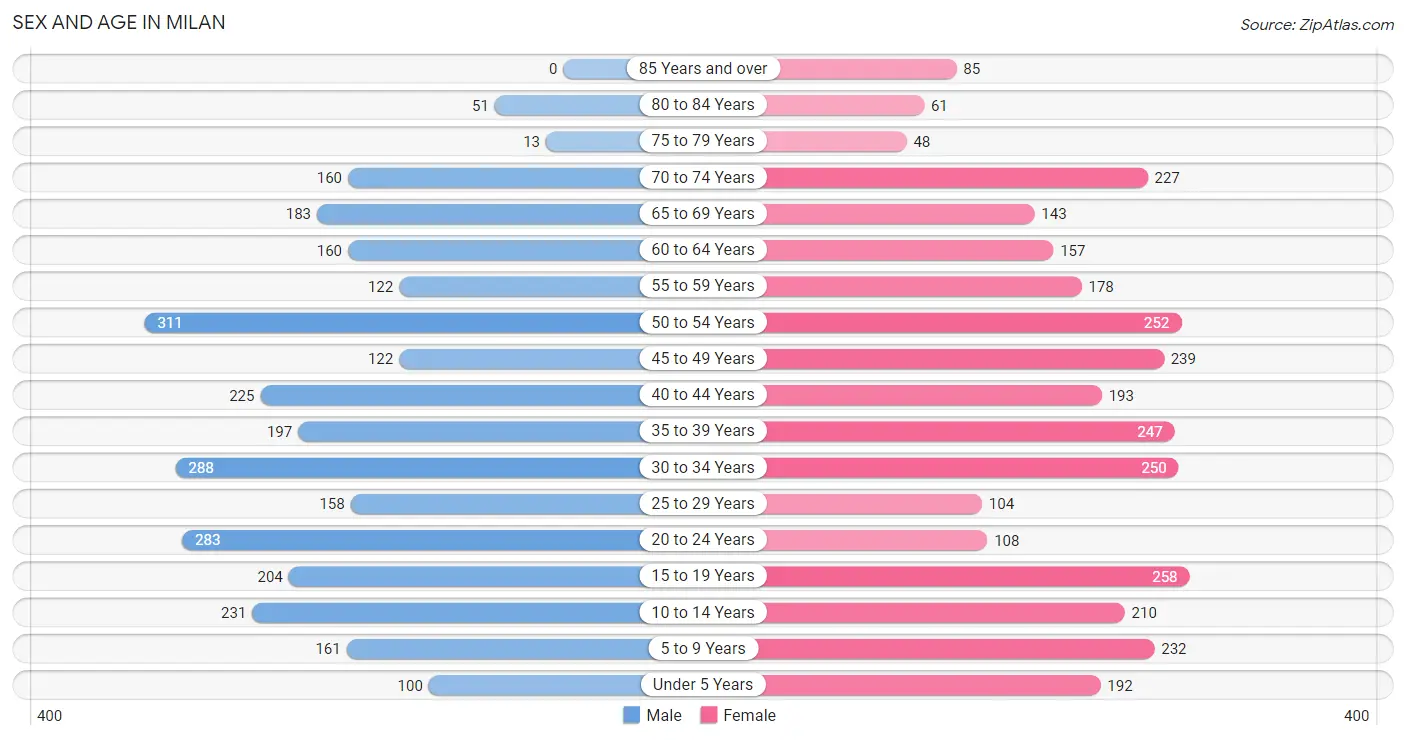
| Age Bracket | Male | Female |
| Under 5 Years | 100 (3.4%) | 192 (6.0%) |
| 5 to 9 Years | 161 (5.4%) | 232 (7.3%) |
| 10 to 14 Years | 231 (7.8%) | 210 (6.6%) |
| 15 to 19 Years | 204 (6.9%) | 258 (8.1%) |
| 20 to 24 Years | 283 (9.5%) | 108 (3.4%) |
| 25 to 29 Years | 158 (5.3%) | 104 (3.3%) |
| 30 to 34 Years | 288 (9.7%) | 250 (7.9%) |
| 35 to 39 Years | 197 (6.6%) | 247 (7.8%) |
| 40 to 44 Years | 225 (7.6%) | 193 (6.1%) |
| 45 to 49 Years | 122 (4.1%) | 239 (7.5%) |
| 50 to 54 Years | 311 (10.5%) | 252 (7.9%) |
| 55 to 59 Years | 122 (4.1%) | 178 (5.6%) |
| 60 to 64 Years | 160 (5.4%) | 157 (4.9%) |
| 65 to 69 Years | 183 (6.2%) | 143 (4.5%) |
| 70 to 74 Years | 160 (5.4%) | 227 (7.1%) |
| 75 to 79 Years | 13 (0.4%) | 48 (1.5%) |
| 80 to 84 Years | 51 (1.7%) | 61 (1.9%) |
| 85 Years and over | 0 (0.0%) | 85 (2.7%) |
| Total | 2,969 (100.0%) | 3,184 (100.0%) |
Families and Households in Milan
Median Family Size in Milan
The median family size in Milan is 3.16 persons per family, with married-couple families (974 | 64.6%) accounting for the largest median family size of 3.54 persons per family. On the other hand, single male/father families (149 | 9.9%) represent the smallest median family size with 2.41 persons per family.
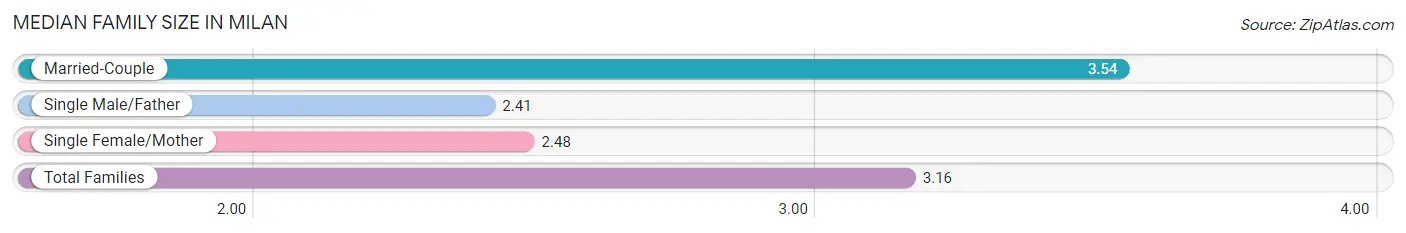
| Family Type | # Families | Family Size |
| Married-Couple | 974 (64.6%) | 3.54 |
| Single Male/Father | 149 (9.9%) | 2.41 |
| Single Female/Mother | 384 (25.5%) | 2.48 |
| Total Families | 1,507 (100.0%) | 3.16 |
Median Household Size in Milan
The median household size in Milan is 2.44 persons per household, with married-couple households (974 | 38.6%) accounting for the largest median household size of 3.58 persons per household. non-family households (1,015 | 40.3%) represent the smallest median household size with 1.21 persons per household.
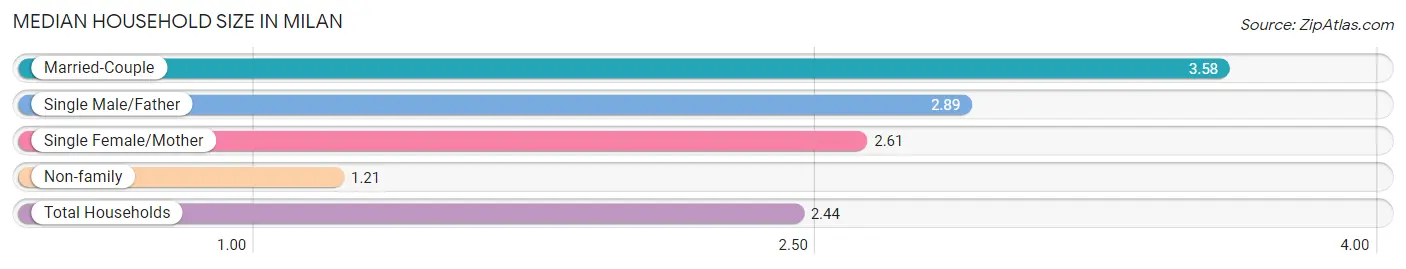
| Household Type | # Households | Household Size |
| Married-Couple | 974 (38.6%) | 3.58 |
| Single Male/Father | 149 (5.9%) | 2.89 |
| Single Female/Mother | 384 (15.2%) | 2.61 |
| Non-family | 1,015 (40.3%) | 1.21 |
| Total Households | 2,522 (100.0%) | 2.44 |
Household Size by Marriage Status in Milan
Out of a total of 2,522 households in Milan, 1,507 (59.8%) are family households, while 1,015 (40.3%) are nonfamily households. The most numerous type of family households are 2-person households, comprising 593, and the most common type of nonfamily households are 1-person households, comprising 804.
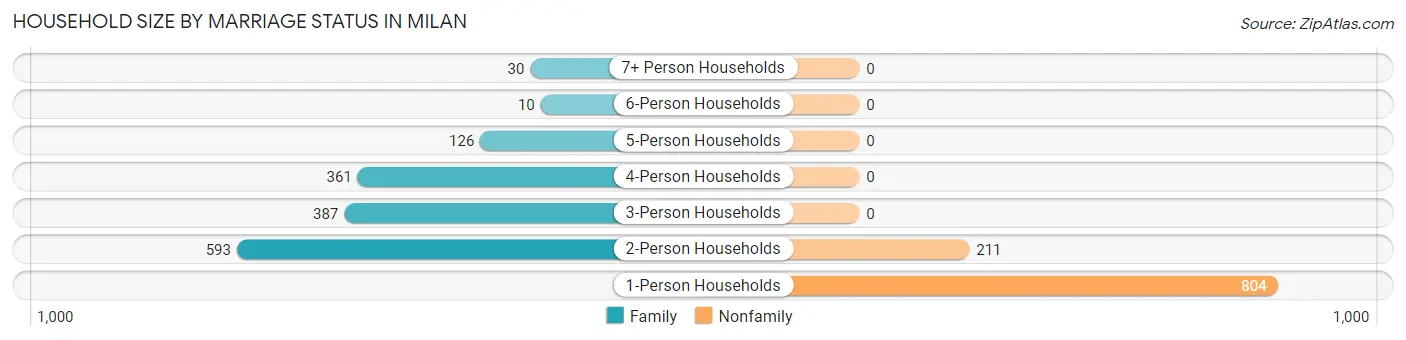
| Household Size | Family Households | Nonfamily Households |
| 1-Person Households | - | 804 (31.9%) |
| 2-Person Households | 593 (23.5%) | 211 (8.4%) |
| 3-Person Households | 387 (15.3%) | 0 (0.0%) |
| 4-Person Households | 361 (14.3%) | 0 (0.0%) |
| 5-Person Households | 126 (5.0%) | 0 (0.0%) |
| 6-Person Households | 10 (0.4%) | 0 (0.0%) |
| 7+ Person Households | 30 (1.2%) | 0 (0.0%) |
| Total | 1,507 (59.8%) | 1,015 (40.3%) |
Female Fertility in Milan
Fertility by Age in Milan
Average fertility rate in Milan is 33.0 births per 1,000 women. Women in the age bracket of 20 to 34 years have the highest fertility rate with 89.0 births per 1,000 women. Women in the age bracket of 20 to 34 years acount for 82.0% of all women with births.
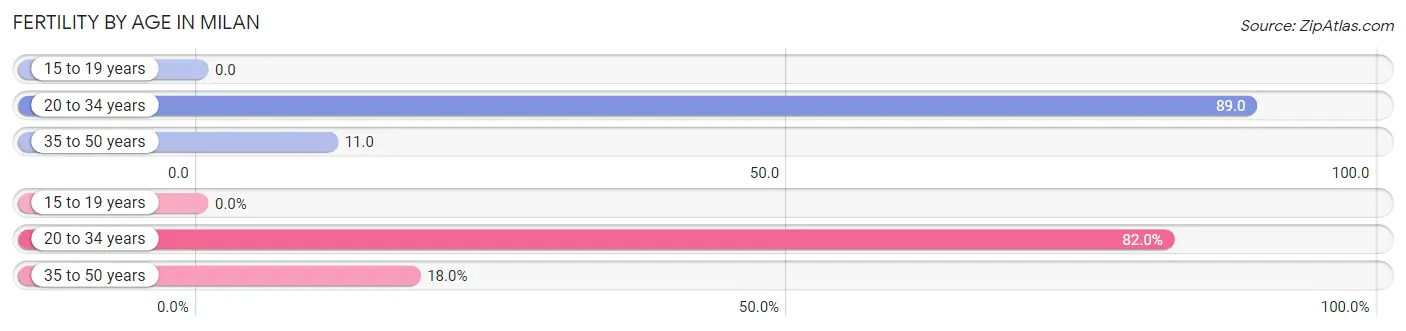
| Age Bracket | Women with Births | Births / 1,000 Women |
| 15 to 19 years | 0 (0.0%) | 0.0 |
| 20 to 34 years | 41 (82.0%) | 89.0 |
| 35 to 50 years | 9 (18.0%) | 11.0 |
| Total | 50 (100.0%) | 33.0 |
Fertility by Age by Marriage Status in Milan
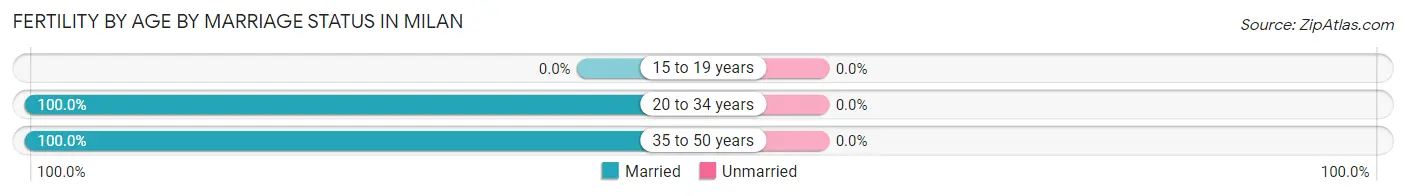
| Age Bracket | Married | Unmarried |
| 15 to 19 years | 0 (0.0%) | 0 (0.0%) |
| 20 to 34 years | 41 (100.0%) | 0 (0.0%) |
| 35 to 50 years | 9 (100.0%) | 0 (0.0%) |
| Total | 50 (100.0%) | 0 (0.0%) |
Fertility by Education in Milan
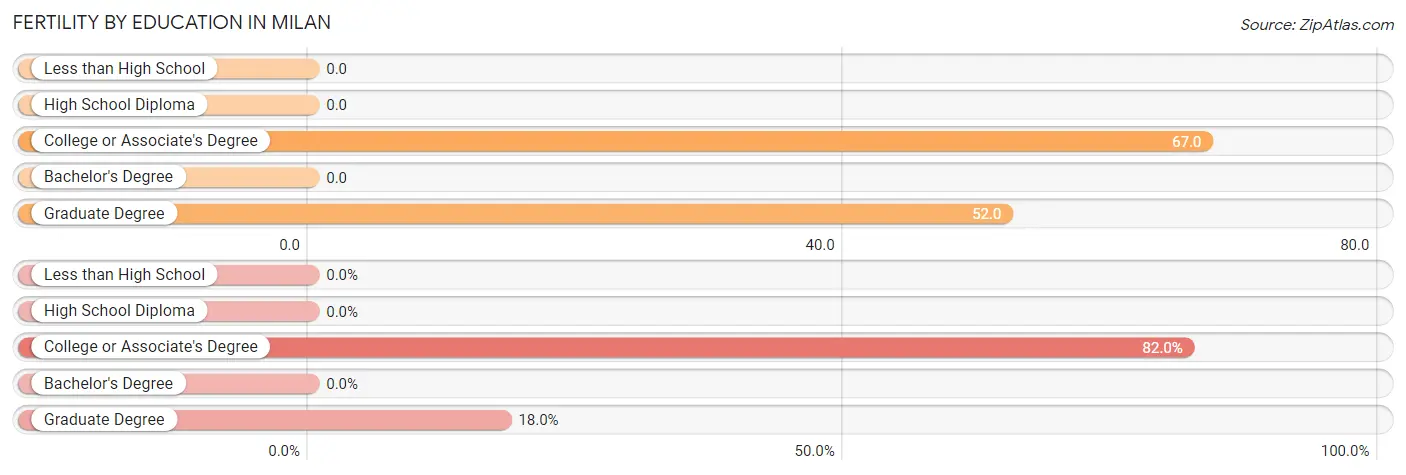
| Educational Attainment | Women with Births | Births / 1,000 Women |
| Less than High School | 0 (0.0%) | 0.0 |
| High School Diploma | 0 (0.0%) | 0.0 |
| College or Associate's Degree | 41 (82.0%) | 67.0 |
| Bachelor's Degree | 0 (0.0%) | 0.0 |
| Graduate Degree | 9 (18.0%) | 52.0 |
| Total | 50 (100.0%) | 33.0 |
Fertility by Education by Marriage Status in Milan
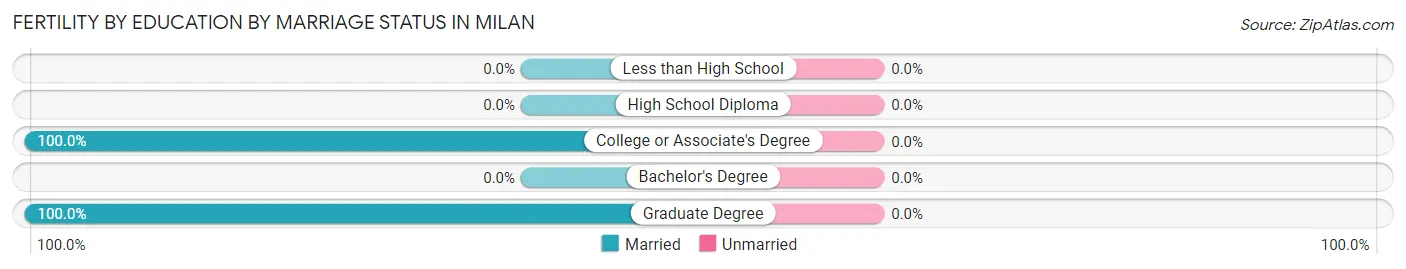
| Educational Attainment | Married | Unmarried |
| Less than High School | 0 (0.0%) | 0 (0.0%) |
| High School Diploma | 0 (0.0%) | 0 (0.0%) |
| College or Associate's Degree | 41 (100.0%) | 0 (0.0%) |
| Bachelor's Degree | 0 (0.0%) | 0 (0.0%) |
| Graduate Degree | 9 (100.0%) | 0 (0.0%) |
| Total | 50 (100.0%) | 0 (0.0%) |
Income in Milan
Income Overview in Milan
Per Capita Income in Milan is $38,735, while median incomes of families and households are $94,952 and $89,600 respectively.
| Characteristic | Number | Measure |
| Per Capita Income | 6,153 | $38,735 |
| Median Family Income | 1,507 | $94,952 |
| Mean Family Income | 1,507 | $105,416 |
| Median Household Income | 2,522 | $89,600 |
| Mean Household Income | 2,522 | $93,655 |
| Income Deficit | 1,507 | $0 |
| Wage / Income Gap (%) | 6,153 | 52.20% |
| Wage / Income Gap ($) | 6,153 | 47.80¢ per $1 |
| Gini / Inequality Index | 6,153 | 0.36 |
Earnings by Sex in Milan
Average Earnings in Milan are $39,849, $53,427 for men and $25,539 for women, a difference of 52.2%.
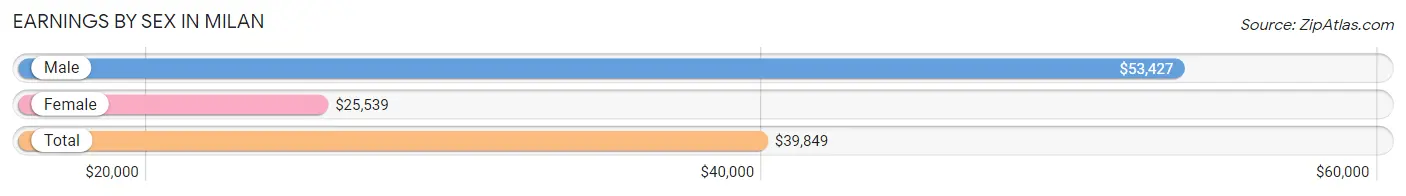
| Sex | Number | Average Earnings |
| Male | 1,897 (51.6%) | $53,427 |
| Female | 1,780 (48.4%) | $25,539 |
| Total | 3,677 (100.0%) | $39,849 |
Earnings by Sex by Income Bracket in Milan
The most common earnings brackets in Milan are $100,000+ for men (302 | 15.9%) and $2,499 or less for women (238 | 13.4%).
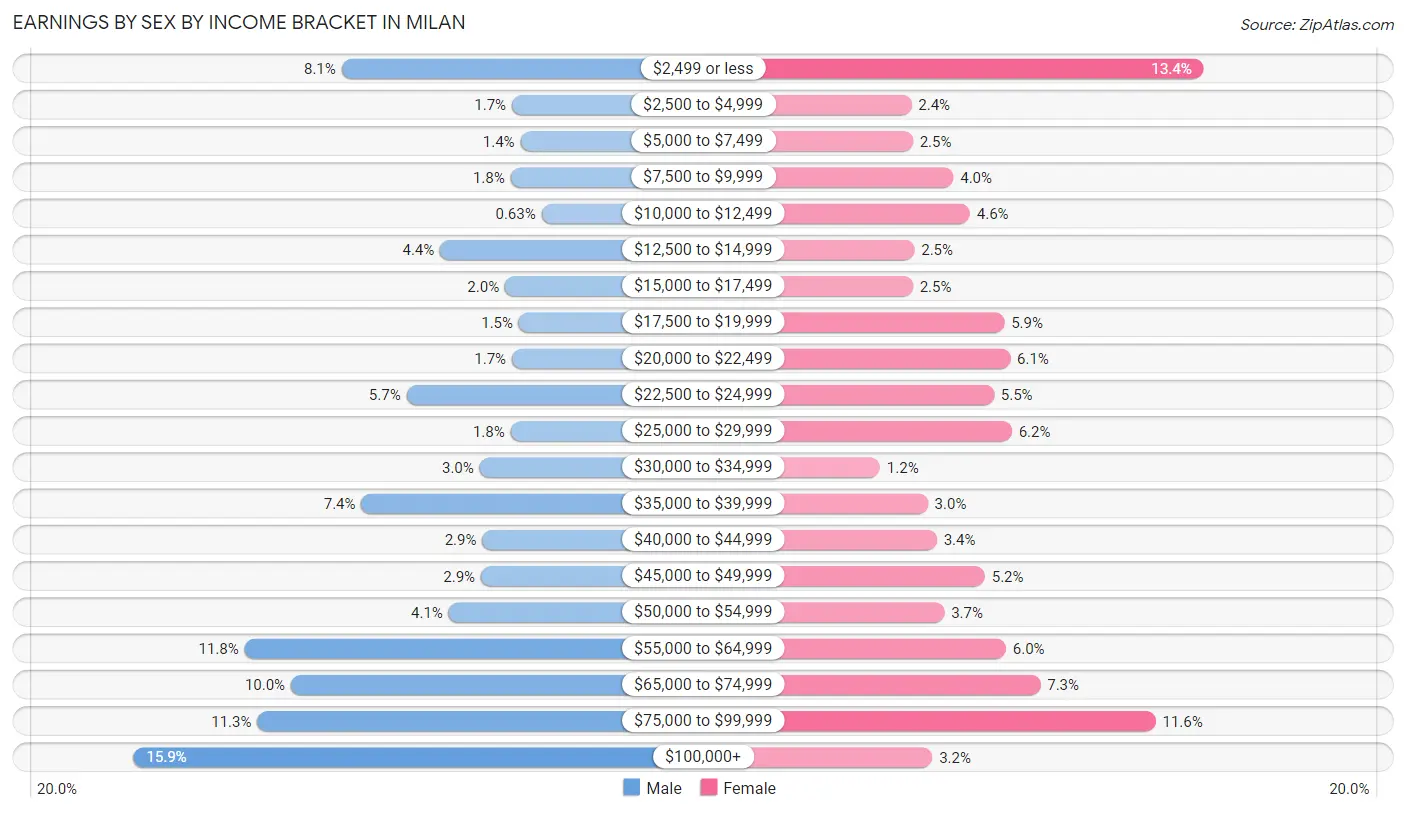
| Income | Male | Female |
| $2,499 or less | 154 (8.1%) | 238 (13.4%) |
| $2,500 to $4,999 | 33 (1.7%) | 43 (2.4%) |
| $5,000 to $7,499 | 27 (1.4%) | 44 (2.5%) |
| $7,500 to $9,999 | 34 (1.8%) | 71 (4.0%) |
| $10,000 to $12,499 | 12 (0.6%) | 82 (4.6%) |
| $12,500 to $14,999 | 84 (4.4%) | 45 (2.5%) |
| $15,000 to $17,499 | 38 (2.0%) | 44 (2.5%) |
| $17,500 to $19,999 | 28 (1.5%) | 105 (5.9%) |
| $20,000 to $22,499 | 33 (1.7%) | 109 (6.1%) |
| $22,500 to $24,999 | 108 (5.7%) | 98 (5.5%) |
| $25,000 to $29,999 | 34 (1.8%) | 110 (6.2%) |
| $30,000 to $34,999 | 56 (2.9%) | 22 (1.2%) |
| $35,000 to $39,999 | 140 (7.4%) | 54 (3.0%) |
| $40,000 to $44,999 | 54 (2.9%) | 60 (3.4%) |
| $45,000 to $49,999 | 55 (2.9%) | 92 (5.2%) |
| $50,000 to $54,999 | 78 (4.1%) | 65 (3.6%) |
| $55,000 to $64,999 | 223 (11.8%) | 106 (6.0%) |
| $65,000 to $74,999 | 190 (10.0%) | 129 (7.2%) |
| $75,000 to $99,999 | 214 (11.3%) | 206 (11.6%) |
| $100,000+ | 302 (15.9%) | 57 (3.2%) |
| Total | 1,897 (100.0%) | 1,780 (100.0%) |
Earnings by Sex by Educational Attainment in Milan
Average earnings in Milan are $62,231 for men and $32,273 for women, a difference of 48.1%. Men with an educational attainment of bachelor's degree enjoy the highest average annual earnings of $88,875, while those with less than high school education earn the least with $25,147. Women with an educational attainment of graduate degree earn the most with the average annual earnings of $77,788, while those with college or associate's degree education have the smallest earnings of $23,750.
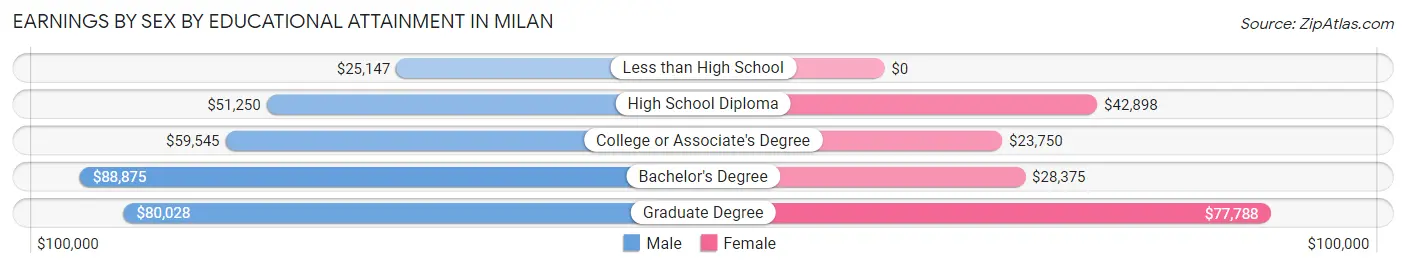
| Educational Attainment | Male Income | Female Income |
| Less than High School | $25,147 | $0 |
| High School Diploma | $51,250 | $42,898 |
| College or Associate's Degree | $59,545 | $23,750 |
| Bachelor's Degree | $88,875 | $28,375 |
| Graduate Degree | $80,028 | $77,788 |
| Total | $62,231 | $32,273 |
Family Income in Milan
Family Income Brackets in Milan
According to the Milan family income data, there are 425 families falling into the $100,000 to $149,999 income range, which is the most common income bracket and makes up 28.2% of all families. Conversely, the $25,000 to $34,999 income bracket is the least frequent group with only 32 families (2.1%) belonging to this category.
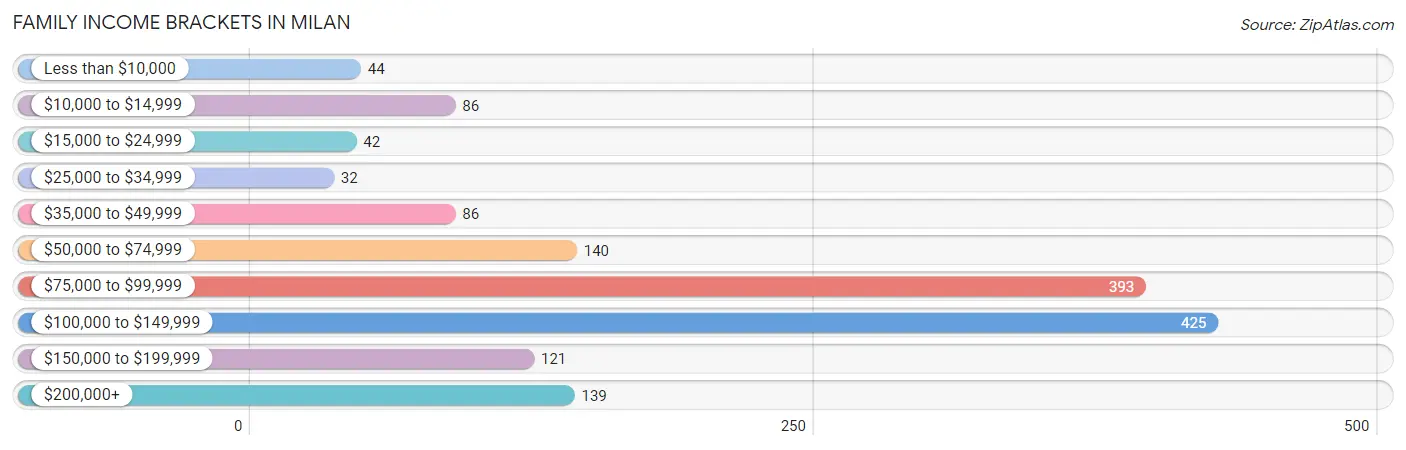
| Income Bracket | # Families | % Families |
| Less than $10,000 | 44 | 2.9% |
| $10,000 to $14,999 | 86 | 5.7% |
| $15,000 to $24,999 | 42 | 2.8% |
| $25,000 to $34,999 | 32 | 2.1% |
| $35,000 to $49,999 | 86 | 5.7% |
| $50,000 to $74,999 | 140 | 9.3% |
| $75,000 to $99,999 | 393 | 26.1% |
| $100,000 to $149,999 | 425 | 28.2% |
| $150,000 to $199,999 | 121 | 8.0% |
| $200,000+ | 139 | 9.2% |
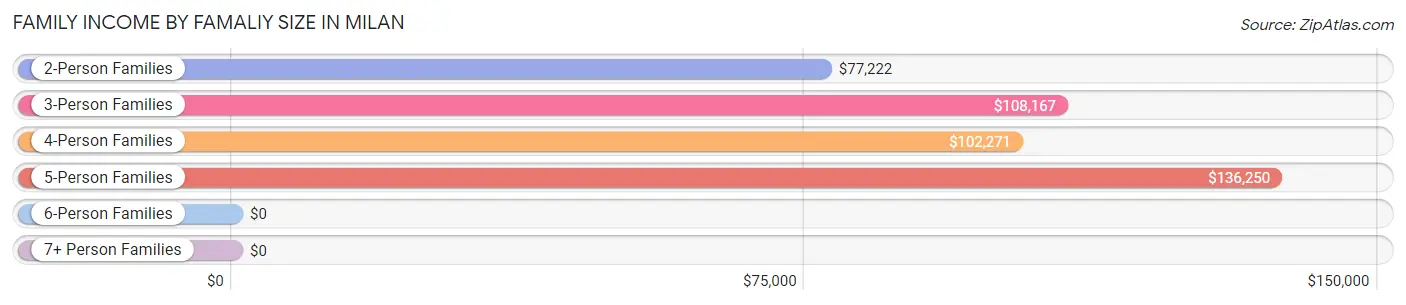
Family Income by Famaliy Size in Milan
5-person families (92 | 6.1%) account for the highest median family income in Milan with $136,250 per family, while 2-person families (650 | 43.1%) have the highest median income of $38,611 per family member.
| Income Bracket | # Families | Median Income |
| 2-Person Families | 650 (43.1%) | $77,222 |
| 3-Person Families | 398 (26.4%) | $108,167 |
| 4-Person Families | 327 (21.7%) | $102,271 |
| 5-Person Families | 92 (6.1%) | $136,250 |
| 6-Person Families | 10 (0.7%) | $0 |
| 7+ Person Families | 30 (2.0%) | $0 |
| Total | 1,507 (100.0%) | $94,952 |
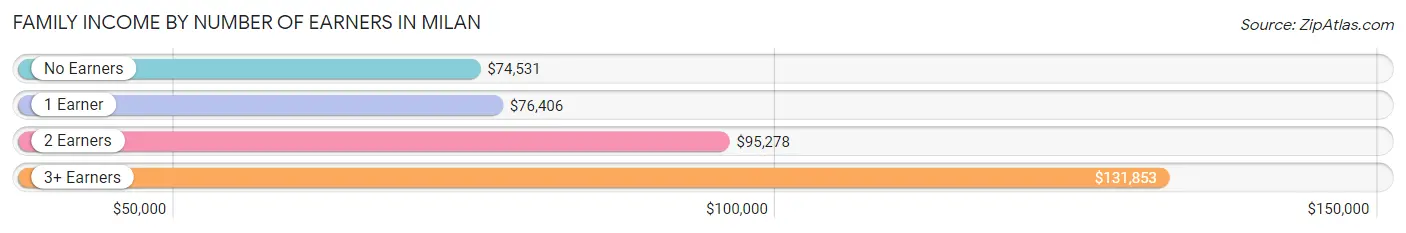
Family Income by Number of Earners in Milan
The median family income in Milan is $94,952, with families comprising 3+ earners (277) having the highest median family income of $131,853, while families with no earners (119) have the lowest median family income of $74,531, accounting for 18.4% and 7.9% of families, respectively.
| Number of Earners | # Families | Median Income |
| No Earners | 119 (7.9%) | $74,531 |
| 1 Earner | 513 (34.0%) | $76,406 |
| 2 Earners | 598 (39.7%) | $95,278 |
| 3+ Earners | 277 (18.4%) | $131,853 |
| Total | 1,507 (100.0%) | $94,952 |
Household Income in Milan
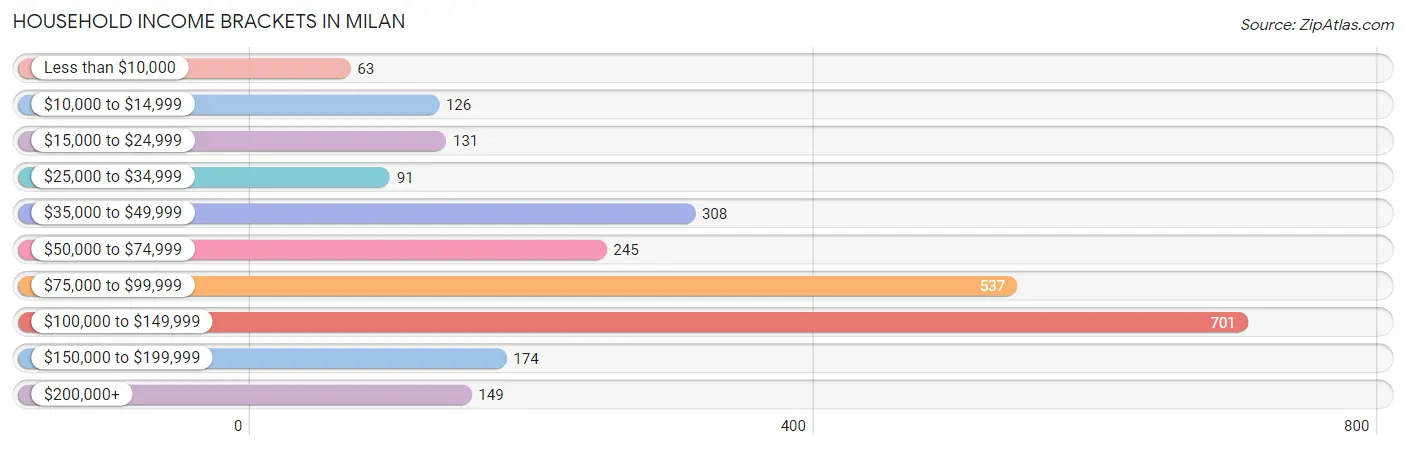
Household Income Brackets in Milan
With 701 households falling in the category, the $100,000 to $149,999 income range is the most frequent in Milan, accounting for 27.8% of all households. In contrast, only 63 households (2.5%) fall into the less than $10,000 income bracket, making it the least populous group.
| Income Bracket | # Households | % Households |
| Less than $10,000 | 63 | 2.5% |
| $10,000 to $14,999 | 126 | 5.0% |
| $15,000 to $24,999 | 131 | 5.2% |
| $25,000 to $34,999 | 91 | 3.6% |
| $35,000 to $49,999 | 308 | 12.2% |
| $50,000 to $74,999 | 245 | 9.7% |
| $75,000 to $99,999 | 537 | 21.3% |
| $100,000 to $149,999 | 701 | 27.8% |
| $150,000 to $199,999 | 174 | 6.9% |
| $200,000+ | 149 | 5.9% |
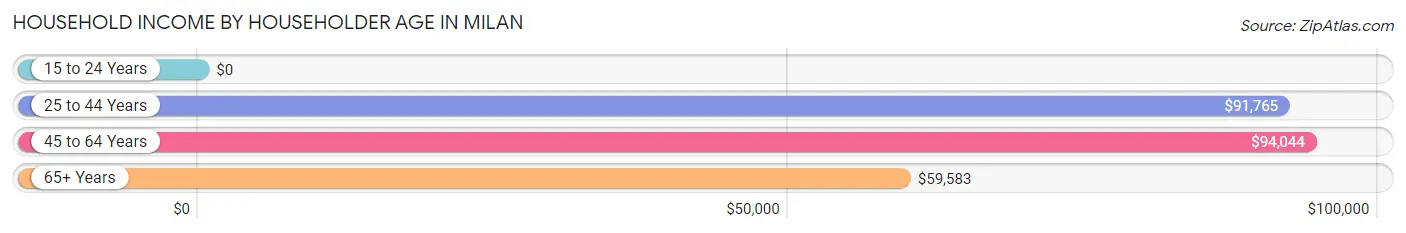
Household Income by Householder Age in Milan
The median household income in Milan is $89,600, with the highest median household income of $94,044 found in the 45 to 64 years age bracket for the primary householder. A total of 911 households (36.1%) fall into this category. Meanwhile, the 15 to 24 years age bracket for the primary householder has the lowest median household income of $0, with 52 households (2.1%) in this group.
| Income Bracket | # Households | Median Income |
| 15 to 24 Years | 52 (2.1%) | $0 |
| 25 to 44 Years | 816 (32.4%) | $91,765 |
| 45 to 64 Years | 911 (36.1%) | $94,044 |
| 65+ Years | 743 (29.5%) | $59,583 |
| Total | 2,522 (100.0%) | $89,600 |
Poverty in Milan
Income Below Poverty by Sex and Age in Milan
With 6.7% poverty level for males and 8.8% for females among the residents of Milan, 18 to 24 year old males and 15 year old females are the most vulnerable to poverty, with 106 males (28.2%) and 35 females (87.5%) in their respective age groups living below the poverty level.
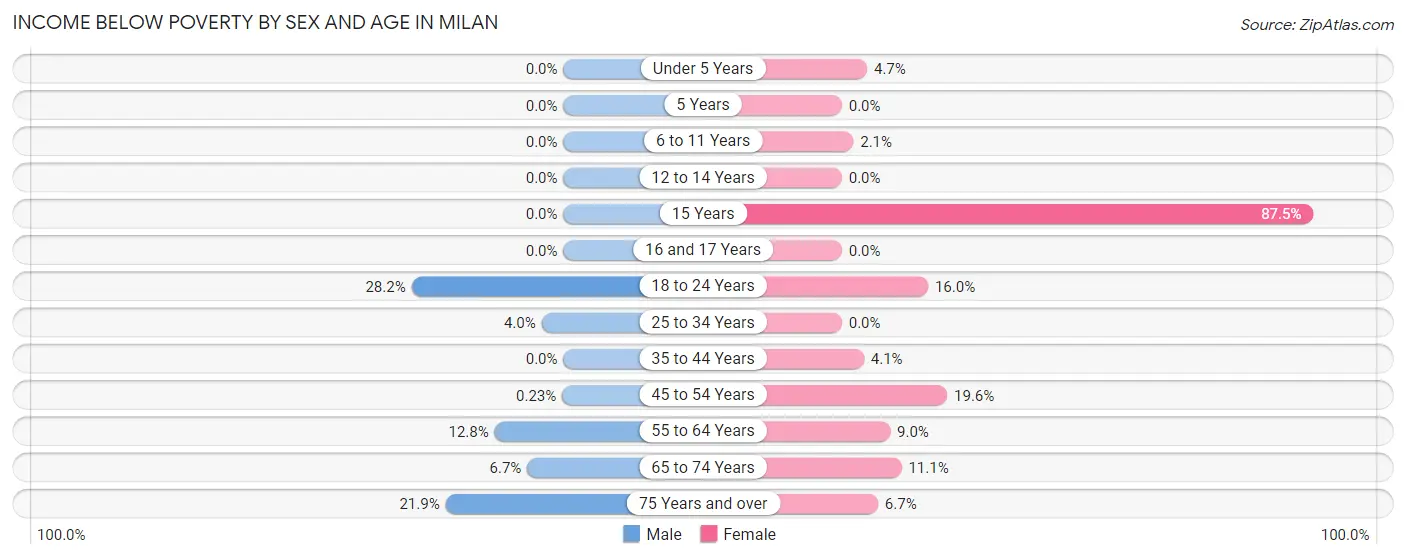
| Age Bracket | Male | Female |
| Under 5 Years | 0 (0.0%) | 9 (4.7%) |
| 5 Years | 0 (0.0%) | 0 (0.0%) |
| 6 to 11 Years | 0 (0.0%) | 6 (2.1%) |
| 12 to 14 Years | 0 (0.0%) | 0 (0.0%) |
| 15 Years | 0 (0.0%) | 35 (87.5%) |
| 16 and 17 Years | 0 (0.0%) | 0 (0.0%) |
| 18 to 24 Years | 106 (28.2%) | 32 (16.0%) |
| 25 to 34 Years | 18 (4.0%) | 0 (0.0%) |
| 35 to 44 Years | 0 (0.0%) | 18 (4.1%) |
| 45 to 54 Years | 1 (0.2%) | 96 (19.6%) |
| 55 to 64 Years | 36 (12.8%) | 30 (9.0%) |
| 65 to 74 Years | 23 (6.7%) | 41 (11.1%) |
| 75 Years and over | 14 (21.9%) | 13 (6.7%) |
| Total | 198 (6.7%) | 280 (8.8%) |
Income Above Poverty by Sex and Age in Milan
According to the poverty statistics in Milan, males aged under 5 years and females aged 5 years are the age groups that are most secure financially, with 100.0% of males and 100.0% of females in these age groups living above the poverty line.
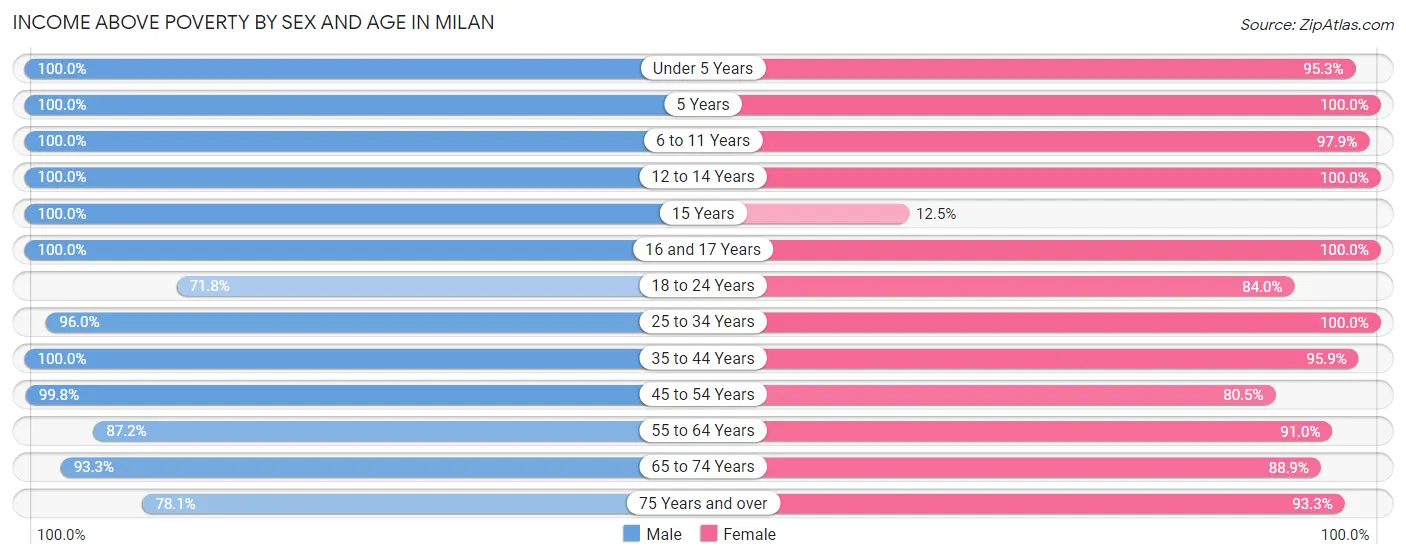
| Age Bracket | Male | Female |
| Under 5 Years | 100 (100.0%) | 183 (95.3%) |
| 5 Years | 19 (100.0%) | 21 (100.0%) |
| 6 to 11 Years | 195 (100.0%) | 276 (97.9%) |
| 12 to 14 Years | 178 (100.0%) | 139 (100.0%) |
| 15 Years | 39 (100.0%) | 5 (12.5%) |
| 16 and 17 Years | 72 (100.0%) | 126 (100.0%) |
| 18 to 24 Years | 270 (71.8%) | 168 (84.0%) |
| 25 to 34 Years | 428 (96.0%) | 354 (100.0%) |
| 35 to 44 Years | 422 (100.0%) | 422 (95.9%) |
| 45 to 54 Years | 432 (99.8%) | 395 (80.4%) |
| 55 to 64 Years | 246 (87.2%) | 305 (91.0%) |
| 65 to 74 Years | 320 (93.3%) | 329 (88.9%) |
| 75 Years and over | 50 (78.1%) | 181 (93.3%) |
| Total | 2,771 (93.3%) | 2,904 (91.2%) |
Income Below Poverty Among Married-Couple Families in Milan
The poverty statistics for married-couple families in Milan show that 0.9% or 9 of the total 974 families live below the poverty line. Families with no children have the highest poverty rate of 1.8%, comprising of 9 families. On the other hand, families with 1 or 2 children have the lowest poverty rate of 0.0%, which includes 0 families.
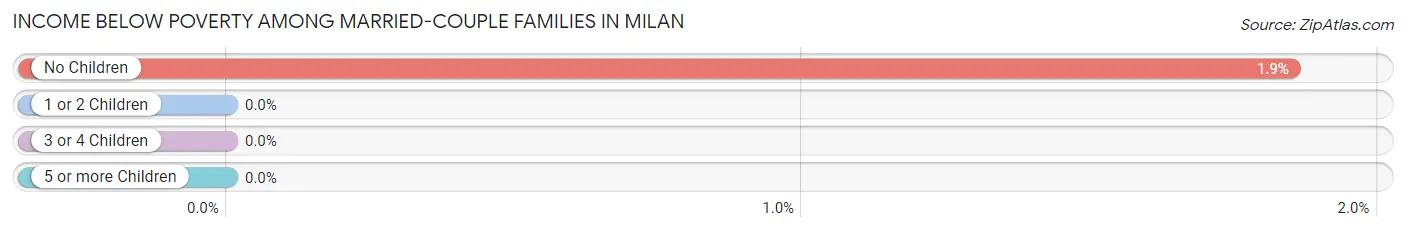
| Children | Above Poverty | Below Poverty |
| No Children | 477 (98.2%) | 9 (1.8%) |
| 1 or 2 Children | 383 (100.0%) | 0 (0.0%) |
| 3 or 4 Children | 75 (100.0%) | 0 (0.0%) |
| 5 or more Children | 30 (100.0%) | 0 (0.0%) |
| Total | 965 (99.1%) | 9 (0.9%) |
Income Below Poverty Among Single-Parent Households in Milan
According to the poverty data in Milan, 4.7% or 7 single-father households and 29.7% or 114 single-mother households are living below the poverty line. Among single-father households, those with 1 or 2 children have the highest poverty rate, with 7 households (10.6%) experiencing poverty. Likewise, among single-mother households, those with no children have the highest poverty rate, with 70 households (38.7%) falling below the poverty line.
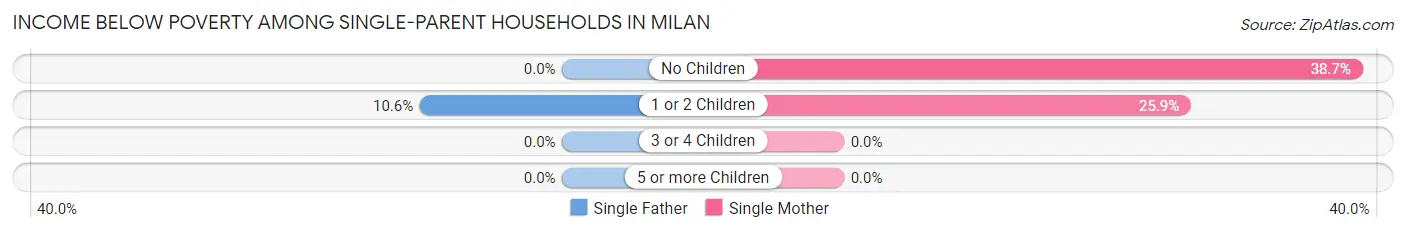
| Children | Single Father | Single Mother |
| No Children | 0 (0.0%) | 70 (38.7%) |
| 1 or 2 Children | 7 (10.6%) | 44 (25.9%) |
| 3 or 4 Children | 0 (0.0%) | 0 (0.0%) |
| 5 or more Children | 0 (0.0%) | 0 (0.0%) |
| Total | 7 (4.7%) | 114 (29.7%) |
Income Below Poverty Among Married-Couple vs Single-Parent Households in Milan
The poverty data for Milan shows that 9 of the married-couple family households (0.9%) and 121 of the single-parent households (22.7%) are living below the poverty level. Within the married-couple family households, those with no children have the highest poverty rate, with 9 households (1.8%) falling below the poverty line. Among the single-parent households, those with no children have the highest poverty rate, with 70 household (26.5%) living below poverty.
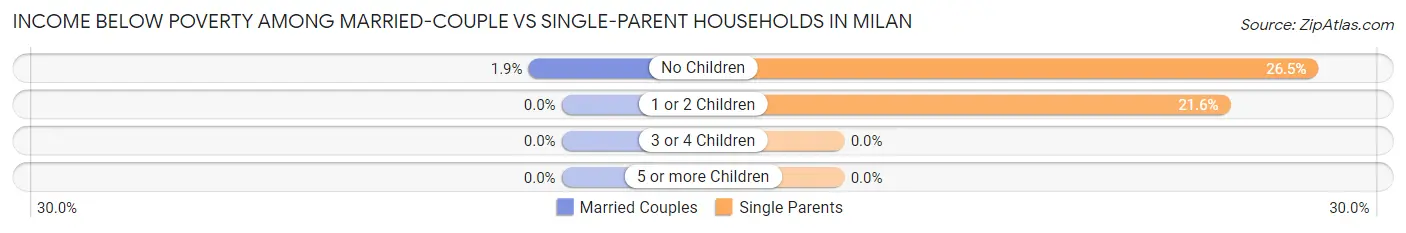
| Children | Married-Couple Families | Single-Parent Households |
| No Children | 9 (1.8%) | 70 (26.5%) |
| 1 or 2 Children | 0 (0.0%) | 51 (21.6%) |
| 3 or 4 Children | 0 (0.0%) | 0 (0.0%) |
| 5 or more Children | 0 (0.0%) | 0 (0.0%) |
| Total | 9 (0.9%) | 121 (22.7%) |
Employment Characteristics in Milan
Employment by Class of Employer in Milan
Among the 3,290 employed individuals in Milan, private company employees (2,024 | 61.5%), not-for-profit organizations (528 | 16.1%), and state government employees (313 | 9.5%) make up the most common classes of employment.
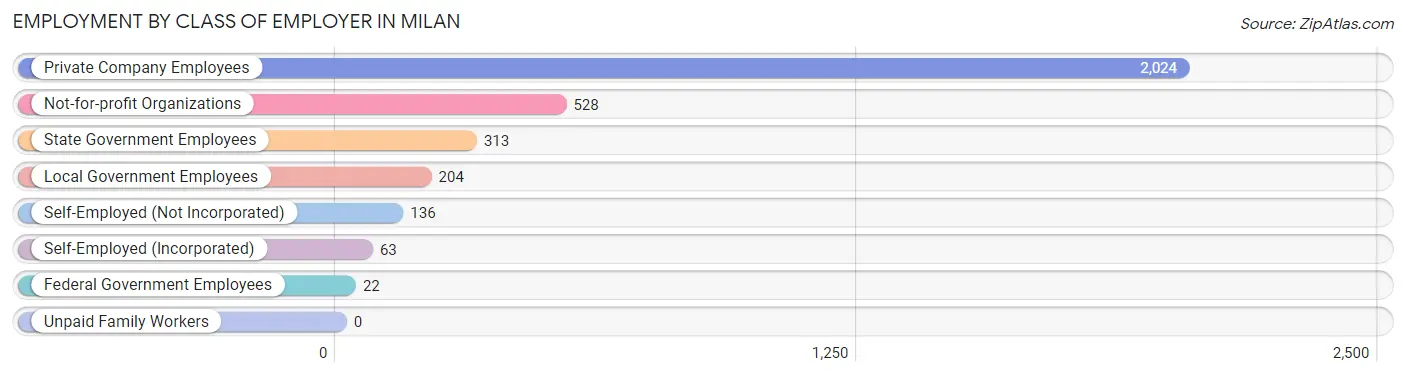
| Employer Class | # Employees | % Employees |
| Private Company Employees | 2,024 | 61.5% |
| Self-Employed (Incorporated) | 63 | 1.9% |
| Self-Employed (Not Incorporated) | 136 | 4.1% |
| Not-for-profit Organizations | 528 | 16.1% |
| Local Government Employees | 204 | 6.2% |
| State Government Employees | 313 | 9.5% |
| Federal Government Employees | 22 | 0.7% |
| Unpaid Family Workers | 0 | 0.0% |
| Total | 3,290 | 100.0% |
Employment Status by Age in Milan
According to the labor force statistics for Milan, out of the total population over 16 years of age (4,948), 72.5% or 3,587 individuals are in the labor force, with 6.5% or 233 of them unemployed. The age group with the highest labor force participation rate is 20 to 24 years, with 96.2% or 376 individuals in the labor force. Within the labor force, the 16 to 19 years age range has the highest percentage of unemployed individuals, with 44.0% or 99 of them being unemployed.
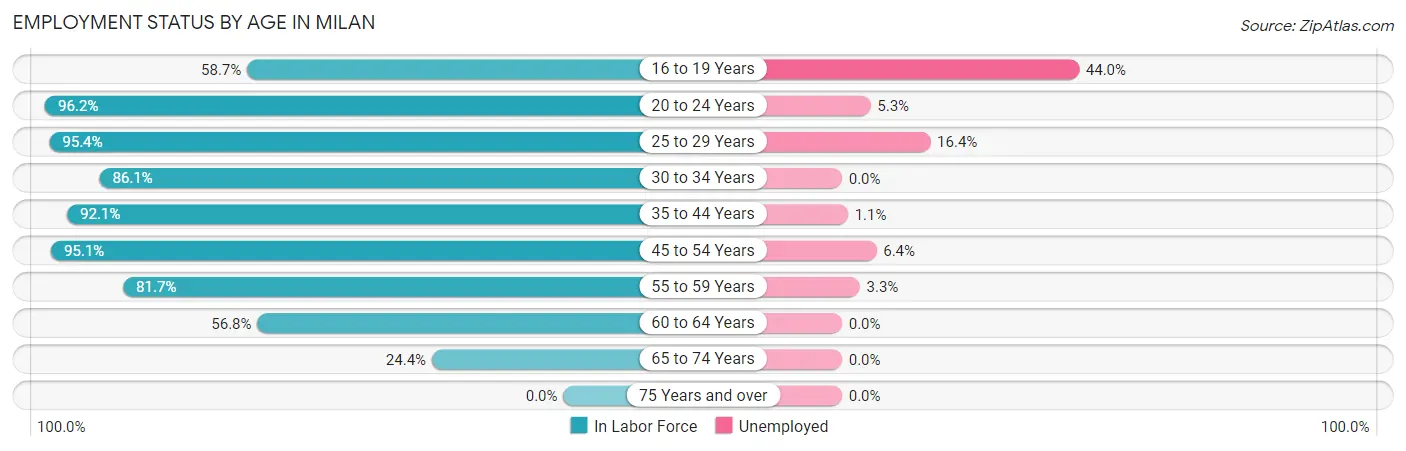
| Age Bracket | In Labor Force | Unemployed |
| 16 to 19 Years | 225 (58.7%) | 99 (44.0%) |
| 20 to 24 Years | 376 (96.2%) | 20 (5.3%) |
| 25 to 29 Years | 250 (95.4%) | 41 (16.4%) |
| 30 to 34 Years | 463 (86.1%) | 0 (0.0%) |
| 35 to 44 Years | 794 (92.1%) | 9 (1.1%) |
| 45 to 54 Years | 879 (95.1%) | 56 (6.4%) |
| 55 to 59 Years | 245 (81.7%) | 8 (3.3%) |
| 60 to 64 Years | 180 (56.8%) | 0 (0.0%) |
| 65 to 74 Years | 174 (24.4%) | 0 (0.0%) |
| 75 Years and over | 0 (0.0%) | 0 (0.0%) |
| Total | 3,587 (72.5%) | 233 (6.5%) |
Employment Status by Educational Attainment in Milan
According to labor force statistics for Milan, 87.8% of individuals (2,812) out of the total population between 25 and 64 years of age (3,203) are in the labor force, with 4.1% or 115 of them being unemployed. The group with the highest labor force participation rate are those with the educational attainment of college / associate degree, with 91.1% or 1,167 individuals in the labor force. Within the labor force, individuals with less than high school education have the highest percentage of unemployment, with 29.6% or 34 of them being unemployed.
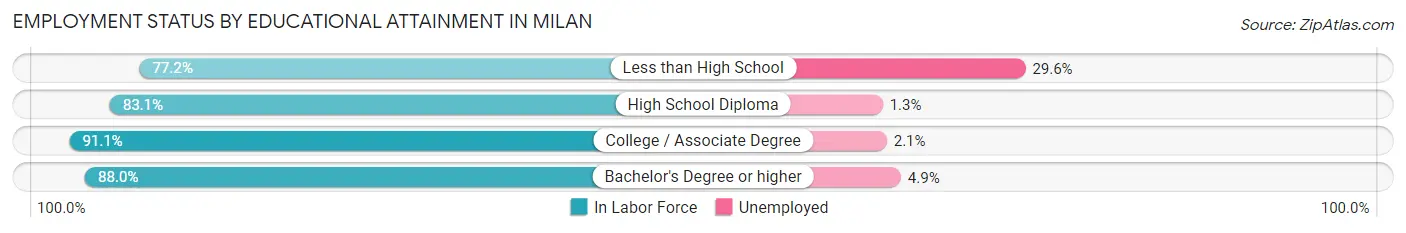
| Educational Attainment | In Labor Force | Unemployed |
| Less than High School | 115 (77.2%) | 44 (29.6%) |
| High School Diploma | 526 (83.1%) | 8 (1.3%) |
| College / Associate Degree | 1,167 (91.1%) | 27 (2.1%) |
| Bachelor's Degree or higher | 1,003 (88.0%) | 56 (4.9%) |
| Total | 2,812 (87.8%) | 131 (4.1%) |
Employment Occupations by Sex in Milan
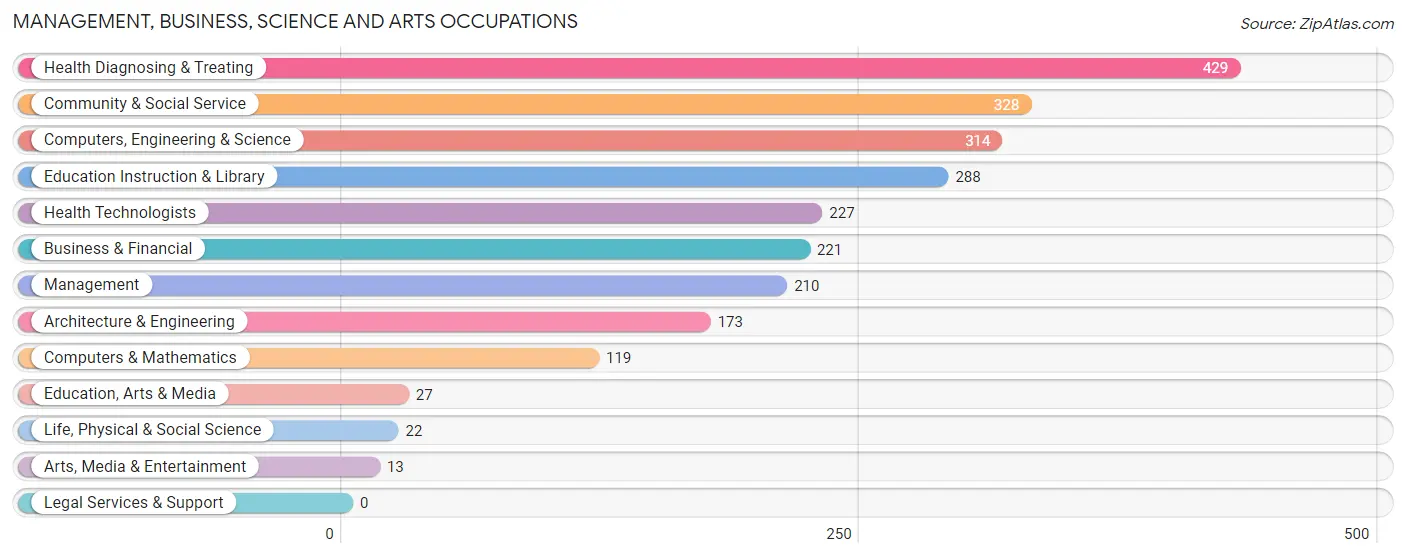
Management, Business, Science and Arts Occupations
The most common Management, Business, Science and Arts occupations in Milan are Health Diagnosing & Treating (429 | 12.8%), Community & Social Service (328 | 9.8%), Computers, Engineering & Science (314 | 9.4%), Education Instruction & Library (288 | 8.6%), and Health Technologists (227 | 6.8%).
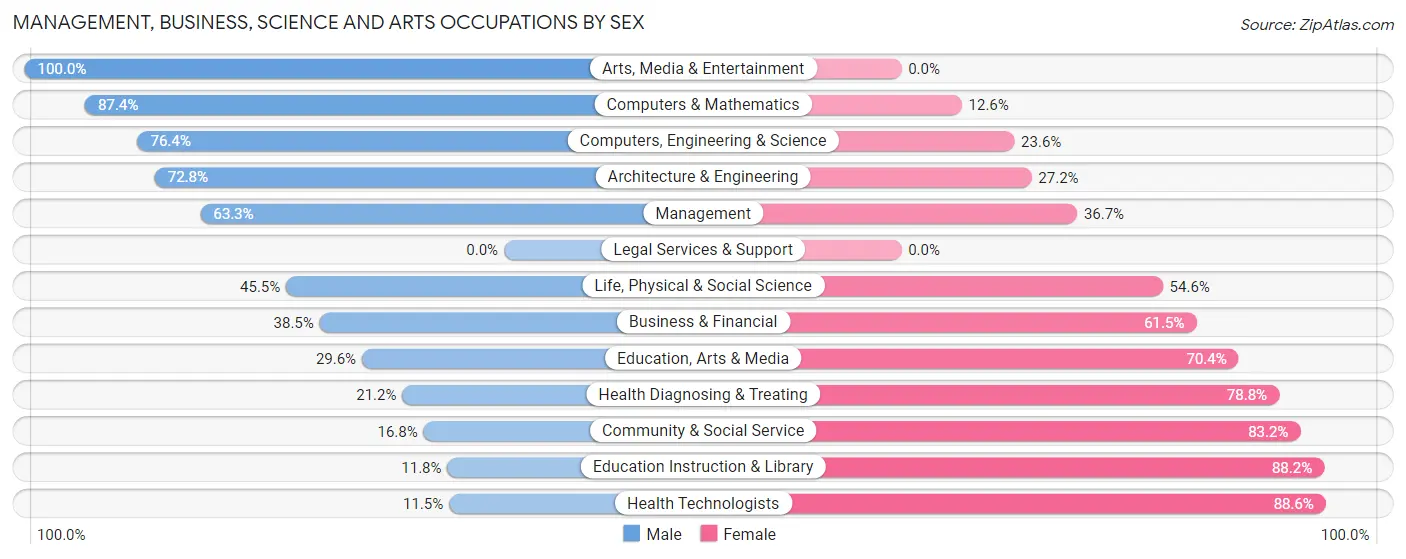
Management, Business, Science and Arts Occupations by Sex
Within the Management, Business, Science and Arts occupations in Milan, the most male-oriented occupations are Arts, Media & Entertainment (100.0%), Computers & Mathematics (87.4%), and Computers, Engineering & Science (76.4%), while the most female-oriented occupations are Health Technologists (88.5%), Education Instruction & Library (88.2%), and Community & Social Service (83.2%).
| Occupation | Male | Female |
| Management | 133 (63.3%) | 77 (36.7%) |
| Business & Financial | 85 (38.5%) | 136 (61.5%) |
| Computers, Engineering & Science | 240 (76.4%) | 74 (23.6%) |
| Computers & Mathematics | 104 (87.4%) | 15 (12.6%) |
| Architecture & Engineering | 126 (72.8%) | 47 (27.2%) |
| Life, Physical & Social Science | 10 (45.5%) | 12 (54.5%) |
| Community & Social Service | 55 (16.8%) | 273 (83.2%) |
| Education, Arts & Media | 8 (29.6%) | 19 (70.4%) |
| Legal Services & Support | 0 (0.0%) | 0 (0.0%) |
| Education Instruction & Library | 34 (11.8%) | 254 (88.2%) |
| Arts, Media & Entertainment | 13 (100.0%) | 0 (0.0%) |
| Health Diagnosing & Treating | 91 (21.2%) | 338 (78.8%) |
| Health Technologists | 26 (11.5%) | 201 (88.5%) |
| Total (Category) | 604 (40.2%) | 898 (59.8%) |
| Total (Overall) | 1,715 (51.1%) | 1,638 (48.8%) |
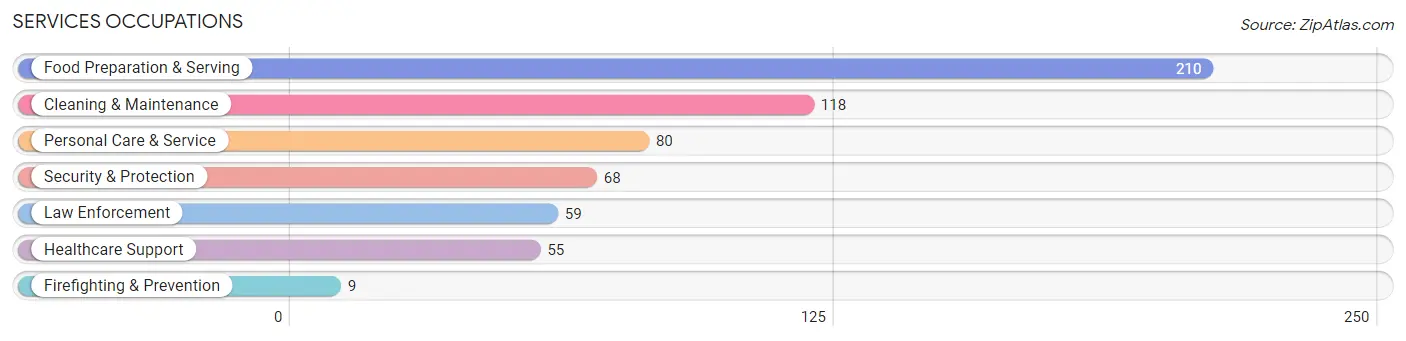
Services Occupations
The most common Services occupations in Milan are Food Preparation & Serving (210 | 6.3%), Cleaning & Maintenance (118 | 3.5%), Personal Care & Service (80 | 2.4%), Security & Protection (68 | 2.0%), and Law Enforcement (59 | 1.8%).
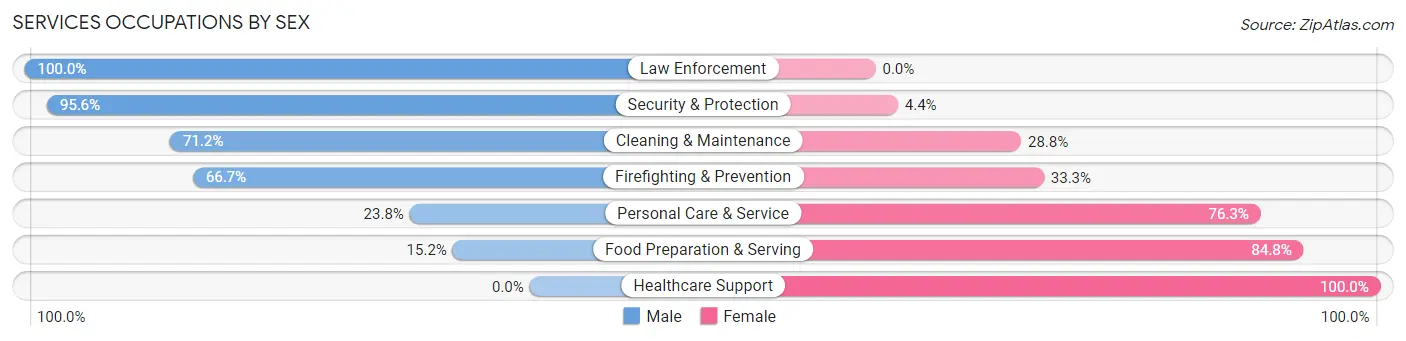
Services Occupations by Sex
Within the Services occupations in Milan, the most male-oriented occupations are Law Enforcement (100.0%), Security & Protection (95.6%), and Cleaning & Maintenance (71.2%), while the most female-oriented occupations are Healthcare Support (100.0%), Food Preparation & Serving (84.8%), and Personal Care & Service (76.2%).
| Occupation | Male | Female |
| Healthcare Support | 0 (0.0%) | 55 (100.0%) |
| Security & Protection | 65 (95.6%) | 3 (4.4%) |
| Firefighting & Prevention | 6 (66.7%) | 3 (33.3%) |
| Law Enforcement | 59 (100.0%) | 0 (0.0%) |
| Food Preparation & Serving | 32 (15.2%) | 178 (84.8%) |
| Cleaning & Maintenance | 84 (71.2%) | 34 (28.8%) |
| Personal Care & Service | 19 (23.7%) | 61 (76.2%) |
| Total (Category) | 200 (37.7%) | 331 (62.3%) |
| Total (Overall) | 1,715 (51.1%) | 1,638 (48.8%) |
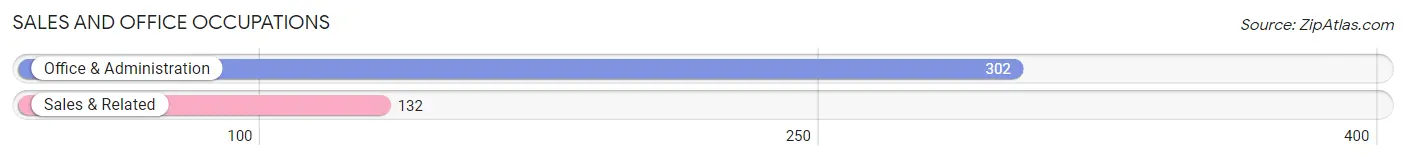
Sales and Office Occupations
The most common Sales and Office occupations in Milan are Office & Administration (302 | 9.0%), and Sales & Related (132 | 3.9%).
Sales and Office Occupations by Sex
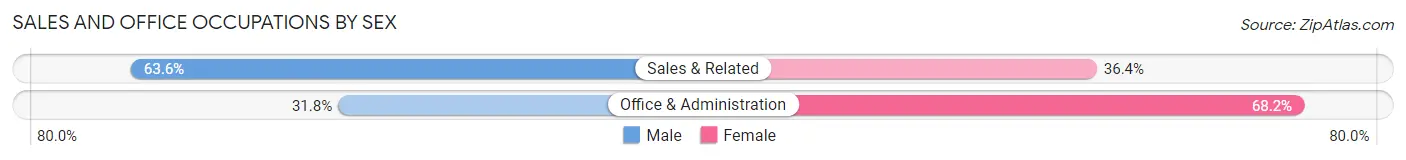
| Occupation | Male | Female |
| Sales & Related | 84 (63.6%) | 48 (36.4%) |
| Office & Administration | 96 (31.8%) | 206 (68.2%) |
| Total (Category) | 180 (41.5%) | 254 (58.5%) |
| Total (Overall) | 1,715 (51.1%) | 1,638 (48.8%) |
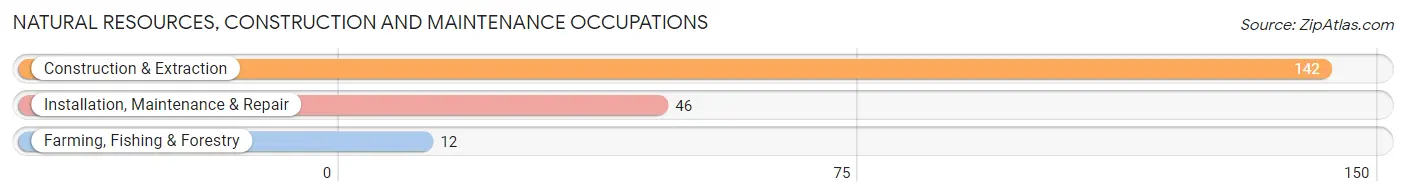
Natural Resources, Construction and Maintenance Occupations
The most common Natural Resources, Construction and Maintenance occupations in Milan are Construction & Extraction (142 | 4.2%), Installation, Maintenance & Repair (46 | 1.4%), and Farming, Fishing & Forestry (12 | 0.4%).
Natural Resources, Construction and Maintenance Occupations by Sex
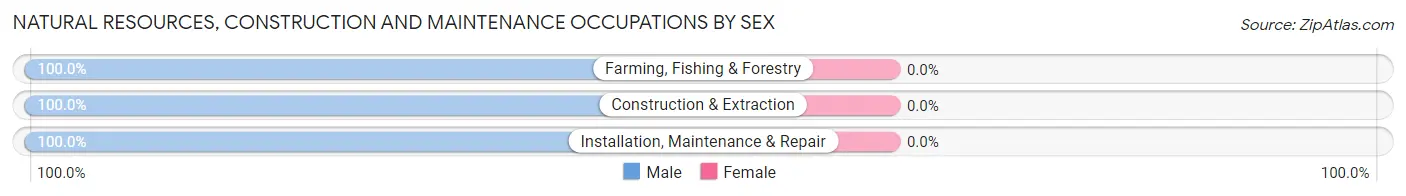
| Occupation | Male | Female |
| Farming, Fishing & Forestry | 12 (100.0%) | 0 (0.0%) |
| Construction & Extraction | 142 (100.0%) | 0 (0.0%) |
| Installation, Maintenance & Repair | 46 (100.0%) | 0 (0.0%) |
| Total (Category) | 200 (100.0%) | 0 (0.0%) |
| Total (Overall) | 1,715 (51.1%) | 1,638 (48.8%) |
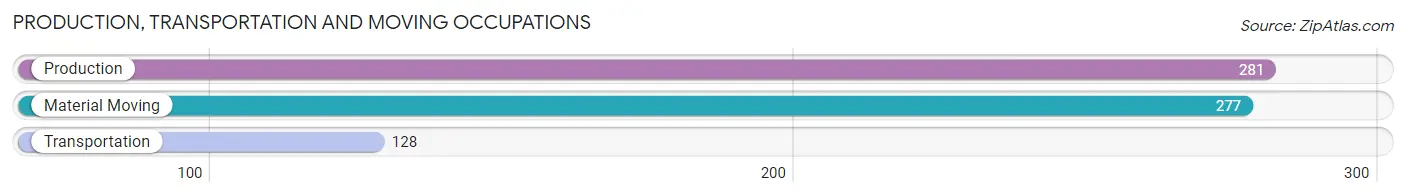
Production, Transportation and Moving Occupations
The most common Production, Transportation and Moving occupations in Milan are Production (281 | 8.4%), Material Moving (277 | 8.3%), and Transportation (128 | 3.8%).
Production, Transportation and Moving Occupations by Sex
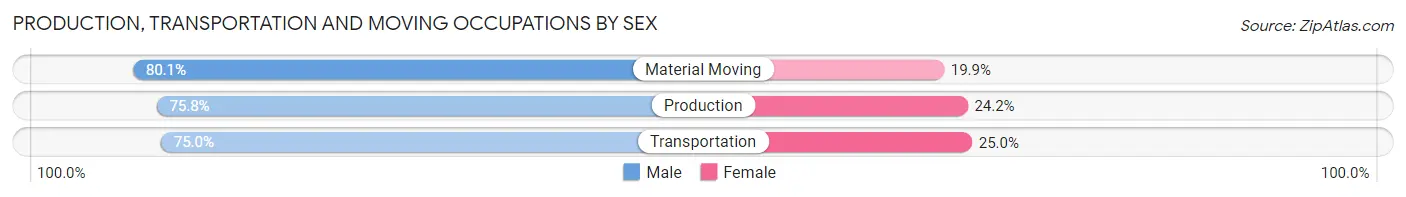
| Occupation | Male | Female |
| Production | 213 (75.8%) | 68 (24.2%) |
| Transportation | 96 (75.0%) | 32 (25.0%) |
| Material Moving | 222 (80.1%) | 55 (19.9%) |
| Total (Category) | 531 (77.4%) | 155 (22.6%) |
| Total (Overall) | 1,715 (51.1%) | 1,638 (48.8%) |
Employment Industries by Sex in Milan
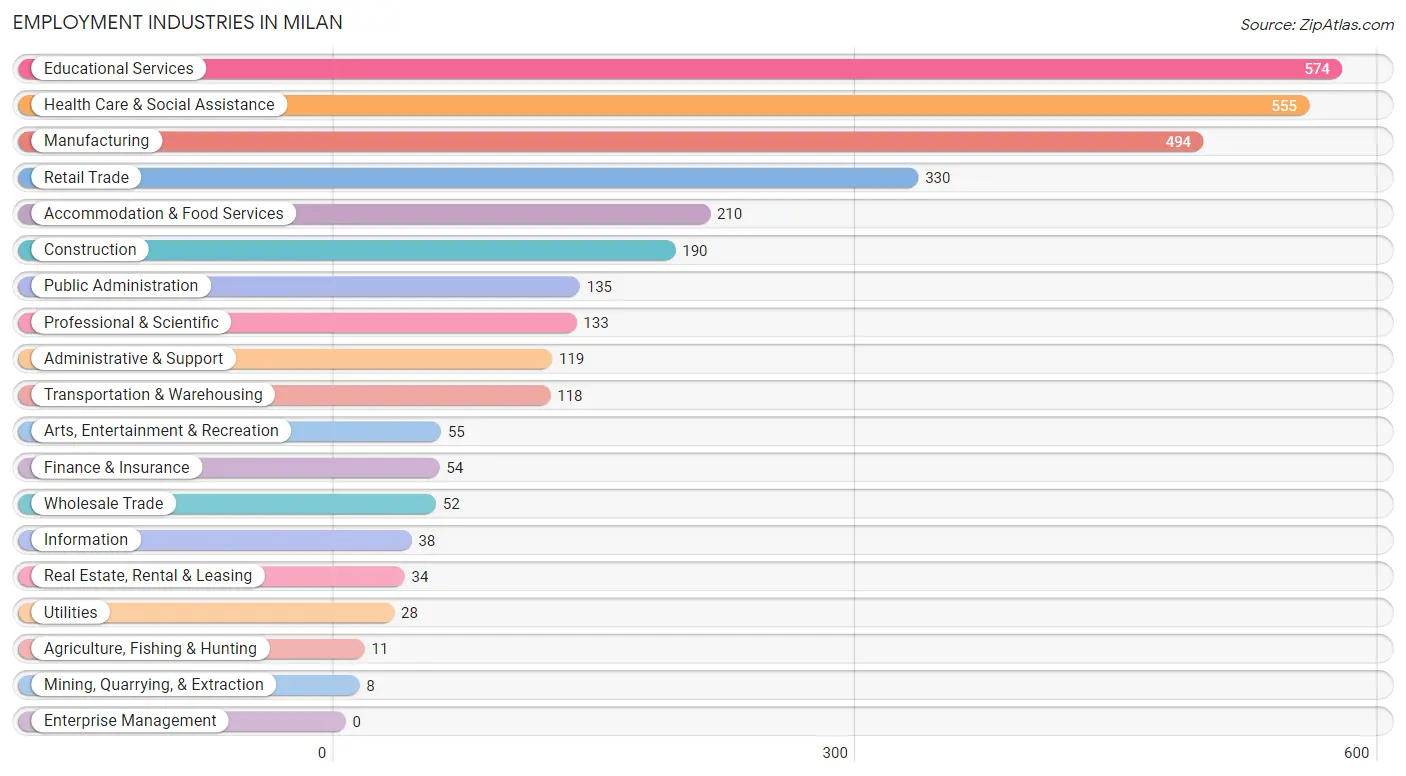
Employment Industries in Milan
The major employment industries in Milan include Educational Services (574 | 17.1%), Health Care & Social Assistance (555 | 16.6%), Manufacturing (494 | 14.7%), Retail Trade (330 | 9.8%), and Accommodation & Food Services (210 | 6.3%).
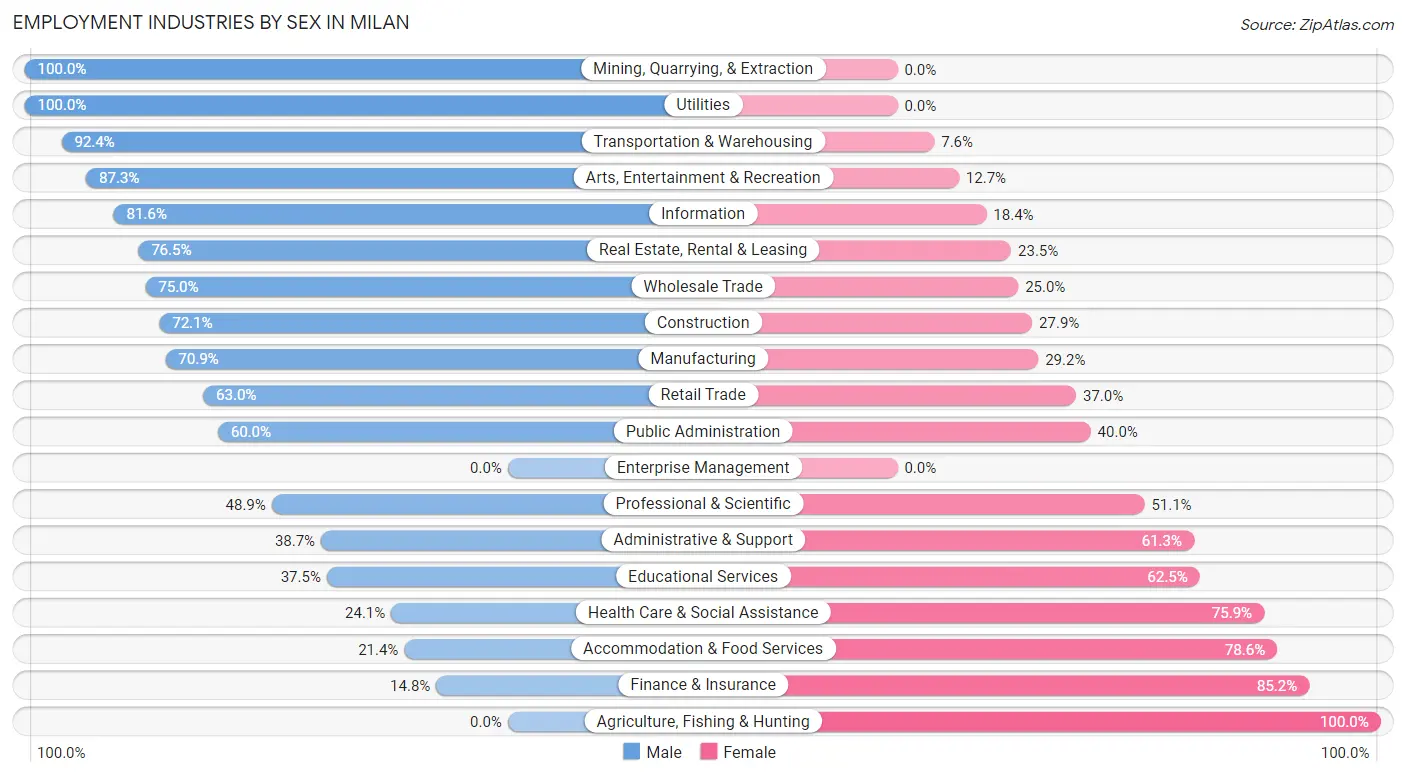
Employment Industries by Sex in Milan
The Milan industries that see more men than women are Mining, Quarrying, & Extraction (100.0%), Utilities (100.0%), and Transportation & Warehousing (92.4%), whereas the industries that tend to have a higher number of women are Agriculture, Fishing & Hunting (100.0%), Finance & Insurance (85.2%), and Accommodation & Food Services (78.6%).
| Industry | Male | Female |
| Agriculture, Fishing & Hunting | 0 (0.0%) | 11 (100.0%) |
| Mining, Quarrying, & Extraction | 8 (100.0%) | 0 (0.0%) |
| Construction | 137 (72.1%) | 53 (27.9%) |
| Manufacturing | 350 (70.9%) | 144 (29.1%) |
| Wholesale Trade | 39 (75.0%) | 13 (25.0%) |
| Retail Trade | 208 (63.0%) | 122 (37.0%) |
| Transportation & Warehousing | 109 (92.4%) | 9 (7.6%) |
| Utilities | 28 (100.0%) | 0 (0.0%) |
| Information | 31 (81.6%) | 7 (18.4%) |
| Finance & Insurance | 8 (14.8%) | 46 (85.2%) |
| Real Estate, Rental & Leasing | 26 (76.5%) | 8 (23.5%) |
| Professional & Scientific | 65 (48.9%) | 68 (51.1%) |
| Enterprise Management | 0 (0.0%) | 0 (0.0%) |
| Administrative & Support | 46 (38.7%) | 73 (61.3%) |
| Educational Services | 215 (37.5%) | 359 (62.5%) |
| Health Care & Social Assistance | 134 (24.1%) | 421 (75.9%) |
| Arts, Entertainment & Recreation | 48 (87.3%) | 7 (12.7%) |
| Accommodation & Food Services | 45 (21.4%) | 165 (78.6%) |
| Public Administration | 81 (60.0%) | 54 (40.0%) |
| Total | 1,715 (51.1%) | 1,638 (48.8%) |
Education in Milan
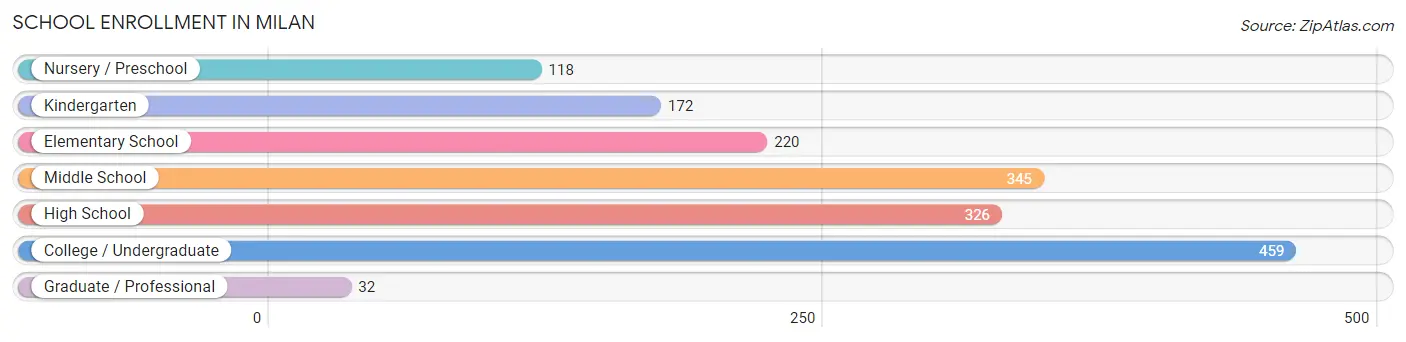
School Enrollment in Milan
The most common levels of schooling among the 1,672 students in Milan are college / undergraduate (459 | 27.5%), middle school (345 | 20.6%), and high school (326 | 19.5%).
| School Level | # Students | % Students |
| Nursery / Preschool | 118 | 7.1% |
| Kindergarten | 172 | 10.3% |
| Elementary School | 220 | 13.2% |
| Middle School | 345 | 20.6% |
| High School | 326 | 19.5% |
| College / Undergraduate | 459 | 27.5% |
| Graduate / Professional | 32 | 1.9% |
| Total | 1,672 | 100.0% |
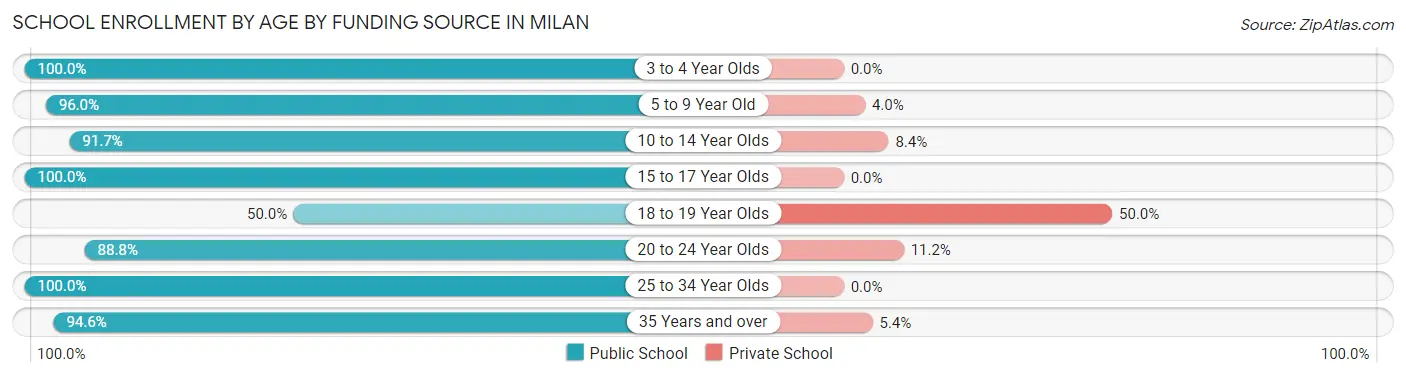
School Enrollment by Age by Funding Source in Milan
Out of a total of 1,672 students who are enrolled in schools in Milan, 157 (9.4%) attend a private institution, while the remaining 1,515 (90.6%) are enrolled in public schools. The age group of 18 to 19 year olds has the highest likelihood of being enrolled in private schools, with 86 (50.0% in the age bracket) enrolled. Conversely, the age group of 3 to 4 year olds has the lowest likelihood of being enrolled in a private school, with 118 (100.0% in the age bracket) attending a public institution.
| Age Bracket | Public School | Private School |
| 3 to 4 Year Olds | 118 (100.0%) | 0 (0.0%) |
| 5 to 9 Year Old | 364 (96.0%) | 15 (4.0%) |
| 10 to 14 Year Olds | 373 (91.6%) | 34 (8.4%) |
| 15 to 17 Year Olds | 277 (100.0%) | 0 (0.0%) |
| 18 to 19 Year Olds | 86 (50.0%) | 86 (50.0%) |
| 20 to 24 Year Olds | 143 (88.8%) | 18 (11.2%) |
| 25 to 34 Year Olds | 65 (100.0%) | 0 (0.0%) |
| 35 Years and over | 88 (94.6%) | 5 (5.4%) |
| Total | 1,515 (90.6%) | 157 (9.4%) |
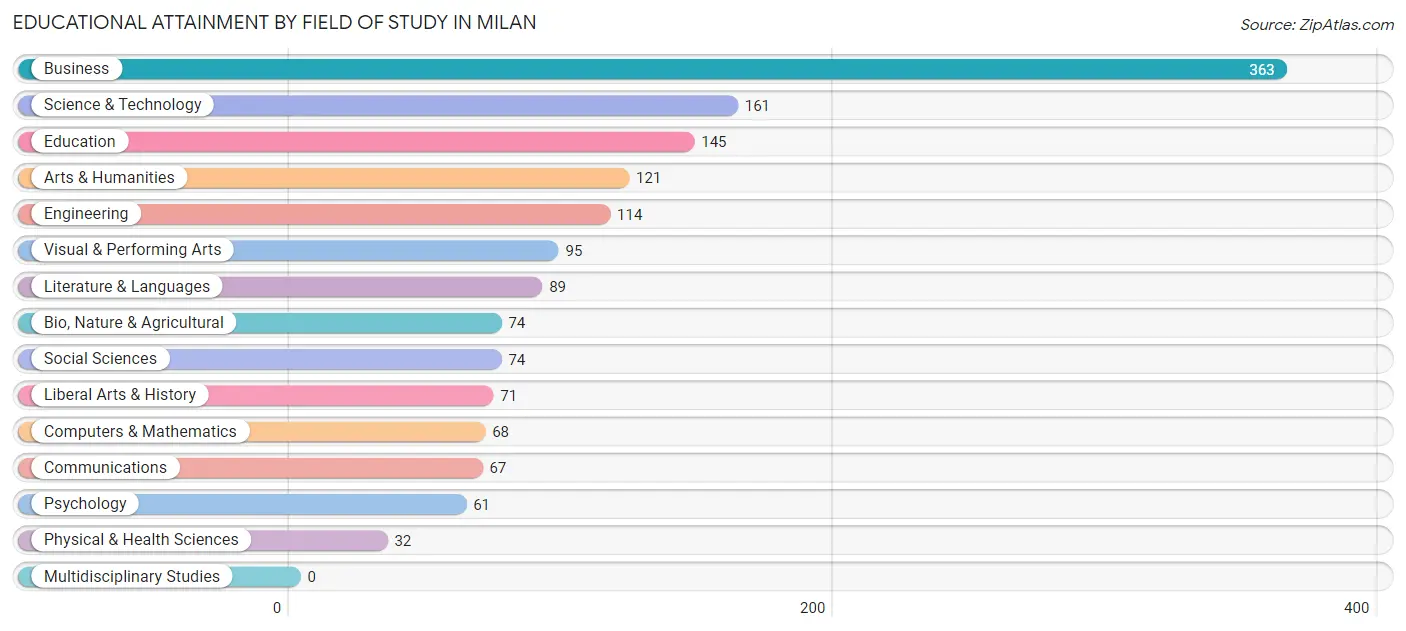
Educational Attainment by Field of Study in Milan
Business (363 | 23.6%), science & technology (161 | 10.5%), education (145 | 9.5%), arts & humanities (121 | 7.9%), and engineering (114 | 7.4%) are the most common fields of study among 1,535 individuals in Milan who have obtained a bachelor's degree or higher.
| Field of Study | # Graduates | % Graduates |
| Computers & Mathematics | 68 | 4.4% |
| Bio, Nature & Agricultural | 74 | 4.8% |
| Physical & Health Sciences | 32 | 2.1% |
| Psychology | 61 | 4.0% |
| Social Sciences | 74 | 4.8% |
| Engineering | 114 | 7.4% |
| Multidisciplinary Studies | 0 | 0.0% |
| Science & Technology | 161 | 10.5% |
| Business | 363 | 23.6% |
| Education | 145 | 9.5% |
| Literature & Languages | 89 | 5.8% |
| Liberal Arts & History | 71 | 4.6% |
| Visual & Performing Arts | 95 | 6.2% |
| Communications | 67 | 4.4% |
| Arts & Humanities | 121 | 7.9% |
| Total | 1,535 | 100.0% |
Transportation & Commute in Milan
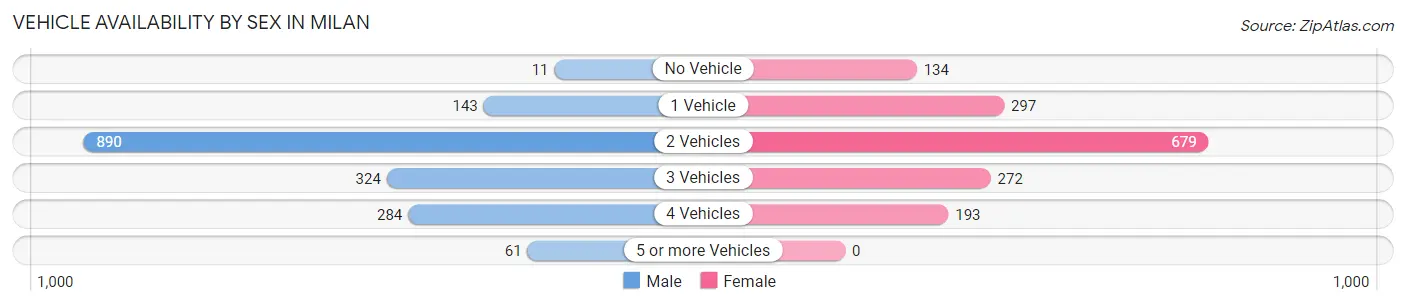
Vehicle Availability by Sex in Milan
The most prevalent vehicle ownership categories in Milan are males with 2 vehicles (890, accounting for 52.0%) and females with 2 vehicles (679, making up 56.5%).
| Vehicles Available | Male | Female |
| No Vehicle | 11 (0.6%) | 134 (8.5%) |
| 1 Vehicle | 143 (8.4%) | 297 (18.9%) |
| 2 Vehicles | 890 (52.0%) | 679 (43.1%) |
| 3 Vehicles | 324 (18.9%) | 272 (17.3%) |
| 4 Vehicles | 284 (16.6%) | 193 (12.2%) |
| 5 or more Vehicles | 61 (3.6%) | 0 (0.0%) |
| Total | 1,713 (100.0%) | 1,575 (100.0%) |
Commute Time in Milan
The most frequently occuring commute durations in Milan are 20 to 24 minutes (671 commuters, 23.1%), 30 to 34 minutes (434 commuters, 14.9%), and 45 to 59 minutes (370 commuters, 12.7%).
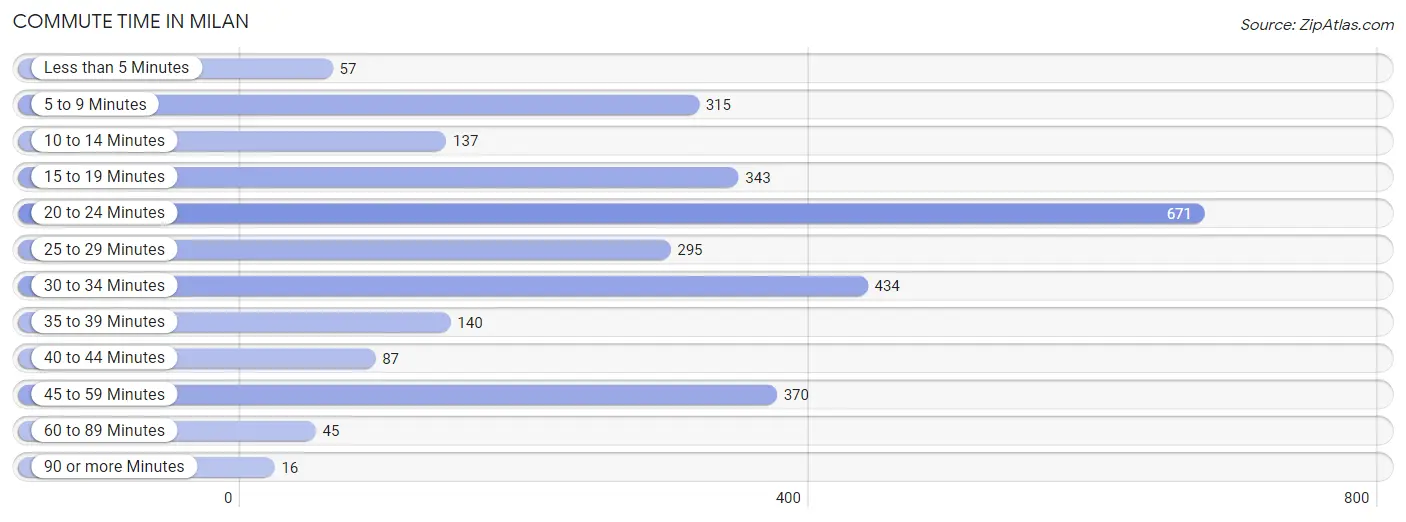
| Commute Time | # Commuters | % Commuters |
| Less than 5 Minutes | 57 | 2.0% |
| 5 to 9 Minutes | 315 | 10.8% |
| 10 to 14 Minutes | 137 | 4.7% |
| 15 to 19 Minutes | 343 | 11.8% |
| 20 to 24 Minutes | 671 | 23.1% |
| 25 to 29 Minutes | 295 | 10.1% |
| 30 to 34 Minutes | 434 | 14.9% |
| 35 to 39 Minutes | 140 | 4.8% |
| 40 to 44 Minutes | 87 | 3.0% |
| 45 to 59 Minutes | 370 | 12.7% |
| 60 to 89 Minutes | 45 | 1.5% |
| 90 or more Minutes | 16 | 0.5% |
Commute Time by Sex in Milan
The most common commute times in Milan are 30 to 34 minutes (329 commuters, 20.8%) for males and 20 to 24 minutes (400 commuters, 30.1%) for females.
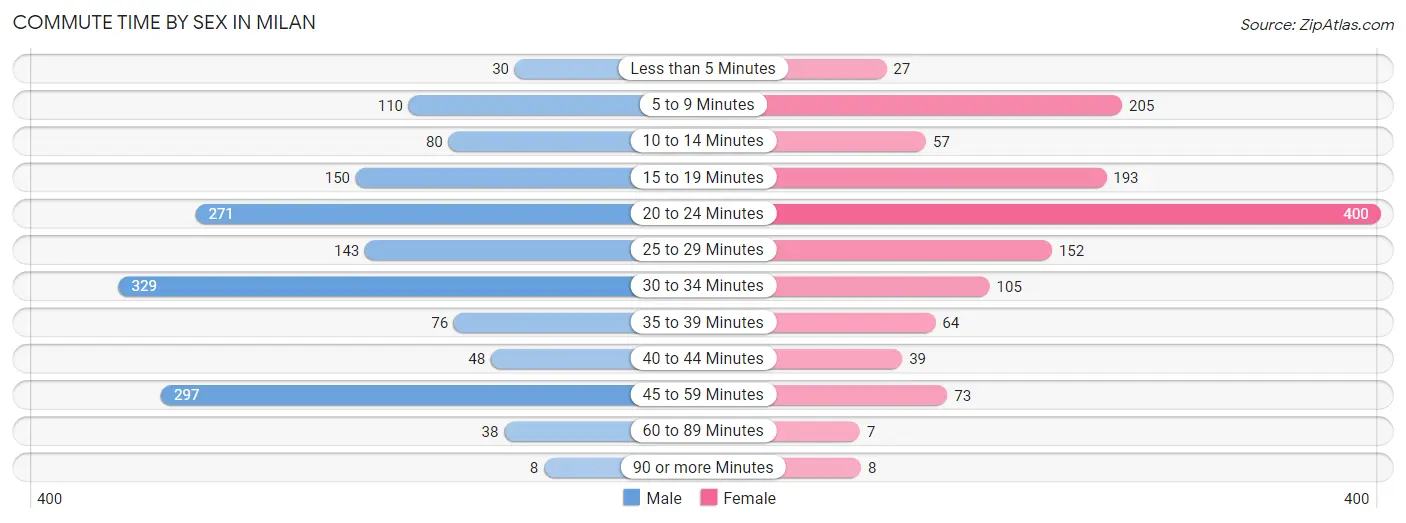
| Commute Time | Male | Female |
| Less than 5 Minutes | 30 (1.9%) | 27 (2.0%) |
| 5 to 9 Minutes | 110 (7.0%) | 205 (15.4%) |
| 10 to 14 Minutes | 80 (5.1%) | 57 (4.3%) |
| 15 to 19 Minutes | 150 (9.5%) | 193 (14.5%) |
| 20 to 24 Minutes | 271 (17.2%) | 400 (30.1%) |
| 25 to 29 Minutes | 143 (9.0%) | 152 (11.4%) |
| 30 to 34 Minutes | 329 (20.8%) | 105 (7.9%) |
| 35 to 39 Minutes | 76 (4.8%) | 64 (4.8%) |
| 40 to 44 Minutes | 48 (3.0%) | 39 (2.9%) |
| 45 to 59 Minutes | 297 (18.8%) | 73 (5.5%) |
| 60 to 89 Minutes | 38 (2.4%) | 7 (0.5%) |
| 90 or more Minutes | 8 (0.5%) | 8 (0.6%) |
Time of Departure to Work by Sex in Milan
The most frequent times of departure to work in Milan are 6:00 AM to 6:29 AM (252, 16.0%) for males and 7:00 AM to 7:29 AM (253, 19.0%) for females.
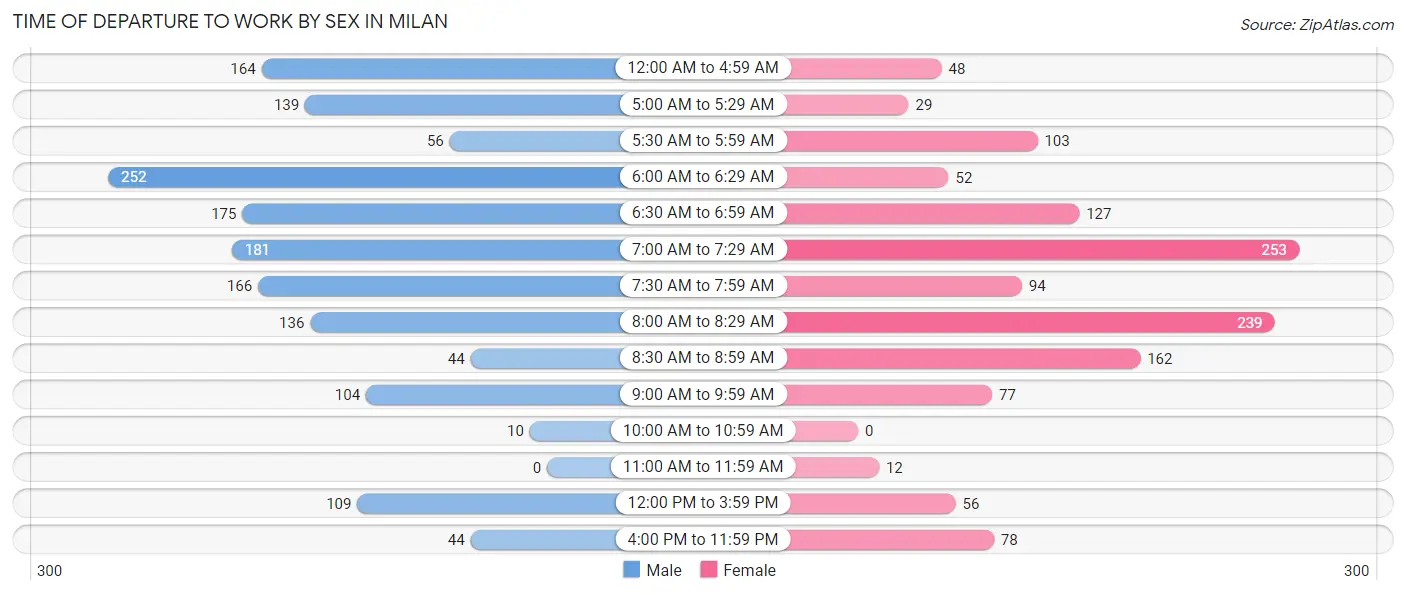
| Time of Departure | Male | Female |
| 12:00 AM to 4:59 AM | 164 (10.4%) | 48 (3.6%) |
| 5:00 AM to 5:29 AM | 139 (8.8%) | 29 (2.2%) |
| 5:30 AM to 5:59 AM | 56 (3.5%) | 103 (7.7%) |
| 6:00 AM to 6:29 AM | 252 (16.0%) | 52 (3.9%) |
| 6:30 AM to 6:59 AM | 175 (11.1%) | 127 (9.6%) |
| 7:00 AM to 7:29 AM | 181 (11.5%) | 253 (19.0%) |
| 7:30 AM to 7:59 AM | 166 (10.5%) | 94 (7.1%) |
| 8:00 AM to 8:29 AM | 136 (8.6%) | 239 (18.0%) |
| 8:30 AM to 8:59 AM | 44 (2.8%) | 162 (12.2%) |
| 9:00 AM to 9:59 AM | 104 (6.6%) | 77 (5.8%) |
| 10:00 AM to 10:59 AM | 10 (0.6%) | 0 (0.0%) |
| 11:00 AM to 11:59 AM | 0 (0.0%) | 12 (0.9%) |
| 12:00 PM to 3:59 PM | 109 (6.9%) | 56 (4.2%) |
| 4:00 PM to 11:59 PM | 44 (2.8%) | 78 (5.9%) |
| Total | 1,580 (100.0%) | 1,330 (100.0%) |
Housing Occupancy in Milan
Occupancy by Ownership in Milan
Of the total 2,522 dwellings in Milan, owner-occupied units account for 1,802 (71.5%), while renter-occupied units make up 720 (28.5%).
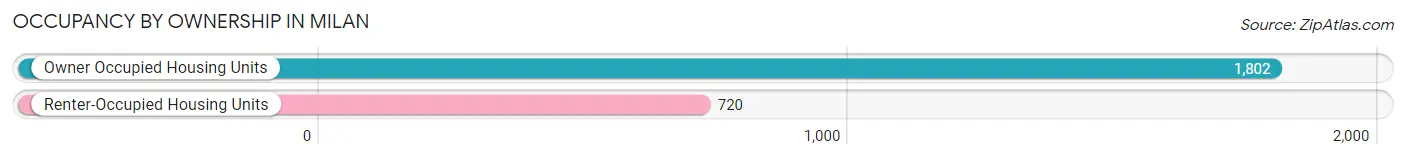
| Occupancy | # Housing Units | % Housing Units |
| Owner Occupied Housing Units | 1,802 | 71.5% |
| Renter-Occupied Housing Units | 720 | 28.5% |
| Total Occupied Housing Units | 2,522 | 100.0% |
Occupancy by Household Size in Milan
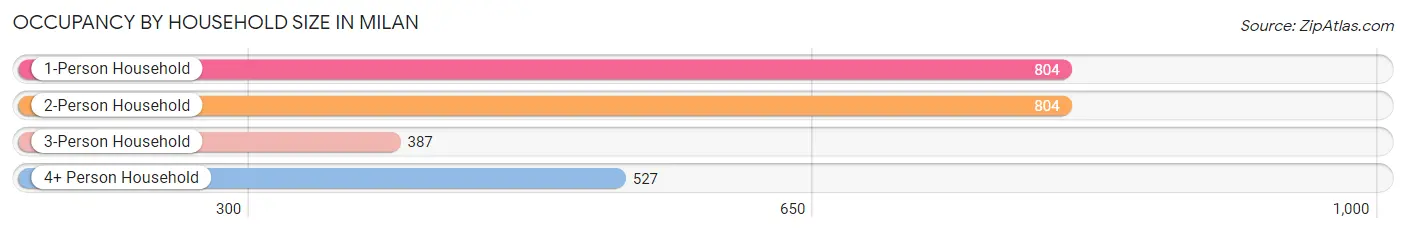
| Household Size | # Housing Units | % Housing Units |
| 1-Person Household | 804 | 31.9% |
| 2-Person Household | 804 | 31.9% |
| 3-Person Household | 387 | 15.3% |
| 4+ Person Household | 527 | 20.9% |
| Total Housing Units | 2,522 | 100.0% |
Occupancy by Ownership by Household Size in Milan
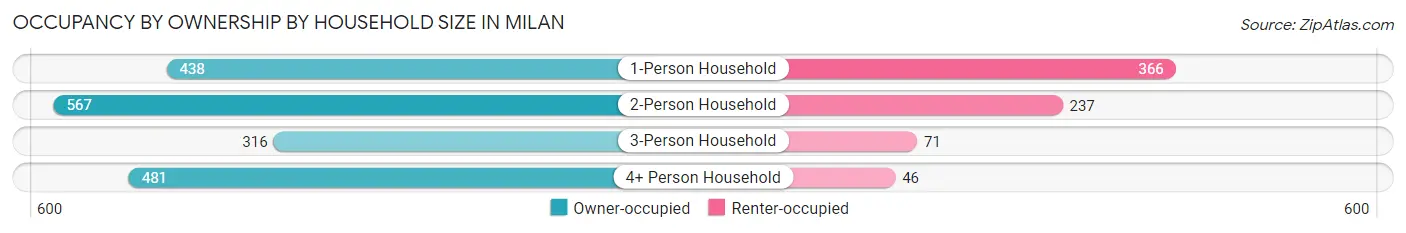
| Household Size | Owner-occupied | Renter-occupied |
| 1-Person Household | 438 (54.5%) | 366 (45.5%) |
| 2-Person Household | 567 (70.5%) | 237 (29.5%) |
| 3-Person Household | 316 (81.7%) | 71 (18.3%) |
| 4+ Person Household | 481 (91.3%) | 46 (8.7%) |
| Total Housing Units | 1,802 (71.5%) | 720 (28.5%) |
Occupancy by Educational Attainment in Milan
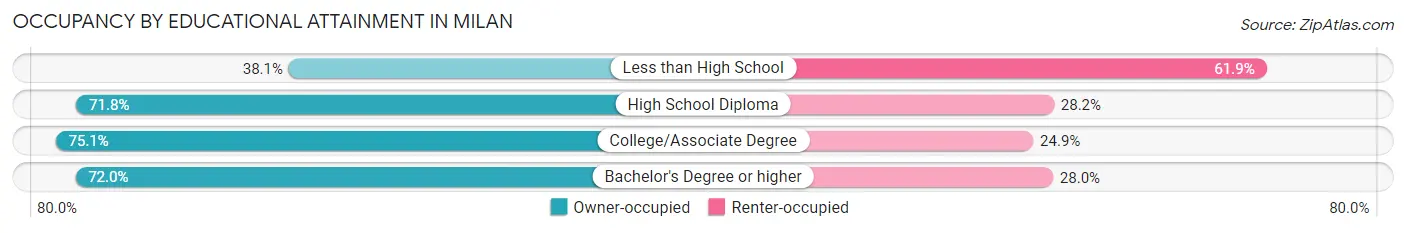
| Household Size | Owner-occupied | Renter-occupied |
| Less than High School | 48 (38.1%) | 78 (61.9%) |
| High School Diploma | 367 (71.8%) | 144 (28.2%) |
| College/Associate Degree | 727 (75.1%) | 241 (24.9%) |
| Bachelor's Degree or higher | 660 (72.0%) | 257 (28.0%) |
Occupancy by Age of Householder in Milan
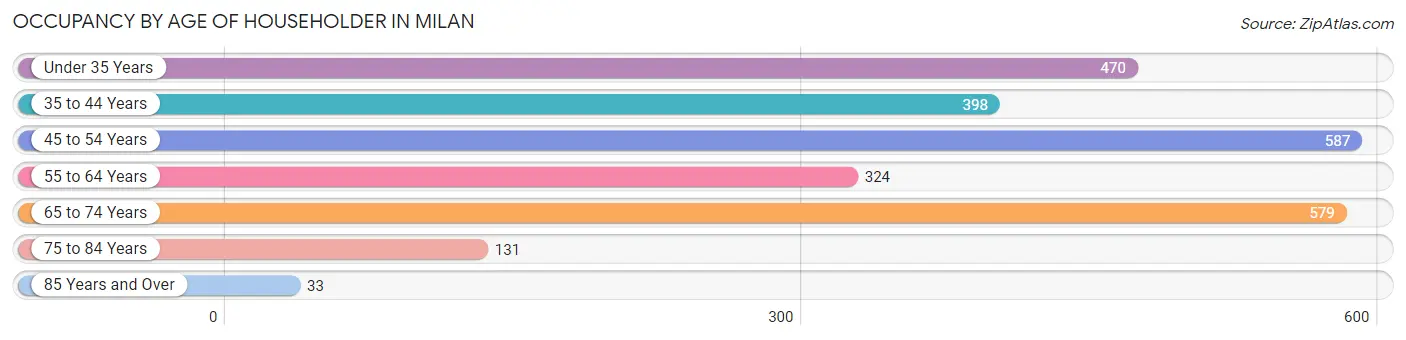
| Age Bracket | # Households | % Households |
| Under 35 Years | 470 | 18.6% |
| 35 to 44 Years | 398 | 15.8% |
| 45 to 54 Years | 587 | 23.3% |
| 55 to 64 Years | 324 | 12.9% |
| 65 to 74 Years | 579 | 23.0% |
| 75 to 84 Years | 131 | 5.2% |
| 85 Years and Over | 33 | 1.3% |
| Total | 2,522 | 100.0% |
Housing Finances in Milan
Median Income by Occupancy in Milan
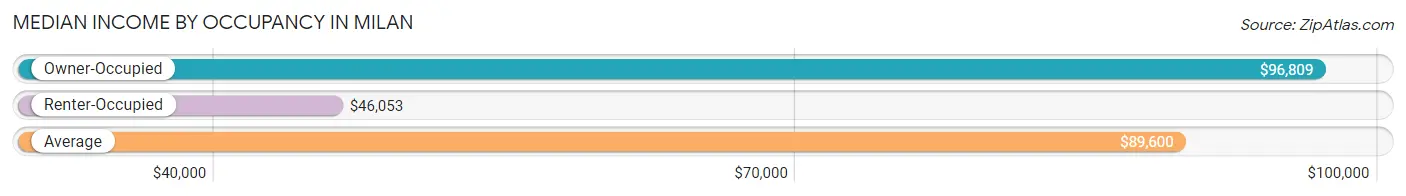
| Occupancy Type | # Households | Median Income |
| Owner-Occupied | 1,802 (71.5%) | $96,809 |
| Renter-Occupied | 720 (28.5%) | $46,053 |
| Average | 2,522 (100.0%) | $89,600 |
Occupancy by Householder Income Bracket in Milan
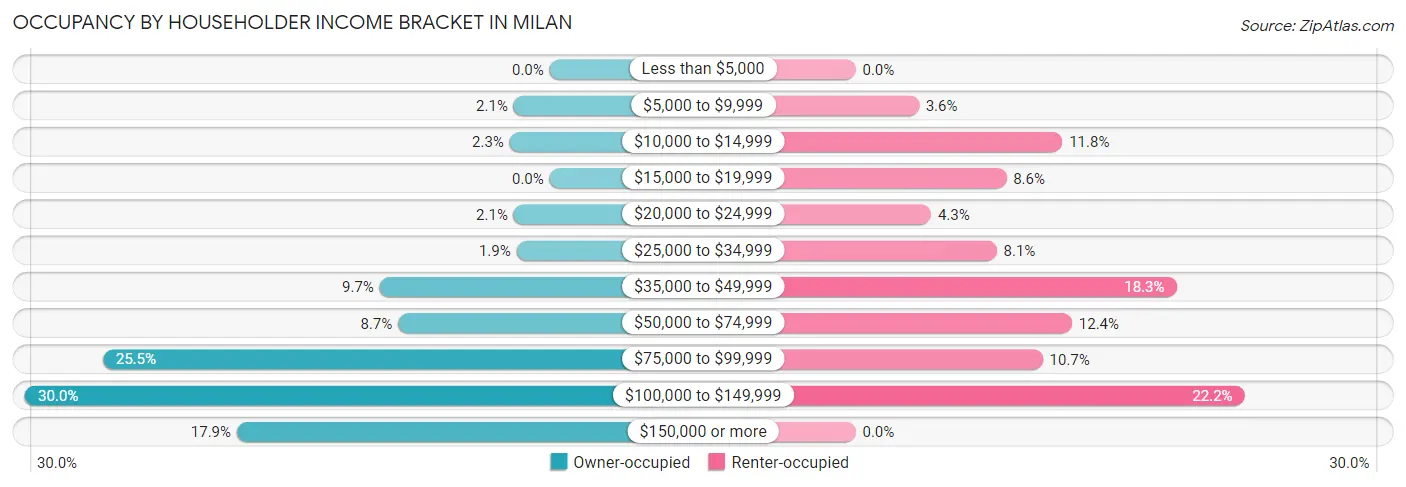
| Income Bracket | Owner-occupied | Renter-occupied |
| Less than $5,000 | 0 (0.0%) | 0 (0.0%) |
| $5,000 to $9,999 | 37 (2.1%) | 26 (3.6%) |
| $10,000 to $14,999 | 41 (2.3%) | 85 (11.8%) |
| $15,000 to $19,999 | 0 (0.0%) | 62 (8.6%) |
| $20,000 to $24,999 | 37 (2.1%) | 31 (4.3%) |
| $25,000 to $34,999 | 34 (1.9%) | 58 (8.1%) |
| $35,000 to $49,999 | 175 (9.7%) | 132 (18.3%) |
| $50,000 to $74,999 | 156 (8.7%) | 89 (12.4%) |
| $75,000 to $99,999 | 460 (25.5%) | 77 (10.7%) |
| $100,000 to $149,999 | 540 (30.0%) | 160 (22.2%) |
| $150,000 or more | 322 (17.9%) | 0 (0.0%) |
| Total | 1,802 (100.0%) | 720 (100.0%) |
Monthly Housing Cost Tiers in Milan
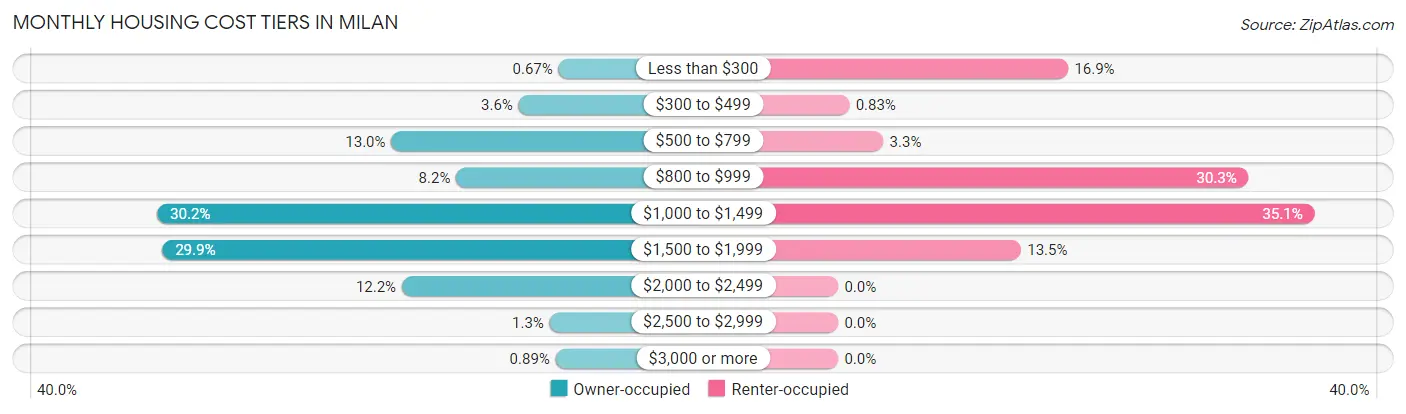
| Monthly Cost | Owner-occupied | Renter-occupied |
| Less than $300 | 12 (0.7%) | 122 (16.9%) |
| $300 to $499 | 65 (3.6%) | 6 (0.8%) |
| $500 to $799 | 234 (13.0%) | 24 (3.3%) |
| $800 to $999 | 148 (8.2%) | 218 (30.3%) |
| $1,000 to $1,499 | 545 (30.2%) | 253 (35.1%) |
| $1,500 to $1,999 | 538 (29.9%) | 97 (13.5%) |
| $2,000 to $2,499 | 220 (12.2%) | 0 (0.0%) |
| $2,500 to $2,999 | 24 (1.3%) | 0 (0.0%) |
| $3,000 or more | 16 (0.9%) | 0 (0.0%) |
| Total | 1,802 (100.0%) | 720 (100.0%) |
Physical Housing Characteristics in Milan
Housing Structures in Milan
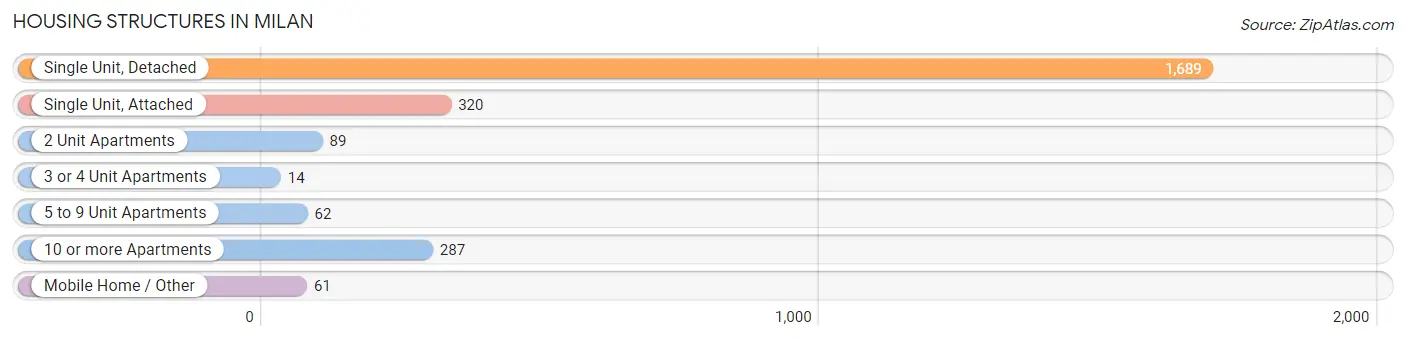
| Structure Type | # Housing Units | % Housing Units |
| Single Unit, Detached | 1,689 | 67.0% |
| Single Unit, Attached | 320 | 12.7% |
| 2 Unit Apartments | 89 | 3.5% |
| 3 or 4 Unit Apartments | 14 | 0.6% |
| 5 to 9 Unit Apartments | 62 | 2.5% |
| 10 or more Apartments | 287 | 11.4% |
| Mobile Home / Other | 61 | 2.4% |
| Total | 2,522 | 100.0% |
Housing Structures by Occupancy in Milan
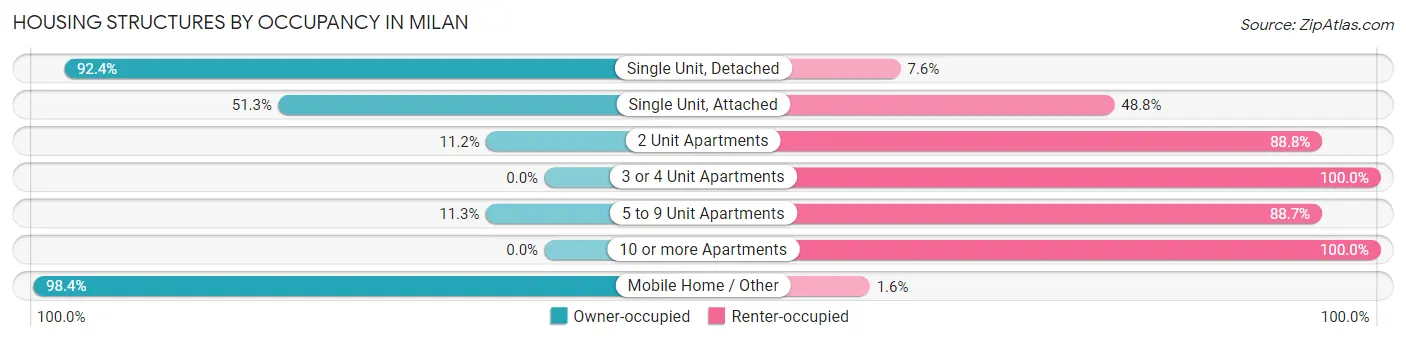
| Structure Type | Owner-occupied | Renter-occupied |
| Single Unit, Detached | 1,561 (92.4%) | 128 (7.6%) |
| Single Unit, Attached | 164 (51.2%) | 156 (48.7%) |
| 2 Unit Apartments | 10 (11.2%) | 79 (88.8%) |
| 3 or 4 Unit Apartments | 0 (0.0%) | 14 (100.0%) |
| 5 to 9 Unit Apartments | 7 (11.3%) | 55 (88.7%) |
| 10 or more Apartments | 0 (0.0%) | 287 (100.0%) |
| Mobile Home / Other | 60 (98.4%) | 1 (1.6%) |
| Total | 1,802 (71.5%) | 720 (28.5%) |
Housing Structures by Number of Rooms in Milan
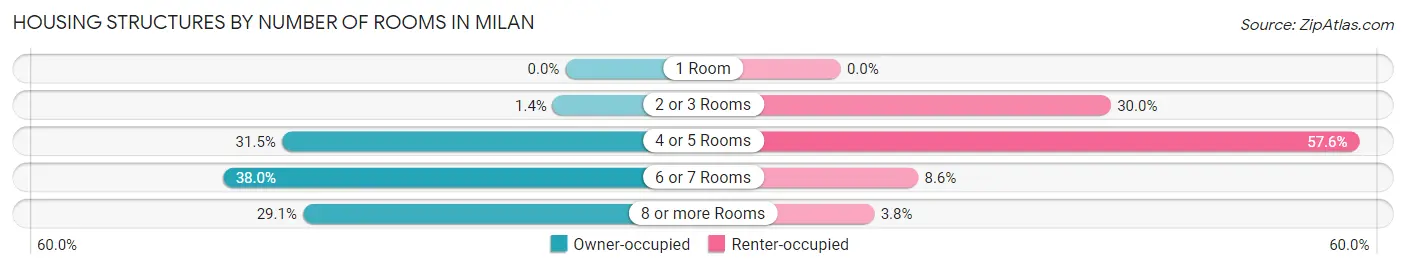
| Number of Rooms | Owner-occupied | Renter-occupied |
| 1 Room | 0 (0.0%) | 0 (0.0%) |
| 2 or 3 Rooms | 25 (1.4%) | 216 (30.0%) |
| 4 or 5 Rooms | 567 (31.5%) | 415 (57.6%) |
| 6 or 7 Rooms | 685 (38.0%) | 62 (8.6%) |
| 8 or more Rooms | 525 (29.1%) | 27 (3.7%) |
| Total | 1,802 (100.0%) | 720 (100.0%) |
Housing Structure by Heating Type in Milan
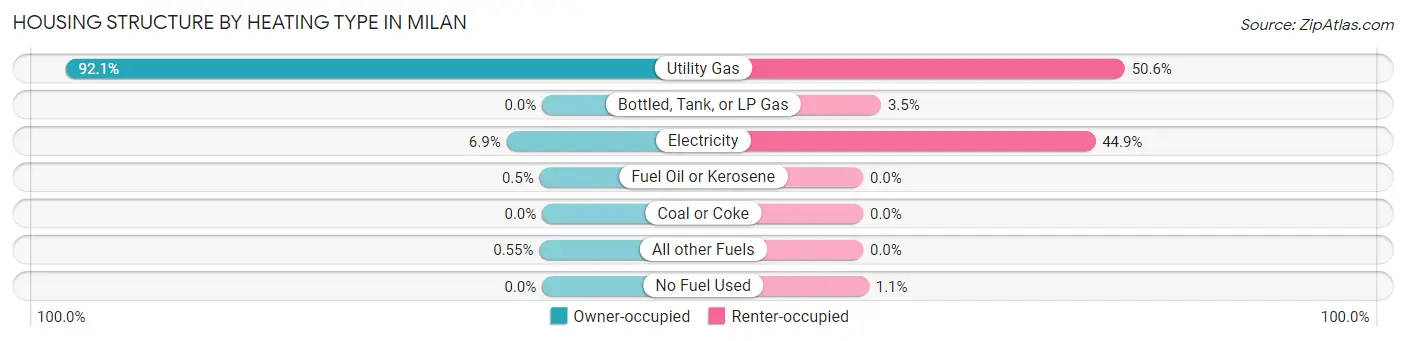
| Heating Type | Owner-occupied | Renter-occupied |
| Utility Gas | 1,659 (92.1%) | 364 (50.6%) |
| Bottled, Tank, or LP Gas | 0 (0.0%) | 25 (3.5%) |
| Electricity | 124 (6.9%) | 323 (44.9%) |
| Fuel Oil or Kerosene | 9 (0.5%) | 0 (0.0%) |
| Coal or Coke | 0 (0.0%) | 0 (0.0%) |
| All other Fuels | 10 (0.5%) | 0 (0.0%) |
| No Fuel Used | 0 (0.0%) | 8 (1.1%) |
| Total | 1,802 (100.0%) | 720 (100.0%) |
Household Vehicle Usage in Milan
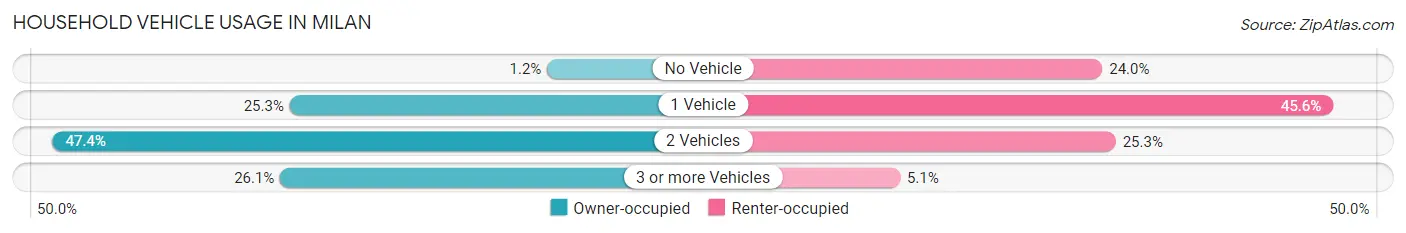
| Vehicles per Household | Owner-occupied | Renter-occupied |
| No Vehicle | 22 (1.2%) | 173 (24.0%) |
| 1 Vehicle | 455 (25.3%) | 328 (45.6%) |
| 2 Vehicles | 854 (47.4%) | 182 (25.3%) |
| 3 or more Vehicles | 471 (26.1%) | 37 (5.1%) |
| Total | 1,802 (100.0%) | 720 (100.0%) |
Real Estate & Mortgages in Milan
Real Estate and Mortgage Overview in Milan
| Characteristic | Without Mortgage | With Mortgage |
| Housing Units | 387 | 1,415 |
| Median Property Value | $196,100 | $224,700 |
| Median Household Income | $59,306 | $293 |
| Monthly Housing Costs | $649 | $16 |
| Real Estate Taxes | $3,517 | $17 |
Property Value by Mortgage Status in Milan
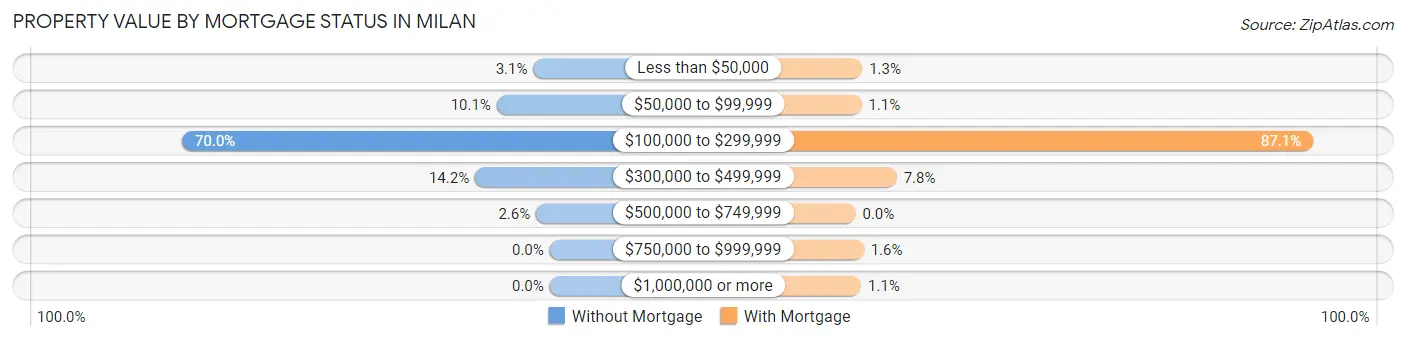
| Property Value | Without Mortgage | With Mortgage |
| Less than $50,000 | 12 (3.1%) | 18 (1.3%) |
| $50,000 to $99,999 | 39 (10.1%) | 16 (1.1%) |
| $100,000 to $299,999 | 271 (70.0%) | 1,233 (87.1%) |
| $300,000 to $499,999 | 55 (14.2%) | 111 (7.8%) |
| $500,000 to $749,999 | 10 (2.6%) | 0 (0.0%) |
| $750,000 to $999,999 | 0 (0.0%) | 22 (1.5%) |
| $1,000,000 or more | 0 (0.0%) | 15 (1.1%) |
| Total | 387 (100.0%) | 1,415 (100.0%) |
Household Income by Mortgage Status in Milan
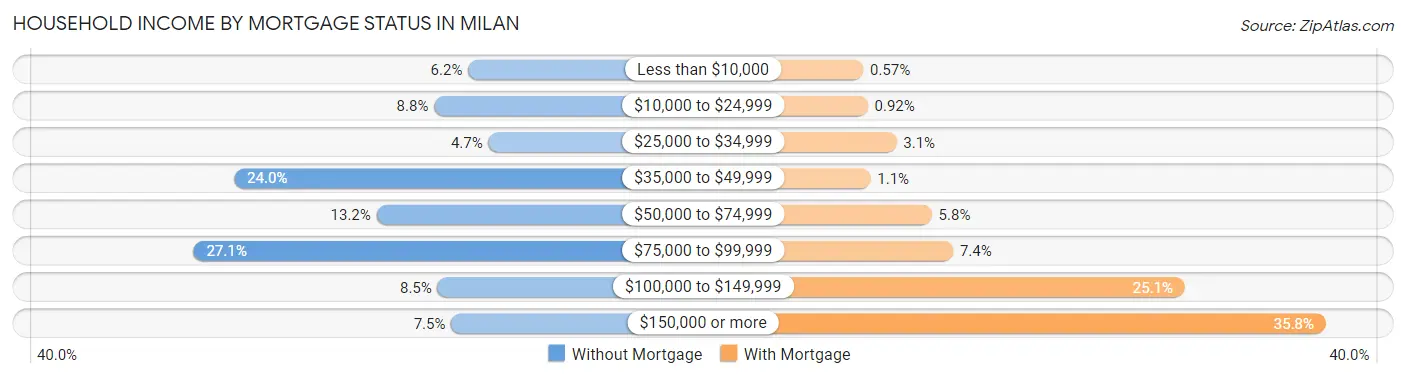
| Household Income | Without Mortgage | With Mortgage |
| Less than $10,000 | 24 (6.2%) | 8 (0.6%) |
| $10,000 to $24,999 | 34 (8.8%) | 13 (0.9%) |
| $25,000 to $34,999 | 18 (4.6%) | 44 (3.1%) |
| $35,000 to $49,999 | 93 (24.0%) | 16 (1.1%) |
| $50,000 to $74,999 | 51 (13.2%) | 82 (5.8%) |
| $75,000 to $99,999 | 105 (27.1%) | 105 (7.4%) |
| $100,000 to $149,999 | 33 (8.5%) | 355 (25.1%) |
| $150,000 or more | 29 (7.5%) | 507 (35.8%) |
| Total | 387 (100.0%) | 1,415 (100.0%) |
Property Value to Household Income Ratio in Milan
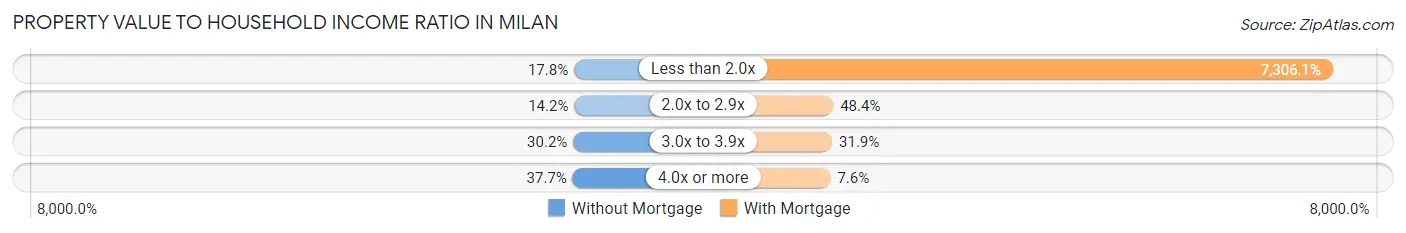
| Value-to-Income Ratio | Without Mortgage | With Mortgage |
| Less than 2.0x | 69 (17.8%) | 103,381 (7,306.1%) |
| 2.0x to 2.9x | 55 (14.2%) | 685 (48.4%) |
| 3.0x to 3.9x | 117 (30.2%) | 452 (31.9%) |
| 4.0x or more | 146 (37.7%) | 107 (7.6%) |
| Total | 387 (100.0%) | 1,415 (100.0%) |
Real Estate Taxes by Mortgage Status in Milan
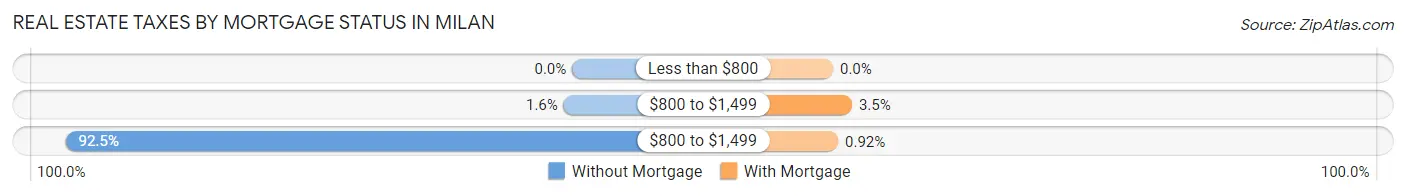
| Property Taxes | Without Mortgage | With Mortgage |
| Less than $800 | 0 (0.0%) | 0 (0.0%) |
| $800 to $1,499 | 6 (1.5%) | 49 (3.5%) |
| $800 to $1,499 | 358 (92.5%) | 13 (0.9%) |
| Total | 387 (100.0%) | 1,415 (100.0%) |
Health & Disability in Milan
Health Insurance Coverage by Age in Milan
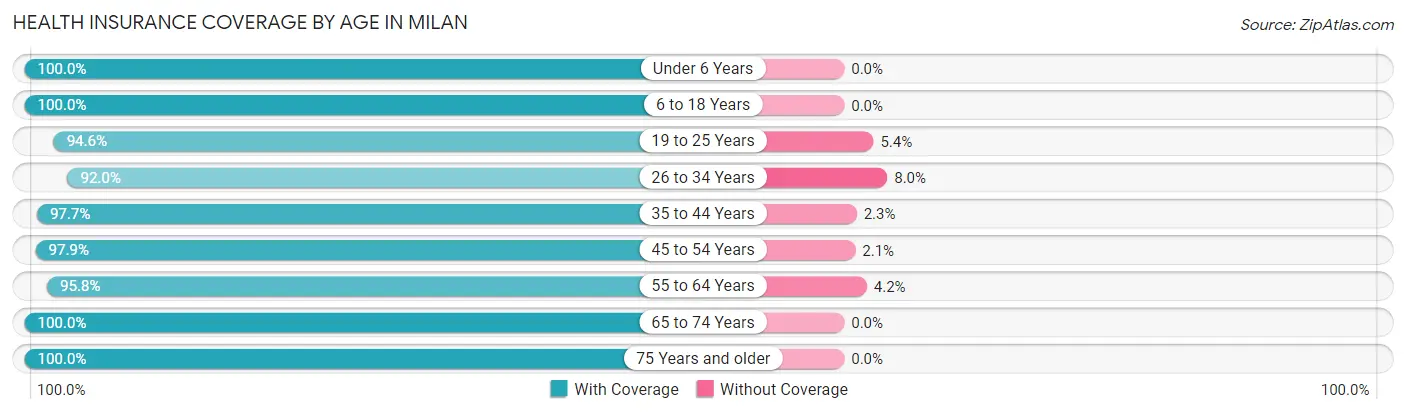
| Age Bracket | With Coverage | Without Coverage |
| Under 6 Years | 332 (100.0%) | 0 (0.0%) |
| 6 to 18 Years | 1,124 (100.0%) | 0 (0.0%) |
| 19 to 25 Years | 591 (94.6%) | 34 (5.4%) |
| 26 to 34 Years | 642 (92.0%) | 56 (8.0%) |
| 35 to 44 Years | 842 (97.7%) | 20 (2.3%) |
| 45 to 54 Years | 905 (97.9%) | 19 (2.1%) |
| 55 to 64 Years | 591 (95.8%) | 26 (4.2%) |
| 65 to 74 Years | 713 (100.0%) | 0 (0.0%) |
| 75 Years and older | 258 (100.0%) | 0 (0.0%) |
| Total | 5,998 (97.5%) | 155 (2.5%) |
Health Insurance Coverage by Citizenship Status in Milan
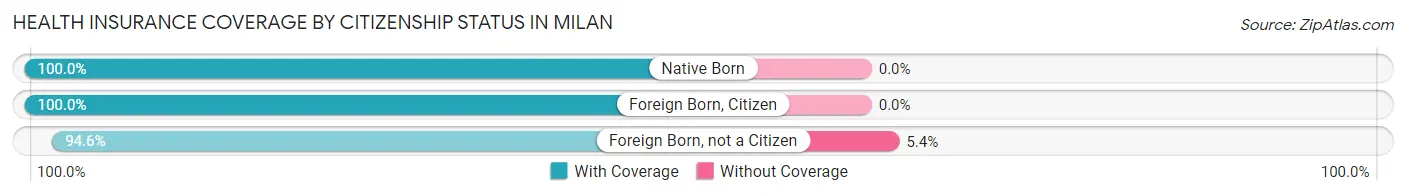
| Citizenship Status | With Coverage | Without Coverage |
| Native Born | 332 (100.0%) | 0 (0.0%) |
| Foreign Born, Citizen | 1,124 (100.0%) | 0 (0.0%) |
| Foreign Born, not a Citizen | 591 (94.6%) | 34 (5.4%) |
Health Insurance Coverage by Household Income in Milan
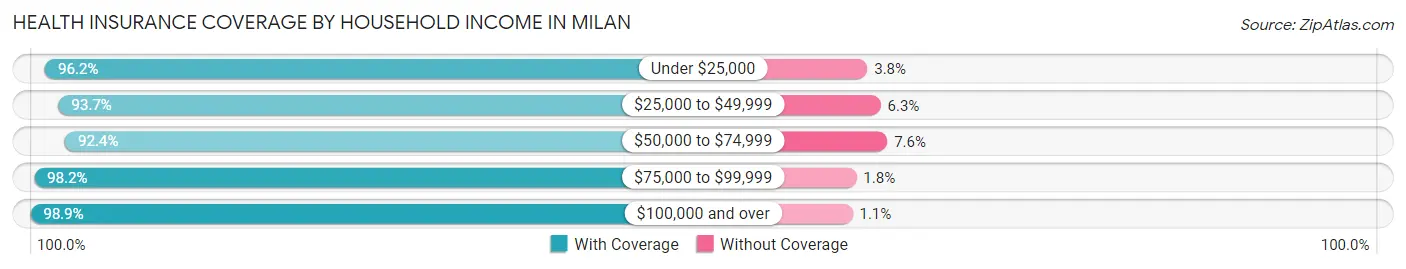
| Household Income | With Coverage | Without Coverage |
| Under $25,000 | 501 (96.2%) | 20 (3.8%) |
| $25,000 to $49,999 | 502 (93.7%) | 34 (6.3%) |
| $50,000 to $74,999 | 524 (92.4%) | 43 (7.6%) |
| $75,000 to $99,999 | 1,307 (98.2%) | 24 (1.8%) |
| $100,000 and over | 3,156 (98.9%) | 34 (1.1%) |
Public vs Private Health Insurance Coverage by Age in Milan
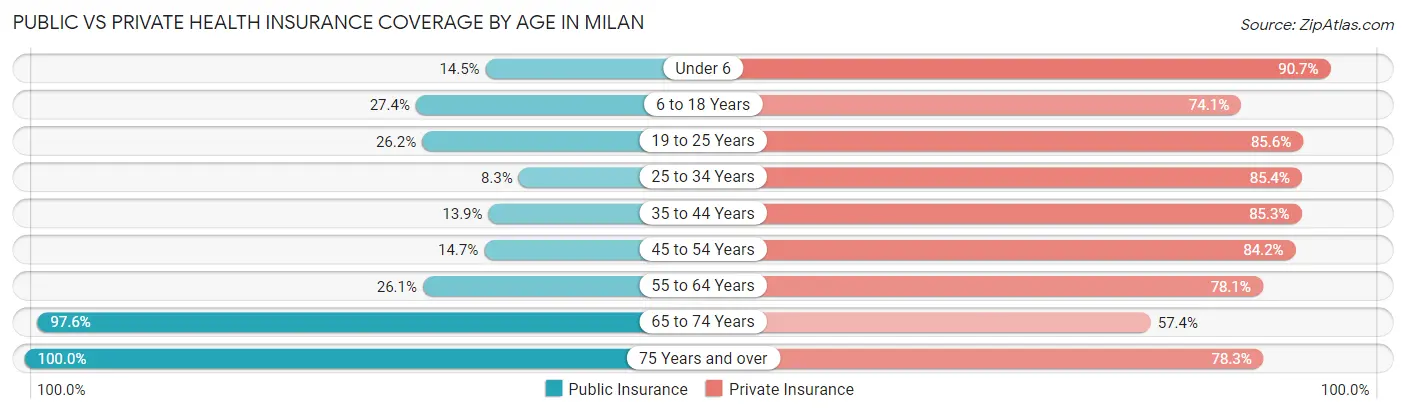
| Age Bracket | Public Insurance | Private Insurance |
| Under 6 | 48 (14.5%) | 301 (90.7%) |
| 6 to 18 Years | 308 (27.4%) | 833 (74.1%) |
| 19 to 25 Years | 164 (26.2%) | 535 (85.6%) |
| 25 to 34 Years | 58 (8.3%) | 596 (85.4%) |
| 35 to 44 Years | 120 (13.9%) | 735 (85.3%) |
| 45 to 54 Years | 136 (14.7%) | 778 (84.2%) |
| 55 to 64 Years | 161 (26.1%) | 482 (78.1%) |
| 65 to 74 Years | 696 (97.6%) | 409 (57.4%) |
| 75 Years and over | 258 (100.0%) | 202 (78.3%) |
| Total | 1,949 (31.7%) | 4,871 (79.2%) |
Disability Status by Sex by Age in Milan
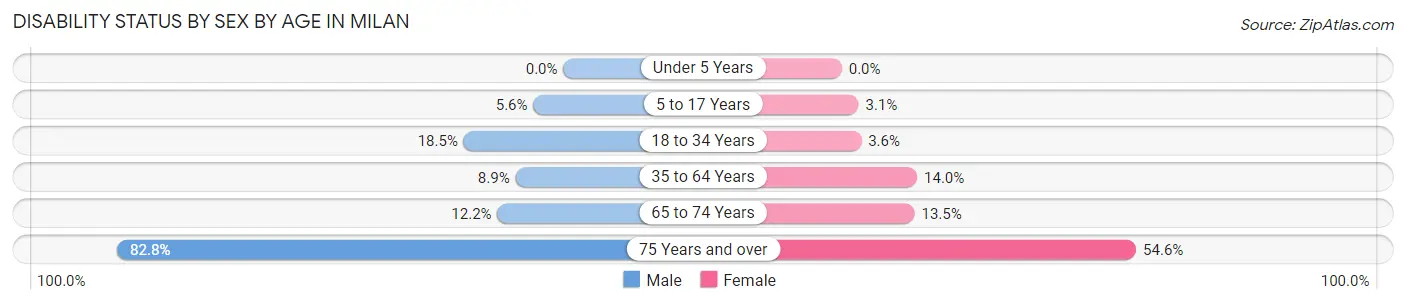
| Age Bracket | Male | Female |
| Under 5 Years | 0 (0.0%) | 0 (0.0%) |
| 5 to 17 Years | 28 (5.6%) | 19 (3.1%) |
| 18 to 34 Years | 152 (18.5%) | 20 (3.6%) |
| 35 to 64 Years | 101 (8.9%) | 177 (14.0%) |
| 65 to 74 Years | 42 (12.2%) | 50 (13.5%) |
| 75 Years and over | 53 (82.8%) | 106 (54.6%) |
Disability Class by Sex by Age in Milan
Disability Class: Hearing Difficulty
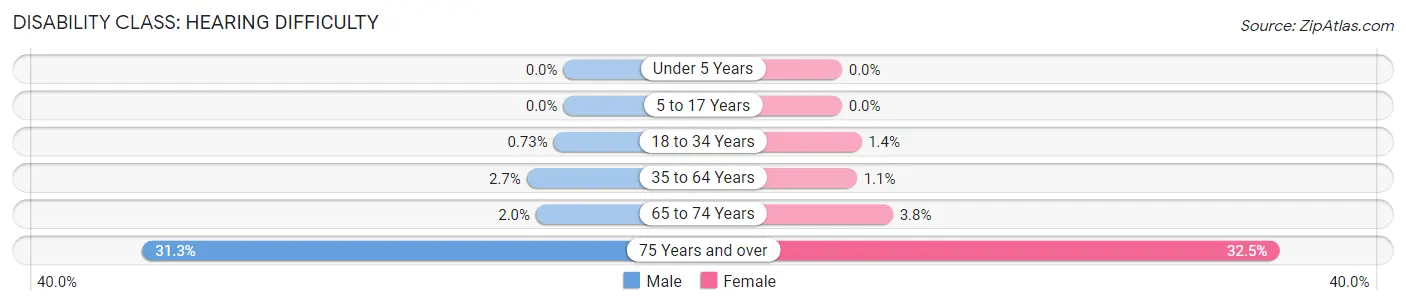
| Age Bracket | Male | Female |
| Under 5 Years | 0 (0.0%) | 0 (0.0%) |
| 5 to 17 Years | 0 (0.0%) | 0 (0.0%) |
| 18 to 34 Years | 6 (0.7%) | 8 (1.4%) |
| 35 to 64 Years | 31 (2.7%) | 14 (1.1%) |
| 65 to 74 Years | 7 (2.0%) | 14 (3.8%) |
| 75 Years and over | 20 (31.2%) | 63 (32.5%) |
Disability Class: Vision Difficulty
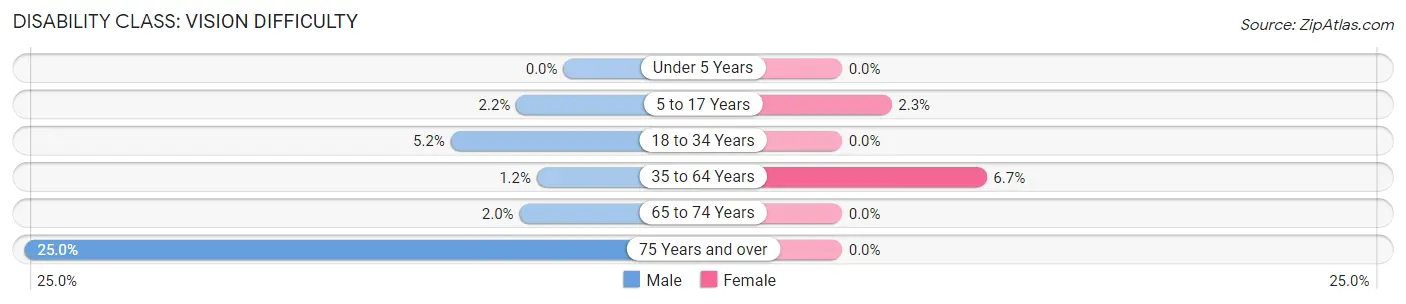
| Age Bracket | Male | Female |
| Under 5 Years | 0 (0.0%) | 0 (0.0%) |
| 5 to 17 Years | 11 (2.2%) | 14 (2.3%) |
| 18 to 34 Years | 43 (5.2%) | 0 (0.0%) |
| 35 to 64 Years | 14 (1.2%) | 85 (6.7%) |
| 65 to 74 Years | 7 (2.0%) | 0 (0.0%) |
| 75 Years and over | 16 (25.0%) | 0 (0.0%) |
Disability Class: Cognitive Difficulty
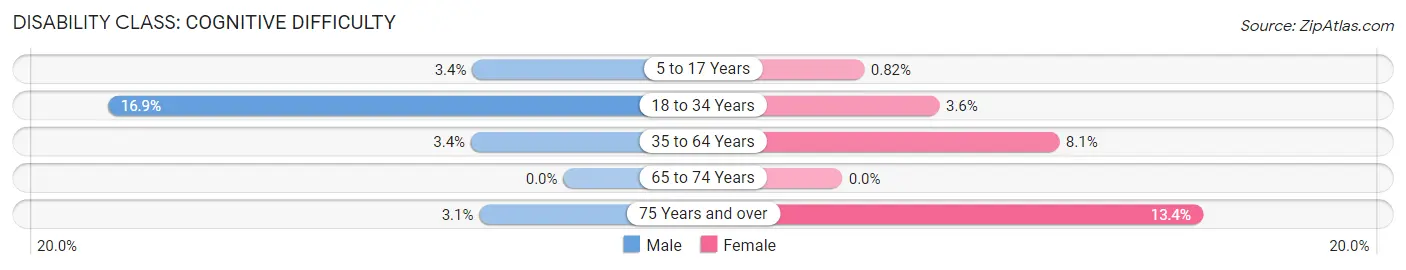
| Age Bracket | Male | Female |
| 5 to 17 Years | 17 (3.4%) | 5 (0.8%) |
| 18 to 34 Years | 139 (16.9%) | 20 (3.6%) |
| 35 to 64 Years | 39 (3.4%) | 102 (8.1%) |
| 65 to 74 Years | 0 (0.0%) | 0 (0.0%) |
| 75 Years and over | 2 (3.1%) | 26 (13.4%) |
Disability Class: Ambulatory Difficulty
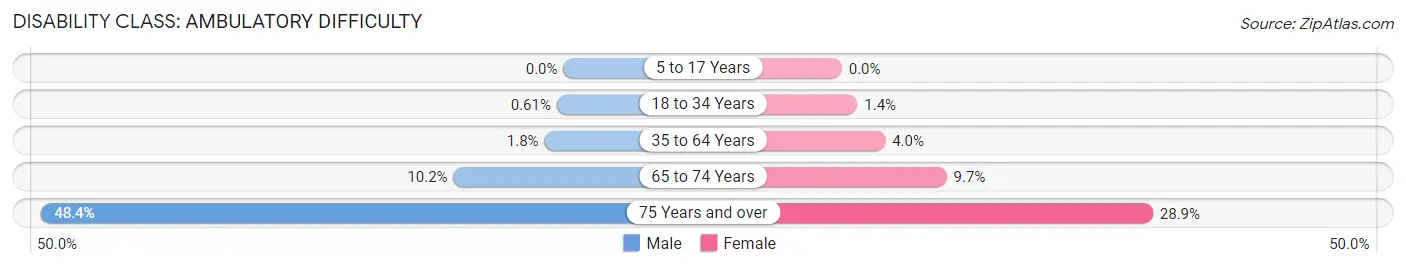
| Age Bracket | Male | Female |
| 5 to 17 Years | 0 (0.0%) | 0 (0.0%) |
| 18 to 34 Years | 5 (0.6%) | 8 (1.4%) |
| 35 to 64 Years | 20 (1.8%) | 51 (4.0%) |
| 65 to 74 Years | 35 (10.2%) | 36 (9.7%) |
| 75 Years and over | 31 (48.4%) | 56 (28.9%) |
Disability Class: Self-Care Difficulty
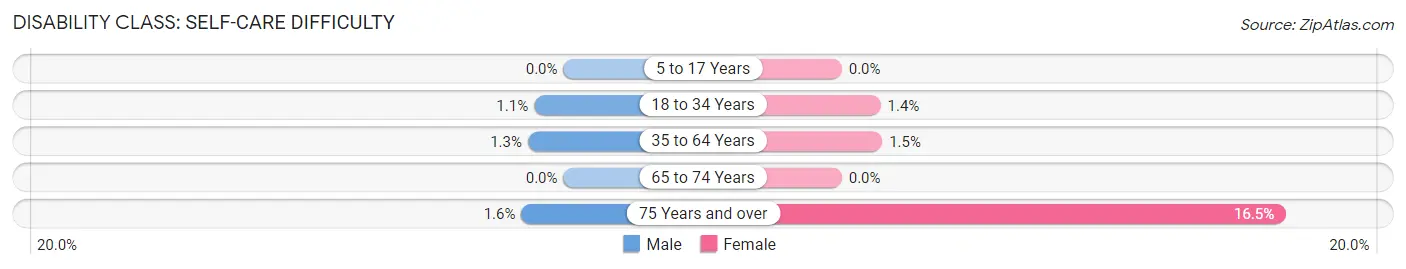
| Age Bracket | Male | Female |
| 5 to 17 Years | 0 (0.0%) | 0 (0.0%) |
| 18 to 34 Years | 9 (1.1%) | 8 (1.4%) |
| 35 to 64 Years | 15 (1.3%) | 19 (1.5%) |
| 65 to 74 Years | 0 (0.0%) | 0 (0.0%) |
| 75 Years and over | 1 (1.6%) | 32 (16.5%) |
Technology Access in Milan
Computing Device Access in Milan
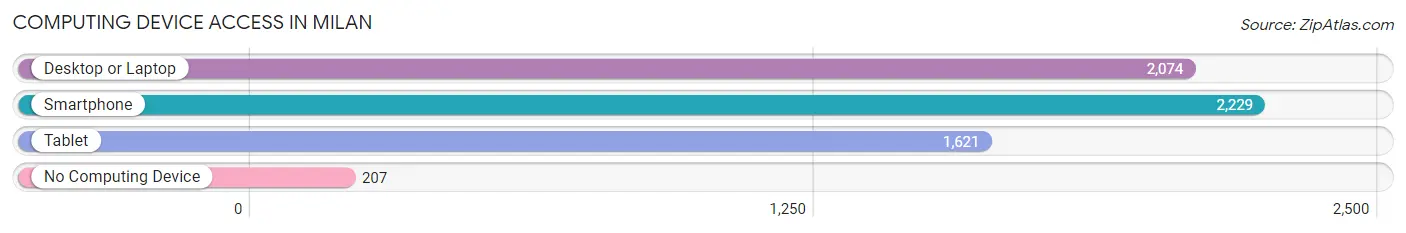
| Device Type | # Households | % Households |
| Desktop or Laptop | 2,074 | 82.2% |
| Smartphone | 2,229 | 88.4% |
| Tablet | 1,621 | 64.3% |
| No Computing Device | 207 | 8.2% |
| Total | 2,522 | 100.0% |
Internet Access in Milan
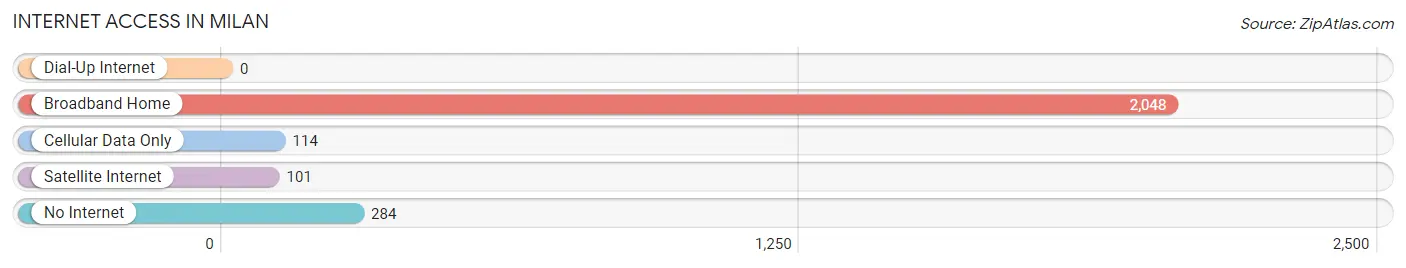
| Internet Type | # Households | % Households |
| Dial-Up Internet | 0 | 0.0% |
| Broadband Home | 2,048 | 81.2% |
| Cellular Data Only | 114 | 4.5% |
| Satellite Internet | 101 | 4.0% |
| No Internet | 284 | 11.3% |
| Total | 2,522 | 100.0% |
Milan Summary
Milan, Michigan is a small city located in Monroe County, Michigan, United States. It is situated on the Huron River, approximately 30 miles southwest of Detroit. The city has a population of around 8,000 people and is part of the larger metropolitan area of Ann Arbor-Ypsilanti-Saline.
History
The area that is now Milan was first settled in 1825 by a group of settlers from New York. The settlement was originally called "Hog Creek" and was located near the Huron River. In 1831, the settlement was renamed "Milan" after the Italian city of the same name. The city was officially incorporated in 1869.
In the late 19th century, Milan was a thriving agricultural community. The city was known for its production of wheat, corn, and other crops. In the early 20th century, the city began to diversify its economy and began to attract new industries. The city was home to several factories, including a paper mill, a furniture factory, and a canning factory.
Geography
Milan is located in southeastern Michigan, approximately 30 miles southwest of Detroit. The city is situated on the Huron River, which flows through the city and provides a source of recreation for the residents. The city is surrounded by several small towns and villages, including Saline, Ypsilanti, and Ann Arbor.
The city has a total area of 4.2 square miles, of which 4.1 square miles is land and 0.1 square miles is water. The city is located in a humid continental climate zone, with hot summers and cold winters.
Economy
Milan's economy is largely based on manufacturing and agriculture. The city is home to several factories, including a paper mill, a furniture factory, and a canning factory. The city is also home to several agricultural businesses, including a dairy farm, a vegetable farm, and a fruit farm.
The city is also home to several retail businesses, including a grocery store, a hardware store, and a clothing store. The city is also home to several restaurants, bars, and other entertainment venues.
Demographics
As of the 2010 census, the city had a population of 8,009. The racial makeup of the city was 87.3% White, 8.2% African American, 0.4% Native American, 0.7% Asian, 0.1% Pacific Islander, 1.2% from other races, and 2.1% from two or more races. Hispanic or Latino of any race were 3.2% of the population.
The median household income in the city was $45,945, and the median family income was $54,945. The per capita income for the city was $21,945. About 8.2% of families and 10.2% of the population were below the poverty line, including 14.2% of those under age 18 and 6.2% of those age 65 or over.
Common Questions
What is the Total Population of Milan?
Total Population of Milan is 6,153.
What is the Total Male Population of Milan?
Total Male Population of Milan is 2,969.
What is the Total Female Population of Milan?
Total Female Population of Milan is 3,184.
What is the Ratio of Males per 100 Females in Milan?
There are 93.25 Males per 100 Females in Milan.
What is the Ratio of Females per 100 Males in Milan?
There are 107.24 Females per 100 Males in Milan.
What is the Median Population Age in Milan?
Median Population Age in Milan is 39.1 Years.
What is the Average Family Size in Milan
Average Family Size in Milan is 3.2 People.
What is the Average Household Size in Milan
Average Household Size in Milan is 2.4 People.
What is Per Capita Income in Milan?
Per Capita income in Milan is $38,735.
What is the Median Family Income in Milan?
Median Family Income in Milan is $94,952.
What is the Median Household income in Milan?
Median Household Income in Milan is $89,600.
What is Income or Wage Gap in Milan?
Income or Wage Gap in Milan is 52.2%.
Women in Milan earn 47.8 cents for every dollar earned by a man.
What is Inequality or Gini Index in Milan?
Inequality or Gini Index in Milan is 0.36.
How Large is the Labor Force in Milan?
There are 3,587 People in the Labor Forcein in Milan.
What is the Percentage of People in the Labor Force in Milan?
72.5% of People are in the Labor Force in Milan.
What is the Unemployment Rate in Milan?
Unemployment Rate in Milan is 6.5%.