L Anse, MI
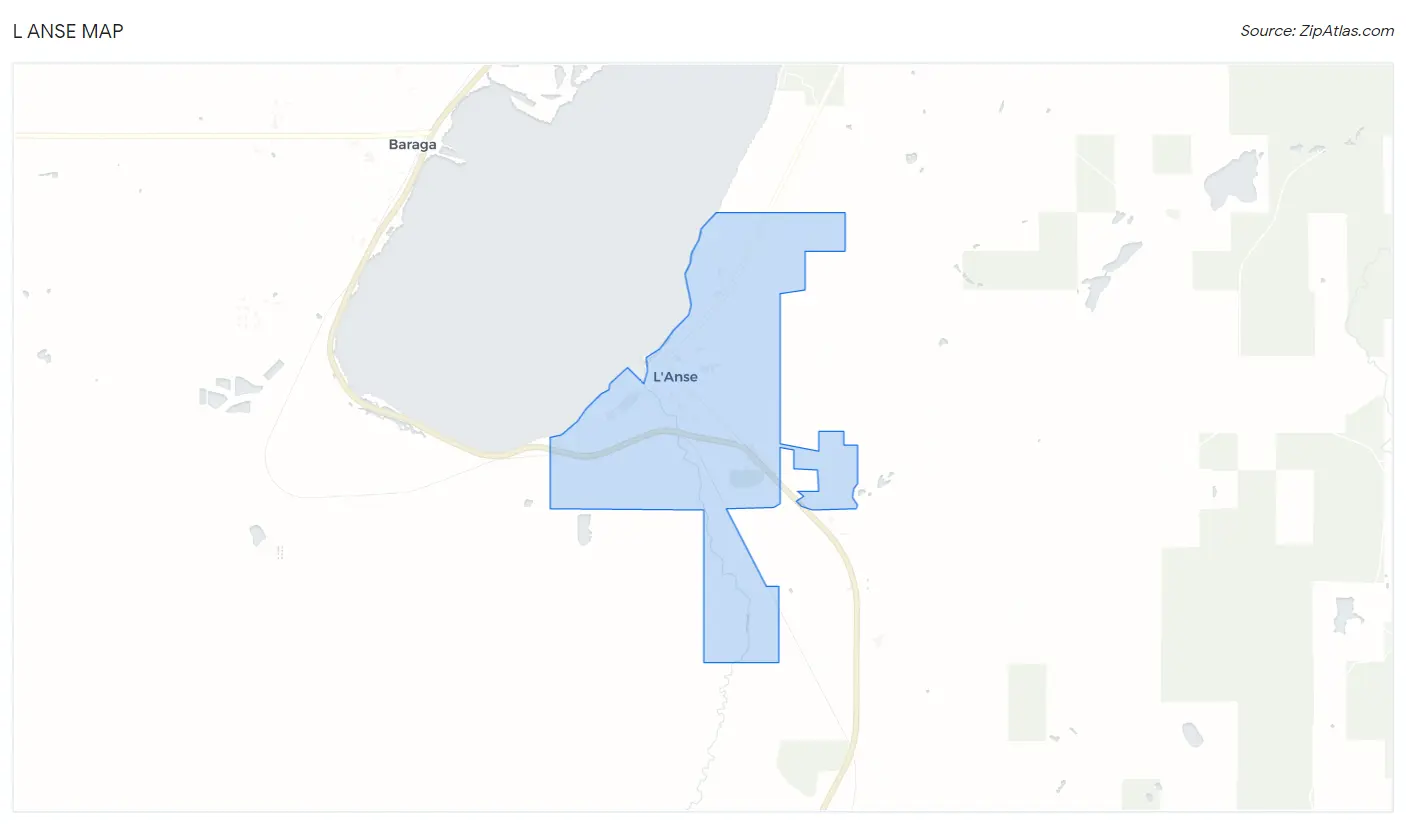
L Anse Map
L Anse Overview
1,942
TOTAL POPULATION
1,038
MALE POPULATION
904
FEMALE POPULATION
114.82
MALES / 100 FEMALES
87.09
FEMALES / 100 MALES
49.5
MEDIAN AGE
3.0
AVG FAMILY SIZE
2.0
AVG HOUSEHOLD SIZE
$33,789
PER CAPITA INCOME
$66,406
AVG FAMILY INCOME
$52,869
AVG HOUSEHOLD INCOME
46.5%
WAGE / INCOME GAP [ % ]
53.5¢/ $1
WAGE / INCOME GAP [ $ ]
0.46
INEQUALITY / GINI INDEX
842
LABOR FORCE [ PEOPLE ]
51.4%
PERCENT IN LABOR FORCE
6.9%
UNEMPLOYMENT RATE
Race in L Anse
The most populous races in L Anse are White / Caucasian (1,625 | 83.7%), Two or more Races (166 | 8.6%), and Native / Alaskan (109 | 5.6%).
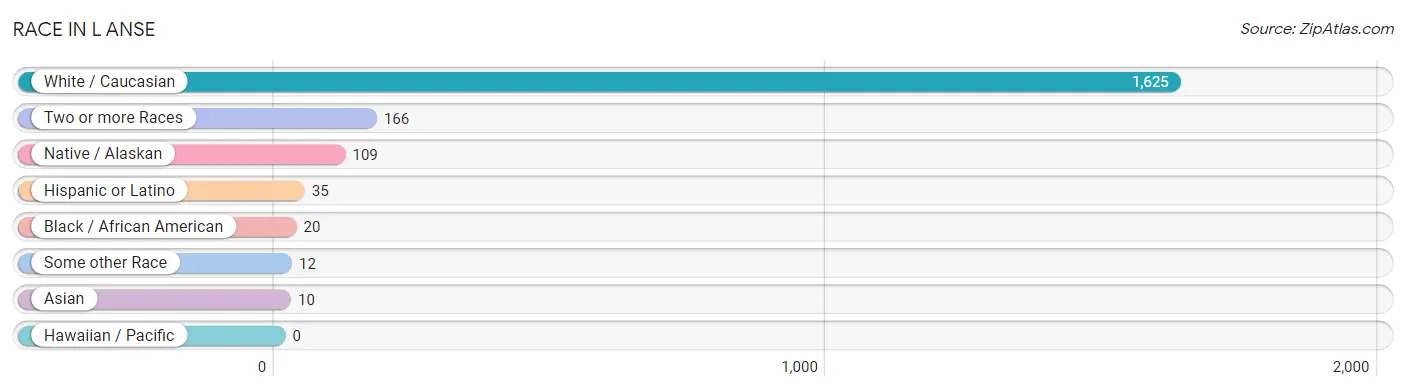
| Race | # Population | % Population |
| Asian | 10 | 0.5% |
| Black / African American | 20 | 1.0% |
| Hawaiian / Pacific | 0 | 0.0% |
| Hispanic or Latino | 35 | 1.8% |
| Native / Alaskan | 109 | 5.6% |
| White / Caucasian | 1,625 | 83.7% |
| Two or more Races | 166 | 8.6% |
| Some other Race | 12 | 0.6% |
| Total | 1,942 | 100.0% |
Ancestry in L Anse
The most populous ancestries reported in L Anse are German (425 | 21.9%), Finnish (396 | 20.4%), Irish (289 | 14.9%), French (207 | 10.7%), and English (206 | 10.6%), together accounting for 78.4% of all L Anse residents.
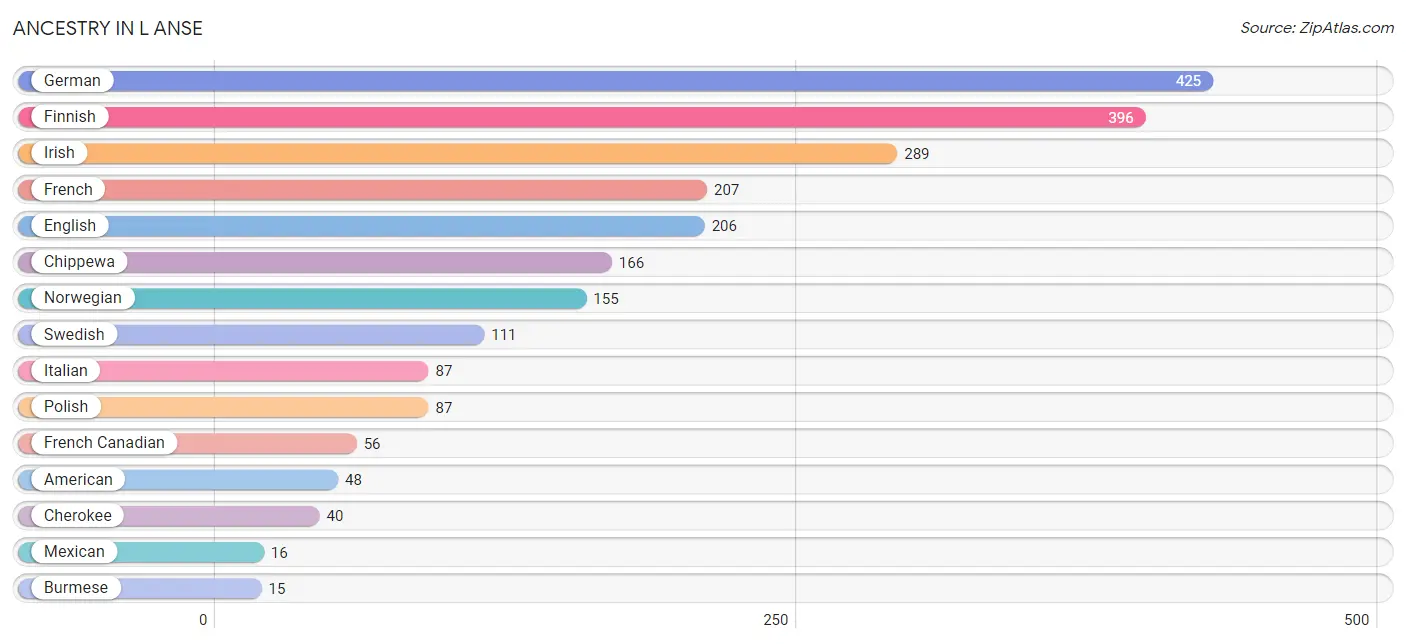
| Ancestry | # Population | % Population |
| American | 48 | 2.5% |
| Austrian | 14 | 0.7% |
| Burmese | 15 | 0.8% |
| Cherokee | 40 | 2.1% |
| Chippewa | 166 | 8.6% |
| Croatian | 4 | 0.2% |
| Czechoslovakian | 9 | 0.5% |
| Dutch | 8 | 0.4% |
| English | 206 | 10.6% |
| European | 9 | 0.5% |
| Finnish | 396 | 20.4% |
| French | 207 | 10.7% |
| French Canadian | 56 | 2.9% |
| German | 425 | 21.9% |
| Greek | 4 | 0.2% |
| Indian (Asian) | 10 | 0.5% |
| Irish | 289 | 14.9% |
| Italian | 87 | 4.5% |
| Mexican | 16 | 0.8% |
| Navajo | 13 | 0.7% |
| Northern European | 5 | 0.3% |
| Norwegian | 155 | 8.0% |
| Polish | 87 | 4.5% |
| Puerto Rican | 2 | 0.1% |
| Scottish | 4 | 0.2% |
| Swedish | 111 | 5.7% |
| Swiss | 3 | 0.2% |
| Yuman | 4 | 0.2% | View All 28 Rows |
Immigrants in L Anse
The most numerous immigrant groups reported in L Anse came from Europe (12 | 0.6%), Germany (12 | 0.6%), and Western Europe (12 | 0.6%), together accounting for 1.9% of all L Anse residents.
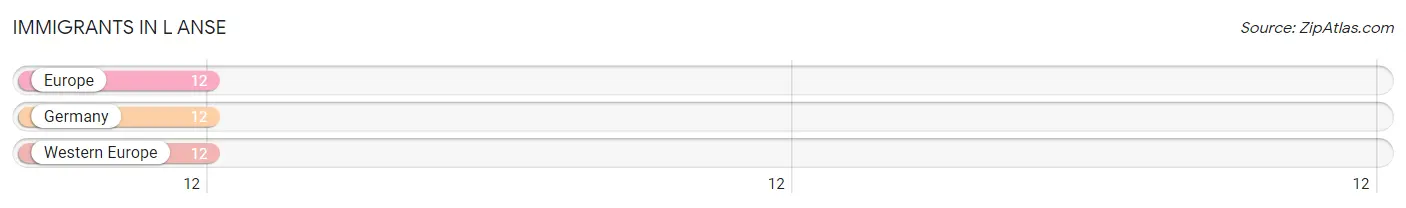
| Immigration Origin | # Population | % Population |
| Europe | 12 | 0.6% |
| Germany | 12 | 0.6% |
| Western Europe | 12 | 0.6% | View All 3 Rows |
Sex and Age in L Anse
Sex and Age in L Anse
The most populous age groups in L Anse are 20 to 24 Years (118 | 11.4%) for men and 65 to 69 Years (85 | 9.4%) for women.
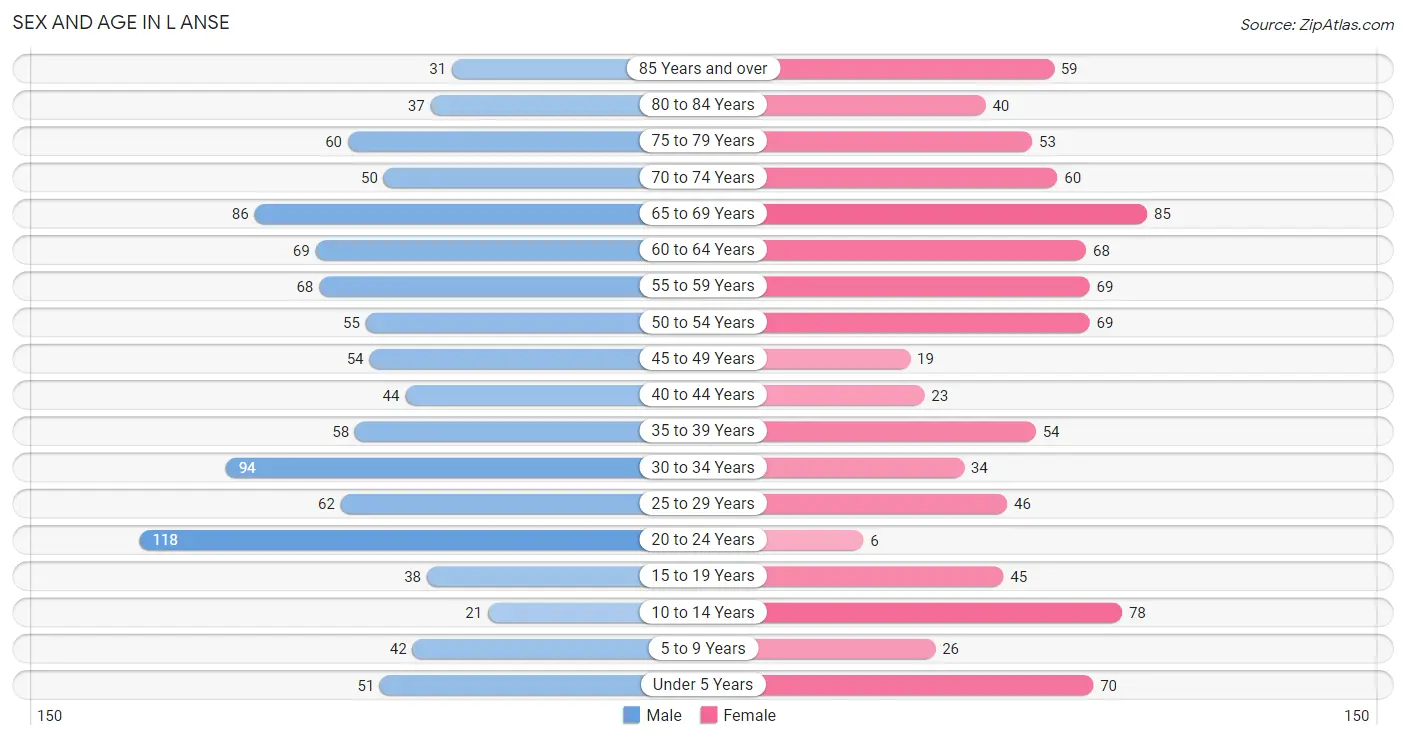
| Age Bracket | Male | Female |
| Under 5 Years | 51 (4.9%) | 70 (7.7%) |
| 5 to 9 Years | 42 (4.1%) | 26 (2.9%) |
| 10 to 14 Years | 21 (2.0%) | 78 (8.6%) |
| 15 to 19 Years | 38 (3.7%) | 45 (5.0%) |
| 20 to 24 Years | 118 (11.4%) | 6 (0.7%) |
| 25 to 29 Years | 62 (6.0%) | 46 (5.1%) |
| 30 to 34 Years | 94 (9.1%) | 34 (3.8%) |
| 35 to 39 Years | 58 (5.6%) | 54 (6.0%) |
| 40 to 44 Years | 44 (4.2%) | 23 (2.5%) |
| 45 to 49 Years | 54 (5.2%) | 19 (2.1%) |
| 50 to 54 Years | 55 (5.3%) | 69 (7.6%) |
| 55 to 59 Years | 68 (6.6%) | 69 (7.6%) |
| 60 to 64 Years | 69 (6.7%) | 68 (7.5%) |
| 65 to 69 Years | 86 (8.3%) | 85 (9.4%) |
| 70 to 74 Years | 50 (4.8%) | 60 (6.6%) |
| 75 to 79 Years | 60 (5.8%) | 53 (5.9%) |
| 80 to 84 Years | 37 (3.6%) | 40 (4.4%) |
| 85 Years and over | 31 (3.0%) | 59 (6.5%) |
| Total | 1,038 (100.0%) | 904 (100.0%) |
Families and Households in L Anse
Median Family Size in L Anse
The median family size in L Anse is 2.96 persons per family, with single male/father families (36 | 8.3%) accounting for the largest median family size of 3.56 persons per family. On the other hand, single female/mother families (78 | 18.0%) represent the smallest median family size with 2.51 persons per family.
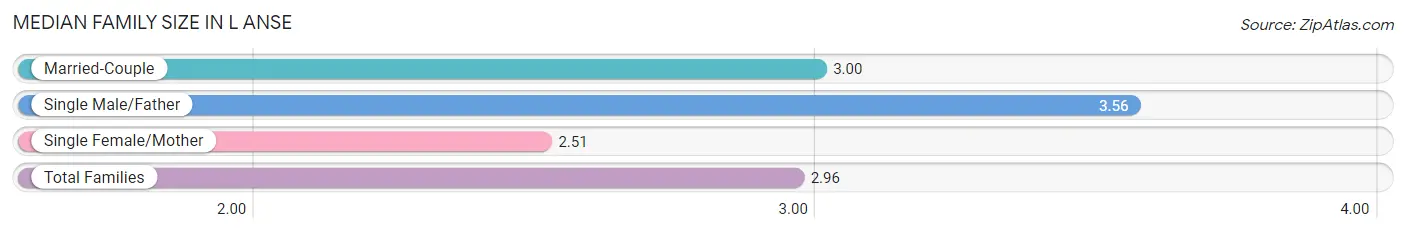
| Family Type | # Families | Family Size |
| Married-Couple | 319 (73.7%) | 3.00 |
| Single Male/Father | 36 (8.3%) | 3.56 |
| Single Female/Mother | 78 (18.0%) | 2.51 |
| Total Families | 433 (100.0%) | 2.96 |
Median Household Size in L Anse
The median household size in L Anse is 2.05 persons per household, with single male/father households (36 | 4.1%) accounting for the largest median household size of 4.06 persons per household. non-family households (449 | 50.9%) represent the smallest median household size with 1.06 persons per household.
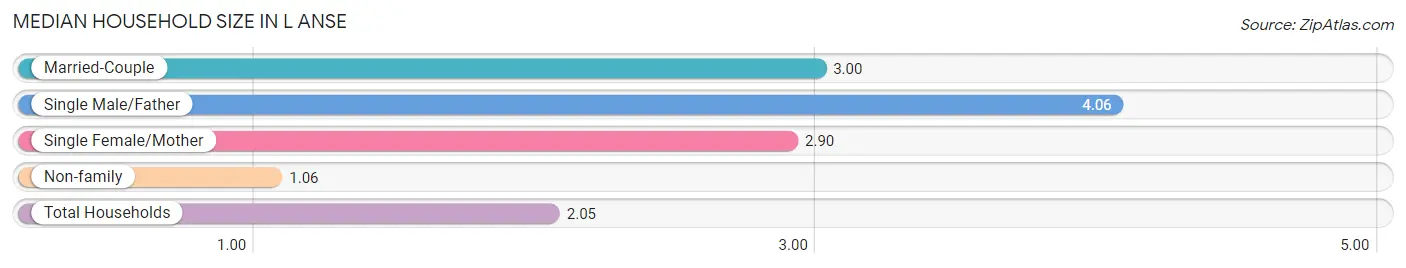
| Household Type | # Households | Household Size |
| Married-Couple | 319 (36.2%) | 3.00 |
| Single Male/Father | 36 (4.1%) | 4.06 |
| Single Female/Mother | 78 (8.8%) | 2.90 |
| Non-family | 449 (50.9%) | 1.06 |
| Total Households | 882 (100.0%) | 2.05 |
Household Size by Marriage Status in L Anse
Out of a total of 882 households in L Anse, 433 (49.1%) are family households, while 449 (50.9%) are nonfamily households. The most numerous type of family households are 2-person households, comprising 239, and the most common type of nonfamily households are 1-person households, comprising 422.
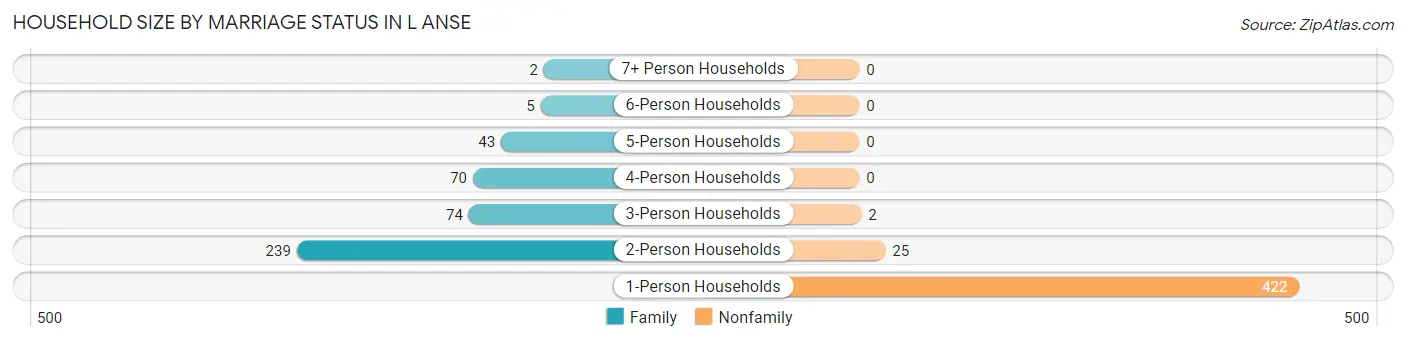
| Household Size | Family Households | Nonfamily Households |
| 1-Person Households | - | 422 (47.8%) |
| 2-Person Households | 239 (27.1%) | 25 (2.8%) |
| 3-Person Households | 74 (8.4%) | 2 (0.2%) |
| 4-Person Households | 70 (7.9%) | 0 (0.0%) |
| 5-Person Households | 43 (4.9%) | 0 (0.0%) |
| 6-Person Households | 5 (0.6%) | 0 (0.0%) |
| 7+ Person Households | 2 (0.2%) | 0 (0.0%) |
| Total | 433 (49.1%) | 449 (50.9%) |
Female Fertility in L Anse
Fertility by Age in L Anse
Average fertility rate in L Anse is 87.0 births per 1,000 women. Women in the age bracket of 35 to 50 years have the highest fertility rate with 149.0 births per 1,000 women. Women in the age bracket of 35 to 50 years acount for 81.8% of all women with births.
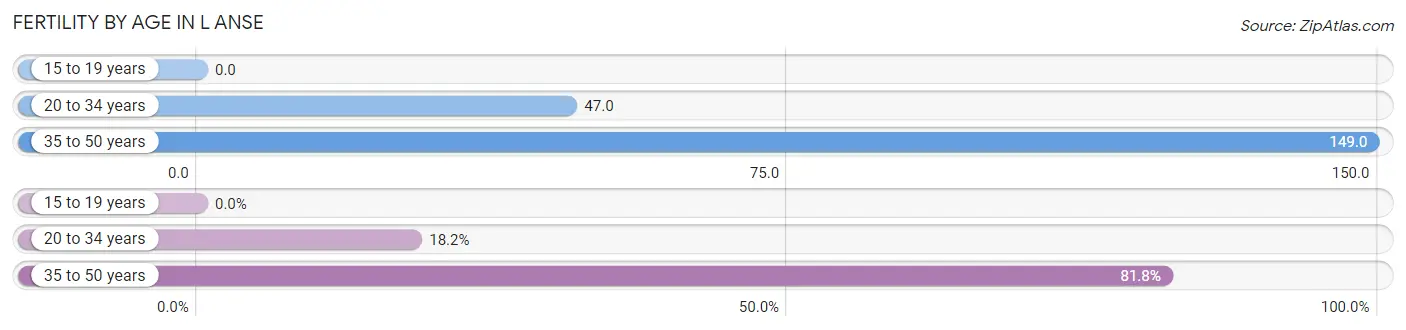
| Age Bracket | Women with Births | Births / 1,000 Women |
| 15 to 19 years | 0 (0.0%) | 0.0 |
| 20 to 34 years | 4 (18.2%) | 47.0 |
| 35 to 50 years | 18 (81.8%) | 149.0 |
| Total | 22 (100.0%) | 87.0 |
Fertility by Age by Marriage Status in L Anse
18.2% of women with births (22) in L Anse are married. The highest percentage of unmarried women with births falls into 35 to 50 years age bracket with 100.0% of them unmarried at the time of birth, while the lowest percentage of unmarried women with births belong to 20 to 34 years age bracket with 0.0% of them unmarried.
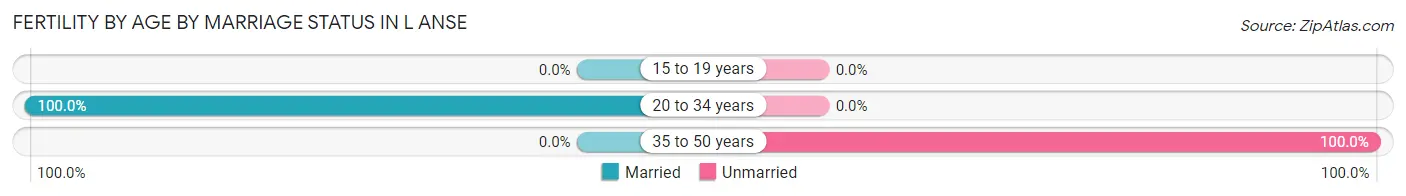
| Age Bracket | Married | Unmarried |
| 15 to 19 years | 0 (0.0%) | 0 (0.0%) |
| 20 to 34 years | 4 (100.0%) | 0 (0.0%) |
| 35 to 50 years | 0 (0.0%) | 18 (100.0%) |
| Total | 4 (18.2%) | 18 (81.8%) |
Fertility by Education in L Anse
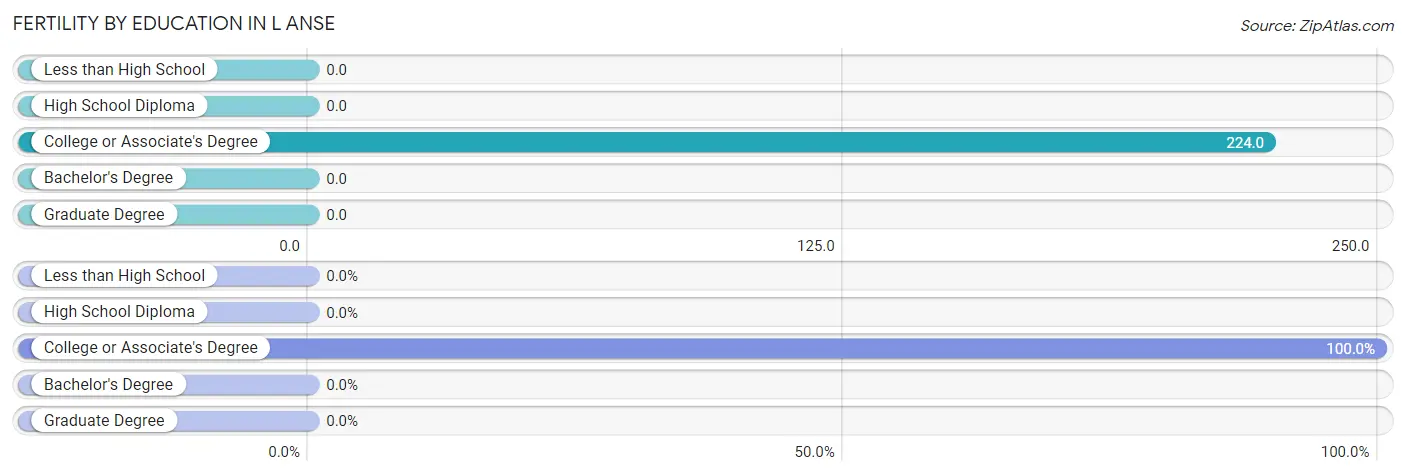
| Educational Attainment | Women with Births | Births / 1,000 Women |
| Less than High School | 0 (0.0%) | 0.0 |
| High School Diploma | 0 (0.0%) | 0.0 |
| College or Associate's Degree | 22 (100.0%) | 224.0 |
| Bachelor's Degree | 0 (0.0%) | 0.0 |
| Graduate Degree | 0 (0.0%) | 0.0 |
| Total | 22 (100.0%) | 87.0 |
Fertility by Education by Marriage Status in L Anse
81.8% of women with births in L Anse are unmarried. Women with the educational attainment of college or associate's degree are most likely to be married with 18.2% of them married at childbirth, while women with the educational attainment of college or associate's degree are least likely to be married with 81.8% of them unmarried at childbirth.
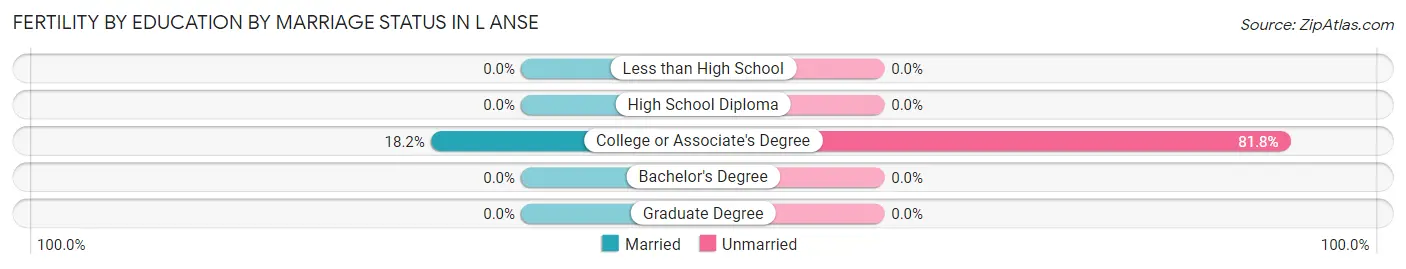
| Educational Attainment | Married | Unmarried |
| Less than High School | 0 (0.0%) | 0 (0.0%) |
| High School Diploma | 0 (0.0%) | 0 (0.0%) |
| College or Associate's Degree | 4 (18.2%) | 18 (81.8%) |
| Bachelor's Degree | 0 (0.0%) | 0 (0.0%) |
| Graduate Degree | 0 (0.0%) | 0 (0.0%) |
| Total | 4 (18.2%) | 18 (81.8%) |
Income in L Anse
Income Overview in L Anse
Per Capita Income in L Anse is $33,789, while median incomes of families and households are $66,406 and $52,869 respectively.
| Characteristic | Number | Measure |
| Per Capita Income | 1,942 | $33,789 |
| Median Family Income | 433 | $66,406 |
| Mean Family Income | 433 | $83,511 |
| Median Household Income | 882 | $52,869 |
| Mean Household Income | 882 | $69,619 |
| Income Deficit | 433 | $0 |
| Wage / Income Gap (%) | 1,942 | 46.54% |
| Wage / Income Gap ($) | 1,942 | 53.46¢ per $1 |
| Gini / Inequality Index | 1,942 | 0.46 |
Earnings by Sex in L Anse
Average Earnings in L Anse are $44,013, $54,583 for men and $29,181 for women, a difference of 46.5%.
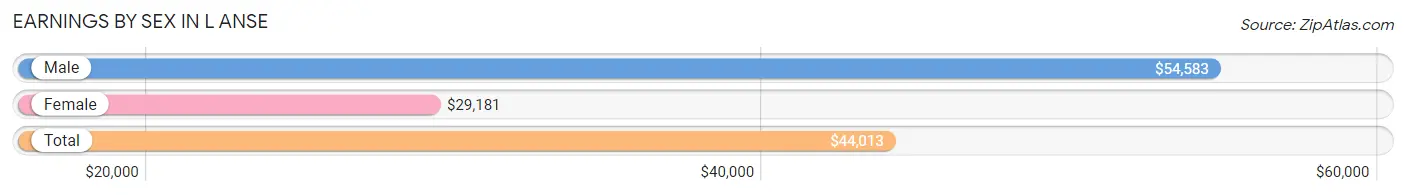
| Sex | Number | Average Earnings |
| Male | 538 (62.2%) | $54,583 |
| Female | 327 (37.8%) | $29,181 |
| Total | 865 (100.0%) | $44,013 |
Earnings by Sex by Income Bracket in L Anse
The most common earnings brackets in L Anse are $55,000 to $64,999 for men (145 | 27.0%) and $25,000 to $29,999 for women (46 | 14.1%).
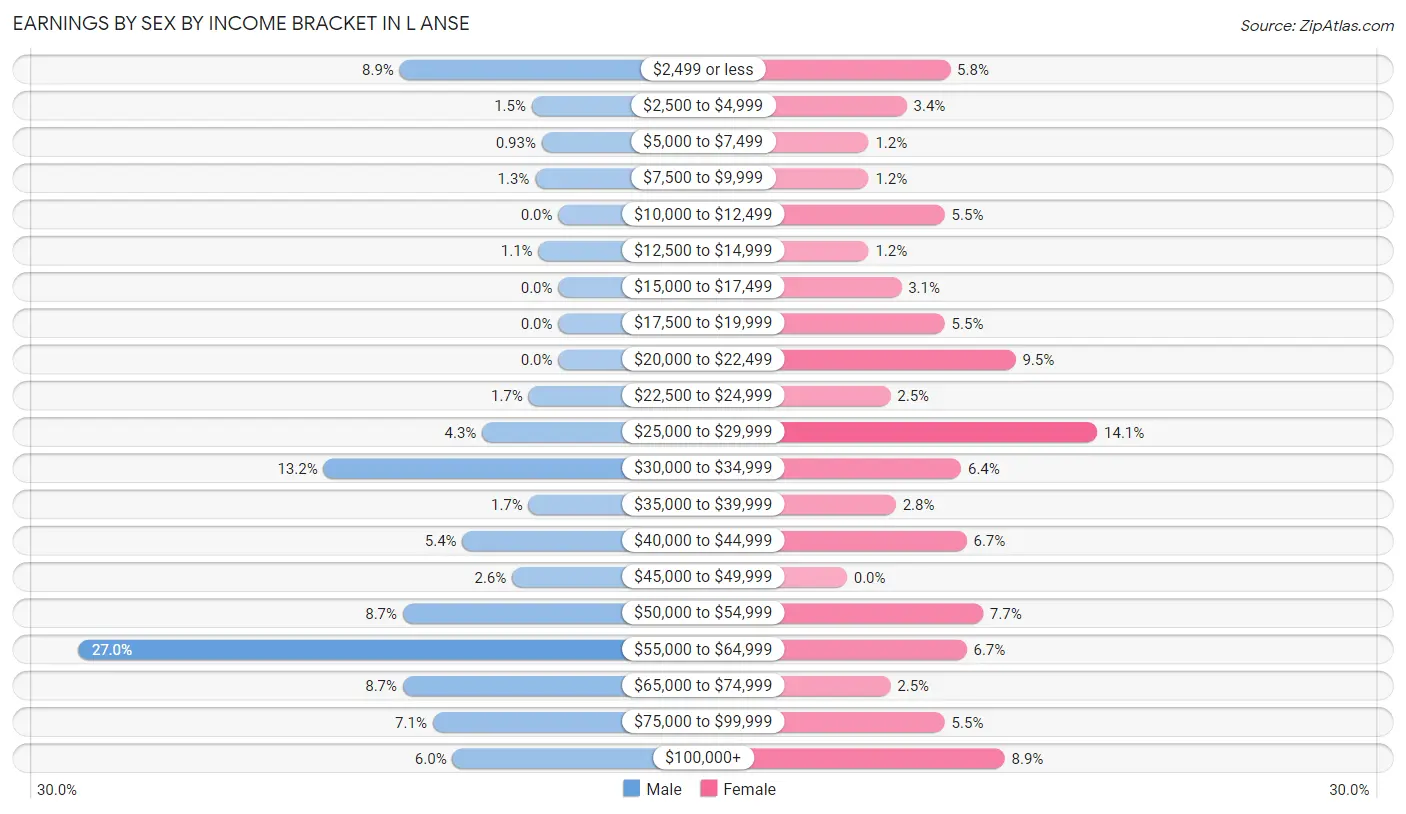
| Income | Male | Female |
| $2,499 or less | 48 (8.9%) | 19 (5.8%) |
| $2,500 to $4,999 | 8 (1.5%) | 11 (3.4%) |
| $5,000 to $7,499 | 5 (0.9%) | 4 (1.2%) |
| $7,500 to $9,999 | 7 (1.3%) | 4 (1.2%) |
| $10,000 to $12,499 | 0 (0.0%) | 18 (5.5%) |
| $12,500 to $14,999 | 6 (1.1%) | 4 (1.2%) |
| $15,000 to $17,499 | 0 (0.0%) | 10 (3.1%) |
| $17,500 to $19,999 | 0 (0.0%) | 18 (5.5%) |
| $20,000 to $22,499 | 0 (0.0%) | 31 (9.5%) |
| $22,500 to $24,999 | 9 (1.7%) | 8 (2.5%) |
| $25,000 to $29,999 | 23 (4.3%) | 46 (14.1%) |
| $30,000 to $34,999 | 71 (13.2%) | 21 (6.4%) |
| $35,000 to $39,999 | 9 (1.7%) | 9 (2.8%) |
| $40,000 to $44,999 | 29 (5.4%) | 22 (6.7%) |
| $45,000 to $49,999 | 14 (2.6%) | 0 (0.0%) |
| $50,000 to $54,999 | 47 (8.7%) | 25 (7.6%) |
| $55,000 to $64,999 | 145 (27.0%) | 22 (6.7%) |
| $65,000 to $74,999 | 47 (8.7%) | 8 (2.5%) |
| $75,000 to $99,999 | 38 (7.1%) | 18 (5.5%) |
| $100,000+ | 32 (5.9%) | 29 (8.9%) |
| Total | 538 (100.0%) | 327 (100.0%) |
Earnings by Sex by Educational Attainment in L Anse
Average earnings in L Anse are $59,054 for men and $30,074 for women, a difference of 49.1%. Men with an educational attainment of bachelor's degree enjoy the highest average annual earnings of $96,563, while those with high school diploma education earn the least with $50,000. Women with an educational attainment of graduate degree earn the most with the average annual earnings of $142,917, while those with college or associate's degree education have the smallest earnings of $23,750.
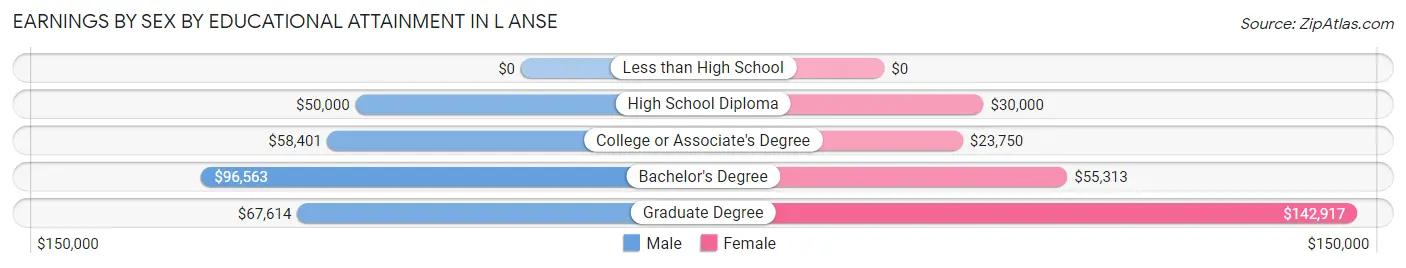
| Educational Attainment | Male Income | Female Income |
| Less than High School | - | - |
| High School Diploma | $50,000 | $30,000 |
| College or Associate's Degree | $58,401 | $23,750 |
| Bachelor's Degree | $96,563 | $55,313 |
| Graduate Degree | $67,614 | $142,917 |
| Total | $59,054 | $30,074 |
Family Income in L Anse
Family Income Brackets in L Anse
According to the L Anse family income data, there are 81 families falling into the $75,000 to $99,999 income range, which is the most common income bracket and makes up 18.7% of all families.
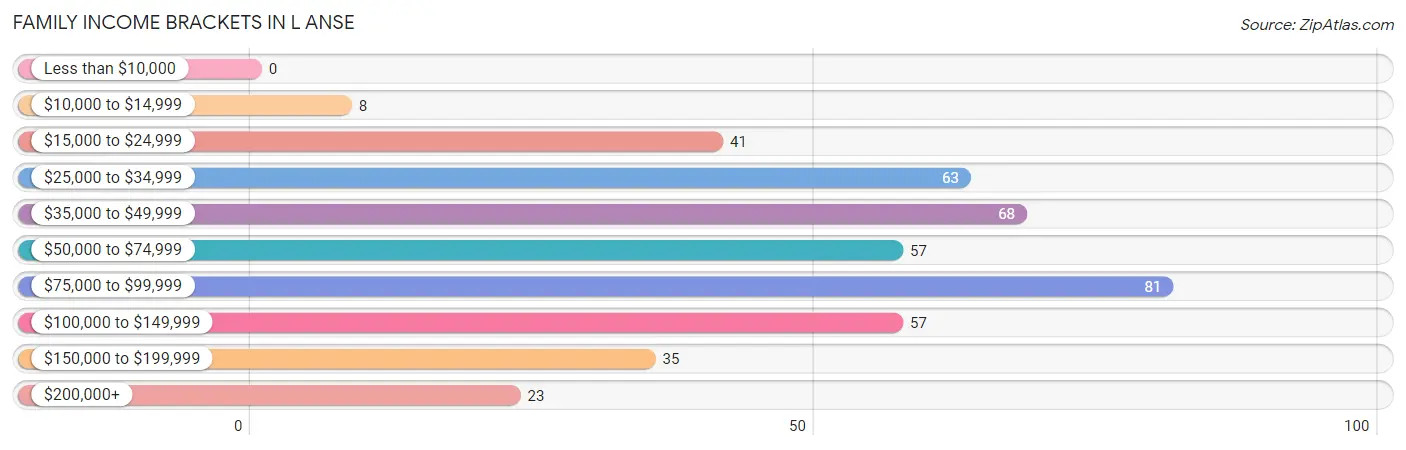
| Income Bracket | # Families | % Families |
| Less than $10,000 | 0 | 0.0% |
| $10,000 to $14,999 | 8 | 1.8% |
| $15,000 to $24,999 | 41 | 9.5% |
| $25,000 to $34,999 | 63 | 14.5% |
| $35,000 to $49,999 | 68 | 15.7% |
| $50,000 to $74,999 | 57 | 13.2% |
| $75,000 to $99,999 | 81 | 18.7% |
| $100,000 to $149,999 | 57 | 13.2% |
| $150,000 to $199,999 | 35 | 8.1% |
| $200,000+ | 23 | 5.3% |
Family Income by Famaliy Size in L Anse
5-person families (25 | 5.8%) account for the highest median family income in L Anse with $93,750 per family, while 3-person families (50 | 11.6%) have the highest median income of $28,241 per family member.
| Income Bracket | # Families | Median Income |
| 2-Person Families | 266 (61.4%) | $50,500 |
| 3-Person Families | 50 (11.6%) | $84,722 |
| 4-Person Families | 85 (19.6%) | $74,821 |
| 5-Person Families | 25 (5.8%) | $93,750 |
| 6-Person Families | 5 (1.1%) | $0 |
| 7+ Person Families | 2 (0.5%) | $0 |
| Total | 433 (100.0%) | $66,406 |
Family Income by Number of Earners in L Anse
| Number of Earners | # Families | Median Income |
| No Earners | 98 (22.6%) | $48,468 |
| 1 Earner | 158 (36.5%) | $44,583 |
| 2 Earners | 174 (40.2%) | $126,000 |
| 3+ Earners | 3 (0.7%) | $0 |
| Total | 433 (100.0%) | $66,406 |
Household Income in L Anse
Household Income Brackets in L Anse
With 188 households falling in the category, the $50,000 to $74,999 income range is the most frequent in L Anse, accounting for 21.3% of all households. In contrast, only 30 households (3.4%) fall into the $200,000+ income bracket, making it the least populous group.
| Income Bracket | # Households | % Households |
| Less than $10,000 | 35 | 4.0% |
| $10,000 to $14,999 | 38 | 4.3% |
| $15,000 to $24,999 | 146 | 16.6% |
| $25,000 to $34,999 | 84 | 9.5% |
| $35,000 to $49,999 | 114 | 12.9% |
| $50,000 to $74,999 | 188 | 21.3% |
| $75,000 to $99,999 | 143 | 16.2% |
| $100,000 to $149,999 | 59 | 6.7% |
| $150,000 to $199,999 | 45 | 5.1% |
| $200,000+ | 30 | 3.4% |
Household Income by Householder Age in L Anse
The median household income in L Anse is $52,869, with the highest median household income of $70,208 found in the 45 to 64 years age bracket for the primary householder. A total of 283 households (32.1%) fall into this category. Meanwhile, the 15 to 24 years age bracket for the primary householder has the lowest median household income of $0, with 37 households (4.2%) in this group.
| Income Bracket | # Households | Median Income |
| 15 to 24 Years | 37 (4.2%) | $0 |
| 25 to 44 Years | 223 (25.3%) | $59,550 |
| 45 to 64 Years | 283 (32.1%) | $70,208 |
| 65+ Years | 339 (38.4%) | $33,277 |
| Total | 882 (100.0%) | $52,869 |
Poverty in L Anse
Income Below Poverty by Sex and Age in L Anse
With 8.1% poverty level for males and 11.3% for females among the residents of L Anse, under 5 year old males and 25 to 34 year old females are the most vulnerable to poverty, with 12 males (23.5%) and 28 females (35.0%) in their respective age groups living below the poverty level.
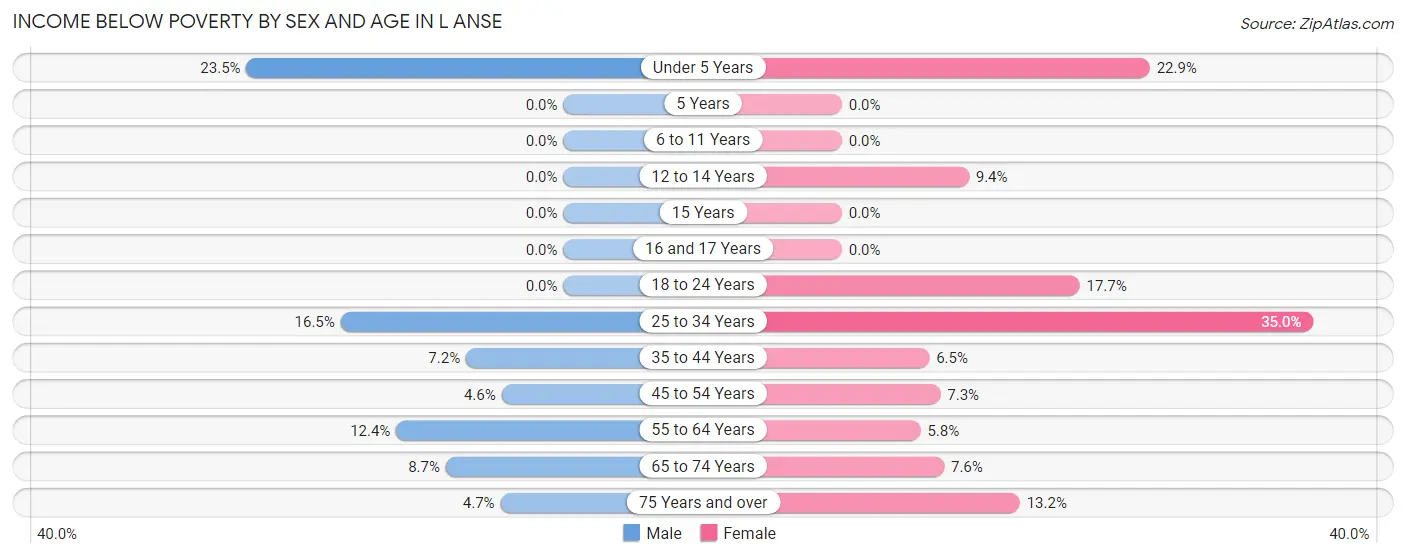
| Age Bracket | Male | Female |
| Under 5 Years | 12 (23.5%) | 16 (22.9%) |
| 5 Years | 0 (0.0%) | 0 (0.0%) |
| 6 to 11 Years | 0 (0.0%) | 0 (0.0%) |
| 12 to 14 Years | 0 (0.0%) | 5 (9.4%) |
| 15 Years | 0 (0.0%) | 0 (0.0%) |
| 16 and 17 Years | 0 (0.0%) | 0 (0.0%) |
| 18 to 24 Years | 0 (0.0%) | 3 (17.6%) |
| 25 to 34 Years | 22 (16.5%) | 28 (35.0%) |
| 35 to 44 Years | 6 (7.2%) | 5 (6.5%) |
| 45 to 54 Years | 5 (4.6%) | 6 (7.3%) |
| 55 to 64 Years | 17 (12.4%) | 8 (5.8%) |
| 65 to 74 Years | 11 (8.7%) | 11 (7.6%) |
| 75 Years and over | 5 (4.7%) | 14 (13.2%) |
| Total | 78 (8.1%) | 96 (11.3%) |
Income Above Poverty by Sex and Age in L Anse
According to the poverty statistics in L Anse, males aged 5 years and females aged 5 years are the age groups that are most secure financially, with 100.0% of males and 100.0% of females in these age groups living above the poverty line.
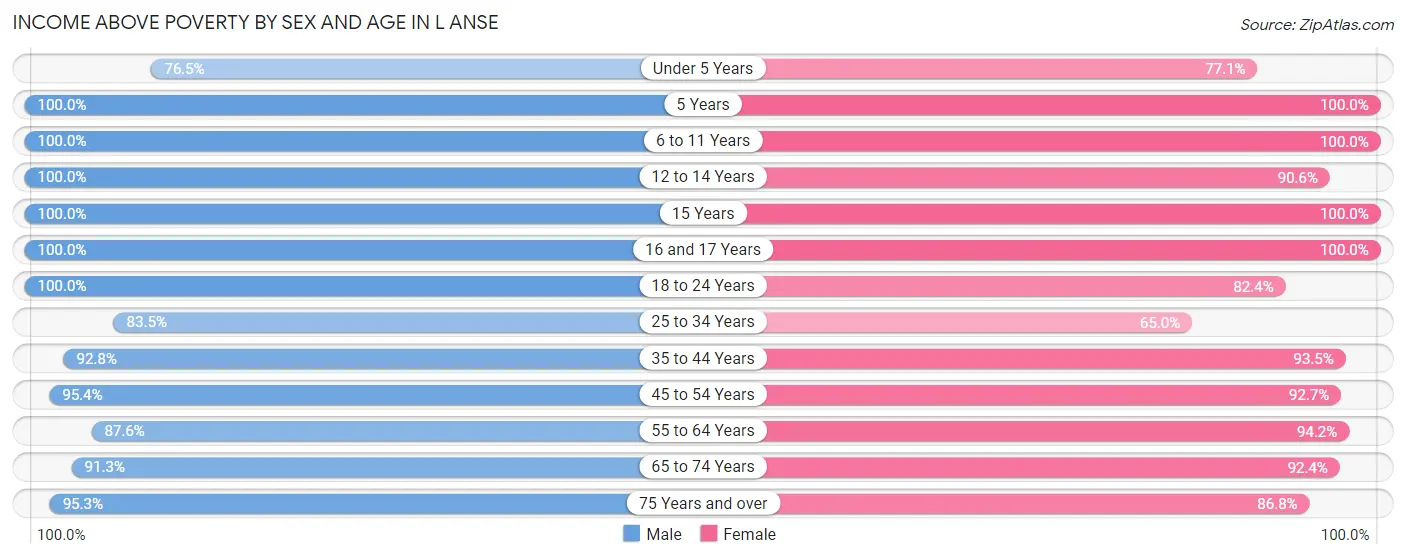
| Age Bracket | Male | Female |
| Under 5 Years | 39 (76.5%) | 54 (77.1%) |
| 5 Years | 11 (100.0%) | 8 (100.0%) |
| 6 to 11 Years | 41 (100.0%) | 43 (100.0%) |
| 12 to 14 Years | 11 (100.0%) | 48 (90.6%) |
| 15 Years | 13 (100.0%) | 3 (100.0%) |
| 16 and 17 Years | 14 (100.0%) | 31 (100.0%) |
| 18 to 24 Years | 129 (100.0%) | 14 (82.4%) |
| 25 to 34 Years | 111 (83.5%) | 52 (65.0%) |
| 35 to 44 Years | 77 (92.8%) | 72 (93.5%) |
| 45 to 54 Years | 104 (95.4%) | 76 (92.7%) |
| 55 to 64 Years | 120 (87.6%) | 129 (94.2%) |
| 65 to 74 Years | 115 (91.3%) | 134 (92.4%) |
| 75 Years and over | 102 (95.3%) | 92 (86.8%) |
| Total | 887 (91.9%) | 756 (88.7%) |
Income Below Poverty Among Married-Couple Families in L Anse
The poverty statistics for married-couple families in L Anse show that 5.3% or 17 of the total 319 families live below the poverty line. Families with 1 or 2 children have the highest poverty rate of 19.4%, comprising of 14 families. On the other hand, families with 3 or 4 children have the lowest poverty rate of 0.0%, which includes 0 families.
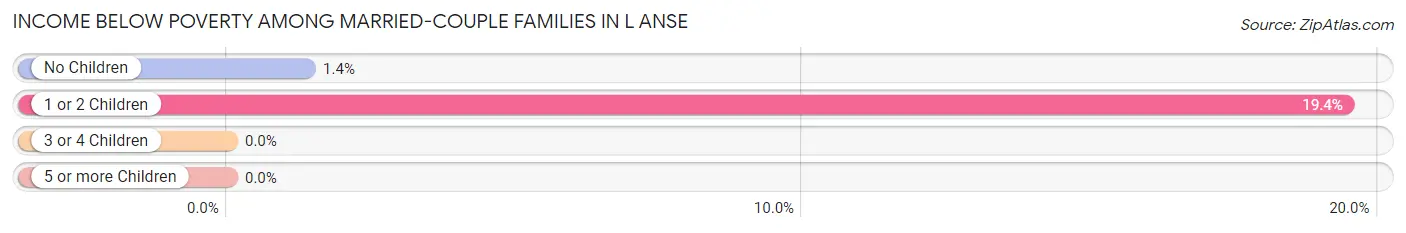
| Children | Above Poverty | Below Poverty |
| No Children | 217 (98.6%) | 3 (1.4%) |
| 1 or 2 Children | 58 (80.6%) | 14 (19.4%) |
| 3 or 4 Children | 25 (100.0%) | 0 (0.0%) |
| 5 or more Children | 2 (100.0%) | 0 (0.0%) |
| Total | 302 (94.7%) | 17 (5.3%) |
Income Below Poverty Among Single-Parent Households in L Anse
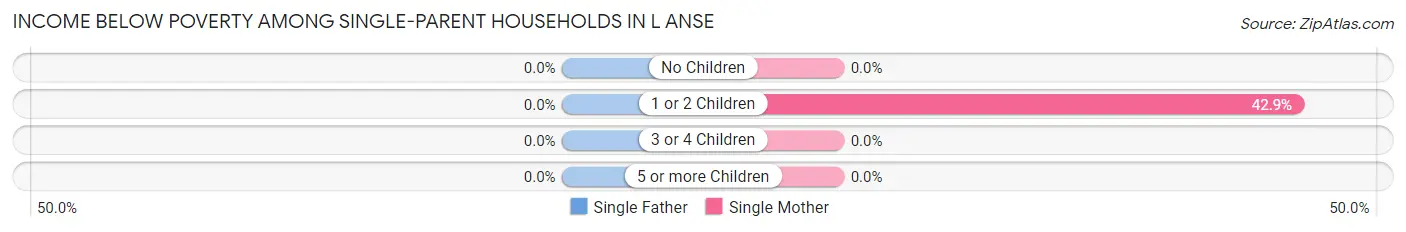
| Children | Single Father | Single Mother |
| No Children | 0 (0.0%) | 0 (0.0%) |
| 1 or 2 Children | 0 (0.0%) | 18 (42.9%) |
| 3 or 4 Children | 0 (0.0%) | 0 (0.0%) |
| 5 or more Children | 0 (0.0%) | 0 (0.0%) |
| Total | 0 (0.0%) | 18 (23.1%) |
Income Below Poverty Among Married-Couple vs Single-Parent Households in L Anse
The poverty data for L Anse shows that 17 of the married-couple family households (5.3%) and 18 of the single-parent households (15.8%) are living below the poverty level. Within the married-couple family households, those with 1 or 2 children have the highest poverty rate, with 14 households (19.4%) falling below the poverty line. Among the single-parent households, those with 1 or 2 children have the highest poverty rate, with 18 household (34.0%) living below poverty.
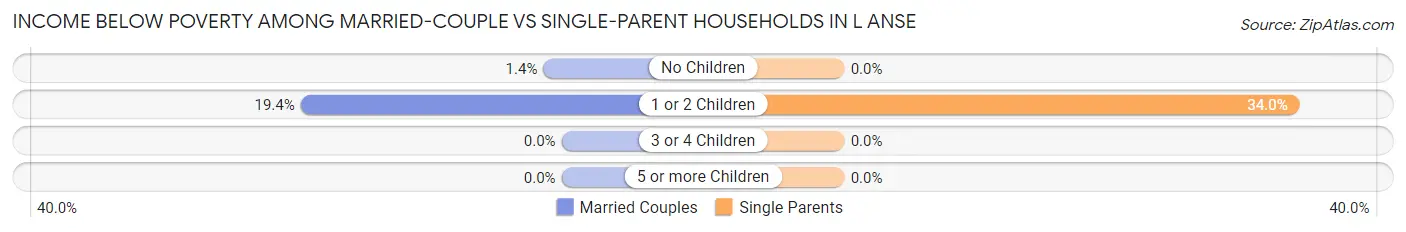
| Children | Married-Couple Families | Single-Parent Households |
| No Children | 3 (1.4%) | 0 (0.0%) |
| 1 or 2 Children | 14 (19.4%) | 18 (34.0%) |
| 3 or 4 Children | 0 (0.0%) | 0 (0.0%) |
| 5 or more Children | 0 (0.0%) | 0 (0.0%) |
| Total | 17 (5.3%) | 18 (15.8%) |
Employment Characteristics in L Anse
Employment by Class of Employer in L Anse
Among the 768 employed individuals in L Anse, private company employees (491 | 63.9%), local government employees (131 | 17.1%), and state government employees (60 | 7.8%) make up the most common classes of employment.
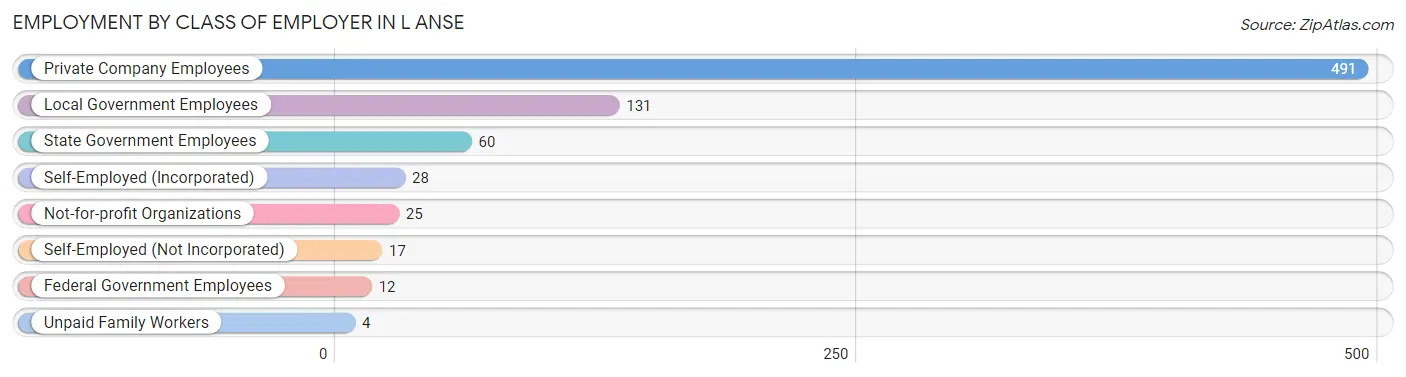
| Employer Class | # Employees | % Employees |
| Private Company Employees | 491 | 63.9% |
| Self-Employed (Incorporated) | 28 | 3.6% |
| Self-Employed (Not Incorporated) | 17 | 2.2% |
| Not-for-profit Organizations | 25 | 3.3% |
| Local Government Employees | 131 | 17.1% |
| State Government Employees | 60 | 7.8% |
| Federal Government Employees | 12 | 1.6% |
| Unpaid Family Workers | 4 | 0.5% |
| Total | 768 | 100.0% |
Employment Status by Age in L Anse
According to the labor force statistics for L Anse, out of the total population over 16 years of age (1,638), 51.4% or 842 individuals are in the labor force, with 6.9% or 58 of them unemployed. The age group with the highest labor force participation rate is 20 to 24 years, with 100.0% or 124 individuals in the labor force. Within the labor force, the 16 to 19 years age range has the highest percentage of unemployed individuals, with 38.9% or 7 of them being unemployed.
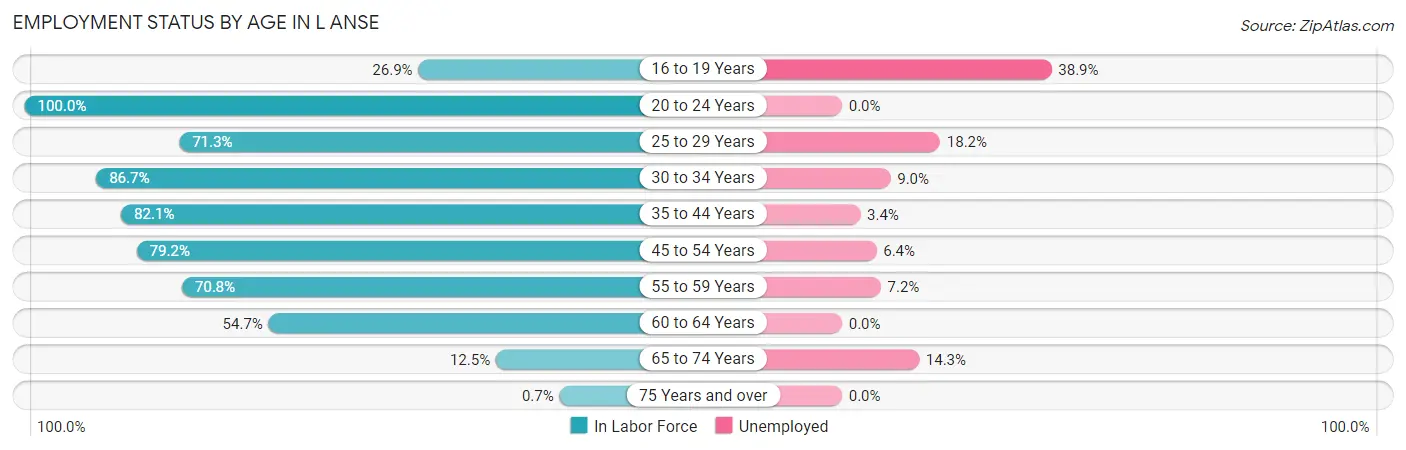
| Age Bracket | In Labor Force | Unemployed |
| 16 to 19 Years | 18 (26.9%) | 7 (38.9%) |
| 20 to 24 Years | 124 (100.0%) | 0 (0.0%) |
| 25 to 29 Years | 77 (71.3%) | 14 (18.2%) |
| 30 to 34 Years | 111 (86.7%) | 10 (9.0%) |
| 35 to 44 Years | 147 (82.1%) | 5 (3.4%) |
| 45 to 54 Years | 156 (79.2%) | 10 (6.4%) |
| 55 to 59 Years | 97 (70.8%) | 7 (7.2%) |
| 60 to 64 Years | 75 (54.7%) | 0 (0.0%) |
| 65 to 74 Years | 35 (12.5%) | 5 (14.3%) |
| 75 Years and over | 2 (0.7%) | 0 (0.0%) |
| Total | 842 (51.4%) | 58 (6.9%) |
Employment Status by Educational Attainment in L Anse
According to labor force statistics for L Anse, 74.8% of individuals (663) out of the total population between 25 and 64 years of age (886) are in the labor force, with 6.9% or 46 of them being unemployed. The group with the highest labor force participation rate are those with the educational attainment of bachelor's degree or higher, with 96.6% or 142 individuals in the labor force. Within the labor force, individuals with less than high school education have the highest percentage of unemployment, with 50.0% or 14 of them being unemployed.
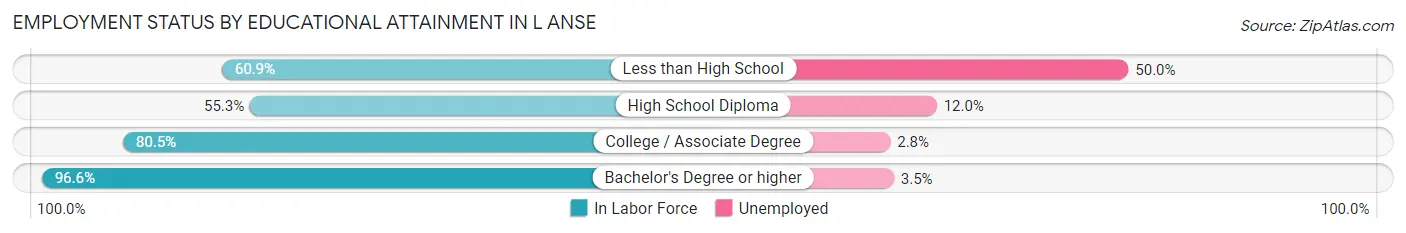
| Educational Attainment | In Labor Force | Unemployed |
| Less than High School | 28 (60.9%) | 23 (50.0%) |
| High School Diploma | 142 (55.3%) | 31 (12.0%) |
| College / Associate Degree | 351 (80.5%) | 12 (2.8%) |
| Bachelor's Degree or higher | 142 (96.6%) | 5 (3.5%) |
| Total | 663 (74.8%) | 61 (6.9%) |
Employment Occupations by Sex in L Anse
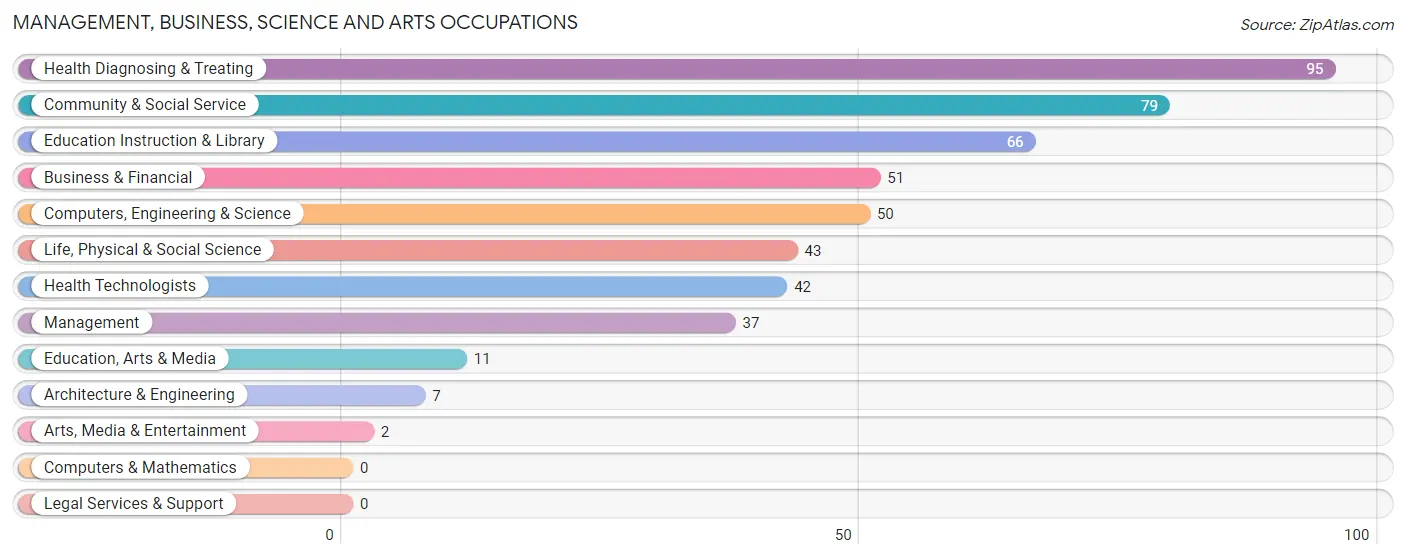
Management, Business, Science and Arts Occupations
The most common Management, Business, Science and Arts occupations in L Anse are Health Diagnosing & Treating (95 | 12.1%), Community & Social Service (79 | 10.1%), Education Instruction & Library (66 | 8.4%), Business & Financial (51 | 6.5%), and Computers, Engineering & Science (50 | 6.4%).
Management, Business, Science and Arts Occupations by Sex
Within the Management, Business, Science and Arts occupations in L Anse, the most male-oriented occupations are Computers, Engineering & Science (100.0%), Architecture & Engineering (100.0%), and Life, Physical & Social Science (100.0%), while the most female-oriented occupations are Education Instruction & Library (80.3%), Community & Social Service (74.7%), and Health Technologists (61.9%).
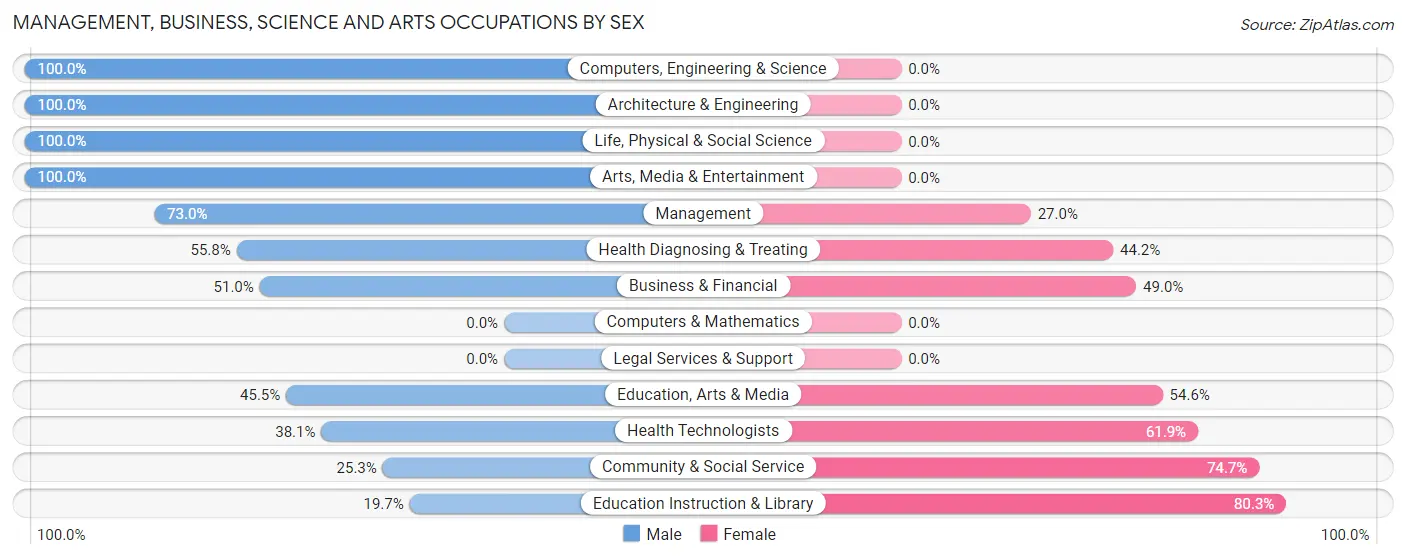
| Occupation | Male | Female |
| Management | 27 (73.0%) | 10 (27.0%) |
| Business & Financial | 26 (51.0%) | 25 (49.0%) |
| Computers, Engineering & Science | 50 (100.0%) | 0 (0.0%) |
| Computers & Mathematics | 0 (0.0%) | 0 (0.0%) |
| Architecture & Engineering | 7 (100.0%) | 0 (0.0%) |
| Life, Physical & Social Science | 43 (100.0%) | 0 (0.0%) |
| Community & Social Service | 20 (25.3%) | 59 (74.7%) |
| Education, Arts & Media | 5 (45.5%) | 6 (54.5%) |
| Legal Services & Support | 0 (0.0%) | 0 (0.0%) |
| Education Instruction & Library | 13 (19.7%) | 53 (80.3%) |
| Arts, Media & Entertainment | 2 (100.0%) | 0 (0.0%) |
| Health Diagnosing & Treating | 53 (55.8%) | 42 (44.2%) |
| Health Technologists | 16 (38.1%) | 26 (61.9%) |
| Total (Category) | 176 (56.4%) | 136 (43.6%) |
| Total (Overall) | 497 (63.4%) | 287 (36.6%) |
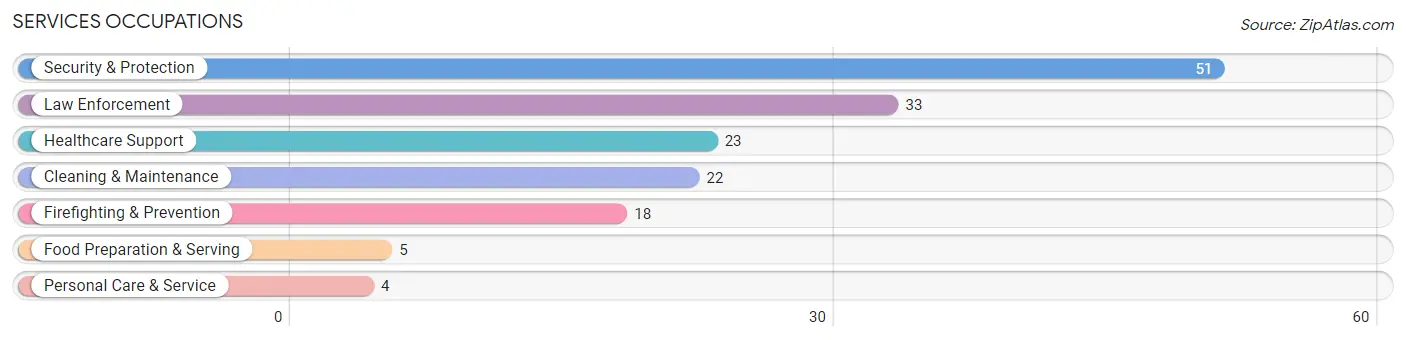
Services Occupations
The most common Services occupations in L Anse are Security & Protection (51 | 6.5%), Law Enforcement (33 | 4.2%), Healthcare Support (23 | 2.9%), Cleaning & Maintenance (22 | 2.8%), and Firefighting & Prevention (18 | 2.3%).
Services Occupations by Sex
Within the Services occupations in L Anse, the most male-oriented occupations are Firefighting & Prevention (100.0%), Personal Care & Service (100.0%), and Security & Protection (84.3%), while the most female-oriented occupations are Food Preparation & Serving (100.0%), Healthcare Support (87.0%), and Law Enforcement (24.2%).
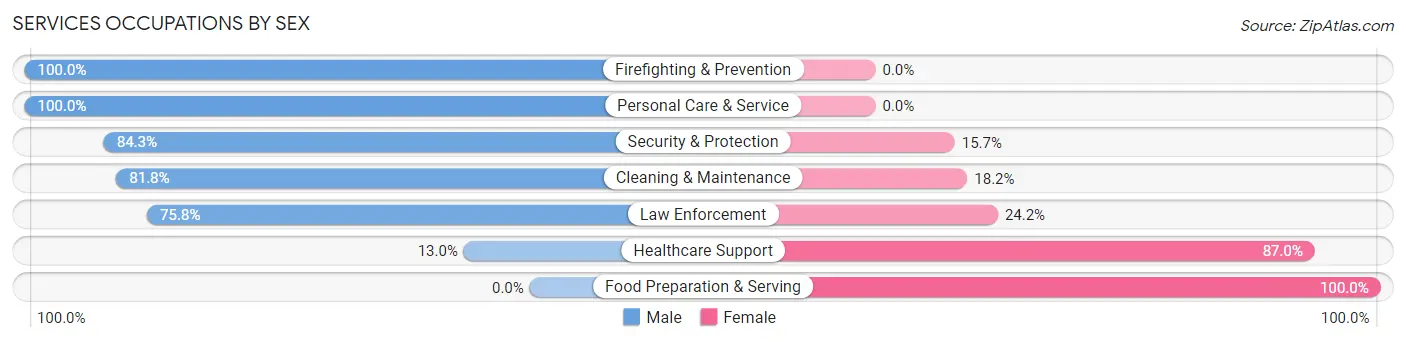
| Occupation | Male | Female |
| Healthcare Support | 3 (13.0%) | 20 (87.0%) |
| Security & Protection | 43 (84.3%) | 8 (15.7%) |
| Firefighting & Prevention | 18 (100.0%) | 0 (0.0%) |
| Law Enforcement | 25 (75.8%) | 8 (24.2%) |
| Food Preparation & Serving | 0 (0.0%) | 5 (100.0%) |
| Cleaning & Maintenance | 18 (81.8%) | 4 (18.2%) |
| Personal Care & Service | 4 (100.0%) | 0 (0.0%) |
| Total (Category) | 68 (64.8%) | 37 (35.2%) |
| Total (Overall) | 497 (63.4%) | 287 (36.6%) |
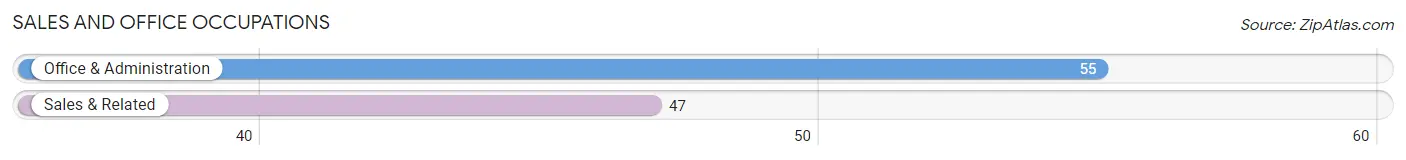
Sales and Office Occupations
The most common Sales and Office occupations in L Anse are Office & Administration (55 | 7.0%), and Sales & Related (47 | 6.0%).
Sales and Office Occupations by Sex
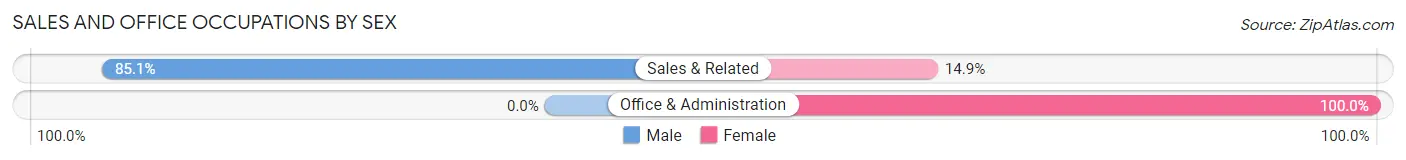
| Occupation | Male | Female |
| Sales & Related | 40 (85.1%) | 7 (14.9%) |
| Office & Administration | 0 (0.0%) | 55 (100.0%) |
| Total (Category) | 40 (39.2%) | 62 (60.8%) |
| Total (Overall) | 497 (63.4%) | 287 (36.6%) |
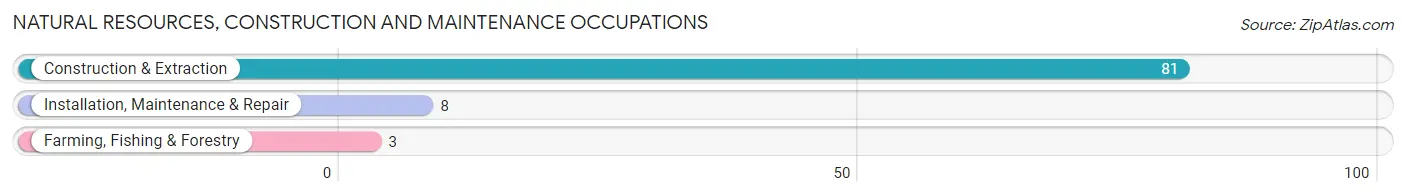
Natural Resources, Construction and Maintenance Occupations
The most common Natural Resources, Construction and Maintenance occupations in L Anse are Construction & Extraction (81 | 10.3%), Installation, Maintenance & Repair (8 | 1.0%), and Farming, Fishing & Forestry (3 | 0.4%).
Natural Resources, Construction and Maintenance Occupations by Sex
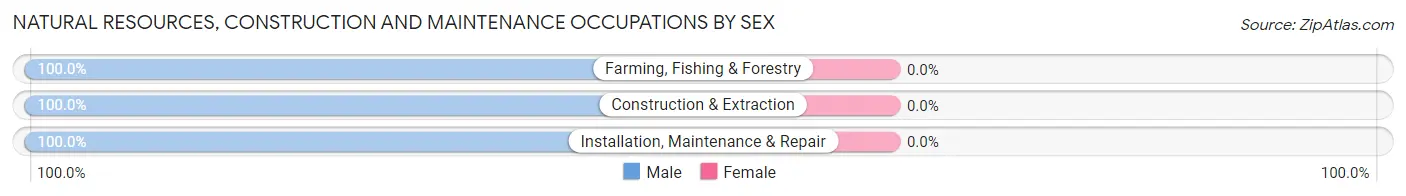
| Occupation | Male | Female |
| Farming, Fishing & Forestry | 3 (100.0%) | 0 (0.0%) |
| Construction & Extraction | 81 (100.0%) | 0 (0.0%) |
| Installation, Maintenance & Repair | 8 (100.0%) | 0 (0.0%) |
| Total (Category) | 92 (100.0%) | 0 (0.0%) |
| Total (Overall) | 497 (63.4%) | 287 (36.6%) |
Production, Transportation and Moving Occupations
The most common Production, Transportation and Moving occupations in L Anse are Production (103 | 13.1%), Material Moving (36 | 4.6%), and Transportation (34 | 4.3%).
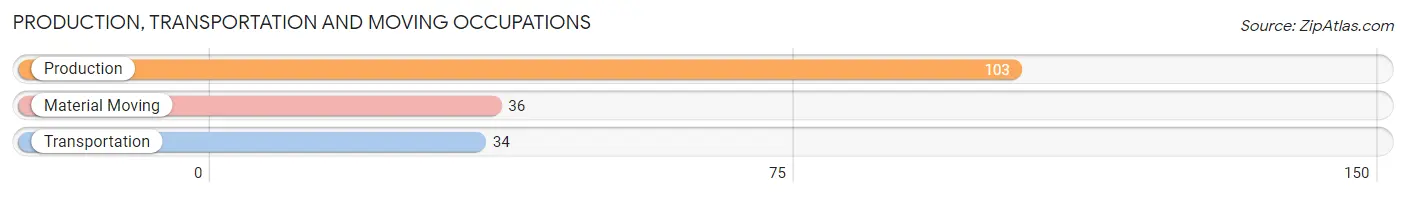
Production, Transportation and Moving Occupations by Sex
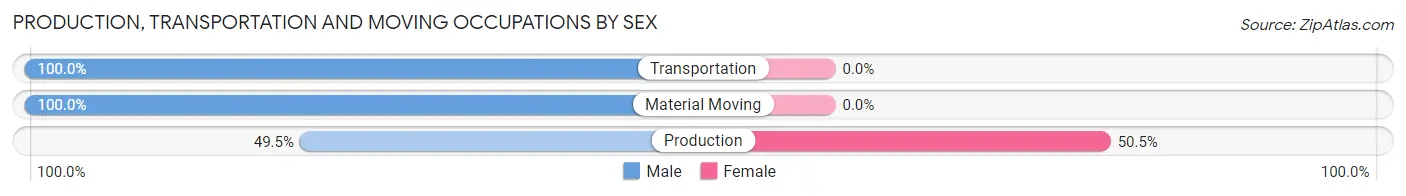
| Occupation | Male | Female |
| Production | 51 (49.5%) | 52 (50.5%) |
| Transportation | 34 (100.0%) | 0 (0.0%) |
| Material Moving | 36 (100.0%) | 0 (0.0%) |
| Total (Category) | 121 (69.9%) | 52 (30.1%) |
| Total (Overall) | 497 (63.4%) | 287 (36.6%) |
Employment Industries by Sex in L Anse
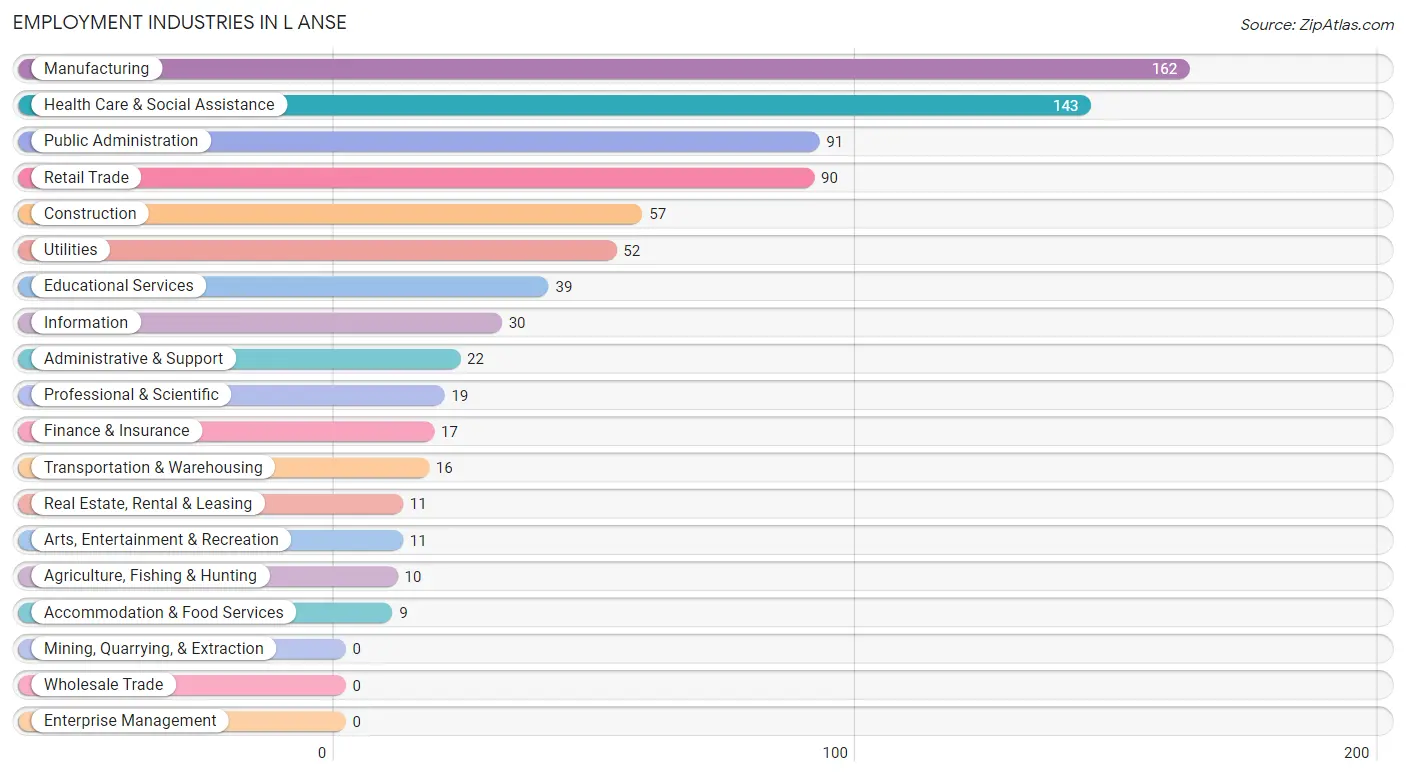
Employment Industries in L Anse
The major employment industries in L Anse include Manufacturing (162 | 20.7%), Health Care & Social Assistance (143 | 18.2%), Public Administration (91 | 11.6%), Retail Trade (90 | 11.5%), and Construction (57 | 7.3%).
Employment Industries by Sex in L Anse
The L Anse industries that see more men than women are Agriculture, Fishing & Hunting (100.0%), Real Estate, Rental & Leasing (100.0%), and Utilities (92.3%), whereas the industries that tend to have a higher number of women are Information (93.3%), Health Care & Social Assistance (81.1%), and Arts, Entertainment & Recreation (72.7%).
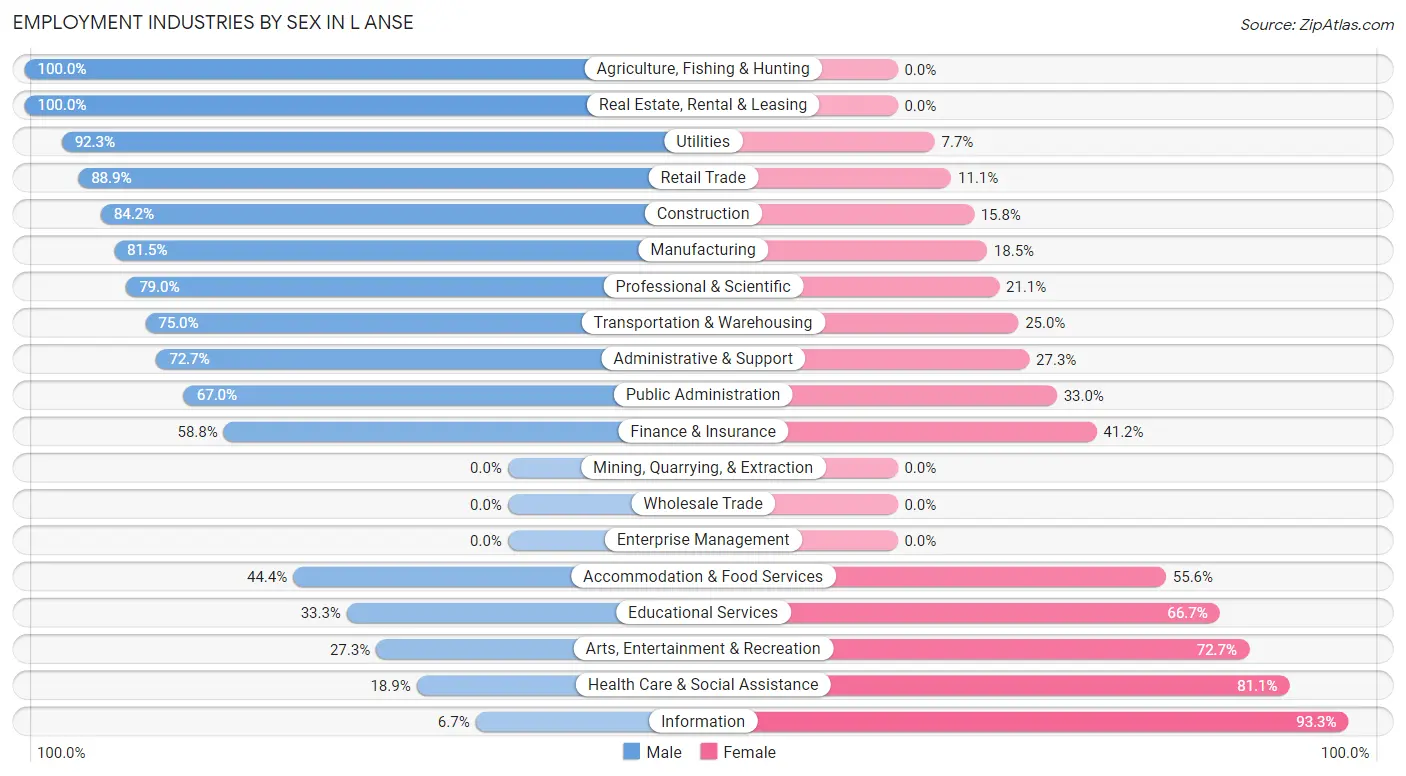
| Industry | Male | Female |
| Agriculture, Fishing & Hunting | 10 (100.0%) | 0 (0.0%) |
| Mining, Quarrying, & Extraction | 0 (0.0%) | 0 (0.0%) |
| Construction | 48 (84.2%) | 9 (15.8%) |
| Manufacturing | 132 (81.5%) | 30 (18.5%) |
| Wholesale Trade | 0 (0.0%) | 0 (0.0%) |
| Retail Trade | 80 (88.9%) | 10 (11.1%) |
| Transportation & Warehousing | 12 (75.0%) | 4 (25.0%) |
| Utilities | 48 (92.3%) | 4 (7.7%) |
| Information | 2 (6.7%) | 28 (93.3%) |
| Finance & Insurance | 10 (58.8%) | 7 (41.2%) |
| Real Estate, Rental & Leasing | 11 (100.0%) | 0 (0.0%) |
| Professional & Scientific | 15 (78.9%) | 4 (21.0%) |
| Enterprise Management | 0 (0.0%) | 0 (0.0%) |
| Administrative & Support | 16 (72.7%) | 6 (27.3%) |
| Educational Services | 13 (33.3%) | 26 (66.7%) |
| Health Care & Social Assistance | 27 (18.9%) | 116 (81.1%) |
| Arts, Entertainment & Recreation | 3 (27.3%) | 8 (72.7%) |
| Accommodation & Food Services | 4 (44.4%) | 5 (55.6%) |
| Public Administration | 61 (67.0%) | 30 (33.0%) |
| Total | 497 (63.4%) | 287 (36.6%) |
Education in L Anse
School Enrollment in L Anse
The most common levels of schooling among the 316 students in L Anse are middle school (75 | 23.7%), elementary school (67 | 21.2%), and high school (60 | 19.0%).
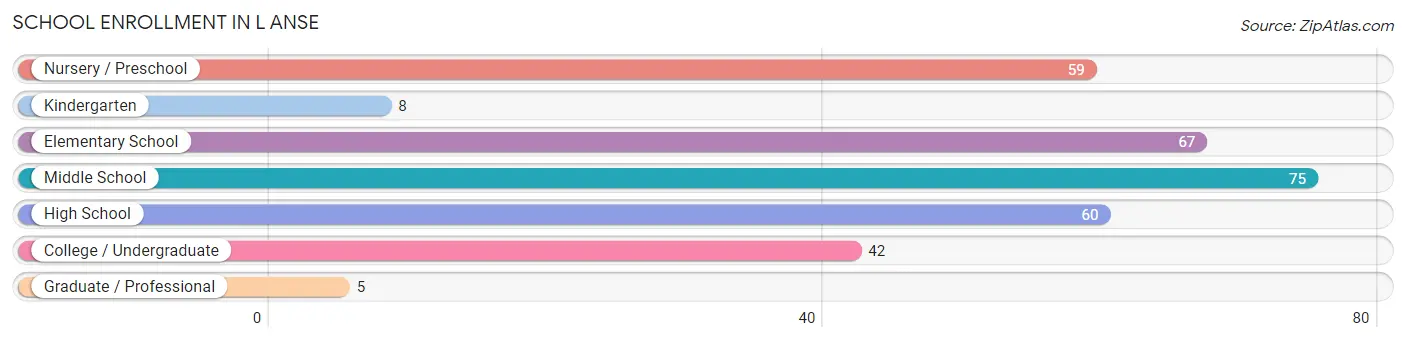
| School Level | # Students | % Students |
| Nursery / Preschool | 59 | 18.7% |
| Kindergarten | 8 | 2.5% |
| Elementary School | 67 | 21.2% |
| Middle School | 75 | 23.7% |
| High School | 60 | 19.0% |
| College / Undergraduate | 42 | 13.3% |
| Graduate / Professional | 5 | 1.6% |
| Total | 316 | 100.0% |
School Enrollment by Age by Funding Source in L Anse
Out of a total of 316 students who are enrolled in schools in L Anse, 40 (12.7%) attend a private institution, while the remaining 276 (87.3%) are enrolled in public schools. The age group of 5 to 9 year old has the highest likelihood of being enrolled in private schools, with 23 (33.8% in the age bracket) enrolled. Conversely, the age group of 15 to 17 year olds has the lowest likelihood of being enrolled in a private school, with 57 (100.0% in the age bracket) attending a public institution.
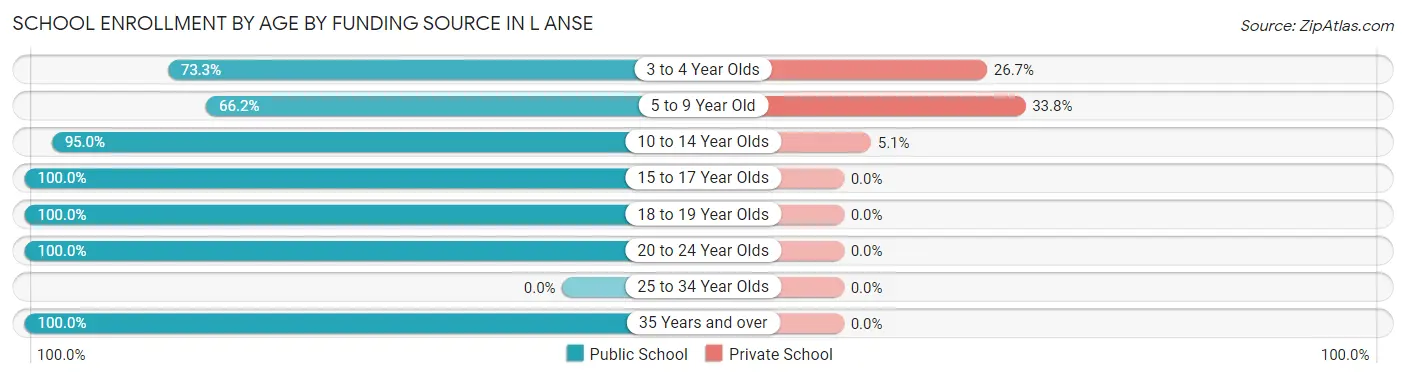
| Age Bracket | Public School | Private School |
| 3 to 4 Year Olds | 33 (73.3%) | 12 (26.7%) |
| 5 to 9 Year Old | 45 (66.2%) | 23 (33.8%) |
| 10 to 14 Year Olds | 94 (95.0%) | 5 (5.1%) |
| 15 to 17 Year Olds | 57 (100.0%) | 0 (0.0%) |
| 18 to 19 Year Olds | 6 (100.0%) | 0 (0.0%) |
| 20 to 24 Year Olds | 31 (100.0%) | 0 (0.0%) |
| 25 to 34 Year Olds | 0 (0.0%) | 0 (0.0%) |
| 35 Years and over | 10 (100.0%) | 0 (0.0%) |
| Total | 276 (87.3%) | 40 (12.7%) |
Educational Attainment by Field of Study in L Anse
Business (68 | 30.5%), science & technology (58 | 26.0%), social sciences (18 | 8.1%), education (18 | 8.1%), and bio, nature & agricultural (16 | 7.2%) are the most common fields of study among 223 individuals in L Anse who have obtained a bachelor's degree or higher.
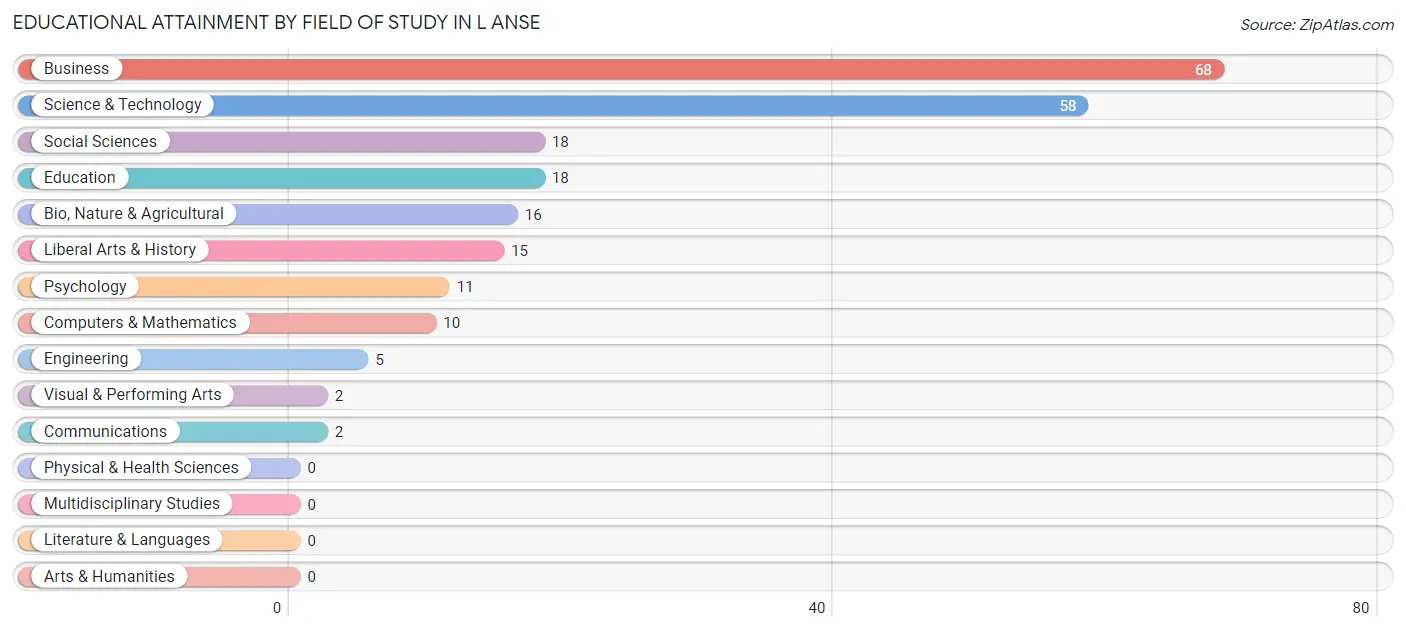
| Field of Study | # Graduates | % Graduates |
| Computers & Mathematics | 10 | 4.5% |
| Bio, Nature & Agricultural | 16 | 7.2% |
| Physical & Health Sciences | 0 | 0.0% |
| Psychology | 11 | 4.9% |
| Social Sciences | 18 | 8.1% |
| Engineering | 5 | 2.2% |
| Multidisciplinary Studies | 0 | 0.0% |
| Science & Technology | 58 | 26.0% |
| Business | 68 | 30.5% |
| Education | 18 | 8.1% |
| Literature & Languages | 0 | 0.0% |
| Liberal Arts & History | 15 | 6.7% |
| Visual & Performing Arts | 2 | 0.9% |
| Communications | 2 | 0.9% |
| Arts & Humanities | 0 | 0.0% |
| Total | 223 | 100.0% |
Transportation & Commute in L Anse
Vehicle Availability by Sex in L Anse
The most prevalent vehicle ownership categories in L Anse are males with 2 vehicles (239, accounting for 48.7%) and females with 2 vehicles (130, making up 86.9%).
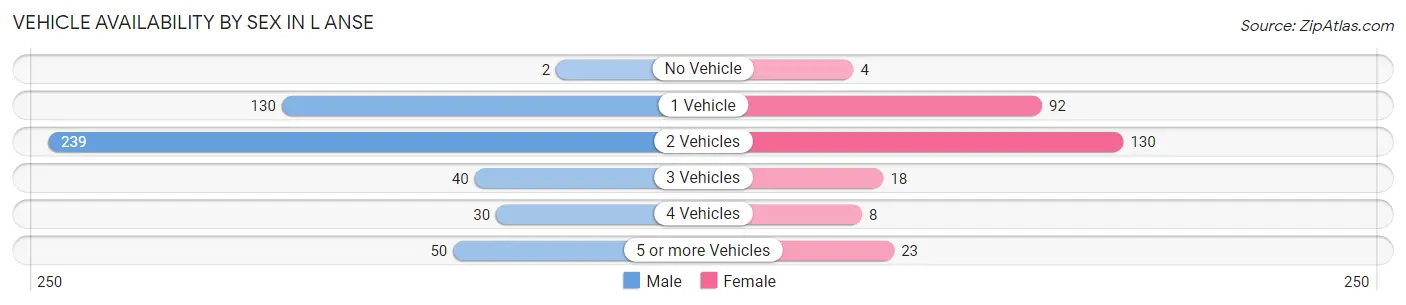
| Vehicles Available | Male | Female |
| No Vehicle | 2 (0.4%) | 4 (1.5%) |
| 1 Vehicle | 130 (26.5%) | 92 (33.5%) |
| 2 Vehicles | 239 (48.7%) | 130 (47.3%) |
| 3 Vehicles | 40 (8.2%) | 18 (6.6%) |
| 4 Vehicles | 30 (6.1%) | 8 (2.9%) |
| 5 or more Vehicles | 50 (10.2%) | 23 (8.4%) |
| Total | 491 (100.0%) | 275 (100.0%) |
Commute Time in L Anse
The most frequently occuring commute durations in L Anse are 10 to 14 minutes (193 commuters, 26.1%), 5 to 9 minutes (189 commuters, 25.6%), and less than 5 minutes (115 commuters, 15.6%).
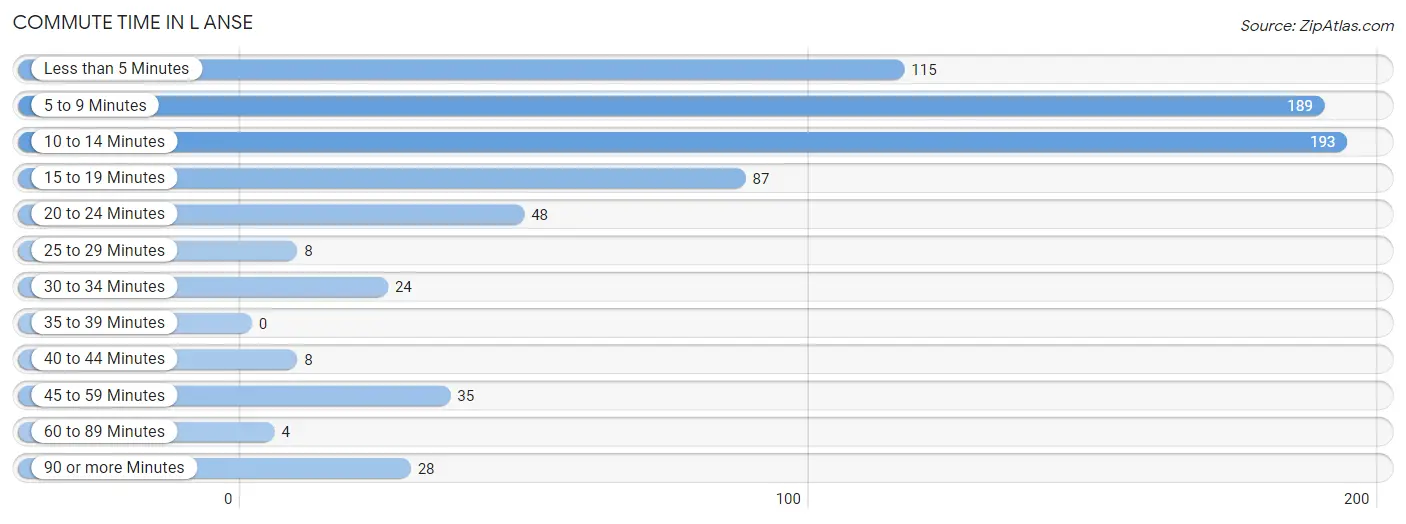
| Commute Time | # Commuters | % Commuters |
| Less than 5 Minutes | 115 | 15.6% |
| 5 to 9 Minutes | 189 | 25.6% |
| 10 to 14 Minutes | 193 | 26.1% |
| 15 to 19 Minutes | 87 | 11.8% |
| 20 to 24 Minutes | 48 | 6.5% |
| 25 to 29 Minutes | 8 | 1.1% |
| 30 to 34 Minutes | 24 | 3.3% |
| 35 to 39 Minutes | 0 | 0.0% |
| 40 to 44 Minutes | 8 | 1.1% |
| 45 to 59 Minutes | 35 | 4.7% |
| 60 to 89 Minutes | 4 | 0.5% |
| 90 or more Minutes | 28 | 3.8% |
Commute Time by Sex in L Anse
The most common commute times in L Anse are 10 to 14 minutes (172 commuters, 36.7%) for males and 5 to 9 minutes (90 commuters, 33.3%) for females.
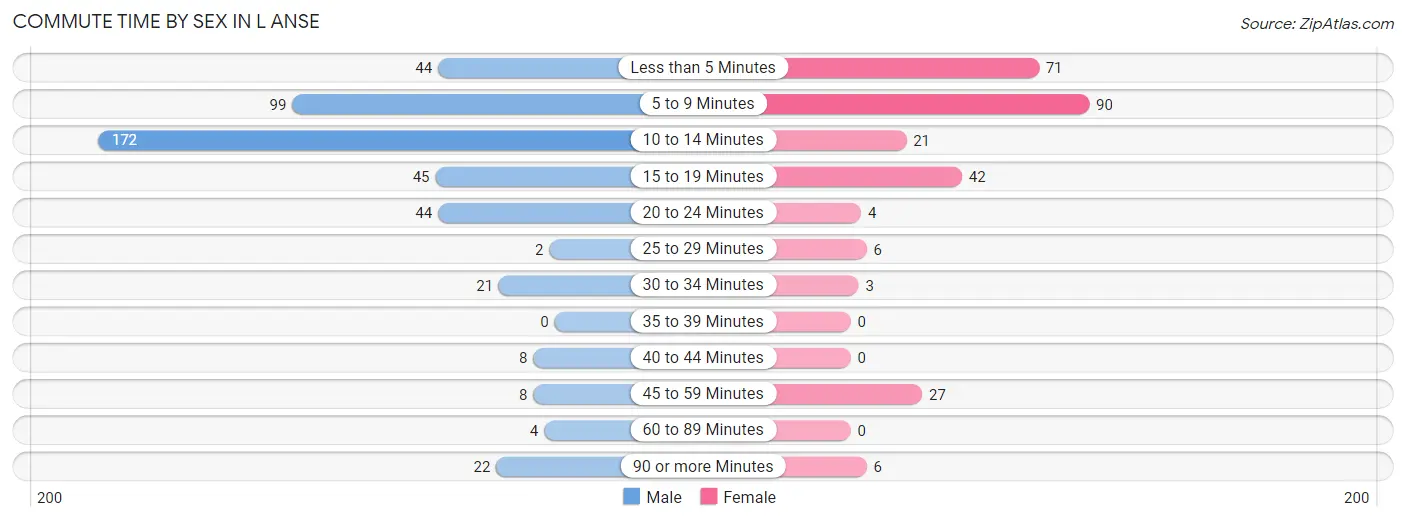
| Commute Time | Male | Female |
| Less than 5 Minutes | 44 (9.4%) | 71 (26.3%) |
| 5 to 9 Minutes | 99 (21.1%) | 90 (33.3%) |
| 10 to 14 Minutes | 172 (36.7%) | 21 (7.8%) |
| 15 to 19 Minutes | 45 (9.6%) | 42 (15.6%) |
| 20 to 24 Minutes | 44 (9.4%) | 4 (1.5%) |
| 25 to 29 Minutes | 2 (0.4%) | 6 (2.2%) |
| 30 to 34 Minutes | 21 (4.5%) | 3 (1.1%) |
| 35 to 39 Minutes | 0 (0.0%) | 0 (0.0%) |
| 40 to 44 Minutes | 8 (1.7%) | 0 (0.0%) |
| 45 to 59 Minutes | 8 (1.7%) | 27 (10.0%) |
| 60 to 89 Minutes | 4 (0.9%) | 0 (0.0%) |
| 90 or more Minutes | 22 (4.7%) | 6 (2.2%) |
Time of Departure to Work by Sex in L Anse
The most frequent times of departure to work in L Anse are 6:00 AM to 6:29 AM (95, 20.3%) for males and 7:30 AM to 7:59 AM (70, 25.9%) for females.
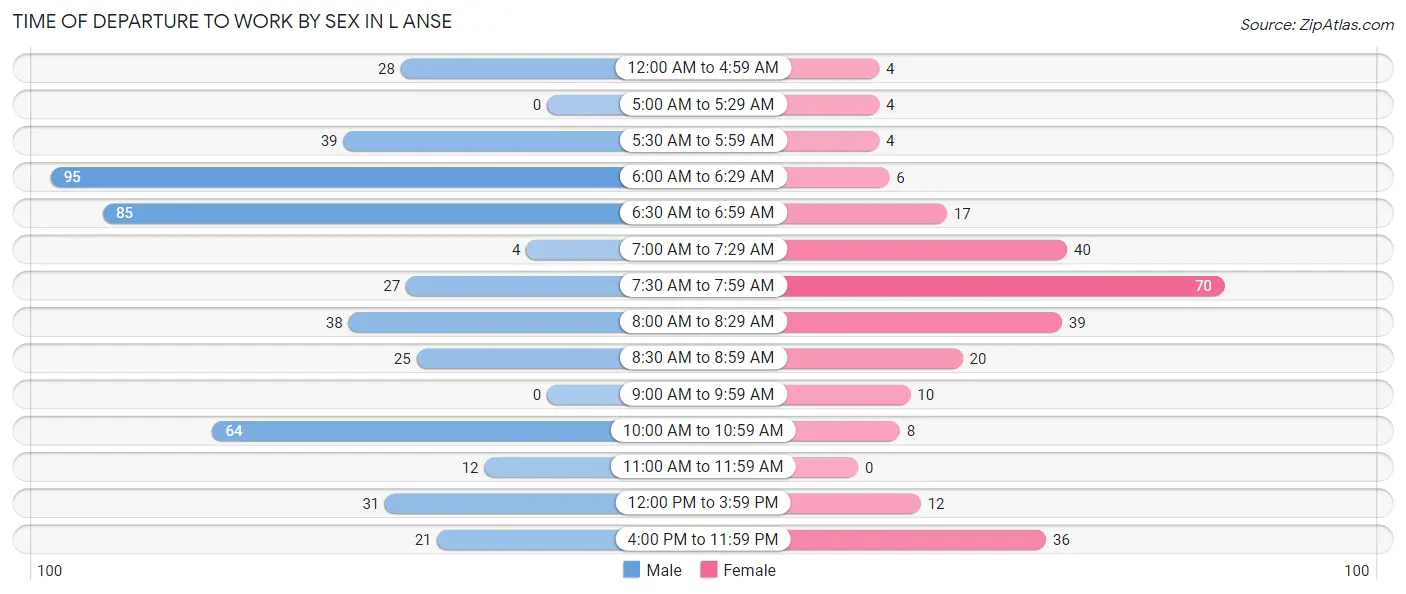
| Time of Departure | Male | Female |
| 12:00 AM to 4:59 AM | 28 (6.0%) | 4 (1.5%) |
| 5:00 AM to 5:29 AM | 0 (0.0%) | 4 (1.5%) |
| 5:30 AM to 5:59 AM | 39 (8.3%) | 4 (1.5%) |
| 6:00 AM to 6:29 AM | 95 (20.3%) | 6 (2.2%) |
| 6:30 AM to 6:59 AM | 85 (18.1%) | 17 (6.3%) |
| 7:00 AM to 7:29 AM | 4 (0.9%) | 40 (14.8%) |
| 7:30 AM to 7:59 AM | 27 (5.8%) | 70 (25.9%) |
| 8:00 AM to 8:29 AM | 38 (8.1%) | 39 (14.4%) |
| 8:30 AM to 8:59 AM | 25 (5.3%) | 20 (7.4%) |
| 9:00 AM to 9:59 AM | 0 (0.0%) | 10 (3.7%) |
| 10:00 AM to 10:59 AM | 64 (13.7%) | 8 (3.0%) |
| 11:00 AM to 11:59 AM | 12 (2.6%) | 0 (0.0%) |
| 12:00 PM to 3:59 PM | 31 (6.6%) | 12 (4.4%) |
| 4:00 PM to 11:59 PM | 21 (4.5%) | 36 (13.3%) |
| Total | 469 (100.0%) | 270 (100.0%) |
Housing Occupancy in L Anse
Occupancy by Ownership in L Anse
Of the total 882 dwellings in L Anse, owner-occupied units account for 546 (61.9%), while renter-occupied units make up 336 (38.1%).
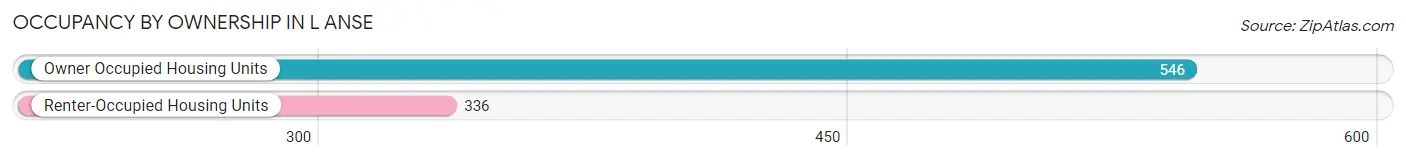
| Occupancy | # Housing Units | % Housing Units |
| Owner Occupied Housing Units | 546 | 61.9% |
| Renter-Occupied Housing Units | 336 | 38.1% |
| Total Occupied Housing Units | 882 | 100.0% |
Occupancy by Household Size in L Anse
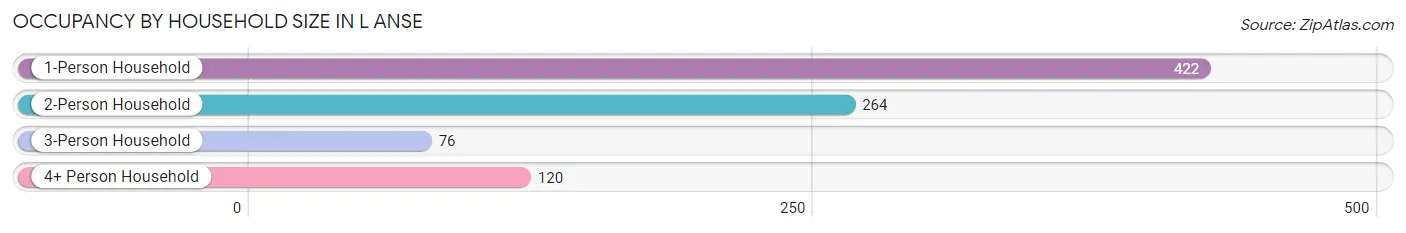
| Household Size | # Housing Units | % Housing Units |
| 1-Person Household | 422 | 47.8% |
| 2-Person Household | 264 | 29.9% |
| 3-Person Household | 76 | 8.6% |
| 4+ Person Household | 120 | 13.6% |
| Total Housing Units | 882 | 100.0% |
Occupancy by Ownership by Household Size in L Anse
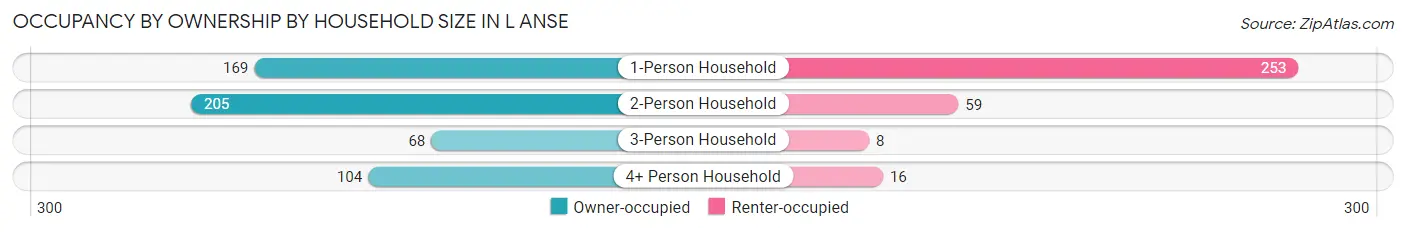
| Household Size | Owner-occupied | Renter-occupied |
| 1-Person Household | 169 (40.1%) | 253 (60.0%) |
| 2-Person Household | 205 (77.6%) | 59 (22.4%) |
| 3-Person Household | 68 (89.5%) | 8 (10.5%) |
| 4+ Person Household | 104 (86.7%) | 16 (13.3%) |
| Total Housing Units | 546 (61.9%) | 336 (38.1%) |
Occupancy by Educational Attainment in L Anse
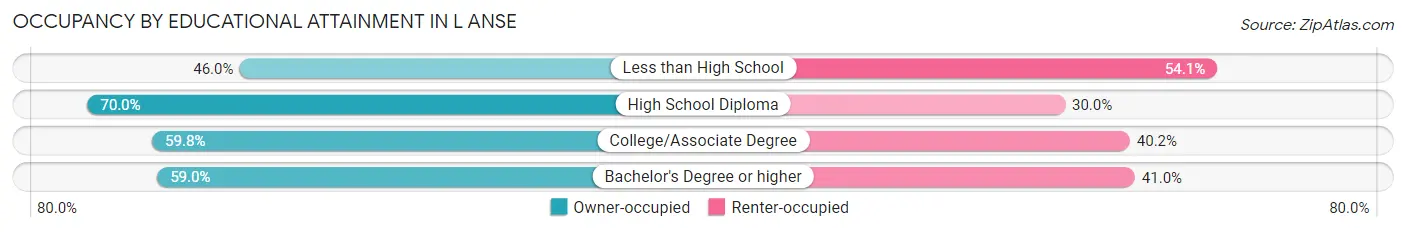
| Household Size | Owner-occupied | Renter-occupied |
| Less than High School | 17 (46.0%) | 20 (54.0%) |
| High School Diploma | 173 (70.0%) | 74 (30.0%) |
| College/Associate Degree | 254 (59.8%) | 171 (40.2%) |
| Bachelor's Degree or higher | 102 (59.0%) | 71 (41.0%) |
Occupancy by Age of Householder in L Anse
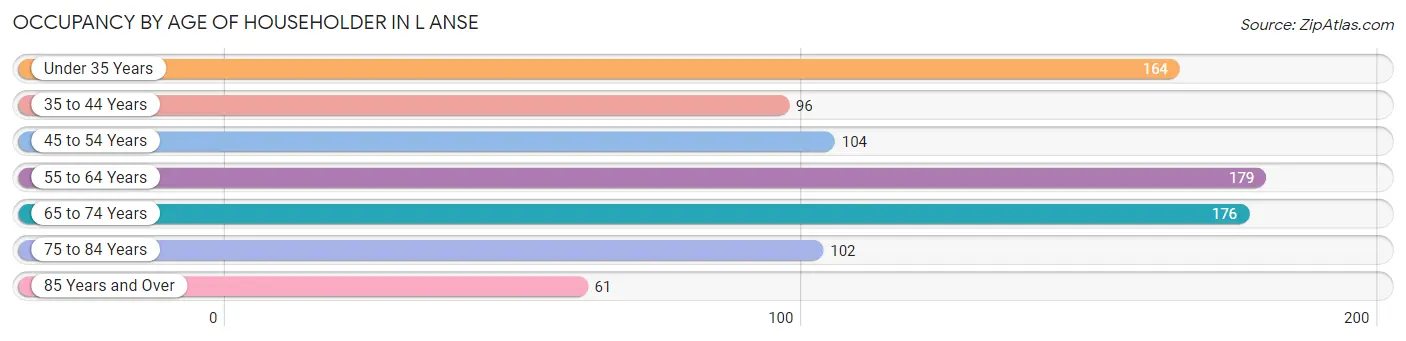
| Age Bracket | # Households | % Households |
| Under 35 Years | 164 | 18.6% |
| 35 to 44 Years | 96 | 10.9% |
| 45 to 54 Years | 104 | 11.8% |
| 55 to 64 Years | 179 | 20.3% |
| 65 to 74 Years | 176 | 20.0% |
| 75 to 84 Years | 102 | 11.6% |
| 85 Years and Over | 61 | 6.9% |
| Total | 882 | 100.0% |
Housing Finances in L Anse
Median Income by Occupancy in L Anse
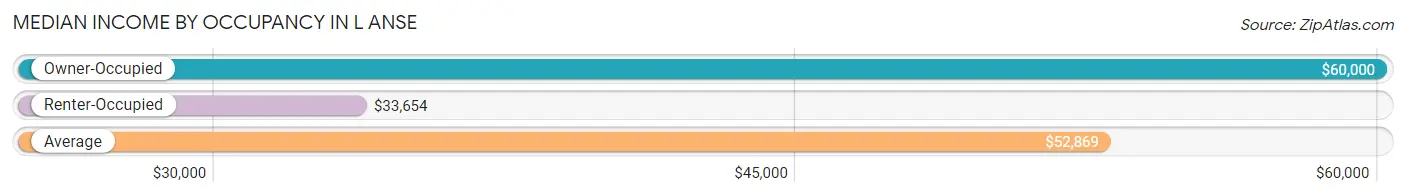
| Occupancy Type | # Households | Median Income |
| Owner-Occupied | 546 (61.9%) | $60,000 |
| Renter-Occupied | 336 (38.1%) | $33,654 |
| Average | 882 (100.0%) | $52,869 |
Occupancy by Householder Income Bracket in L Anse
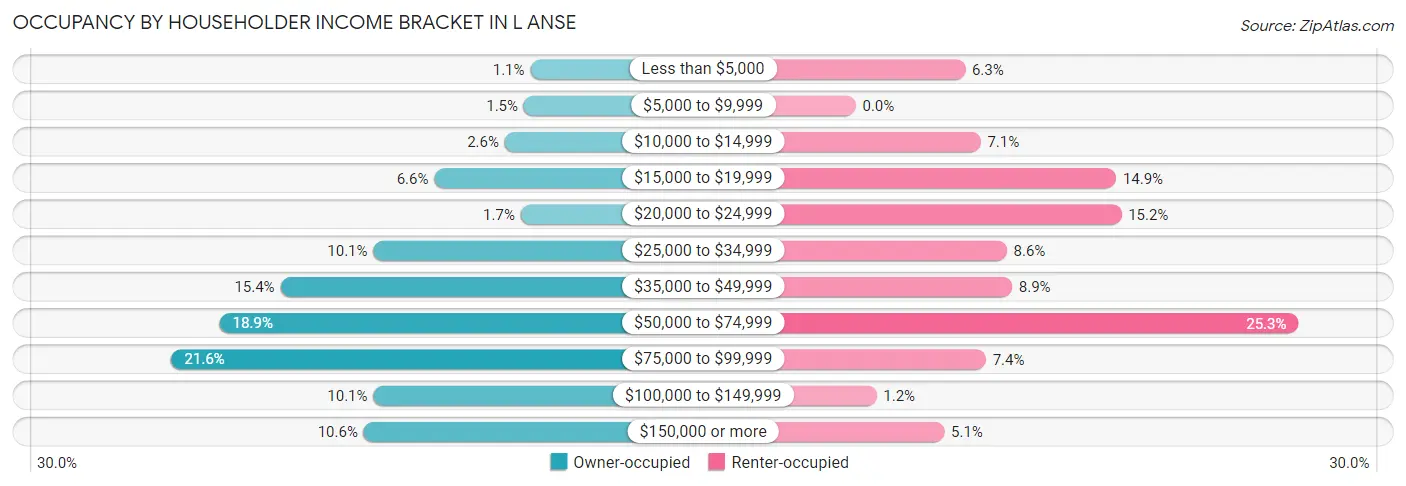
| Income Bracket | Owner-occupied | Renter-occupied |
| Less than $5,000 | 6 (1.1%) | 21 (6.2%) |
| $5,000 to $9,999 | 8 (1.5%) | 0 (0.0%) |
| $10,000 to $14,999 | 14 (2.6%) | 24 (7.1%) |
| $15,000 to $19,999 | 36 (6.6%) | 50 (14.9%) |
| $20,000 to $24,999 | 9 (1.7%) | 51 (15.2%) |
| $25,000 to $34,999 | 55 (10.1%) | 29 (8.6%) |
| $35,000 to $49,999 | 84 (15.4%) | 30 (8.9%) |
| $50,000 to $74,999 | 103 (18.9%) | 85 (25.3%) |
| $75,000 to $99,999 | 118 (21.6%) | 25 (7.4%) |
| $100,000 to $149,999 | 55 (10.1%) | 4 (1.2%) |
| $150,000 or more | 58 (10.6%) | 17 (5.1%) |
| Total | 546 (100.0%) | 336 (100.0%) |
Monthly Housing Cost Tiers in L Anse
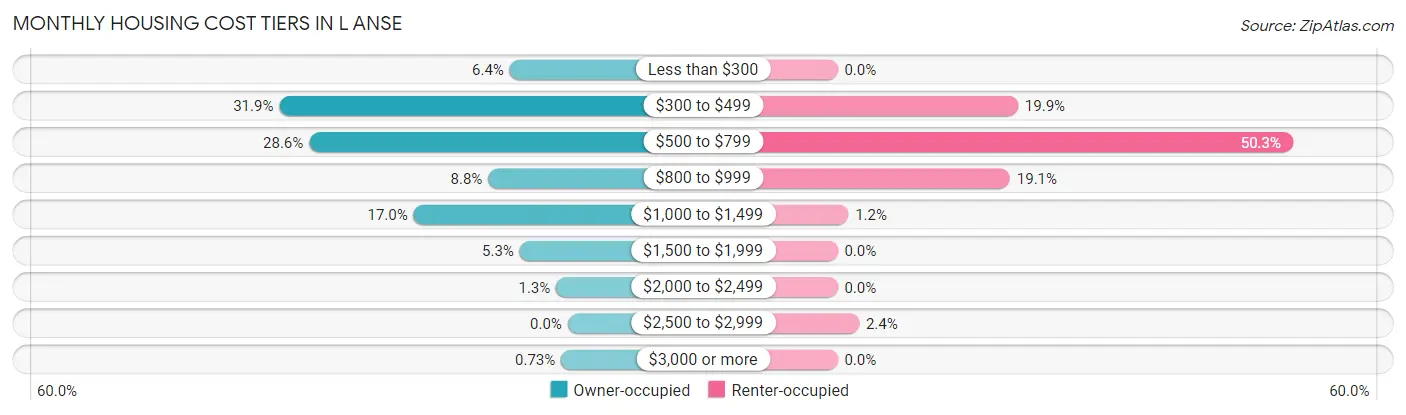
| Monthly Cost | Owner-occupied | Renter-occupied |
| Less than $300 | 35 (6.4%) | 0 (0.0%) |
| $300 to $499 | 174 (31.9%) | 67 (19.9%) |
| $500 to $799 | 156 (28.6%) | 169 (50.3%) |
| $800 to $999 | 48 (8.8%) | 64 (19.1%) |
| $1,000 to $1,499 | 93 (17.0%) | 4 (1.2%) |
| $1,500 to $1,999 | 29 (5.3%) | 0 (0.0%) |
| $2,000 to $2,499 | 7 (1.3%) | 0 (0.0%) |
| $2,500 to $2,999 | 0 (0.0%) | 8 (2.4%) |
| $3,000 or more | 4 (0.7%) | 0 (0.0%) |
| Total | 546 (100.0%) | 336 (100.0%) |
Physical Housing Characteristics in L Anse
Housing Structures in L Anse
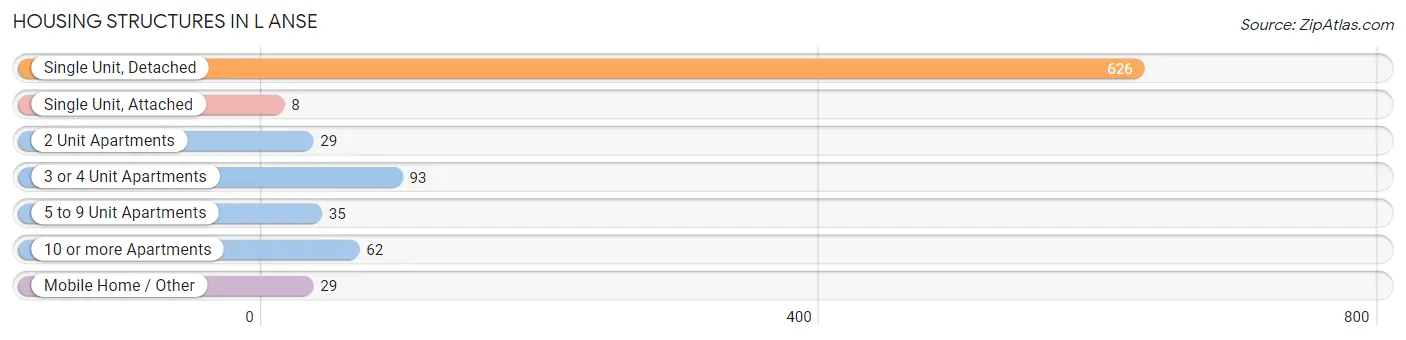
| Structure Type | # Housing Units | % Housing Units |
| Single Unit, Detached | 626 | 71.0% |
| Single Unit, Attached | 8 | 0.9% |
| 2 Unit Apartments | 29 | 3.3% |
| 3 or 4 Unit Apartments | 93 | 10.5% |
| 5 to 9 Unit Apartments | 35 | 4.0% |
| 10 or more Apartments | 62 | 7.0% |
| Mobile Home / Other | 29 | 3.3% |
| Total | 882 | 100.0% |
Housing Structures by Occupancy in L Anse
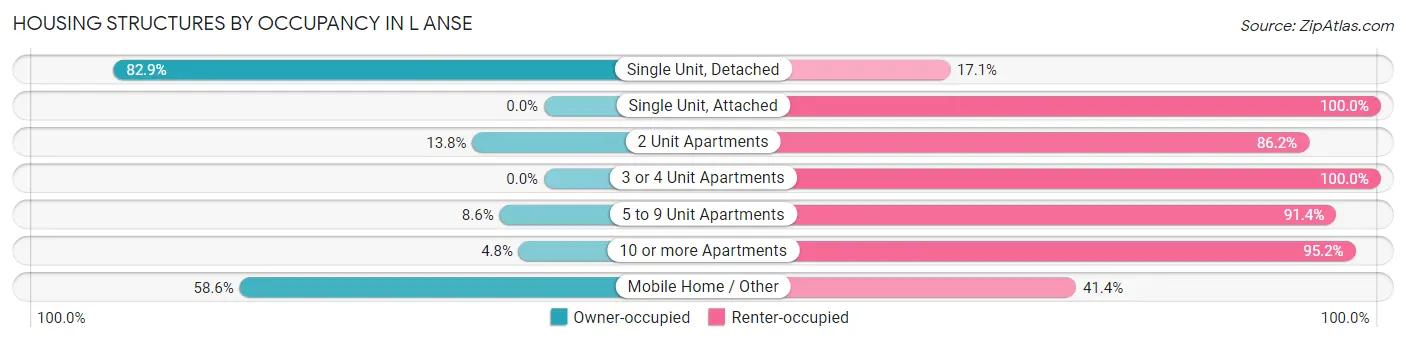
| Structure Type | Owner-occupied | Renter-occupied |
| Single Unit, Detached | 519 (82.9%) | 107 (17.1%) |
| Single Unit, Attached | 0 (0.0%) | 8 (100.0%) |
| 2 Unit Apartments | 4 (13.8%) | 25 (86.2%) |
| 3 or 4 Unit Apartments | 0 (0.0%) | 93 (100.0%) |
| 5 to 9 Unit Apartments | 3 (8.6%) | 32 (91.4%) |
| 10 or more Apartments | 3 (4.8%) | 59 (95.2%) |
| Mobile Home / Other | 17 (58.6%) | 12 (41.4%) |
| Total | 546 (61.9%) | 336 (38.1%) |
Housing Structures by Number of Rooms in L Anse
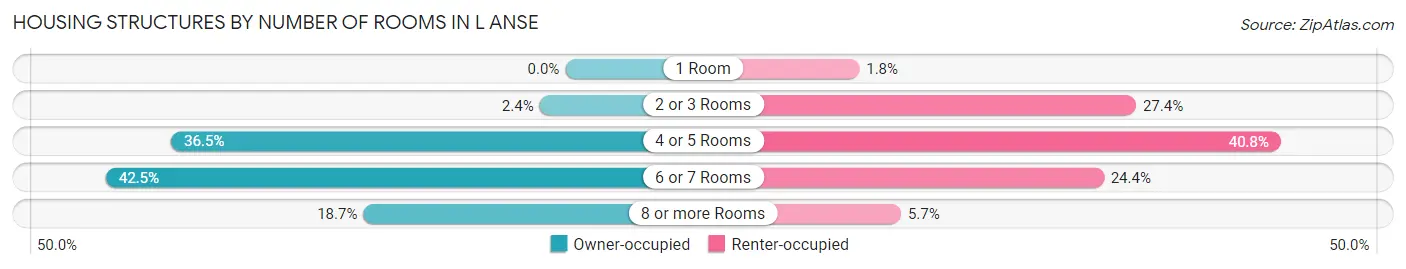
| Number of Rooms | Owner-occupied | Renter-occupied |
| 1 Room | 0 (0.0%) | 6 (1.8%) |
| 2 or 3 Rooms | 13 (2.4%) | 92 (27.4%) |
| 4 or 5 Rooms | 199 (36.4%) | 137 (40.8%) |
| 6 or 7 Rooms | 232 (42.5%) | 82 (24.4%) |
| 8 or more Rooms | 102 (18.7%) | 19 (5.7%) |
| Total | 546 (100.0%) | 336 (100.0%) |
Housing Structure by Heating Type in L Anse
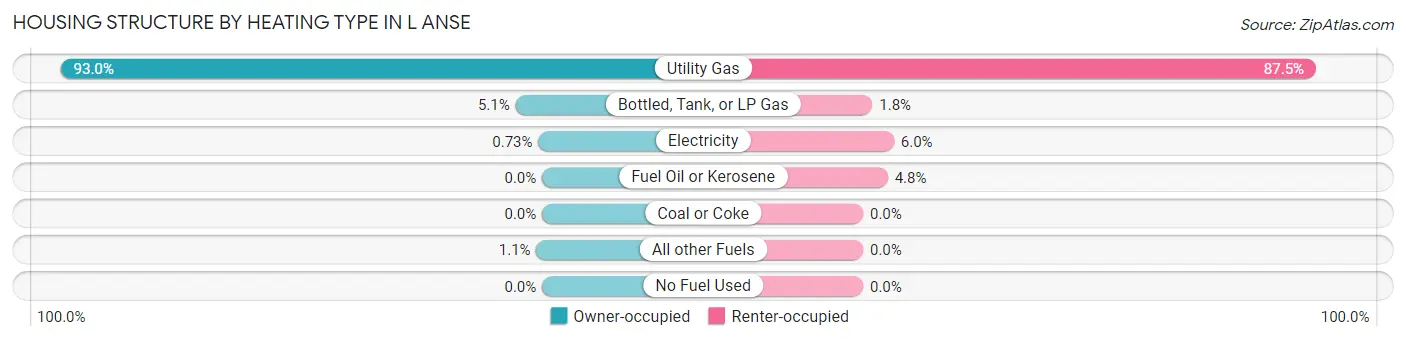
| Heating Type | Owner-occupied | Renter-occupied |
| Utility Gas | 508 (93.0%) | 294 (87.5%) |
| Bottled, Tank, or LP Gas | 28 (5.1%) | 6 (1.8%) |
| Electricity | 4 (0.7%) | 20 (5.9%) |
| Fuel Oil or Kerosene | 0 (0.0%) | 16 (4.8%) |
| Coal or Coke | 0 (0.0%) | 0 (0.0%) |
| All other Fuels | 6 (1.1%) | 0 (0.0%) |
| No Fuel Used | 0 (0.0%) | 0 (0.0%) |
| Total | 546 (100.0%) | 336 (100.0%) |
Household Vehicle Usage in L Anse
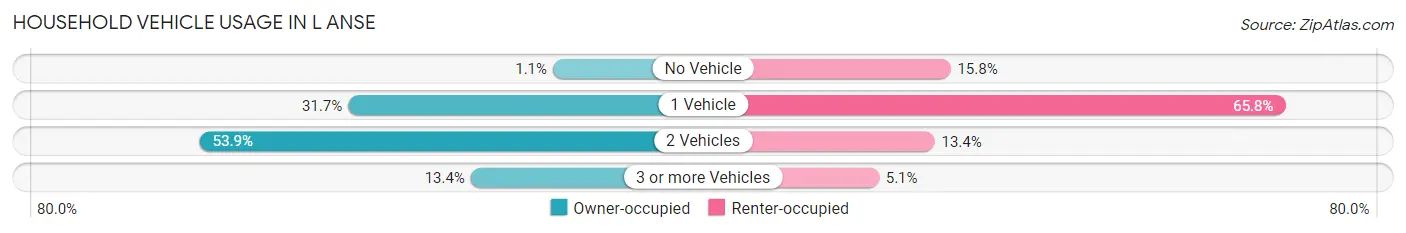
| Vehicles per Household | Owner-occupied | Renter-occupied |
| No Vehicle | 6 (1.1%) | 53 (15.8%) |
| 1 Vehicle | 173 (31.7%) | 221 (65.8%) |
| 2 Vehicles | 294 (53.8%) | 45 (13.4%) |
| 3 or more Vehicles | 73 (13.4%) | 17 (5.1%) |
| Total | 546 (100.0%) | 336 (100.0%) |
Real Estate & Mortgages in L Anse
Real Estate and Mortgage Overview in L Anse
| Characteristic | Without Mortgage | With Mortgage |
| Housing Units | 305 | 241 |
| Median Property Value | $84,300 | $97,600 |
| Median Household Income | $51,750 | $39 |
| Monthly Housing Costs | $446 | $0 |
| Real Estate Taxes | $1,830 | $15 |
Property Value by Mortgage Status in L Anse
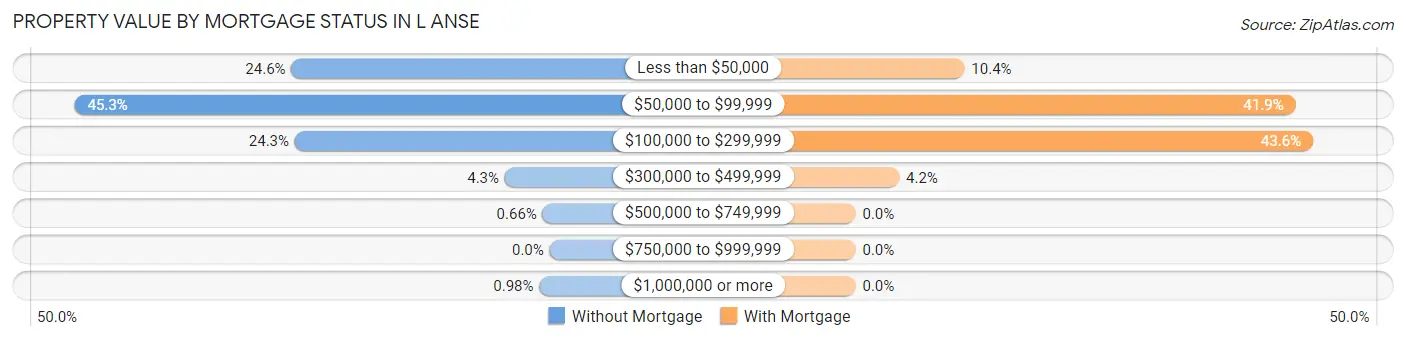
| Property Value | Without Mortgage | With Mortgage |
| Less than $50,000 | 75 (24.6%) | 25 (10.4%) |
| $50,000 to $99,999 | 138 (45.3%) | 101 (41.9%) |
| $100,000 to $299,999 | 74 (24.3%) | 105 (43.6%) |
| $300,000 to $499,999 | 13 (4.3%) | 10 (4.2%) |
| $500,000 to $749,999 | 2 (0.7%) | 0 (0.0%) |
| $750,000 to $999,999 | 0 (0.0%) | 0 (0.0%) |
| $1,000,000 or more | 3 (1.0%) | 0 (0.0%) |
| Total | 305 (100.0%) | 241 (100.0%) |
Household Income by Mortgage Status in L Anse
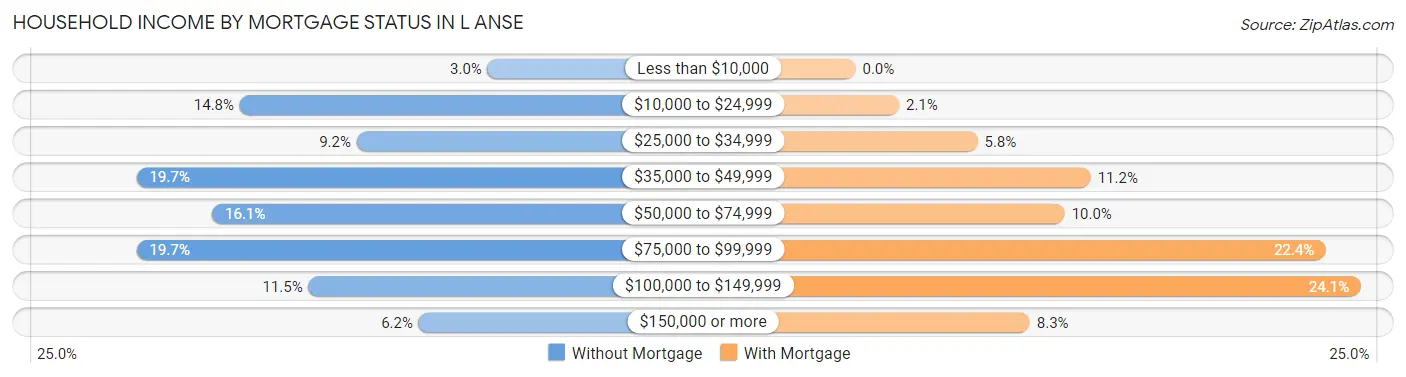
| Household Income | Without Mortgage | With Mortgage |
| Less than $10,000 | 9 (2.9%) | 0 (0.0%) |
| $10,000 to $24,999 | 45 (14.7%) | 5 (2.1%) |
| $25,000 to $34,999 | 28 (9.2%) | 14 (5.8%) |
| $35,000 to $49,999 | 60 (19.7%) | 27 (11.2%) |
| $50,000 to $74,999 | 49 (16.1%) | 24 (10.0%) |
| $75,000 to $99,999 | 60 (19.7%) | 54 (22.4%) |
| $100,000 to $149,999 | 35 (11.5%) | 58 (24.1%) |
| $150,000 or more | 19 (6.2%) | 20 (8.3%) |
| Total | 305 (100.0%) | 241 (100.0%) |
Property Value to Household Income Ratio in L Anse
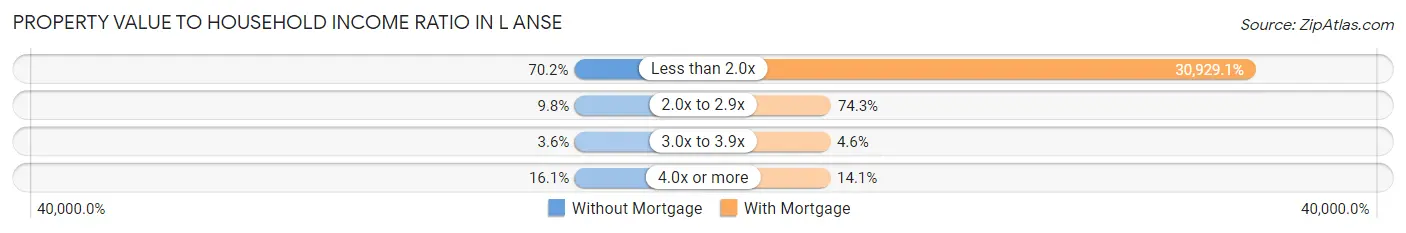
| Value-to-Income Ratio | Without Mortgage | With Mortgage |
| Less than 2.0x | 214 (70.2%) | 74,539 (30,929.1%) |
| 2.0x to 2.9x | 30 (9.8%) | 179 (74.3%) |
| 3.0x to 3.9x | 11 (3.6%) | 11 (4.6%) |
| 4.0x or more | 49 (16.1%) | 34 (14.1%) |
| Total | 305 (100.0%) | 241 (100.0%) |
Real Estate Taxes by Mortgage Status in L Anse
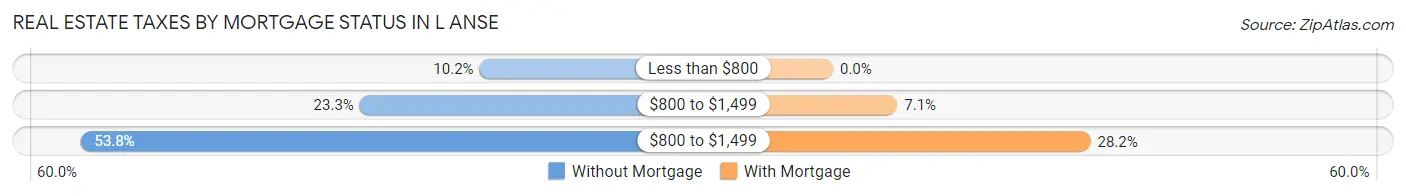
| Property Taxes | Without Mortgage | With Mortgage |
| Less than $800 | 31 (10.2%) | 0 (0.0%) |
| $800 to $1,499 | 71 (23.3%) | 17 (7.0%) |
| $800 to $1,499 | 164 (53.8%) | 68 (28.2%) |
| Total | 305 (100.0%) | 241 (100.0%) |
Health & Disability in L Anse
Health Insurance Coverage by Age in L Anse
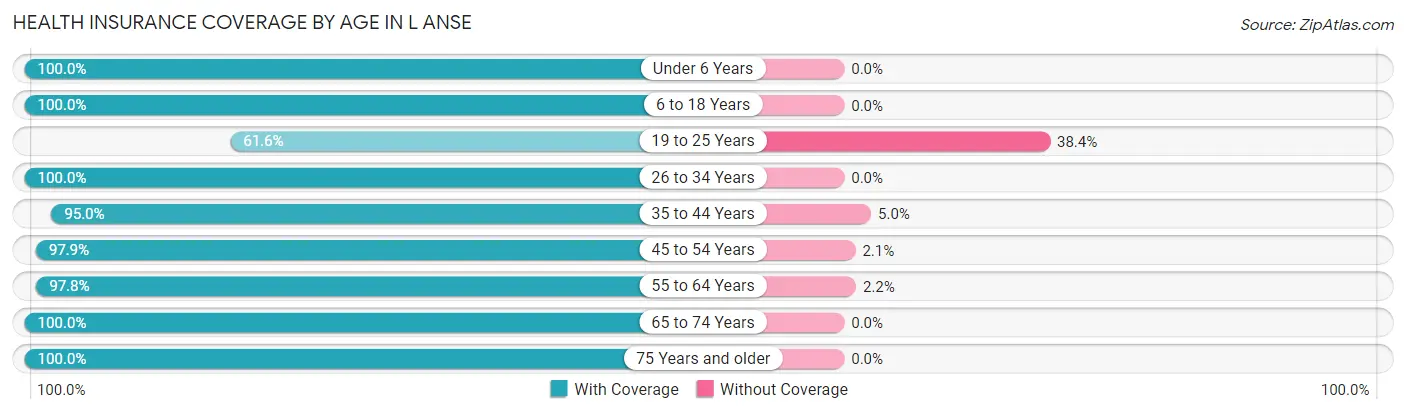
| Age Bracket | With Coverage | Without Coverage |
| Under 6 Years | 140 (100.0%) | 0 (0.0%) |
| 6 to 18 Years | 209 (100.0%) | 0 (0.0%) |
| 19 to 25 Years | 90 (61.6%) | 56 (38.4%) |
| 26 to 34 Years | 213 (100.0%) | 0 (0.0%) |
| 35 to 44 Years | 152 (95.0%) | 8 (5.0%) |
| 45 to 54 Years | 187 (97.9%) | 4 (2.1%) |
| 55 to 64 Years | 268 (97.8%) | 6 (2.2%) |
| 65 to 74 Years | 271 (100.0%) | 0 (0.0%) |
| 75 Years and older | 213 (100.0%) | 0 (0.0%) |
| Total | 1,743 (95.9%) | 74 (4.1%) |
Health Insurance Coverage by Citizenship Status in L Anse
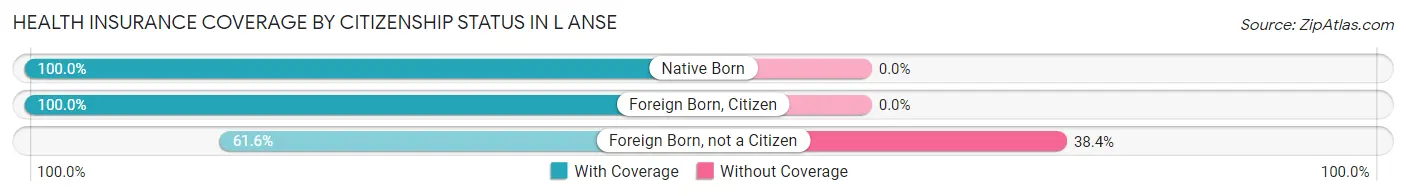
| Citizenship Status | With Coverage | Without Coverage |
| Native Born | 140 (100.0%) | 0 (0.0%) |
| Foreign Born, Citizen | 209 (100.0%) | 0 (0.0%) |
| Foreign Born, not a Citizen | 90 (61.6%) | 56 (38.4%) |
Health Insurance Coverage by Household Income in L Anse
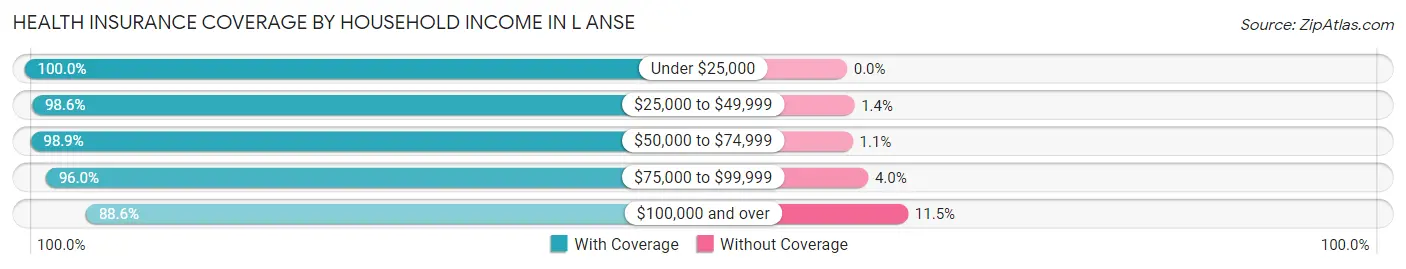
| Household Income | With Coverage | Without Coverage |
| Under $25,000 | 241 (100.0%) | 0 (0.0%) |
| $25,000 to $49,999 | 356 (98.6%) | 5 (1.4%) |
| $50,000 to $74,999 | 367 (98.9%) | 4 (1.1%) |
| $75,000 to $99,999 | 388 (96.0%) | 16 (4.0%) |
| $100,000 and over | 379 (88.5%) | 49 (11.5%) |
Public vs Private Health Insurance Coverage by Age in L Anse
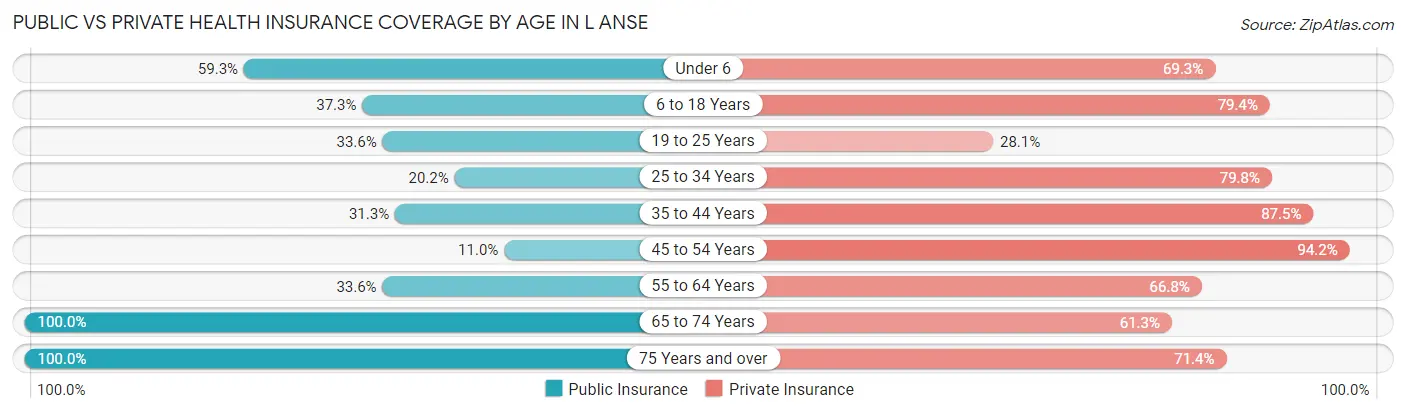
| Age Bracket | Public Insurance | Private Insurance |
| Under 6 | 83 (59.3%) | 97 (69.3%) |
| 6 to 18 Years | 78 (37.3%) | 166 (79.4%) |
| 19 to 25 Years | 49 (33.6%) | 41 (28.1%) |
| 25 to 34 Years | 43 (20.2%) | 170 (79.8%) |
| 35 to 44 Years | 50 (31.2%) | 140 (87.5%) |
| 45 to 54 Years | 21 (11.0%) | 180 (94.2%) |
| 55 to 64 Years | 92 (33.6%) | 183 (66.8%) |
| 65 to 74 Years | 271 (100.0%) | 166 (61.3%) |
| 75 Years and over | 213 (100.0%) | 152 (71.4%) |
| Total | 900 (49.5%) | 1,295 (71.3%) |
Disability Status by Sex by Age in L Anse
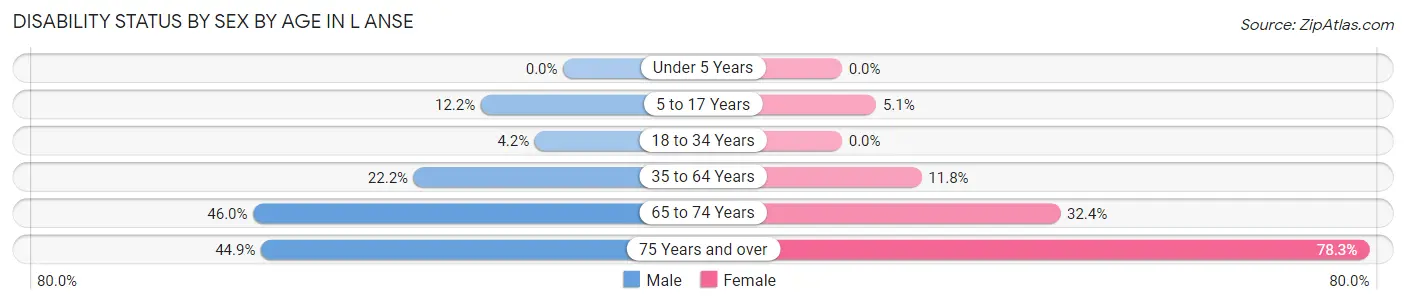
| Age Bracket | Male | Female |
| Under 5 Years | 0 (0.0%) | 0 (0.0%) |
| 5 to 17 Years | 11 (12.2%) | 7 (5.1%) |
| 18 to 34 Years | 11 (4.2%) | 0 (0.0%) |
| 35 to 64 Years | 73 (22.2%) | 35 (11.8%) |
| 65 to 74 Years | 58 (46.0%) | 47 (32.4%) |
| 75 Years and over | 48 (44.9%) | 83 (78.3%) |
Disability Class by Sex by Age in L Anse
Disability Class: Hearing Difficulty
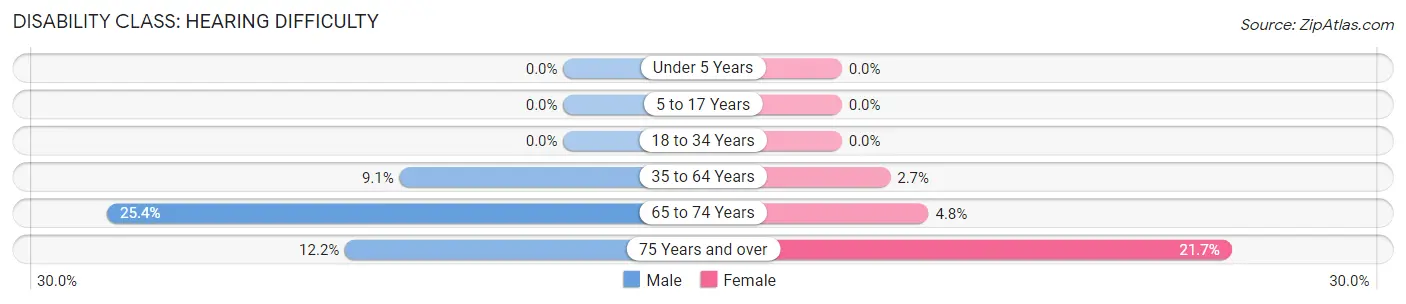
| Age Bracket | Male | Female |
| Under 5 Years | 0 (0.0%) | 0 (0.0%) |
| 5 to 17 Years | 0 (0.0%) | 0 (0.0%) |
| 18 to 34 Years | 0 (0.0%) | 0 (0.0%) |
| 35 to 64 Years | 30 (9.1%) | 8 (2.7%) |
| 65 to 74 Years | 32 (25.4%) | 7 (4.8%) |
| 75 Years and over | 13 (12.1%) | 23 (21.7%) |
Disability Class: Vision Difficulty
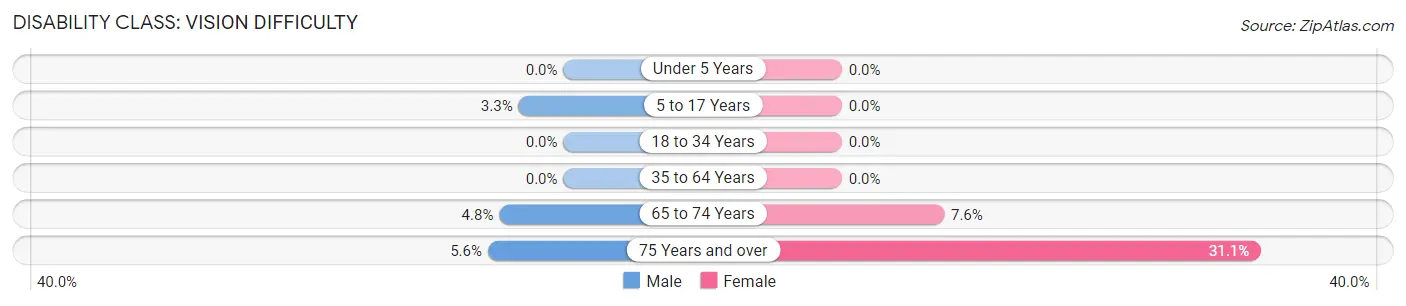
| Age Bracket | Male | Female |
| Under 5 Years | 0 (0.0%) | 0 (0.0%) |
| 5 to 17 Years | 3 (3.3%) | 0 (0.0%) |
| 18 to 34 Years | 0 (0.0%) | 0 (0.0%) |
| 35 to 64 Years | 0 (0.0%) | 0 (0.0%) |
| 65 to 74 Years | 6 (4.8%) | 11 (7.6%) |
| 75 Years and over | 6 (5.6%) | 33 (31.1%) |
Disability Class: Cognitive Difficulty
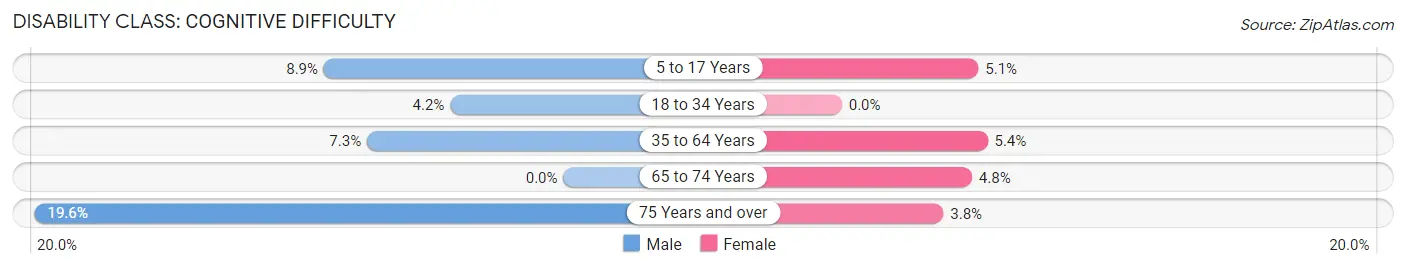
| Age Bracket | Male | Female |
| 5 to 17 Years | 8 (8.9%) | 7 (5.1%) |
| 18 to 34 Years | 11 (4.2%) | 0 (0.0%) |
| 35 to 64 Years | 24 (7.3%) | 16 (5.4%) |
| 65 to 74 Years | 0 (0.0%) | 7 (4.8%) |
| 75 Years and over | 21 (19.6%) | 4 (3.8%) |
Disability Class: Ambulatory Difficulty
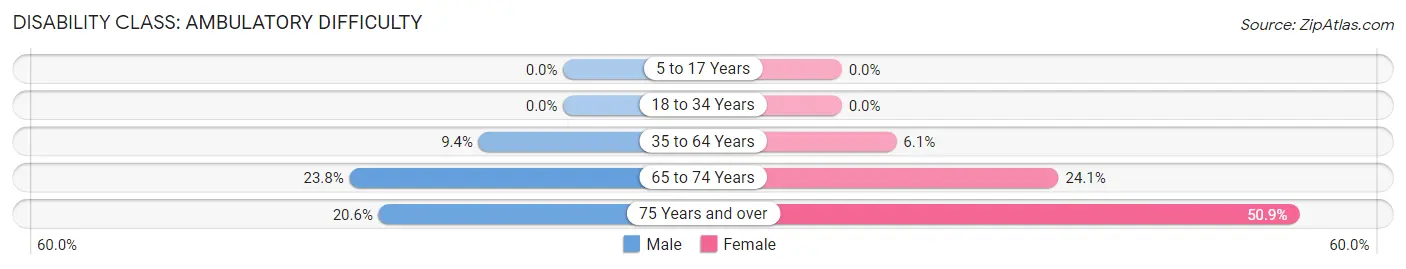
| Age Bracket | Male | Female |
| 5 to 17 Years | 0 (0.0%) | 0 (0.0%) |
| 18 to 34 Years | 0 (0.0%) | 0 (0.0%) |
| 35 to 64 Years | 31 (9.4%) | 18 (6.1%) |
| 65 to 74 Years | 30 (23.8%) | 35 (24.1%) |
| 75 Years and over | 22 (20.6%) | 54 (50.9%) |
Disability Class: Self-Care Difficulty
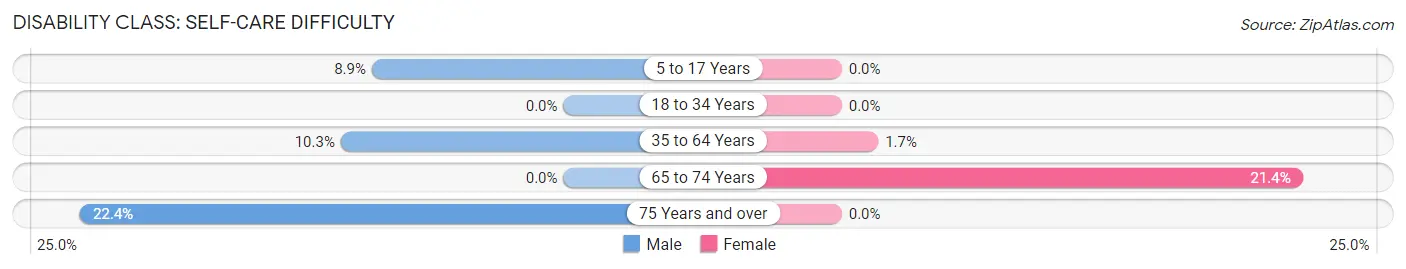
| Age Bracket | Male | Female |
| 5 to 17 Years | 8 (8.9%) | 0 (0.0%) |
| 18 to 34 Years | 0 (0.0%) | 0 (0.0%) |
| 35 to 64 Years | 34 (10.3%) | 5 (1.7%) |
| 65 to 74 Years | 0 (0.0%) | 31 (21.4%) |
| 75 Years and over | 24 (22.4%) | 0 (0.0%) |
Technology Access in L Anse
Computing Device Access in L Anse
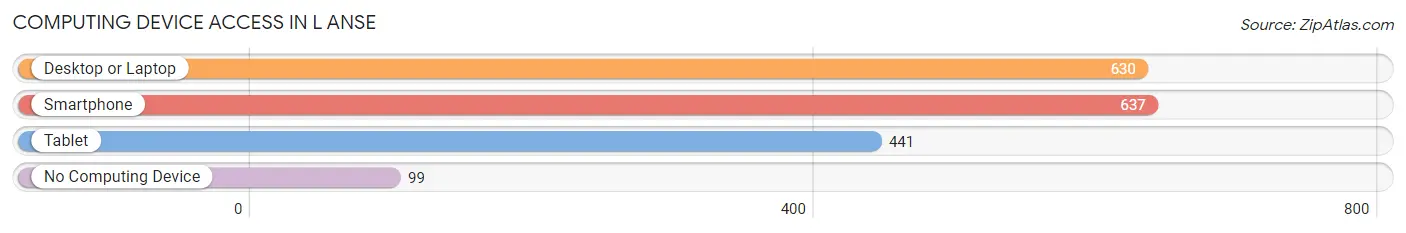
| Device Type | # Households | % Households |
| Desktop or Laptop | 630 | 71.4% |
| Smartphone | 637 | 72.2% |
| Tablet | 441 | 50.0% |
| No Computing Device | 99 | 11.2% |
| Total | 882 | 100.0% |
Internet Access in L Anse
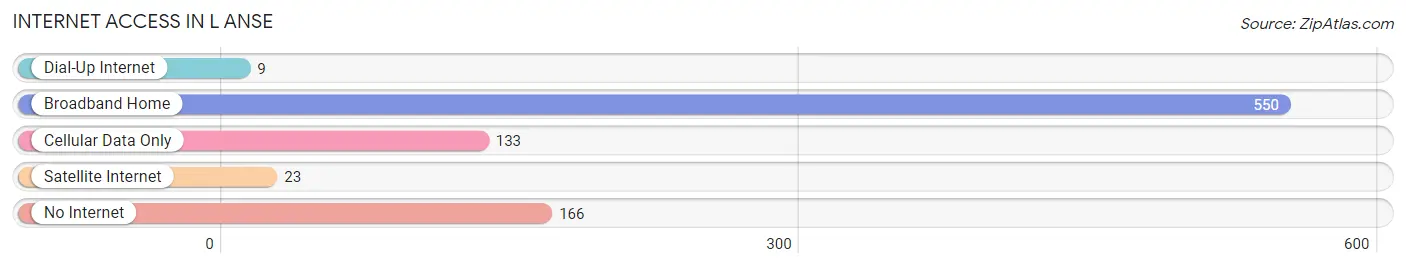
| Internet Type | # Households | % Households |
| Dial-Up Internet | 9 | 1.0% |
| Broadband Home | 550 | 62.4% |
| Cellular Data Only | 133 | 15.1% |
| Satellite Internet | 23 | 2.6% |
| No Internet | 166 | 18.8% |
| Total | 882 | 100.0% |
L Anse Summary
Anse is a small unincorporated community located in Baraga County, Michigan. It is situated on the shores of Lake Superior, approximately 20 miles east of Marquette. The community is home to a population of approximately 500 people, and is known for its picturesque views of the lake and its surrounding forests.
Geography
Anse is located in the Upper Peninsula of Michigan, in Baraga County. It is situated on the shores of Lake Superior, approximately 20 miles east of Marquette. The community is surrounded by forests and is home to a variety of wildlife, including deer, bear, and moose. The area is known for its picturesque views of the lake and its surrounding forests.
The climate in Anse is typical of the Upper Peninsula, with cold winters and warm summers. The average temperature in the summer is around 70 degrees Fahrenheit, while the average temperature in the winter is around 20 degrees Fahrenheit. The area receives an average of 40 inches of snowfall each year.
Economy
The economy of Anse is largely based on tourism. The area is known for its picturesque views of the lake and its surrounding forests, and is a popular destination for outdoor recreation. The community is also home to a variety of small businesses, including restaurants, shops, and lodging.
Demographics
As of the 2010 census, the population of Anse was 498. The racial makeup of the community was 97.2% White, 0.2% African American, 0.4% Native American, 0.2% Asian, 0.2% from other races, and 1.8% from two or more races. The median household income was $37,500, and the median family income was $41,250.
History
Anse was first settled in the late 1800s by Finnish immigrants. The community was originally known as “Anse’s Landing”, and was named after the Finnish word for “bay”. The area was primarily used for logging and fishing, and the community grew slowly over the years.
In the early 1900s, the area began to attract tourists, and the community began to grow. The first hotel was built in the area in 1910, and the first school was built in 1912. The community continued to grow throughout the 20th century, and today it is a popular destination for outdoor recreation.
Common Questions
What is the Total Population of L Anse?
Total Population of L Anse is 1,942.
What is the Total Male Population of L Anse?
Total Male Population of L Anse is 1,038.
What is the Total Female Population of L Anse?
Total Female Population of L Anse is 904.
What is the Ratio of Males per 100 Females in L Anse?
There are 114.82 Males per 100 Females in L Anse.
What is the Ratio of Females per 100 Males in L Anse?
There are 87.09 Females per 100 Males in L Anse.
What is the Median Population Age in L Anse?
Median Population Age in L Anse is 49.5 Years.
What is the Average Family Size in L Anse
Average Family Size in L Anse is 3.0 People.
What is the Average Household Size in L Anse
Average Household Size in L Anse is 2.0 People.
What is Per Capita Income in L Anse?
Per Capita income in L Anse is $33,789.
What is the Median Family Income in L Anse?
Median Family Income in L Anse is $66,406.
What is the Median Household income in L Anse?
Median Household Income in L Anse is $52,869.
What is Income or Wage Gap in L Anse?
Income or Wage Gap in L Anse is 46.5%.
Women in L Anse earn 53.5 cents for every dollar earned by a man.
What is Inequality or Gini Index in L Anse?
Inequality or Gini Index in L Anse is 0.46.
How Large is the Labor Force in L Anse?
There are 842 People in the Labor Forcein in L Anse.
What is the Percentage of People in the Labor Force in L Anse?
51.4% of People are in the Labor Force in L Anse.
What is the Unemployment Rate in L Anse?
Unemployment Rate in L Anse is 6.9%.