Cities with the Highest Poverty Level Among Single Fathers in Minnesota
RELATED REPORTS & OPTIONS
Highest Poverty | Single Father
Minnesota
Compare Cities
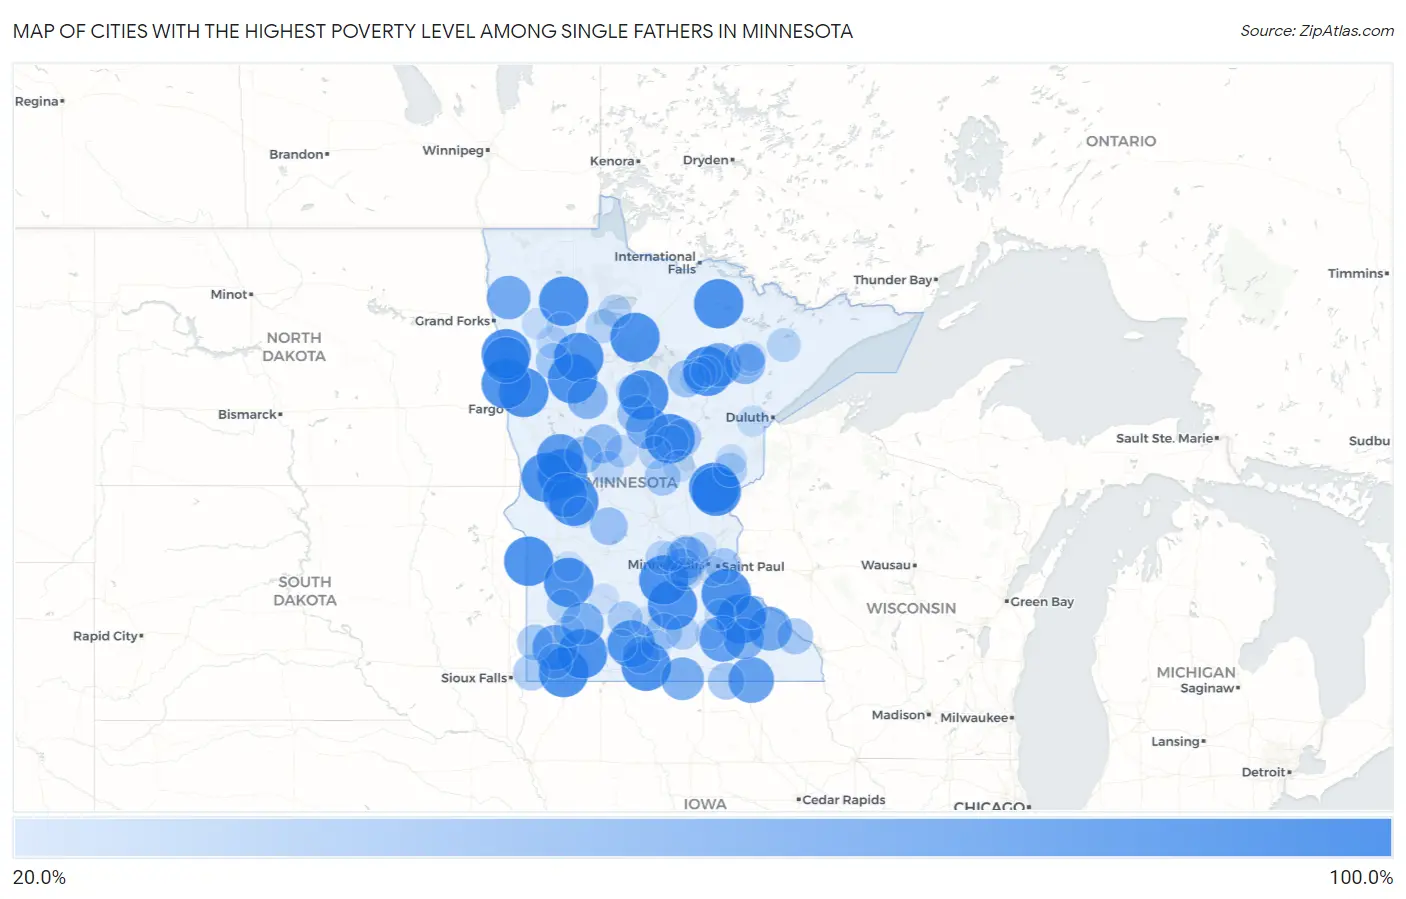
Map of Cities with the Highest Poverty Level Among Single Fathers in Minnesota
0.0%
100.0%
Cities with the Highest Poverty Level Among Single Fathers in Minnesota
| City | Single Father Poverty | vs State | vs National | |
| 1. | Le Sueur | 100.0% | 9.3%(+90.7)#1 | 13.7%(+86.3)#105 |
| 2. | Zumbrota | 100.0% | 9.3%(+90.7)#2 | 13.7%(+86.3)#119 |
| 3. | Blackduck | 100.0% | 9.3%(+90.7)#3 | 13.7%(+86.3)#629 |
| 4. | Ashby | 100.0% | 9.3%(+90.7)#4 | 13.7%(+86.3)#797 |
| 5. | Rushmore | 100.0% | 9.3%(+90.7)#5 | 13.7%(+86.3)#847 |
| 6. | Calumet | 100.0% | 9.3%(+90.7)#6 | 13.7%(+86.3)#924 |
| 7. | Cuyuna | 100.0% | 9.3%(+90.7)#7 | 13.7%(+86.3)#951 |
| 8. | Granada | 100.0% | 9.3%(+90.7)#8 | 13.7%(+86.3)#981 |
| 9. | Plato | 100.0% | 9.3%(+90.7)#9 | 13.7%(+86.3)#987 |
| 10. | Twin Lakes | 100.0% | 9.3%(+90.7)#10 | 13.7%(+86.3)#989 |
| 11. | Nett Lake | 100.0% | 9.3%(+90.7)#11 | 13.7%(+86.3)#1,005 |
| 12. | Wendell | 100.0% | 9.3%(+90.7)#12 | 13.7%(+86.3)#1,025 |
| 13. | Marietta | 100.0% | 9.3%(+90.7)#13 | 13.7%(+86.3)#1,027 |
| 14. | Felton | 100.0% | 9.3%(+90.7)#14 | 13.7%(+86.3)#1,071 |
| 15. | Perley | 100.0% | 9.3%(+90.7)#15 | 13.7%(+86.3)#1,103 |
| 16. | Ebro | 100.0% | 9.3%(+90.7)#16 | 13.7%(+86.3)#1,133 |
| 17. | Nielsville | 100.0% | 9.3%(+90.7)#17 | 13.7%(+86.3)#1,139 |
| 18. | Dundee | 100.0% | 9.3%(+90.7)#18 | 13.7%(+86.3)#1,143 |
| 19. | Goodridge | 100.0% | 9.3%(+90.7)#19 | 13.7%(+86.3)#1,145 |
| 20. | Hazel Run | 100.0% | 9.3%(+90.7)#20 | 13.7%(+86.3)#1,149 |
| 21. | Whipholt | 100.0% | 9.3%(+90.7)#21 | 13.7%(+86.3)#1,154 |
| 22. | New Trier | 100.0% | 9.3%(+90.7)#22 | 13.7%(+86.3)#1,157 |
| 23. | Quamba | 100.0% | 9.3%(+90.7)#23 | 13.7%(+86.3)#1,171 |
| 24. | Henriette | 100.0% | 9.3%(+90.7)#24 | 13.7%(+86.3)#1,184 |
| 25. | Farwell | 100.0% | 9.3%(+90.7)#25 | 13.7%(+86.3)#1,187 |
| 26. | Hubbard | 100.0% | 9.3%(+90.7)#26 | 13.7%(+86.3)#1,191 |
| 27. | St James | 91.4% | 9.3%(+82.1)#27 | 13.7%(+77.7)#1,224 |
| 28. | Underwood | 90.0% | 9.3%(+80.7)#28 | 13.7%(+76.3)#1,236 |
| 29. | Claremont | 87.5% | 9.3%(+78.2)#29 | 13.7%(+73.8)#1,260 |
| 30. | Shelly | 87.5% | 9.3%(+78.2)#30 | 13.7%(+73.8)#1,262 |
| 31. | Le Roy | 85.7% | 9.3%(+76.4)#31 | 13.7%(+72.0)#1,276 |
| 32. | Chandler | 83.3% | 9.3%(+74.0)#32 | 13.7%(+69.6)#1,322 |
| 33. | Hoffman | 81.8% | 9.3%(+72.5)#33 | 13.7%(+68.1)#1,344 |
| 34. | Plainview | 78.6% | 9.3%(+69.3)#34 | 13.7%(+64.9)#1,408 |
| 35. | Keewatin | 78.6% | 9.3%(+69.3)#35 | 13.7%(+64.9)#1,413 |
| 36. | Warren | 77.8% | 9.3%(+68.5)#36 | 13.7%(+64.1)#1,422 |
| 37. | Kiester | 75.0% | 9.3%(+65.7)#37 | 13.7%(+61.3)#1,475 |
| 38. | Jenkins | 75.0% | 9.3%(+65.7)#38 | 13.7%(+61.3)#1,479 |
| 39. | Walnut Grove | 73.9% | 9.3%(+64.6)#39 | 13.7%(+60.2)#1,501 |
| 40. | Loretto | 71.4% | 9.3%(+62.1)#40 | 13.7%(+57.7)#1,566 |
| 41. | Byron | 68.5% | 9.3%(+59.2)#41 | 13.7%(+54.8)#1,643 |
| 42. | Pine Point | 66.7% | 9.3%(+57.4)#42 | 13.7%(+53.0)#1,736 |
| 43. | Iron Junction | 66.7% | 9.3%(+57.4)#43 | 13.7%(+53.0)#1,750 |
| 44. | Wadena | 60.7% | 9.3%(+51.4)#44 | 13.7%(+47.0)#1,905 |
| 45. | Minnetrista | 58.8% | 9.3%(+49.5)#45 | 13.7%(+45.1)#1,989 |
| 46. | Backus | 56.0% | 9.3%(+46.7)#46 | 13.7%(+42.3)#2,108 |
| 47. | Belgrade | 55.6% | 9.3%(+46.3)#47 | 13.7%(+41.8)#2,129 |
| 48. | Truman | 55.0% | 9.3%(+45.7)#48 | 13.7%(+41.3)#2,145 |
| 49. | Aitkin | 54.5% | 9.3%(+45.3)#49 | 13.7%(+40.8)#2,161 |
| 50. | Henning | 54.5% | 9.3%(+45.3)#50 | 13.7%(+40.8)#2,173 |
| 51. | Cohasset | 53.6% | 9.3%(+44.3)#51 | 13.7%(+39.9)#2,210 |
| 52. | Lyle | 52.4% | 9.3%(+43.1)#52 | 13.7%(+38.7)#2,263 |
| 53. | Goodview | 50.0% | 9.3%(+40.7)#53 | 13.7%(+36.3)#2,342 |
| 54. | Landfall | 50.0% | 9.3%(+40.7)#54 | 13.7%(+36.3)#2,408 |
| 55. | Skyline | 50.0% | 9.3%(+40.7)#55 | 13.7%(+36.3)#2,478 |
| 56. | Beaver Creek | 50.0% | 9.3%(+40.7)#56 | 13.7%(+36.3)#2,481 |
| 57. | Lastrup | 50.0% | 9.3%(+40.7)#57 | 13.7%(+36.3)#2,504 |
| 58. | Bejou | 50.0% | 9.3%(+40.7)#58 | 13.7%(+36.3)#2,505 |
| 59. | Pipestone | 49.2% | 9.3%(+39.9)#59 | 13.7%(+35.5)#2,524 |
| 60. | Sleepy Eye | 45.9% | 9.3%(+36.7)#60 | 13.7%(+32.2)#2,649 |
| 61. | Lismore | 45.5% | 9.3%(+36.2)#61 | 13.7%(+31.7)#2,679 |
| 62. | Deerwood | 45.0% | 9.3%(+35.7)#62 | 13.7%(+31.3)#2,696 |
| 63. | Sandstone | 43.3% | 9.3%(+34.0)#63 | 13.7%(+29.6)#2,772 |
| 64. | Janesville | 43.2% | 9.3%(+34.0)#64 | 13.7%(+29.5)#2,779 |
| 65. | Credit River | 42.3% | 9.3%(+33.0)#65 | 13.7%(+28.6)#2,840 |
| 66. | Howard Lake | 41.9% | 9.3%(+32.6)#66 | 13.7%(+28.2)#2,863 |
| 67. | Little Rock | 41.9% | 9.3%(+32.6)#67 | 13.7%(+28.2)#2,864 |
| 68. | Babbitt | 41.4% | 9.3%(+32.1)#68 | 13.7%(+27.7)#2,892 |
| 69. | Marshall | 41.1% | 9.3%(+31.8)#69 | 13.7%(+27.4)#2,909 |
| 70. | Brainerd | 40.6% | 9.3%(+31.3)#70 | 13.7%(+26.9)#2,927 |
| 71. | Walker | 40.0% | 9.3%(+30.7)#71 | 13.7%(+26.3)#2,974 |
| 72. | Eagle Bend | 40.0% | 9.3%(+30.7)#72 | 13.7%(+26.3)#2,985 |
| 73. | Bellechester | 40.0% | 9.3%(+30.7)#73 | 13.7%(+26.3)#3,007 |
| 74. | Ponemah | 39.4% | 9.3%(+30.1)#74 | 13.7%(+25.7)#3,032 |
| 75. | Bovey | 38.9% | 9.3%(+29.6)#75 | 13.7%(+25.2)#3,068 |
| 76. | Staples | 38.2% | 9.3%(+28.9)#76 | 13.7%(+24.4)#3,102 |
| 77. | Victoria | 37.8% | 9.3%(+28.5)#77 | 13.7%(+24.1)#3,124 |
| 78. | Erskine | 36.4% | 9.3%(+27.1)#78 | 13.7%(+22.7)#3,235 |
| 79. | Eveleth | 36.2% | 9.3%(+26.9)#79 | 13.7%(+22.5)#3,245 |
| 80. | Vineland | 34.8% | 9.3%(+25.5)#80 | 13.7%(+21.1)#3,352 |
| 81. | Starbuck | 34.2% | 9.3%(+24.9)#81 | 13.7%(+20.5)#3,391 |
| 82. | Red Lake Falls | 33.3% | 9.3%(+24.0)#82 | 13.7%(+19.6)#3,462 |
| 83. | The Lakes | 33.3% | 9.3%(+24.0)#83 | 13.7%(+19.6)#3,497 |
| 84. | La Prairie | 33.3% | 9.3%(+24.0)#84 | 13.7%(+19.6)#3,502 |
| 85. | Marble | 33.3% | 9.3%(+24.0)#85 | 13.7%(+19.6)#3,504 |
| 86. | Butterfield | 33.3% | 9.3%(+24.0)#86 | 13.7%(+19.6)#3,514 |
| 87. | Rutledge | 33.3% | 9.3%(+24.0)#87 | 13.7%(+19.6)#3,551 |
| 88. | Nerstrand | 33.3% | 9.3%(+24.0)#88 | 13.7%(+19.6)#3,558 |
| 89. | Cloquet | 32.8% | 9.3%(+23.5)#89 | 13.7%(+19.1)#3,578 |
| 90. | Owatonna | 31.1% | 9.3%(+21.8)#90 | 13.7%(+17.3)#3,697 |
| 91. | Hanover | 31.0% | 9.3%(+21.7)#91 | 13.7%(+17.3)#3,702 |
| 92. | Virginia | 30.6% | 9.3%(+21.3)#92 | 13.7%(+16.9)#3,739 |
| 93. | Redwood Falls | 30.0% | 9.3%(+20.7)#93 | 13.7%(+16.3)#3,791 |
| 94. | Oklee | 30.0% | 9.3%(+20.7)#94 | 13.7%(+16.3)#3,810 |
| 95. | Champlin | 29.9% | 9.3%(+20.6)#95 | 13.7%(+16.1)#3,819 |
| 96. | Montevideo | 29.3% | 9.3%(+20.0)#96 | 13.7%(+15.6)#3,864 |
| 97. | Montrose | 29.2% | 9.3%(+19.9)#97 | 13.7%(+15.5)#3,871 |
| 98. | Mendota Heights | 29.0% | 9.3%(+19.7)#98 | 13.7%(+15.3)#3,884 |
| 99. | Courtland | 28.6% | 9.3%(+19.3)#99 | 13.7%(+14.9)#3,918 |
| 100. | Vernon Center | 28.6% | 9.3%(+19.3)#100 | 13.7%(+14.9)#3,932 |
Common Questions
What are the Top 10 Cities with the Highest Poverty Level Among Single Fathers in Minnesota?
Top 10 Cities with the Highest Poverty Level Among Single Fathers in Minnesota are:
What city has the Highest Poverty Level Among Single Fathers in Minnesota?
Le Sueur has the Highest Poverty Level Among Single Fathers in Minnesota with 100.0%.
What is the Poverty Level Among Single Fathers in the State of Minnesota?
Poverty Level Among Single Fathers in Minnesota is 9.3%.
What is the Poverty Level Among Single Fathers in the United States?
Poverty Level Among Single Fathers in the United States is 13.7%.