Worcester County, MA
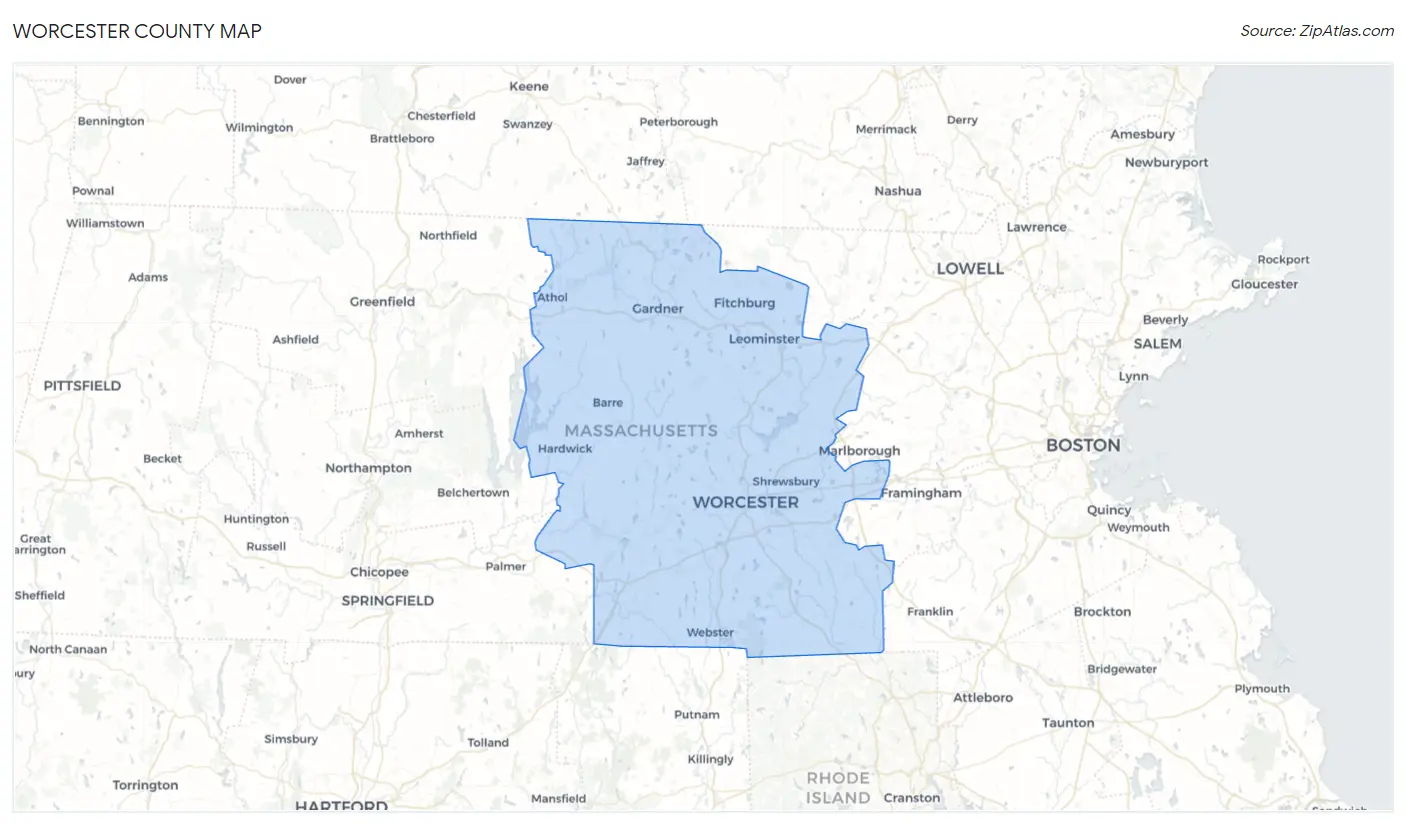
Worcester County Map
Worcester County Overview
858,898
TOTAL POPULATION
426,680
MALE POPULATION
432,218
FEMALE POPULATION
98.72
MALES / 100 FEMALES
101.30
FEMALES / 100 MALES
40.2
MEDIAN AGE
3.1
AVG FAMILY SIZE
2.5
AVG HOUSEHOLD SIZE
$45,433
PER CAPITA INCOME
$112,544
AVG FAMILY INCOME
$88,524
AVG HOUSEHOLD INCOME
29.2%
WAGE / INCOME GAP [ % ]
70.8¢/ $1
WAGE / INCOME GAP [ $ ]
$10,289
FAMILY INCOME DEFICIT
0.46
INEQUALITY / GINI INDEX
468,093
LABOR FORCE [ PEOPLE ]
66.6%
PERCENT IN LABOR FORCE
5.6%
UNEMPLOYMENT RATE
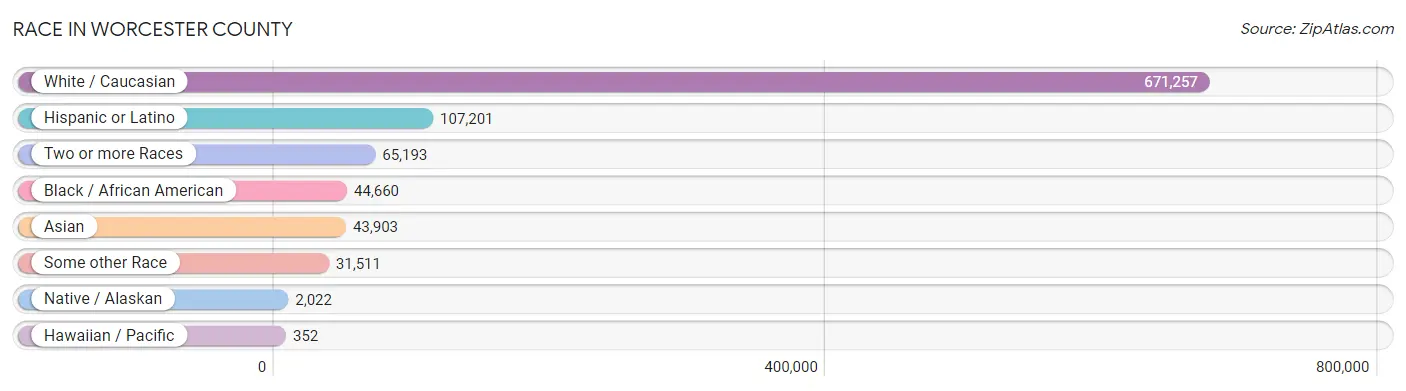
Race in Worcester County
The most populous races in Worcester County are White / Caucasian (671,257 | 78.1%), Hispanic or Latino (107,201 | 12.5%), and Two or more Races (65,193 | 7.6%).
| Race | # Population | % Population |
| Asian | 43,903 | 5.1% |
| Black / African American | 44,660 | 5.2% |
| Hawaiian / Pacific | 352 | 0.0% |
| Hispanic or Latino | 107,201 | 12.5% |
| Native / Alaskan | 2,022 | 0.2% |
| White / Caucasian | 671,257 | 78.1% |
| Two or more Races | 65,193 | 7.6% |
| Some other Race | 31,511 | 3.7% |
| Total | 858,898 | 100.0% |
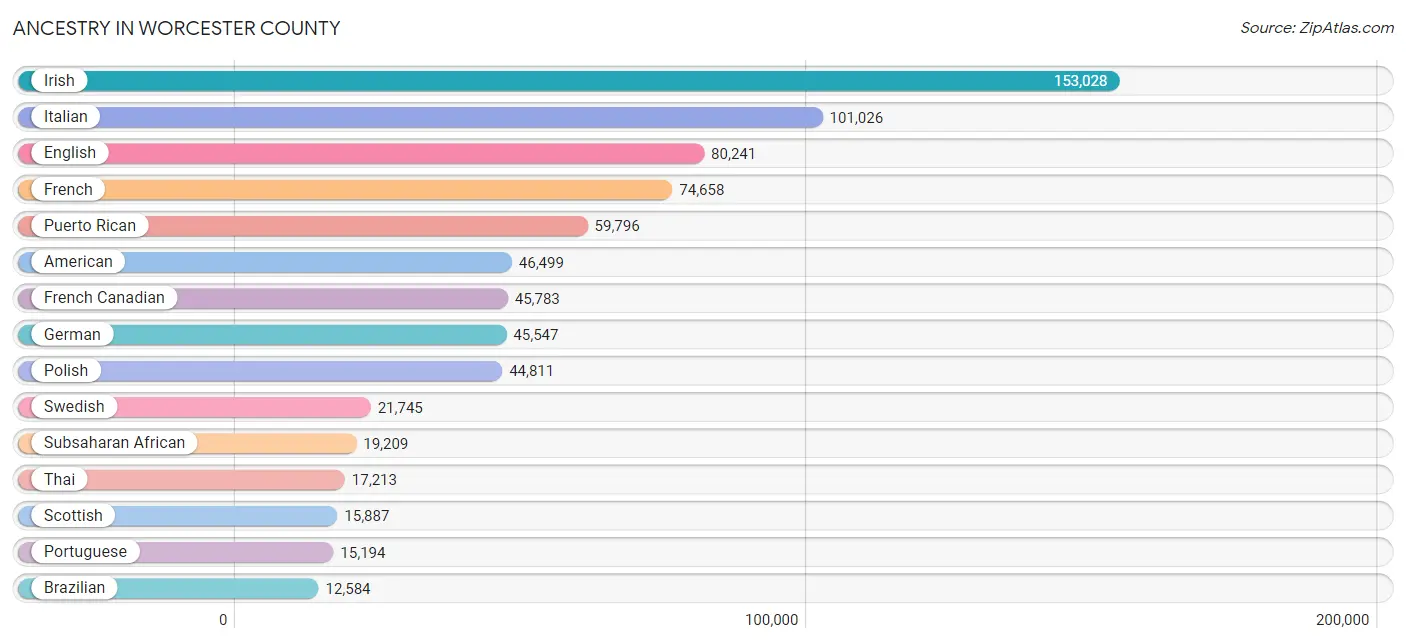
Ancestry in Worcester County
The most populous ancestries reported in Worcester County are Irish (153,028 | 17.8%), Italian (101,026 | 11.8%), English (80,241 | 9.3%), French (74,658 | 8.7%), and Puerto Rican (59,796 | 7.0%), together accounting for 54.6% of all Worcester County residents.
| Ancestry | # Population | % Population |
| Afghan | 79 | 0.0% |
| African | 6,109 | 0.7% |
| Alaska Native | 34 | 0.0% |
| Albanian | 5,363 | 0.6% |
| Aleut | 12 | 0.0% |
| American | 46,499 | 5.4% |
| Apache | 45 | 0.0% |
| Arab | 9,484 | 1.1% |
| Argentinean | 790 | 0.1% |
| Armenian | 4,235 | 0.5% |
| Assyrian / Chaldean / Syriac | 190 | 0.0% |
| Australian | 387 | 0.1% |
| Austrian | 1,524 | 0.2% |
| Bangladeshi | 881 | 0.1% |
| Barbadian | 148 | 0.0% |
| Basque | 250 | 0.0% |
| Belgian | 523 | 0.1% |
| Bermudan | 89 | 0.0% |
| Bhutanese | 2,512 | 0.3% |
| Blackfeet | 441 | 0.1% |
| Bolivian | 262 | 0.0% |
| Brazilian | 12,584 | 1.5% |
| British | 3,498 | 0.4% |
| British West Indian | 194 | 0.0% |
| Bulgarian | 206 | 0.0% |
| Burmese | 3,037 | 0.4% |
| Cajun | 122 | 0.0% |
| Cambodian | 68 | 0.0% |
| Canadian | 5,804 | 0.7% |
| Cape Verdean | 1,051 | 0.1% |
| Celtic | 434 | 0.1% |
| Central American | 10,785 | 1.3% |
| Central American Indian | 1,148 | 0.1% |
| Cherokee | 403 | 0.1% |
| Chickasaw | 2 | 0.0% |
| Chilean | 236 | 0.0% |
| Chippewa | 13 | 0.0% |
| Choctaw | 29 | 0.0% |
| Colombian | 2,951 | 0.3% |
| Costa Rican | 152 | 0.0% |
| Cree | 9 | 0.0% |
| Creek | 45 | 0.0% |
| Croatian | 157 | 0.0% |
| Cuban | 1,723 | 0.2% |
| Cypriot | 48 | 0.0% |
| Czech | 1,779 | 0.2% |
| Czechoslovakian | 579 | 0.1% |
| Danish | 1,467 | 0.2% |
| Dominican | 11,608 | 1.3% |
| Dutch | 4,845 | 0.6% |
| Dutch West Indian | 1 | 0.0% |
| Eastern European | 2,744 | 0.3% |
| Ecuadorian | 4,007 | 0.5% |
| Egyptian | 1,217 | 0.1% |
| English | 80,241 | 9.3% |
| Estonian | 221 | 0.0% |
| Ethiopian | 191 | 0.0% |
| European | 9,250 | 1.1% |
| Fijian | 7 | 0.0% |
| Filipino | 452 | 0.1% |
| Finnish | 6,987 | 0.8% |
| French | 74,658 | 8.7% |
| French American Indian | 173 | 0.0% |
| French Canadian | 45,783 | 5.3% |
| German | 45,547 | 5.3% |
| Ghanaian | 6,373 | 0.7% |
| Greek | 7,312 | 0.9% |
| Guamanian / Chamorro | 41 | 0.0% |
| Guatemalan | 2,381 | 0.3% |
| Guyanese | 219 | 0.0% |
| Haitian | 4,117 | 0.5% |
| Honduran | 832 | 0.1% |
| Hungarian | 2,058 | 0.2% |
| Icelander | 45 | 0.0% |
| Indian (Asian) | 10,353 | 1.2% |
| Indonesian | 18 | 0.0% |
| Inupiat | 12 | 0.0% |
| Iranian | 879 | 0.1% |
| Iraqi | 1,125 | 0.1% |
| Irish | 153,028 | 17.8% |
| Iroquois | 102 | 0.0% |
| Israeli | 157 | 0.0% |
| Italian | 101,026 | 11.8% |
| Jamaican | 2,963 | 0.3% |
| Japanese | 1,230 | 0.1% |
| Jordanian | 265 | 0.0% |
| Kenyan | 1,332 | 0.2% |
| Korean | 2,737 | 0.3% |
| Laotian | 227 | 0.0% |
| Latvian | 374 | 0.0% |
| Lebanese | 3,799 | 0.4% |
| Liberian | 624 | 0.1% |
| Lithuanian | 8,574 | 1.0% |
| Luxembourger | 61 | 0.0% |
| Macedonian | 29 | 0.0% |
| Malaysian | 1,651 | 0.2% |
| Maltese | 93 | 0.0% |
| Mexican | 6,404 | 0.7% |
| Mexican American Indian | 157 | 0.0% |
| Mongolian | 28 | 0.0% |
| Moroccan | 519 | 0.1% |
| Native Hawaiian | 496 | 0.1% |
| Navajo | 142 | 0.0% |
| New Zealander | 45 | 0.0% |
| Nicaraguan | 173 | 0.0% |
| Nigerian | 1,414 | 0.2% |
| Northern European | 833 | 0.1% |
| Norwegian | 3,481 | 0.4% |
| Paiute | 8 | 0.0% |
| Pakistani | 663 | 0.1% |
| Palestinian | 256 | 0.0% |
| Panamanian | 663 | 0.1% |
| Paraguayan | 15 | 0.0% |
| Pennsylvania German | 53 | 0.0% |
| Peruvian | 791 | 0.1% |
| Polish | 44,811 | 5.2% |
| Portuguese | 15,194 | 1.8% |
| Potawatomi | 14 | 0.0% |
| Pueblo | 8 | 0.0% |
| Puerto Rican | 59,796 | 7.0% |
| Romanian | 465 | 0.1% |
| Russian | 7,055 | 0.8% |
| Salvadoran | 6,553 | 0.8% |
| Samoan | 122 | 0.0% |
| Scandinavian | 1,866 | 0.2% |
| Scotch-Irish | 4,701 | 0.5% |
| Scottish | 15,887 | 1.8% |
| Seminole | 22 | 0.0% |
| Senegalese | 8 | 0.0% |
| Serbian | 212 | 0.0% |
| Shoshone | 16 | 0.0% |
| Sioux | 69 | 0.0% |
| Slavic | 304 | 0.0% |
| Slovak | 973 | 0.1% |
| Slovene | 248 | 0.0% |
| Somali | 139 | 0.0% |
| South African | 205 | 0.0% |
| South American | 11,530 | 1.3% |
| South American Indian | 201 | 0.0% |
| Spaniard | 947 | 0.1% |
| Spanish | 1,372 | 0.2% |
| Sri Lankan | 9,028 | 1.1% |
| Subsaharan African | 19,209 | 2.2% |
| Sudanese | 14 | 0.0% |
| Swedish | 21,745 | 2.5% |
| Swiss | 1,224 | 0.1% |
| Syrian | 1,240 | 0.1% |
| Thai | 17,213 | 2.0% |
| Trinidadian and Tobagonian | 332 | 0.0% |
| Turkish | 323 | 0.0% |
| U.S. Virgin Islander | 43 | 0.0% |
| Ugandan | 557 | 0.1% |
| Ukrainian | 2,186 | 0.3% |
| Uruguayan | 1,217 | 0.1% |
| Venezuelan | 862 | 0.1% |
| Vietnamese | 164 | 0.0% |
| Welsh | 2,547 | 0.3% |
| West Indian | 898 | 0.1% |
| Yugoslavian | 253 | 0.0% |
| Yup'ik | 11 | 0.0% |
| Zimbabwean | 26 | 0.0% | View All 161 Rows |
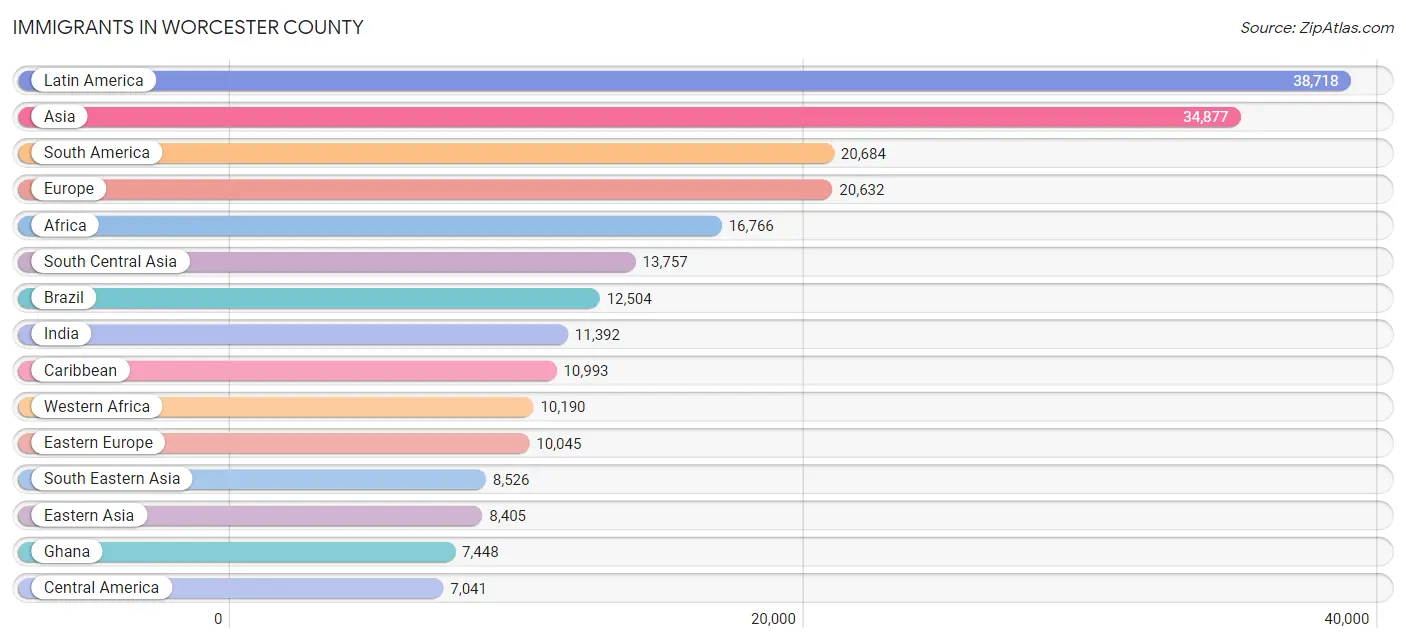
Immigrants in Worcester County
The most numerous immigrant groups reported in Worcester County came from Latin America (38,718 | 4.5%), Asia (34,877 | 4.1%), South America (20,684 | 2.4%), Europe (20,632 | 2.4%), and Africa (16,766 | 1.9%), together accounting for 15.3% of all Worcester County residents.
| Immigration Origin | # Population | % Population |
| Africa | 16,766 | 1.9% |
| Albania | 3,444 | 0.4% |
| Argentina | 605 | 0.1% |
| Armenia | 114 | 0.0% |
| Asia | 34,877 | 4.1% |
| Australia | 229 | 0.0% |
| Austria | 113 | 0.0% |
| Azores | 152 | 0.0% |
| Bangladesh | 423 | 0.1% |
| Barbados | 94 | 0.0% |
| Belarus | 354 | 0.0% |
| Belgium | 197 | 0.0% |
| Bolivia | 177 | 0.0% |
| Bosnia and Herzegovina | 138 | 0.0% |
| Brazil | 12,504 | 1.5% |
| Bulgaria | 106 | 0.0% |
| Cabo Verde | 295 | 0.0% |
| Cambodia | 640 | 0.1% |
| Cameroon | 499 | 0.1% |
| Canada | 3,839 | 0.4% |
| Caribbean | 10,993 | 1.3% |
| Central America | 7,041 | 0.8% |
| Chile | 162 | 0.0% |
| China | 6,024 | 0.7% |
| Colombia | 1,779 | 0.2% |
| Congo | 13 | 0.0% |
| Costa Rica | 78 | 0.0% |
| Croatia | 9 | 0.0% |
| Cuba | 466 | 0.1% |
| Czechoslovakia | 99 | 0.0% |
| Denmark | 69 | 0.0% |
| Dominica | 69 | 0.0% |
| Dominican Republic | 6,583 | 0.8% |
| Eastern Africa | 3,139 | 0.4% |
| Eastern Asia | 8,405 | 1.0% |
| Eastern Europe | 10,045 | 1.2% |
| Ecuador | 2,360 | 0.3% |
| Egypt | 1,076 | 0.1% |
| El Salvador | 3,452 | 0.4% |
| England | 1,172 | 0.1% |
| Eritrea | 43 | 0.0% |
| Ethiopia | 90 | 0.0% |
| Europe | 20,632 | 2.4% |
| France | 460 | 0.1% |
| Germany | 1,256 | 0.2% |
| Ghana | 7,448 | 0.9% |
| Greece | 1,183 | 0.1% |
| Grenada | 35 | 0.0% |
| Guatemala | 1,264 | 0.2% |
| Guyana | 241 | 0.0% |
| Haiti | 2,165 | 0.3% |
| Honduras | 425 | 0.1% |
| Hong Kong | 291 | 0.0% |
| Hungary | 255 | 0.0% |
| India | 11,392 | 1.3% |
| Indonesia | 95 | 0.0% |
| Iran | 399 | 0.1% |
| Iraq | 1,419 | 0.2% |
| Ireland | 1,087 | 0.1% |
| Israel | 152 | 0.0% |
| Italy | 1,279 | 0.2% |
| Jamaica | 1,308 | 0.2% |
| Japan | 736 | 0.1% |
| Jordan | 211 | 0.0% |
| Kazakhstan | 61 | 0.0% |
| Kenya | 1,964 | 0.2% |
| Korea | 1,629 | 0.2% |
| Kuwait | 33 | 0.0% |
| Laos | 969 | 0.1% |
| Latin America | 38,718 | 4.5% |
| Latvia | 98 | 0.0% |
| Lebanon | 848 | 0.1% |
| Liberia | 938 | 0.1% |
| Lithuania | 233 | 0.0% |
| Malaysia | 22 | 0.0% |
| Mexico | 1,536 | 0.2% |
| Middle Africa | 851 | 0.1% |
| Moldova | 8 | 0.0% |
| Morocco | 442 | 0.1% |
| Nepal | 360 | 0.0% |
| Netherlands | 165 | 0.0% |
| Nicaragua | 97 | 0.0% |
| Nigeria | 1,051 | 0.1% |
| North Macedonia | 39 | 0.0% |
| Northern Africa | 1,526 | 0.2% |
| Northern Europe | 3,856 | 0.4% |
| Norway | 29 | 0.0% |
| Oceania | 285 | 0.0% |
| Pakistan | 964 | 0.1% |
| Panama | 72 | 0.0% |
| Peru | 631 | 0.1% |
| Philippines | 866 | 0.1% |
| Poland | 2,844 | 0.3% |
| Portugal | 1,601 | 0.2% |
| Romania | 166 | 0.0% |
| Russia | 1,243 | 0.1% |
| Saudi Arabia | 116 | 0.0% |
| Scotland | 250 | 0.0% |
| Senegal | 45 | 0.0% |
| Serbia | 105 | 0.0% |
| Sierra Leone | 97 | 0.0% |
| Singapore | 110 | 0.0% |
| Somalia | 180 | 0.0% |
| South Africa | 209 | 0.0% |
| South America | 20,684 | 2.4% |
| South Central Asia | 13,757 | 1.6% |
| South Eastern Asia | 8,526 | 1.0% |
| Southern Europe | 4,388 | 0.5% |
| Spain | 308 | 0.0% |
| Sri Lanka | 57 | 0.0% |
| Sudan | 8 | 0.0% |
| Sweden | 127 | 0.0% |
| Switzerland | 152 | 0.0% |
| Syria | 648 | 0.1% |
| Taiwan | 388 | 0.1% |
| Thailand | 343 | 0.0% |
| Trinidad and Tobago | 203 | 0.0% |
| Turkey | 269 | 0.0% |
| Uganda | 425 | 0.1% |
| Ukraine | 711 | 0.1% |
| Uruguay | 1,615 | 0.2% |
| Uzbekistan | 2 | 0.0% |
| Venezuela | 586 | 0.1% |
| Vietnam | 5,475 | 0.6% |
| Western Africa | 10,190 | 1.2% |
| Western Asia | 4,054 | 0.5% |
| Western Europe | 2,343 | 0.3% |
| Zaire | 305 | 0.0% |
| Zimbabwe | 44 | 0.0% | View All 129 Rows |
Sex and Age in Worcester County
Sex and Age in Worcester County
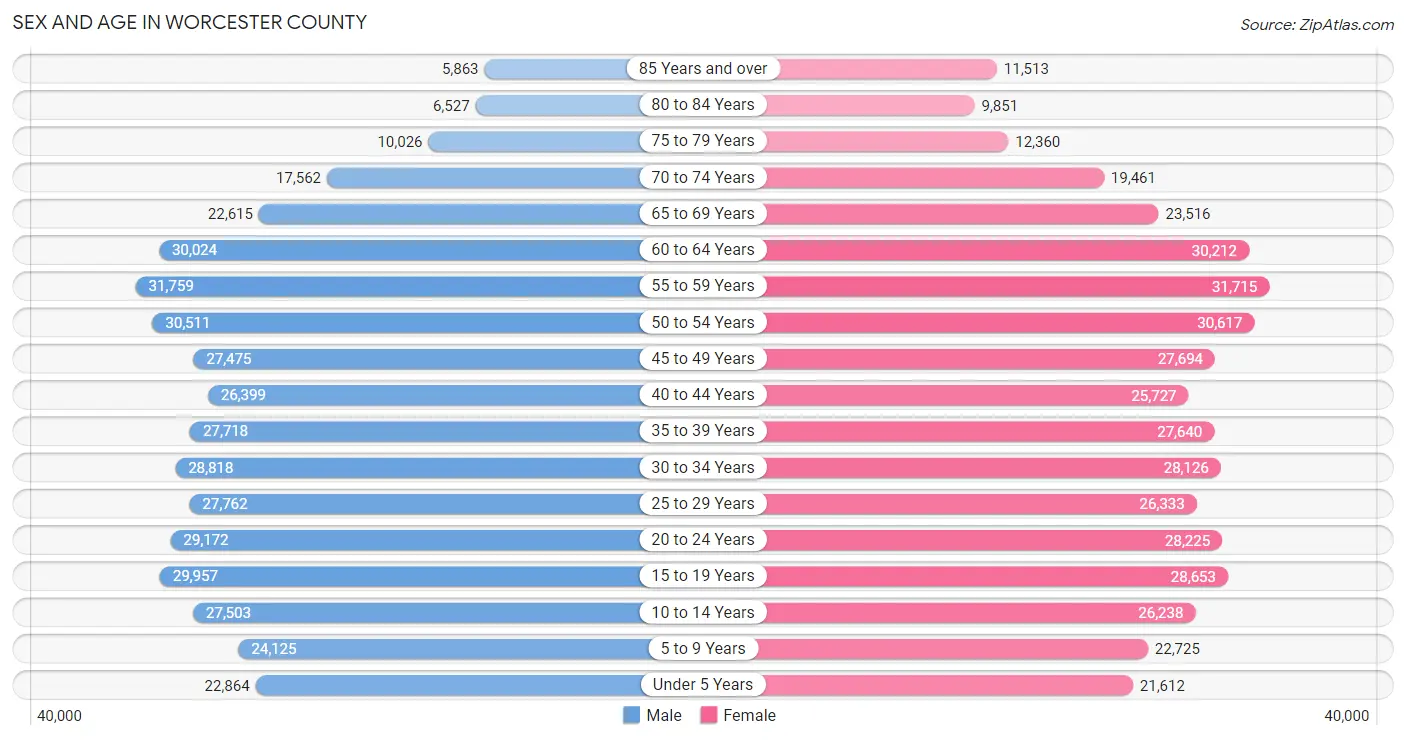
The most populous age groups in Worcester County are 55 to 59 Years (31,759 | 7.4%) for men and 55 to 59 Years (31,715 | 7.3%) for women.
| Age Bracket | Male | Female |
| Under 5 Years | 22,864 (5.4%) | 21,612 (5.0%) |
| 5 to 9 Years | 24,125 (5.7%) | 22,725 (5.3%) |
| 10 to 14 Years | 27,503 (6.5%) | 26,238 (6.1%) |
| 15 to 19 Years | 29,957 (7.0%) | 28,653 (6.6%) |
| 20 to 24 Years | 29,172 (6.8%) | 28,225 (6.5%) |
| 25 to 29 Years | 27,762 (6.5%) | 26,333 (6.1%) |
| 30 to 34 Years | 28,818 (6.8%) | 28,126 (6.5%) |
| 35 to 39 Years | 27,718 (6.5%) | 27,640 (6.4%) |
| 40 to 44 Years | 26,399 (6.2%) | 25,727 (5.9%) |
| 45 to 49 Years | 27,475 (6.4%) | 27,694 (6.4%) |
| 50 to 54 Years | 30,511 (7.1%) | 30,617 (7.1%) |
| 55 to 59 Years | 31,759 (7.4%) | 31,715 (7.3%) |
| 60 to 64 Years | 30,024 (7.0%) | 30,212 (7.0%) |
| 65 to 69 Years | 22,615 (5.3%) | 23,516 (5.4%) |
| 70 to 74 Years | 17,562 (4.1%) | 19,461 (4.5%) |
| 75 to 79 Years | 10,026 (2.4%) | 12,360 (2.9%) |
| 80 to 84 Years | 6,527 (1.5%) | 9,851 (2.3%) |
| 85 Years and over | 5,863 (1.4%) | 11,513 (2.7%) |
| Total | 426,680 (100.0%) | 432,218 (100.0%) |
Families and Households in Worcester County
Median Family Size in Worcester County
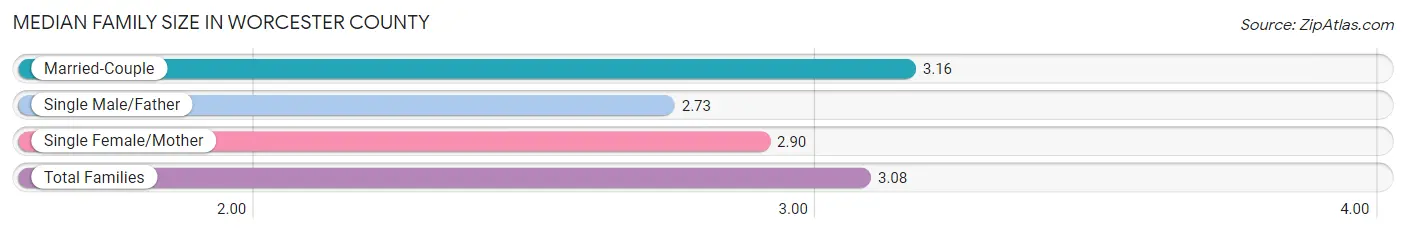
The median family size in Worcester County is 3.08 persons per family, with married-couple families (159,457 | 73.6%) accounting for the largest median family size of 3.16 persons per family. On the other hand, single male/father families (17,062 | 7.9%) represent the smallest median family size with 2.73 persons per family.
| Family Type | # Families | Family Size |
| Married-Couple | 159,457 (73.6%) | 3.16 |
| Single Male/Father | 17,062 (7.9%) | 2.73 |
| Single Female/Mother | 40,080 (18.5%) | 2.90 |
| Total Families | 216,599 (100.0%) | 3.08 |
Median Household Size in Worcester County
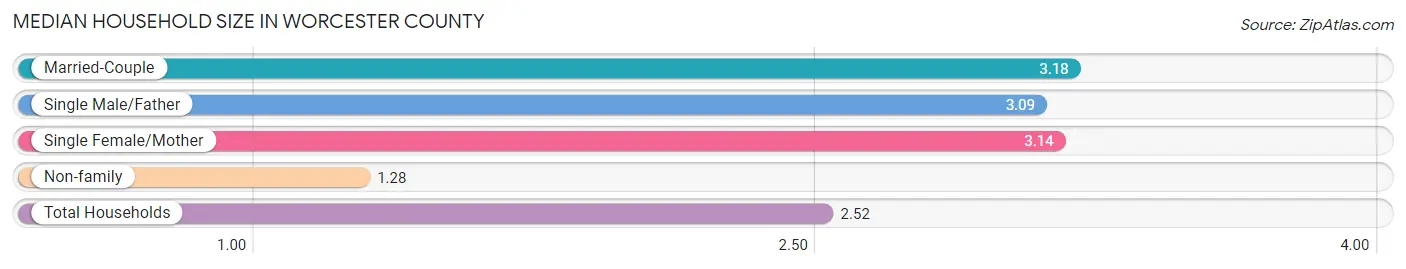
The median household size in Worcester County is 2.52 persons per household, with married-couple households (159,457 | 48.3%) accounting for the largest median household size of 3.18 persons per household. non-family households (113,720 | 34.4%) represent the smallest median household size with 1.28 persons per household.
| Household Type | # Households | Household Size |
| Married-Couple | 159,457 (48.3%) | 3.18 |
| Single Male/Father | 17,062 (5.2%) | 3.09 |
| Single Female/Mother | 40,080 (12.1%) | 3.14 |
| Non-family | 113,720 (34.4%) | 1.28 |
| Total Households | 330,319 (100.0%) | 2.52 |
Household Size by Marriage Status in Worcester County
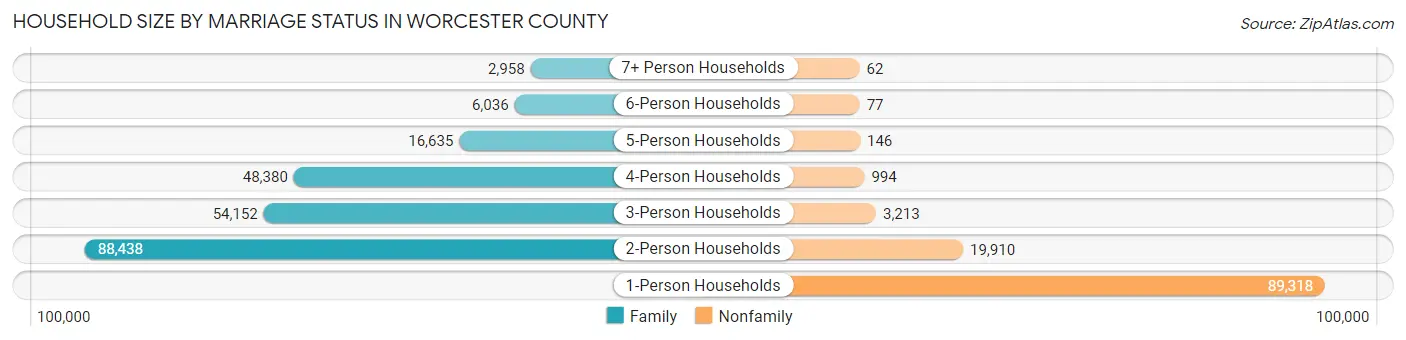
Out of a total of 330,319 households in Worcester County, 216,599 (65.6%) are family households, while 113,720 (34.4%) are nonfamily households. The most numerous type of family households are 2-person households, comprising 88,438, and the most common type of nonfamily households are 1-person households, comprising 89,318.
| Household Size | Family Households | Nonfamily Households |
| 1-Person Households | - | 89,318 (27.0%) |
| 2-Person Households | 88,438 (26.8%) | 19,910 (6.0%) |
| 3-Person Households | 54,152 (16.4%) | 3,213 (1.0%) |
| 4-Person Households | 48,380 (14.6%) | 994 (0.3%) |
| 5-Person Households | 16,635 (5.0%) | 146 (0.0%) |
| 6-Person Households | 6,036 (1.8%) | 77 (0.0%) |
| 7+ Person Households | 2,958 (0.9%) | 62 (0.0%) |
| Total | 216,599 (65.6%) | 113,720 (34.4%) |
Female Fertility in Worcester County
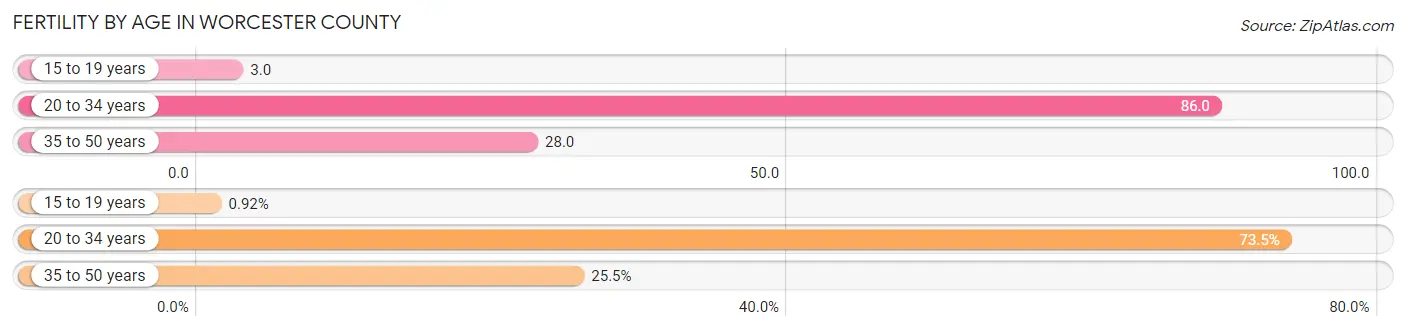
Fertility by Age in Worcester County
Average fertility rate in Worcester County is 49.0 births per 1,000 women. Women in the age bracket of 20 to 34 years have the highest fertility rate with 86.0 births per 1,000 women. Women in the age bracket of 20 to 34 years acount for 73.5% of all women with births.
| Age Bracket | Women with Births | Births / 1,000 Women |
| 15 to 19 years | 89 (0.9%) | 3.0 |
| 20 to 34 years | 7,093 (73.5%) | 86.0 |
| 35 to 50 years | 2,463 (25.5%) | 28.0 |
| Total | 9,645 (100.0%) | 49.0 |
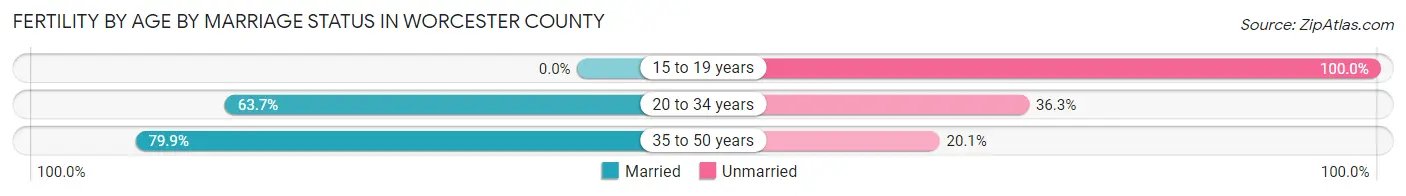
Fertility by Age by Marriage Status in Worcester County
67.3% of women with births (9,645) in Worcester County are married. The highest percentage of unmarried women with births falls into 15 to 19 years age bracket with 100.0% of them unmarried at the time of birth, while the lowest percentage of unmarried women with births belong to 35 to 50 years age bracket with 20.1% of them unmarried.
| Age Bracket | Married | Unmarried |
| 15 to 19 years | 0 (0.0%) | 89 (100.0%) |
| 20 to 34 years | 4,518 (63.7%) | 2,575 (36.3%) |
| 35 to 50 years | 1,968 (79.9%) | 495 (20.1%) |
| Total | 6,491 (67.3%) | 3,154 (32.7%) |
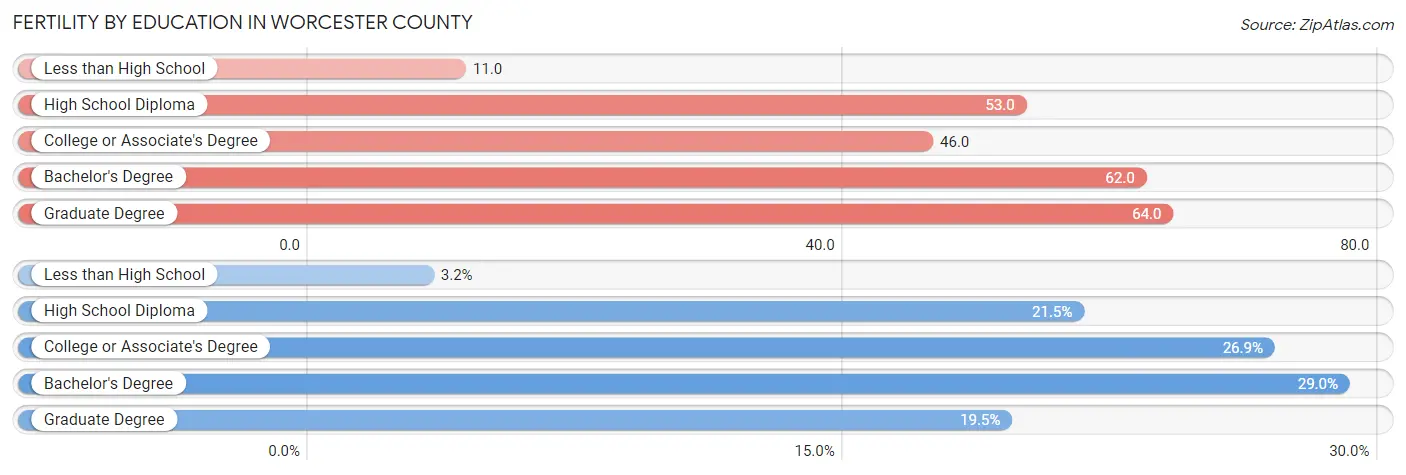
Fertility by Education in Worcester County
Average fertility rate in Worcester County is 49.0 births per 1,000 women. Women with the education attainment of graduate degree have the highest fertility rate of 64.0 births per 1,000 women, while women with the education attainment of less than high school have the lowest fertility at 11.0 births per 1,000 women. Women with the education attainment of bachelor's degree represent 29.0% of all women with births.
| Educational Attainment | Women with Births | Births / 1,000 Women |
| Less than High School | 311 (3.2%) | 11.0 |
| High School Diploma | 2,073 (21.5%) | 53.0 |
| College or Associate's Degree | 2,590 (26.9%) | 46.0 |
| Bachelor's Degree | 2,793 (29.0%) | 62.0 |
| Graduate Degree | 1,878 (19.5%) | 64.0 |
| Total | 9,645 (100.0%) | 49.0 |
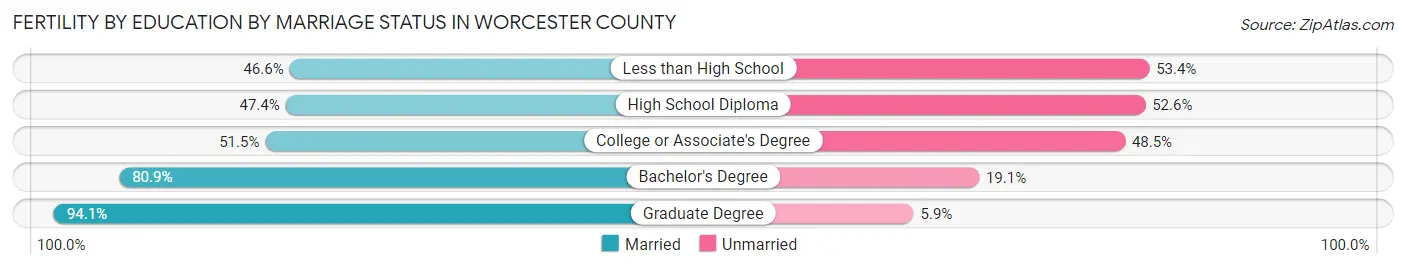
Fertility by Education by Marriage Status in Worcester County
32.7% of women with births in Worcester County are unmarried. Women with the educational attainment of graduate degree are most likely to be married with 94.1% of them married at childbirth, while women with the educational attainment of less than high school are least likely to be married with 53.4% of them unmarried at childbirth.
| Educational Attainment | Married | Unmarried |
| Less than High School | 145 (46.6%) | 166 (53.4%) |
| High School Diploma | 983 (47.4%) | 1,090 (52.6%) |
| College or Associate's Degree | 1,334 (51.5%) | 1,256 (48.5%) |
| Bachelor's Degree | 2,260 (80.9%) | 533 (19.1%) |
| Graduate Degree | 1,767 (94.1%) | 111 (5.9%) |
| Total | 6,491 (67.3%) | 3,154 (32.7%) |
Income in Worcester County
Income Overview in Worcester County
Per Capita Income in Worcester County is $45,433, while median incomes of families and households are $112,544 and $88,524 respectively.
| Characteristic | Number | Measure |
| Per Capita Income | 858,898 | $45,433 |
| Median Family Income | 216,599 | $112,544 |
| Mean Family Income | 216,599 | $138,699 |
| Median Household Income | 330,319 | $88,524 |
| Mean Household Income | 330,319 | $116,031 |
| Income Deficit | 216,599 | $10,289 |
| Wage / Income Gap (%) | 858,898 | 29.22% |
| Wage / Income Gap ($) | 858,898 | 70.78¢ per $1 |
| Gini / Inequality Index | 858,898 | 0.46 |
Earnings by Sex in Worcester County
Average Earnings in Worcester County are $49,596, $58,149 for men and $41,157 for women, a difference of 29.2%.
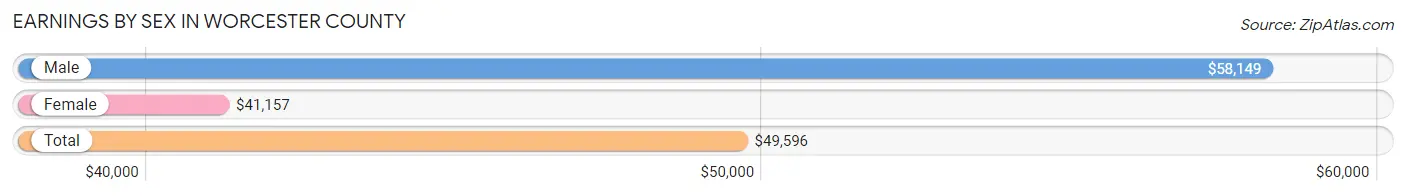
| Sex | Number | Average Earnings |
| Male | 253,082 (52.0%) | $58,149 |
| Female | 233,863 (48.0%) | $41,157 |
| Total | 486,945 (100.0%) | $49,596 |
Earnings by Sex by Income Bracket in Worcester County
The most common earnings brackets in Worcester County are $100,000+ for men (63,947 | 25.3%) and $100,000+ for women (30,297 | 13.0%).
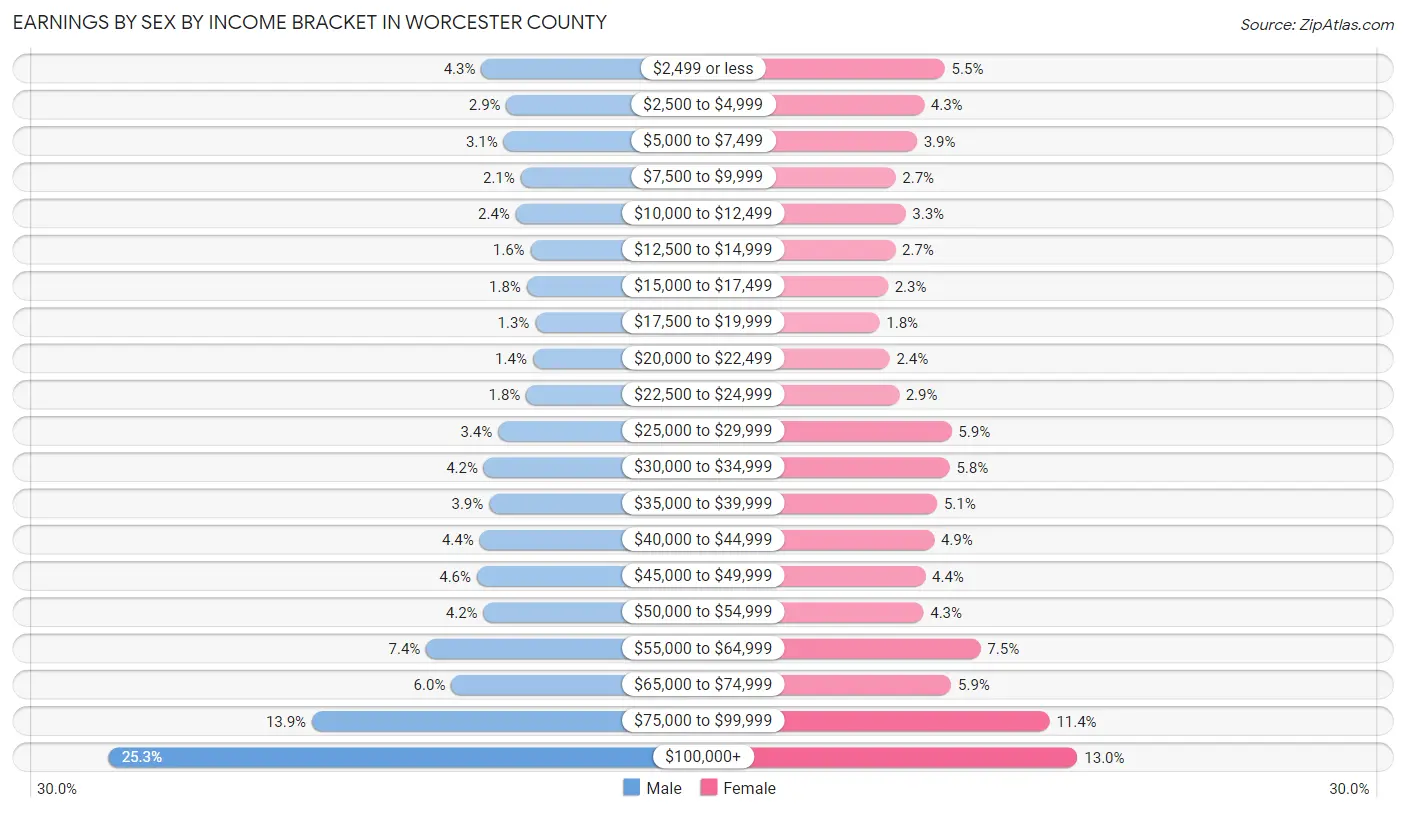
| Income | Male | Female |
| $2,499 or less | 10,971 (4.3%) | 12,852 (5.5%) |
| $2,500 to $4,999 | 7,378 (2.9%) | 10,137 (4.3%) |
| $5,000 to $7,499 | 7,799 (3.1%) | 9,202 (3.9%) |
| $7,500 to $9,999 | 5,355 (2.1%) | 6,393 (2.7%) |
| $10,000 to $12,499 | 6,081 (2.4%) | 7,700 (3.3%) |
| $12,500 to $14,999 | 3,969 (1.6%) | 6,346 (2.7%) |
| $15,000 to $17,499 | 4,505 (1.8%) | 5,374 (2.3%) |
| $17,500 to $19,999 | 3,293 (1.3%) | 4,281 (1.8%) |
| $20,000 to $22,499 | 3,640 (1.4%) | 5,619 (2.4%) |
| $22,500 to $24,999 | 4,589 (1.8%) | 6,827 (2.9%) |
| $25,000 to $29,999 | 8,567 (3.4%) | 13,754 (5.9%) |
| $30,000 to $34,999 | 10,605 (4.2%) | 13,503 (5.8%) |
| $35,000 to $39,999 | 9,852 (3.9%) | 11,850 (5.1%) |
| $40,000 to $44,999 | 11,206 (4.4%) | 11,449 (4.9%) |
| $45,000 to $49,999 | 11,590 (4.6%) | 10,295 (4.4%) |
| $50,000 to $54,999 | 10,650 (4.2%) | 10,063 (4.3%) |
| $55,000 to $64,999 | 18,806 (7.4%) | 17,563 (7.5%) |
| $65,000 to $74,999 | 15,228 (6.0%) | 13,715 (5.9%) |
| $75,000 to $99,999 | 35,051 (13.9%) | 26,643 (11.4%) |
| $100,000+ | 63,947 (25.3%) | 30,297 (13.0%) |
| Total | 253,082 (100.0%) | 233,863 (100.0%) |
Earnings by Sex by Educational Attainment in Worcester County
Average earnings in Worcester County are $68,448 for men and $49,152 for women, a difference of 28.2%. Men with an educational attainment of graduate degree enjoy the highest average annual earnings of $112,662, while those with less than high school education earn the least with $42,716. Women with an educational attainment of graduate degree earn the most with the average annual earnings of $81,141, while those with less than high school education have the smallest earnings of $29,001.
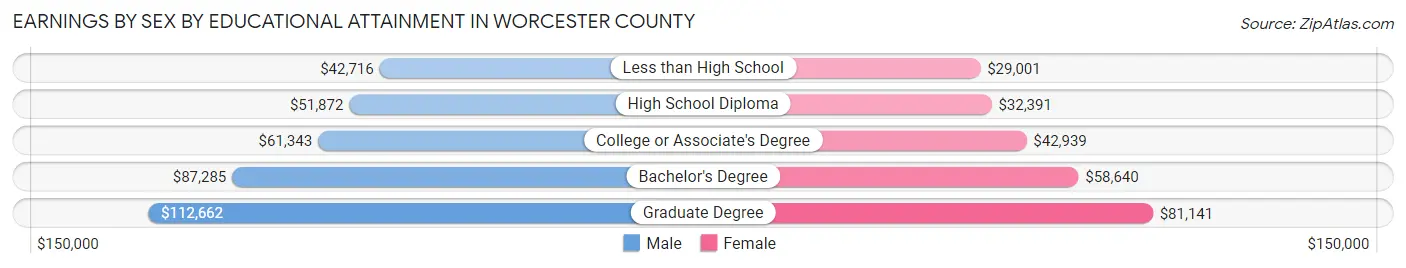
| Educational Attainment | Male Income | Female Income |
| Less than High School | $42,716 | $29,001 |
| High School Diploma | $51,872 | $32,391 |
| College or Associate's Degree | $61,343 | $42,939 |
| Bachelor's Degree | $87,285 | $58,640 |
| Graduate Degree | $112,662 | $81,141 |
| Total | $68,448 | $49,152 |
Family Income in Worcester County
Family Income Brackets in Worcester County
According to the Worcester County family income data, there are 46,136 families falling into the $100,000 to $149,999 income range, which is the most common income bracket and makes up 21.3% of all families. Conversely, the $10,000 to $14,999 income bracket is the least frequent group with only 3,249 families (1.5%) belonging to this category.
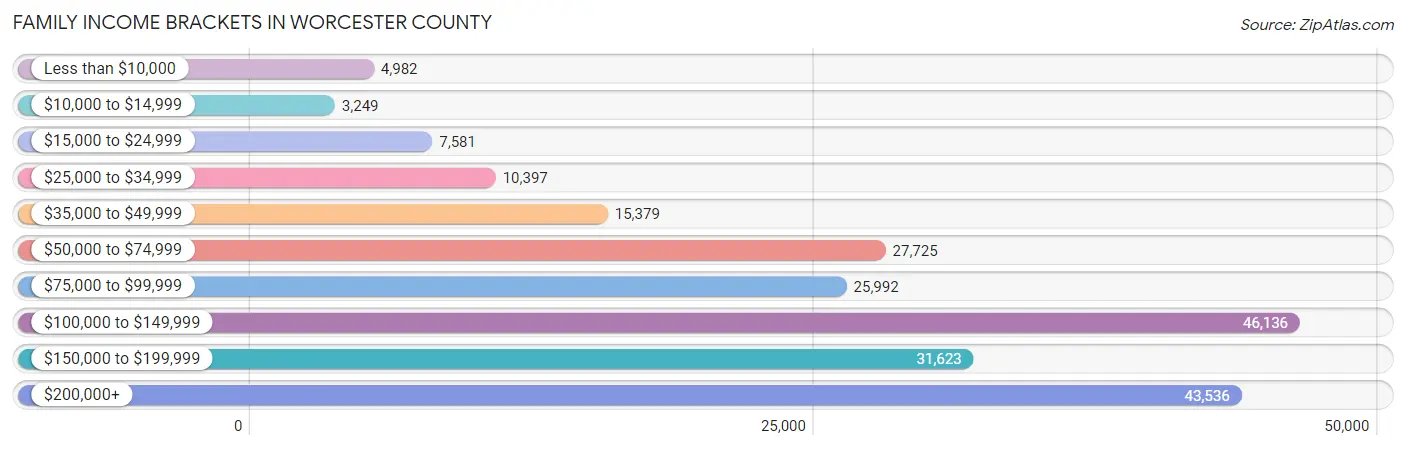
| Income Bracket | # Families | % Families |
| Less than $10,000 | 4,982 | 2.3% |
| $10,000 to $14,999 | 3,249 | 1.5% |
| $15,000 to $24,999 | 7,581 | 3.5% |
| $25,000 to $34,999 | 10,397 | 4.8% |
| $35,000 to $49,999 | 15,379 | 7.1% |
| $50,000 to $74,999 | 27,725 | 12.8% |
| $75,000 to $99,999 | 25,992 | 12.0% |
| $100,000 to $149,999 | 46,136 | 21.3% |
| $150,000 to $199,999 | 31,623 | 14.6% |
| $200,000+ | 43,536 | 20.1% |
Family Income by Famaliy Size in Worcester County
7+ person families (2,348 | 1.1%) account for the highest median family income in Worcester County with $164,798 per family, while 2-person families (95,434 | 44.1%) have the highest median income of $45,132 per family member.
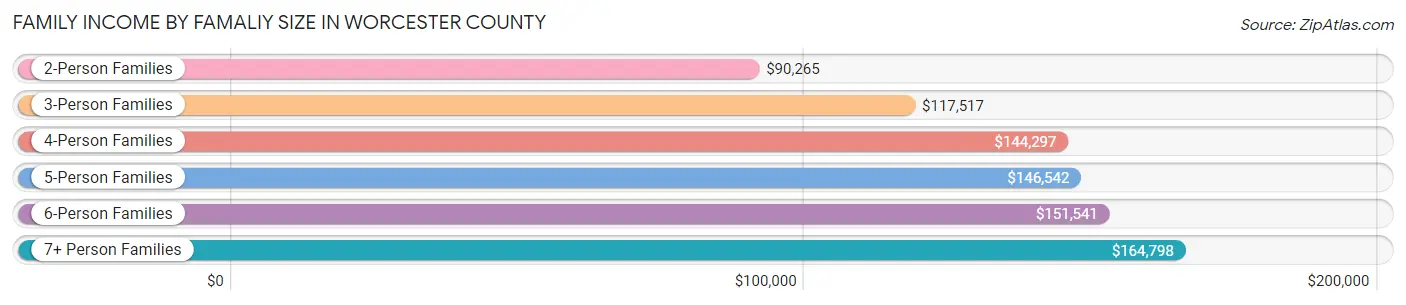
| Income Bracket | # Families | Median Income |
| 2-Person Families | 95,434 (44.1%) | $90,265 |
| 3-Person Families | 53,594 (24.7%) | $117,517 |
| 4-Person Families | 44,909 (20.7%) | $144,297 |
| 5-Person Families | 15,130 (7.0%) | $146,542 |
| 6-Person Families | 5,184 (2.4%) | $151,541 |
| 7+ Person Families | 2,348 (1.1%) | $164,798 |
| Total | 216,599 (100.0%) | $112,544 |
Family Income by Number of Earners in Worcester County
The median family income in Worcester County is $112,544, with families comprising 3+ earners (33,592) having the highest median family income of $180,864, while families with no earners (26,827) have the lowest median family income of $44,496, accounting for 15.5% and 12.4% of families, respectively.
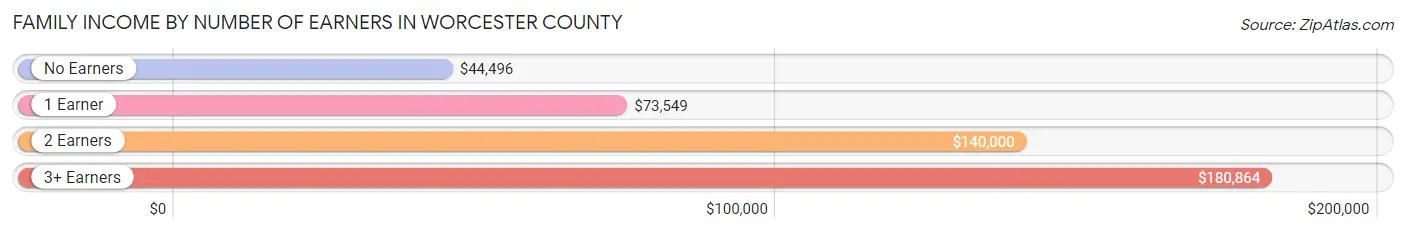
| Number of Earners | # Families | Median Income |
| No Earners | 26,827 (12.4%) | $44,496 |
| 1 Earner | 63,366 (29.2%) | $73,549 |
| 2 Earners | 92,814 (42.8%) | $140,000 |
| 3+ Earners | 33,592 (15.5%) | $180,864 |
| Total | 216,599 (100.0%) | $112,544 |
Household Income in Worcester County
Household Income Brackets in Worcester County
With 61,109 households falling in the category, the $100,000 to $149,999 income range is the most frequent in Worcester County, accounting for 18.5% of all households. In contrast, only 11,891 households (3.6%) fall into the $10,000 to $14,999 income bracket, making it the least populous group.
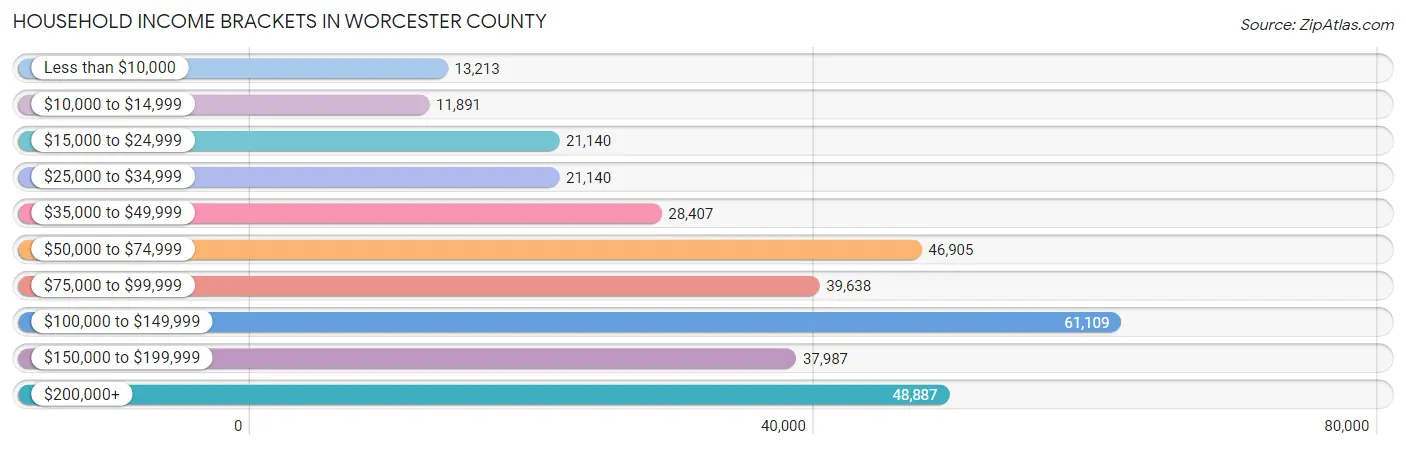
| Income Bracket | # Households | % Households |
| Less than $10,000 | 13,213 | 4.0% |
| $10,000 to $14,999 | 11,891 | 3.6% |
| $15,000 to $24,999 | 21,140 | 6.4% |
| $25,000 to $34,999 | 21,140 | 6.4% |
| $35,000 to $49,999 | 28,407 | 8.6% |
| $50,000 to $74,999 | 46,905 | 14.2% |
| $75,000 to $99,999 | 39,638 | 12.0% |
| $100,000 to $149,999 | 61,109 | 18.5% |
| $150,000 to $199,999 | 37,987 | 11.5% |
| $200,000+ | 48,887 | 14.8% |
Household Income by Householder Age in Worcester County
The median household income in Worcester County is $88,524, with the highest median household income of $115,582 found in the 45 to 64 years age bracket for the primary householder. A total of 135,980 households (41.2%) fall into this category. Meanwhile, the 15 to 24 years age bracket for the primary householder has the lowest median household income of $50,543, with 8,155 households (2.5%) in this group.
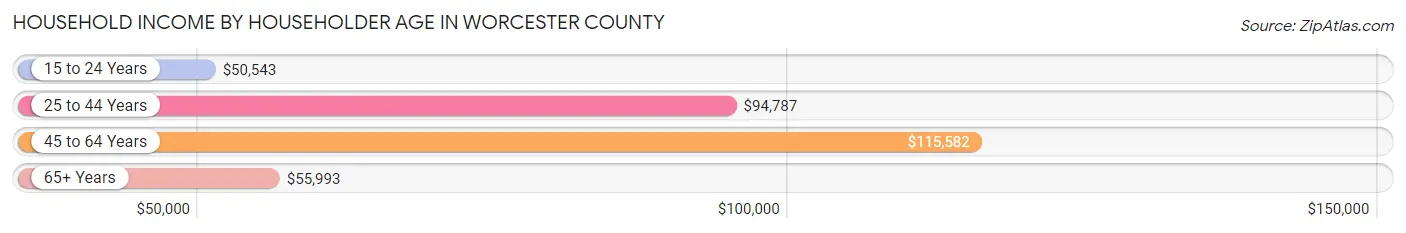
| Income Bracket | # Households | Median Income |
| 15 to 24 Years | 8,155 (2.5%) | $50,543 |
| 25 to 44 Years | 102,126 (30.9%) | $94,787 |
| 45 to 64 Years | 135,980 (41.2%) | $115,582 |
| 65+ Years | 84,058 (25.5%) | $55,993 |
| Total | 330,319 (100.0%) | $88,524 |
Poverty in Worcester County
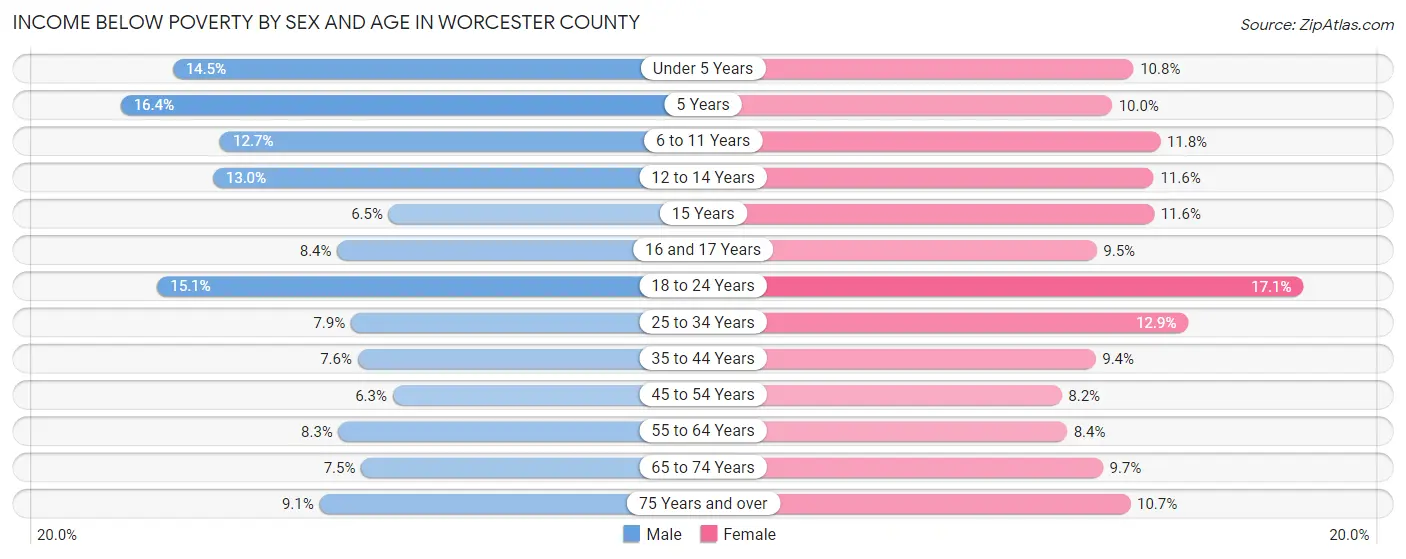
Income Below Poverty by Sex and Age in Worcester County
With 9.3% poverty level for males and 10.6% for females among the residents of Worcester County, 5 year old males and 18 to 24 year old females are the most vulnerable to poverty, with 743 males (16.4%) and 5,741 females (17.1%) in their respective age groups living below the poverty level.
| Age Bracket | Male | Female |
| Under 5 Years | 3,249 (14.5%) | 2,300 (10.8%) |
| 5 Years | 743 (16.4%) | 392 (10.0%) |
| 6 to 11 Years | 3,739 (12.7%) | 3,305 (11.8%) |
| 12 to 14 Years | 2,186 (13.0%) | 1,891 (11.6%) |
| 15 Years | 353 (6.5%) | 627 (11.6%) |
| 16 and 17 Years | 942 (8.4%) | 1,016 (9.5%) |
| 18 to 24 Years | 5,403 (15.1%) | 5,741 (17.1%) |
| 25 to 34 Years | 4,373 (7.9%) | 6,998 (12.9%) |
| 35 to 44 Years | 4,069 (7.6%) | 5,017 (9.4%) |
| 45 to 54 Years | 3,627 (6.3%) | 4,741 (8.2%) |
| 55 to 64 Years | 5,087 (8.3%) | 5,151 (8.4%) |
| 65 to 74 Years | 2,954 (7.5%) | 4,118 (9.7%) |
| 75 Years and over | 1,931 (9.0%) | 3,351 (10.7%) |
| Total | 38,656 (9.3%) | 44,648 (10.6%) |
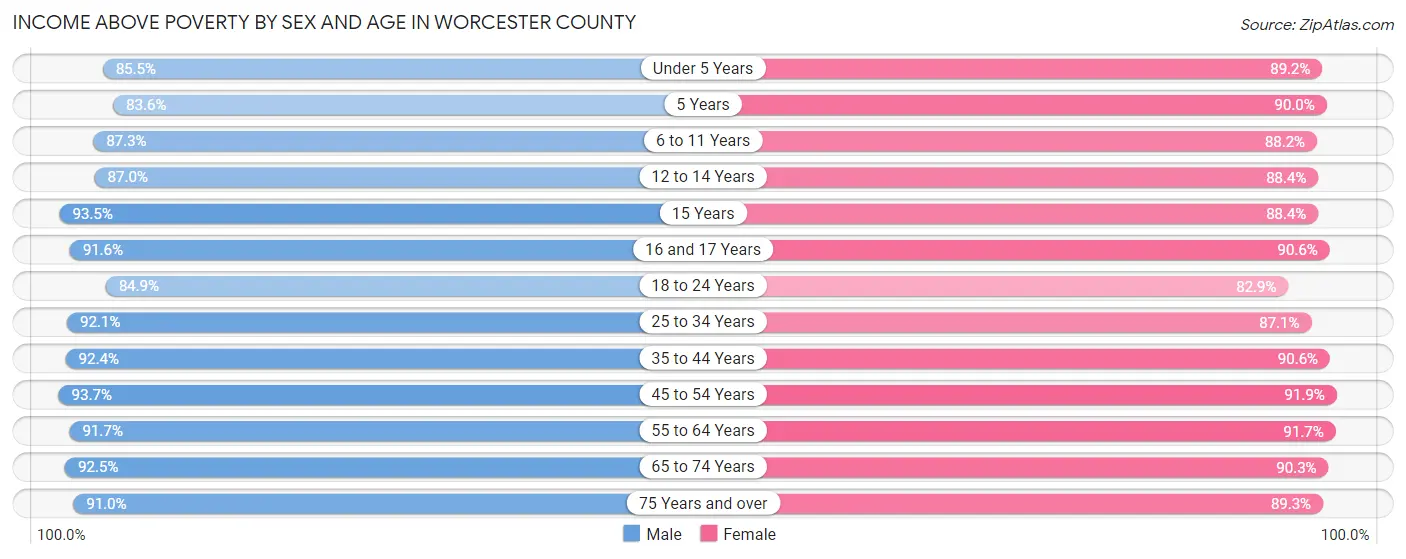
Income Above Poverty by Sex and Age in Worcester County
According to the poverty statistics in Worcester County, males aged 45 to 54 years and females aged 45 to 54 years are the age groups that are most secure financially, with 93.7% of males and 91.8% of females in these age groups living above the poverty line.
| Age Bracket | Male | Female |
| Under 5 Years | 19,160 (85.5%) | 18,959 (89.2%) |
| 5 Years | 3,778 (83.6%) | 3,522 (90.0%) |
| 6 to 11 Years | 25,605 (87.3%) | 24,675 (88.2%) |
| 12 to 14 Years | 14,622 (87.0%) | 14,454 (88.4%) |
| 15 Years | 5,098 (93.5%) | 4,787 (88.4%) |
| 16 and 17 Years | 10,289 (91.6%) | 9,731 (90.5%) |
| 18 to 24 Years | 30,439 (84.9%) | 27,780 (82.9%) |
| 25 to 34 Years | 51,127 (92.1%) | 47,415 (87.1%) |
| 35 to 44 Years | 49,248 (92.4%) | 48,325 (90.6%) |
| 45 to 54 Years | 53,667 (93.7%) | 53,442 (91.8%) |
| 55 to 64 Years | 55,888 (91.7%) | 56,522 (91.6%) |
| 65 to 74 Years | 36,431 (92.5%) | 38,413 (90.3%) |
| 75 Years and over | 19,399 (90.9%) | 27,974 (89.3%) |
| Total | 374,751 (90.6%) | 375,999 (89.4%) |
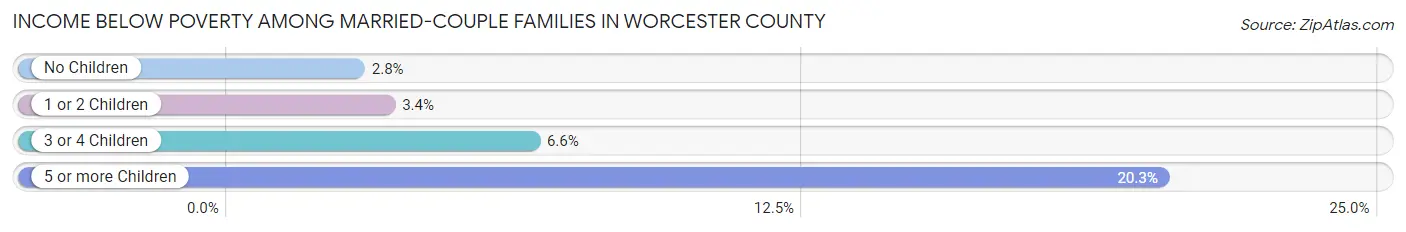
Income Below Poverty Among Married-Couple Families in Worcester County
The poverty statistics for married-couple families in Worcester County show that 3.3% or 5,215 of the total 159,457 families live below the poverty line. Families with 5 or more children have the highest poverty rate of 20.3%, comprising of 75 families. On the other hand, families with no children have the lowest poverty rate of 2.8%, which includes 2,556 families.
| Children | Above Poverty | Below Poverty |
| No Children | 89,994 (97.2%) | 2,556 (2.8%) |
| 1 or 2 Children | 54,862 (96.6%) | 1,945 (3.4%) |
| 3 or 4 Children | 9,091 (93.4%) | 639 (6.6%) |
| 5 or more Children | 295 (79.7%) | 75 (20.3%) |
| Total | 154,242 (96.7%) | 5,215 (3.3%) |
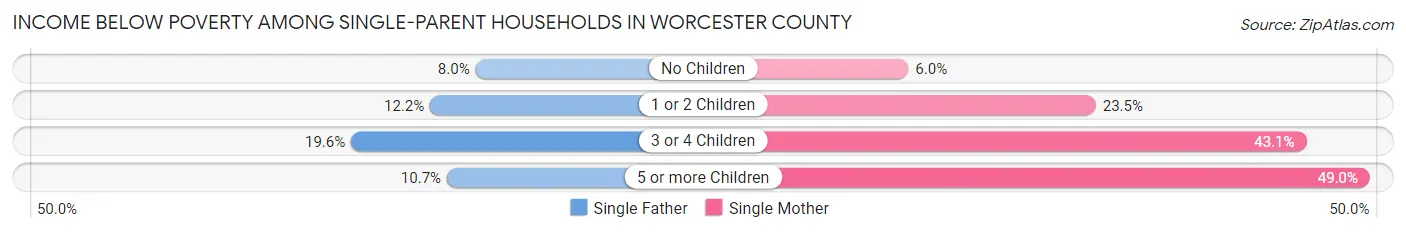
Income Below Poverty Among Single-Parent Households in Worcester County
According to the poverty data in Worcester County, 10.8% or 1,842 single-father households and 18.0% or 7,208 single-mother households are living below the poverty line. Among single-father households, those with 3 or 4 children have the highest poverty rate, with 236 households (19.6%) experiencing poverty. Likewise, among single-mother households, those with 5 or more children have the highest poverty rate, with 122 households (49.0%) falling below the poverty line.
| Children | Single Father | Single Mother |
| No Children | 632 (8.0%) | 971 (6.0%) |
| 1 or 2 Children | 966 (12.2%) | 4,916 (23.5%) |
| 3 or 4 Children | 236 (19.6%) | 1,199 (43.1%) |
| 5 or more Children | 8 (10.7%) | 122 (49.0%) |
| Total | 1,842 (10.8%) | 7,208 (18.0%) |
Income Below Poverty Among Married-Couple vs Single-Parent Households in Worcester County
The poverty data for Worcester County shows that 5,215 of the married-couple family households (3.3%) and 9,050 of the single-parent households (15.8%) are living below the poverty level. Within the married-couple family households, those with 5 or more children have the highest poverty rate, with 75 households (20.3%) falling below the poverty line. Among the single-parent households, those with 5 or more children have the highest poverty rate, with 130 household (40.1%) living below poverty.
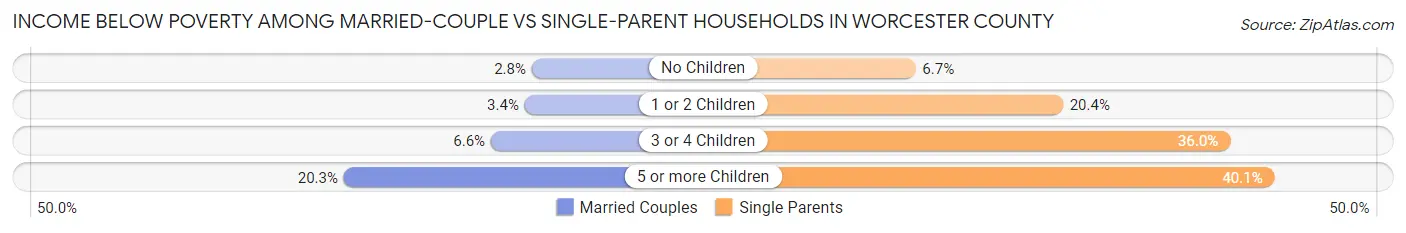
| Children | Married-Couple Families | Single-Parent Households |
| No Children | 2,556 (2.8%) | 1,603 (6.7%) |
| 1 or 2 Children | 1,945 (3.4%) | 5,882 (20.4%) |
| 3 or 4 Children | 639 (6.6%) | 1,435 (36.0%) |
| 5 or more Children | 75 (20.3%) | 130 (40.1%) |
| Total | 5,215 (3.3%) | 9,050 (15.8%) |
Employment Characteristics in Worcester County
Employment by Class of Employer in Worcester County
Among the 432,718 employed individuals in Worcester County, private company employees (293,225 | 67.8%), not-for-profit organizations (45,816 | 10.6%), and local government employees (33,260 | 7.7%) make up the most common classes of employment.
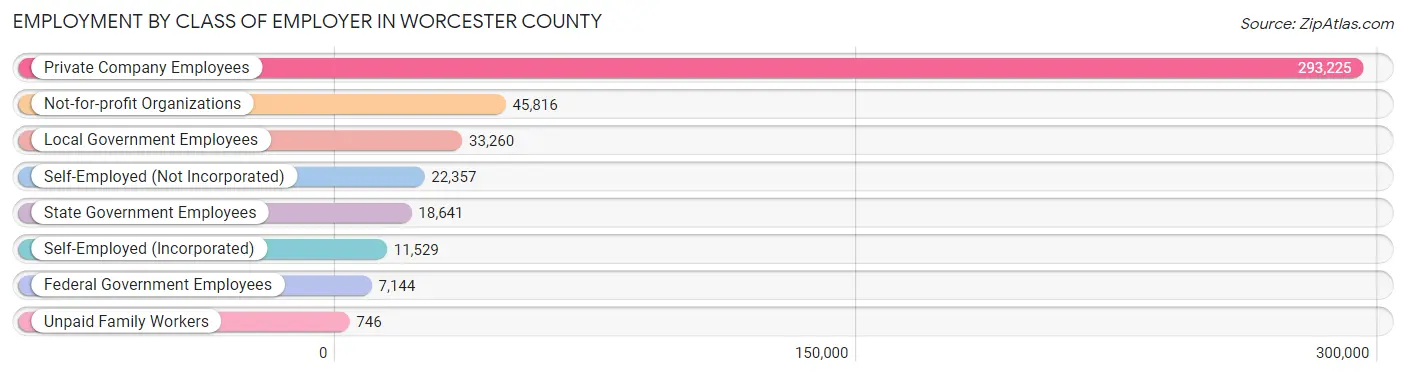
| Employer Class | # Employees | % Employees |
| Private Company Employees | 293,225 | 67.8% |
| Self-Employed (Incorporated) | 11,529 | 2.7% |
| Self-Employed (Not Incorporated) | 22,357 | 5.2% |
| Not-for-profit Organizations | 45,816 | 10.6% |
| Local Government Employees | 33,260 | 7.7% |
| State Government Employees | 18,641 | 4.3% |
| Federal Government Employees | 7,144 | 1.7% |
| Unpaid Family Workers | 746 | 0.2% |
| Total | 432,718 | 100.0% |
Employment Status by Age in Worcester County
According to the labor force statistics for Worcester County, out of the total population over 16 years of age (702,842), 66.6% or 468,093 individuals are in the labor force, with 5.6% or 26,213 of them unemployed. The age group with the highest labor force participation rate is 25 to 29 years, with 85.2% or 46,089 individuals in the labor force. Within the labor force, the 16 to 19 years age range has the highest percentage of unemployed individuals, with 13.9% or 2,926 of them being unemployed.
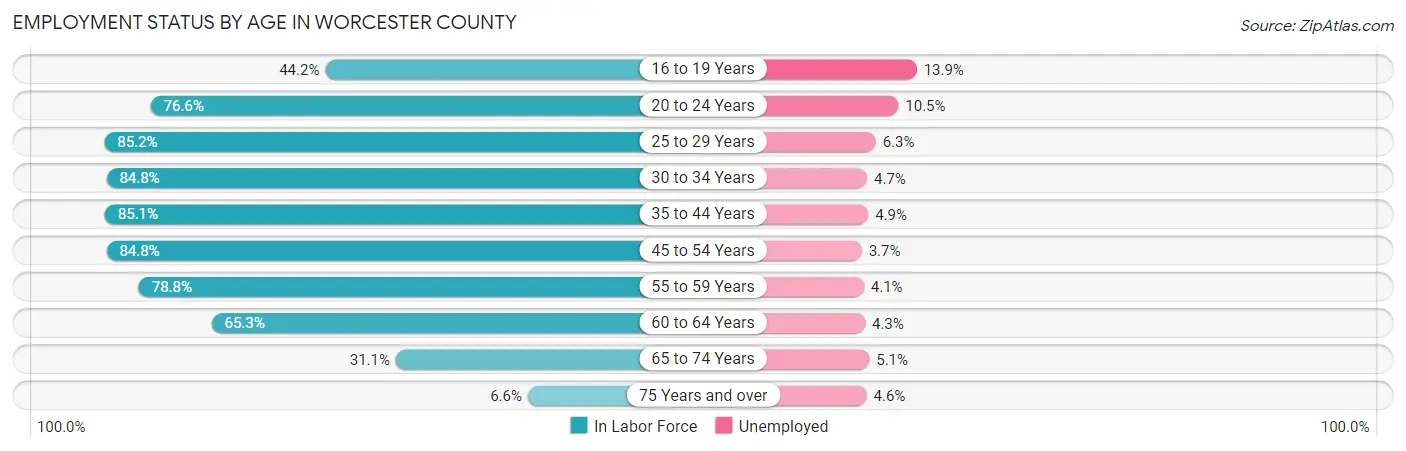
| Age Bracket | In Labor Force | Unemployed |
| 16 to 19 Years | 21,048 (44.2%) | 2,926 (13.9%) |
| 20 to 24 Years | 43,966 (76.6%) | 4,616 (10.5%) |
| 25 to 29 Years | 46,089 (85.2%) | 2,904 (6.3%) |
| 30 to 34 Years | 48,289 (84.8%) | 2,270 (4.7%) |
| 35 to 44 Years | 91,469 (85.1%) | 4,482 (4.9%) |
| 45 to 54 Years | 98,620 (84.8%) | 3,649 (3.7%) |
| 55 to 59 Years | 50,018 (78.8%) | 2,051 (4.1%) |
| 60 to 64 Years | 39,334 (65.3%) | 1,691 (4.3%) |
| 65 to 74 Years | 25,861 (31.1%) | 1,319 (5.1%) |
| 75 Years and over | 3,705 (6.6%) | 170 (4.6%) |
| Total | 468,093 (66.6%) | 26,213 (5.6%) |
Employment Status by Educational Attainment in Worcester County
According to labor force statistics for Worcester County, 81.5% of individuals (373,702) out of the total population between 25 and 64 years of age (458,530) are in the labor force, with 4.6% or 17,190 of them being unemployed. The group with the highest labor force participation rate are those with the educational attainment of bachelor's degree or higher, with 88.9% or 167,367 individuals in the labor force. Within the labor force, individuals with less than high school education have the highest percentage of unemployment, with 10.2% or 2,049 of them being unemployed.
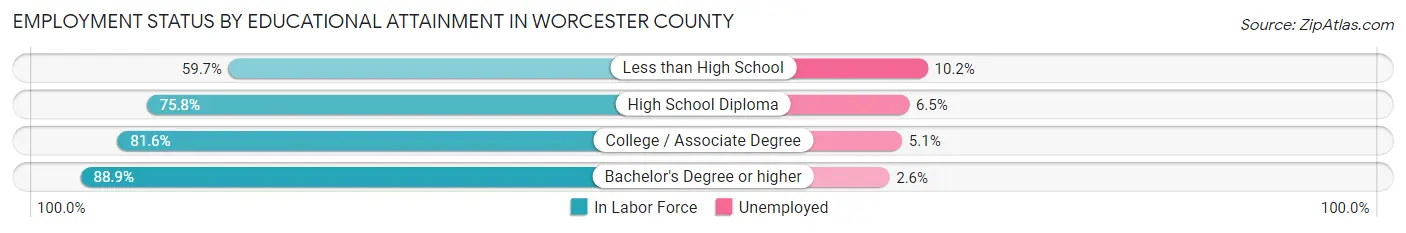
| Educational Attainment | In Labor Force | Unemployed |
| Less than High School | 20,090 (59.7%) | 3,433 (10.2%) |
| High School Diploma | 86,913 (75.8%) | 7,453 (6.5%) |
| College / Associate Degree | 99,514 (81.6%) | 6,220 (5.1%) |
| Bachelor's Degree or higher | 167,367 (88.9%) | 4,895 (2.6%) |
| Total | 373,702 (81.5%) | 21,092 (4.6%) |
Employment Occupations by Sex in Worcester County
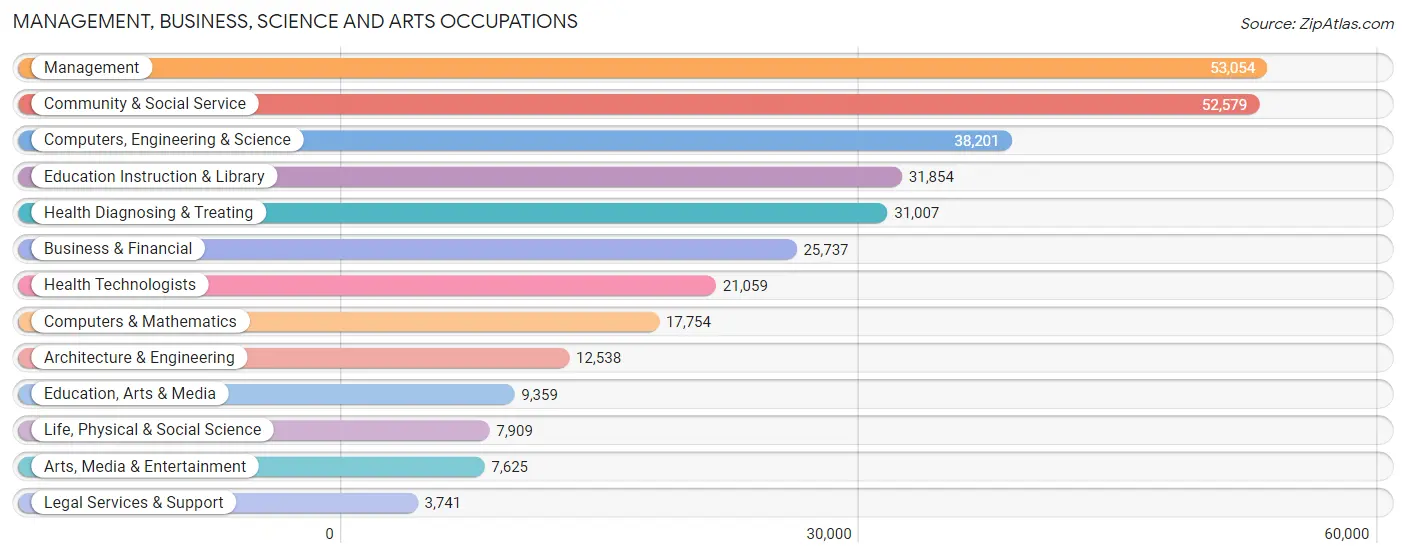
Management, Business, Science and Arts Occupations
The most common Management, Business, Science and Arts occupations in Worcester County are Management (53,054 | 12.0%), Community & Social Service (52,579 | 11.9%), Computers, Engineering & Science (38,201 | 8.6%), Education Instruction & Library (31,854 | 7.2%), and Health Diagnosing & Treating (31,007 | 7.0%).
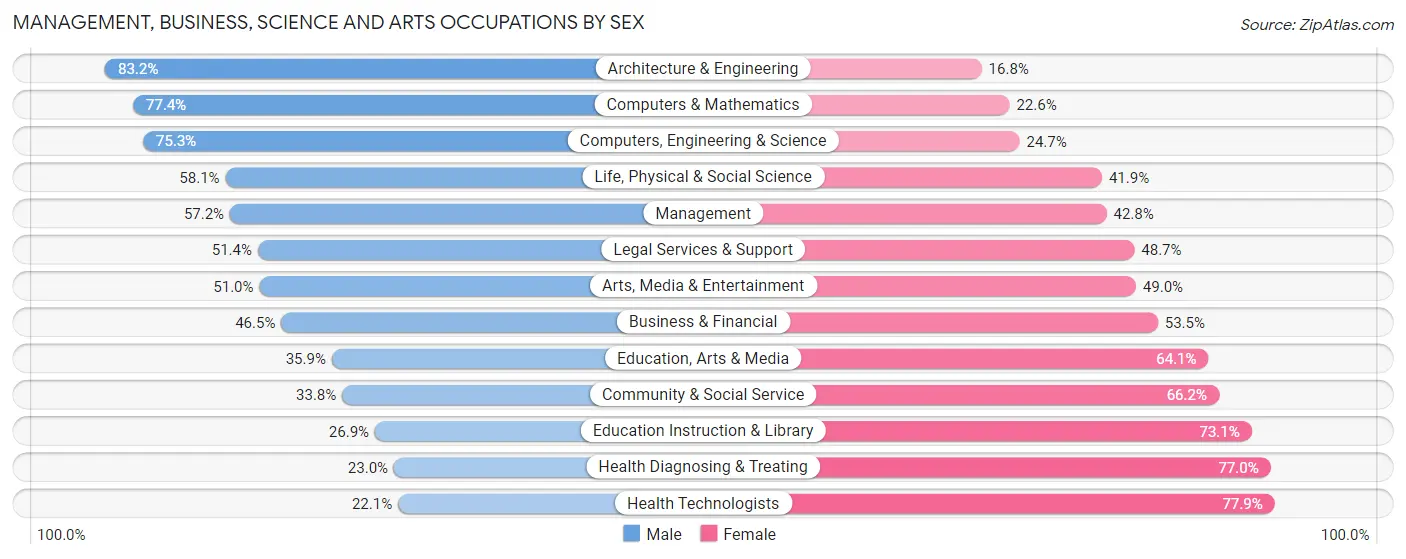
Management, Business, Science and Arts Occupations by Sex
Within the Management, Business, Science and Arts occupations in Worcester County, the most male-oriented occupations are Architecture & Engineering (83.2%), Computers & Mathematics (77.4%), and Computers, Engineering & Science (75.3%), while the most female-oriented occupations are Health Technologists (77.9%), Health Diagnosing & Treating (77.0%), and Education Instruction & Library (73.1%).
| Occupation | Male | Female |
| Management | 30,324 (57.2%) | 22,730 (42.8%) |
| Business & Financial | 11,957 (46.5%) | 13,780 (53.5%) |
| Computers, Engineering & Science | 28,771 (75.3%) | 9,430 (24.7%) |
| Computers & Mathematics | 13,742 (77.4%) | 4,012 (22.6%) |
| Architecture & Engineering | 10,433 (83.2%) | 2,105 (16.8%) |
| Life, Physical & Social Science | 4,596 (58.1%) | 3,313 (41.9%) |
| Community & Social Service | 17,750 (33.8%) | 34,829 (66.2%) |
| Education, Arts & Media | 3,363 (35.9%) | 5,996 (64.1%) |
| Legal Services & Support | 1,921 (51.3%) | 1,820 (48.6%) |
| Education Instruction & Library | 8,575 (26.9%) | 23,279 (73.1%) |
| Arts, Media & Entertainment | 3,891 (51.0%) | 3,734 (49.0%) |
| Health Diagnosing & Treating | 7,119 (23.0%) | 23,888 (77.0%) |
| Health Technologists | 4,656 (22.1%) | 16,403 (77.9%) |
| Total (Category) | 95,921 (47.8%) | 104,657 (52.2%) |
| Total (Overall) | 229,435 (52.0%) | 212,135 (48.0%) |
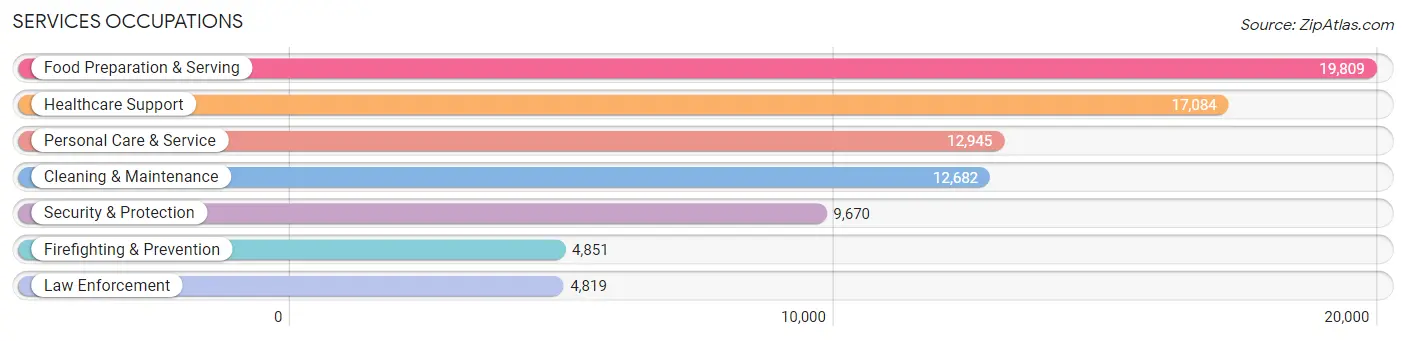
Services Occupations
The most common Services occupations in Worcester County are Food Preparation & Serving (19,809 | 4.5%), Healthcare Support (17,084 | 3.9%), Personal Care & Service (12,945 | 2.9%), Cleaning & Maintenance (12,682 | 2.9%), and Security & Protection (9,670 | 2.2%).
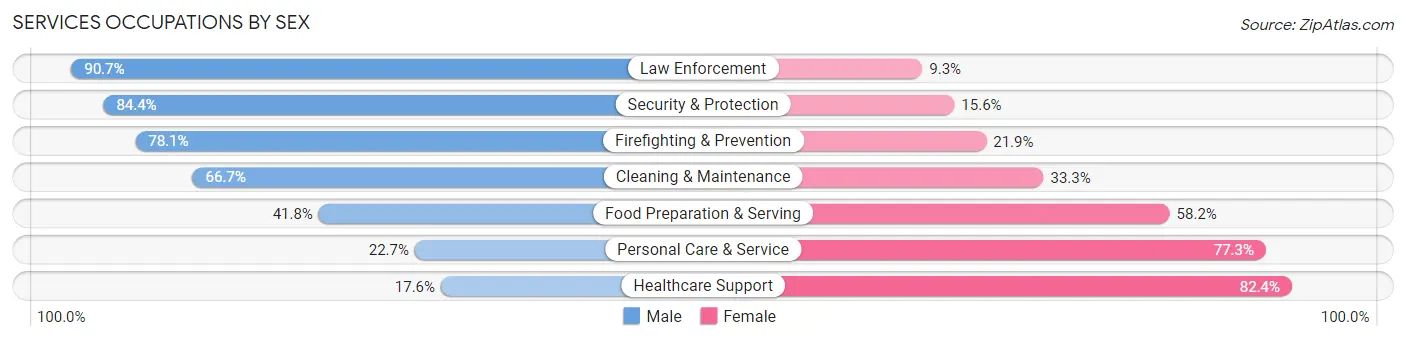
Services Occupations by Sex
Within the Services occupations in Worcester County, the most male-oriented occupations are Law Enforcement (90.7%), Security & Protection (84.4%), and Firefighting & Prevention (78.1%), while the most female-oriented occupations are Healthcare Support (82.4%), Personal Care & Service (77.3%), and Food Preparation & Serving (58.2%).
| Occupation | Male | Female |
| Healthcare Support | 3,002 (17.6%) | 14,082 (82.4%) |
| Security & Protection | 8,160 (84.4%) | 1,510 (15.6%) |
| Firefighting & Prevention | 3,787 (78.1%) | 1,064 (21.9%) |
| Law Enforcement | 4,373 (90.7%) | 446 (9.3%) |
| Food Preparation & Serving | 8,273 (41.8%) | 11,536 (58.2%) |
| Cleaning & Maintenance | 8,463 (66.7%) | 4,219 (33.3%) |
| Personal Care & Service | 2,943 (22.7%) | 10,002 (77.3%) |
| Total (Category) | 30,841 (42.7%) | 41,349 (57.3%) |
| Total (Overall) | 229,435 (52.0%) | 212,135 (48.0%) |
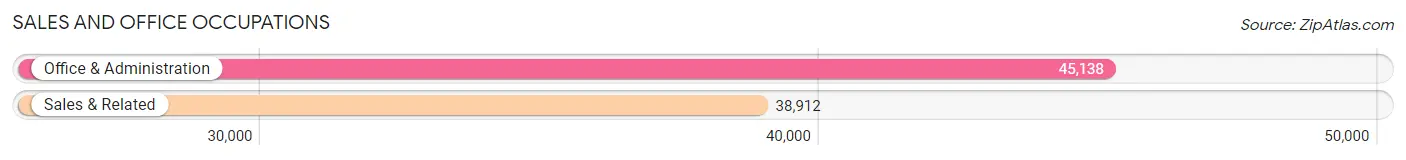
Sales and Office Occupations
The most common Sales and Office occupations in Worcester County are Office & Administration (45,138 | 10.2%), and Sales & Related (38,912 | 8.8%).
Sales and Office Occupations by Sex
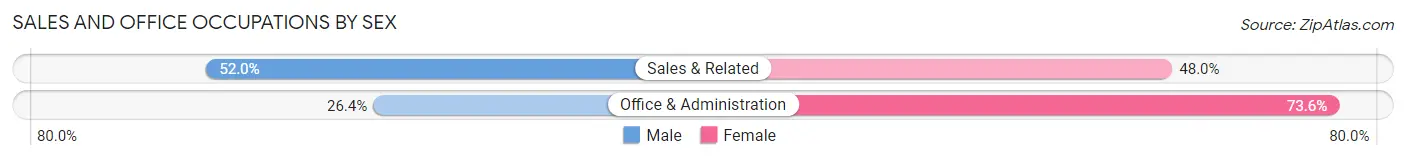
| Occupation | Male | Female |
| Sales & Related | 20,246 (52.0%) | 18,666 (48.0%) |
| Office & Administration | 11,913 (26.4%) | 33,225 (73.6%) |
| Total (Category) | 32,159 (38.3%) | 51,891 (61.7%) |
| Total (Overall) | 229,435 (52.0%) | 212,135 (48.0%) |
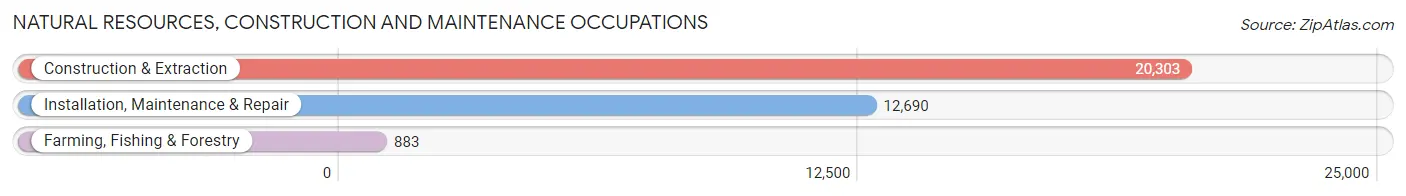
Natural Resources, Construction and Maintenance Occupations
The most common Natural Resources, Construction and Maintenance occupations in Worcester County are Construction & Extraction (20,303 | 4.6%), Installation, Maintenance & Repair (12,690 | 2.9%), and Farming, Fishing & Forestry (883 | 0.2%).
Natural Resources, Construction and Maintenance Occupations by Sex
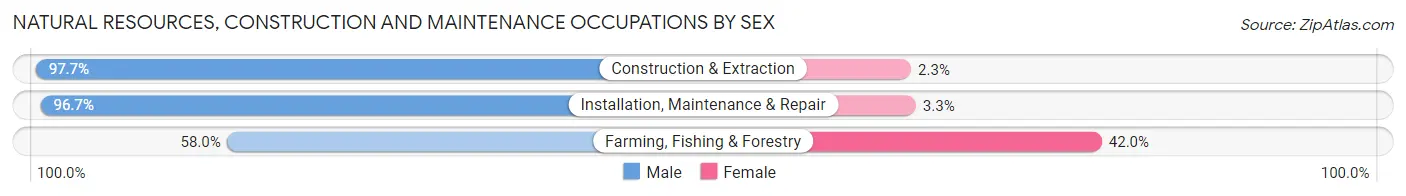
| Occupation | Male | Female |
| Farming, Fishing & Forestry | 512 (58.0%) | 371 (42.0%) |
| Construction & Extraction | 19,828 (97.7%) | 475 (2.3%) |
| Installation, Maintenance & Repair | 12,267 (96.7%) | 423 (3.3%) |
| Total (Category) | 32,607 (96.3%) | 1,269 (3.7%) |
| Total (Overall) | 229,435 (52.0%) | 212,135 (48.0%) |
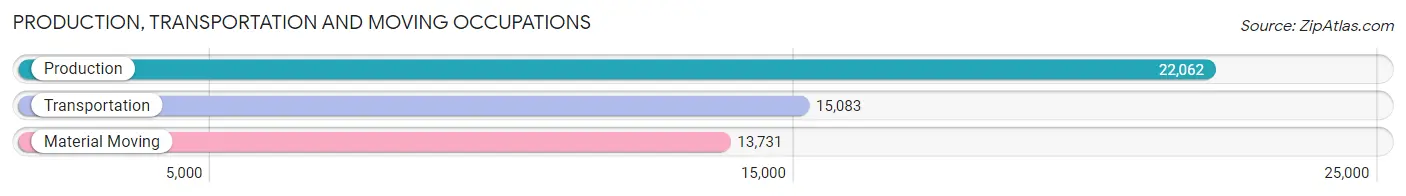
Production, Transportation and Moving Occupations
The most common Production, Transportation and Moving occupations in Worcester County are Production (22,062 | 5.0%), Transportation (15,083 | 3.4%), and Material Moving (13,731 | 3.1%).
Production, Transportation and Moving Occupations by Sex
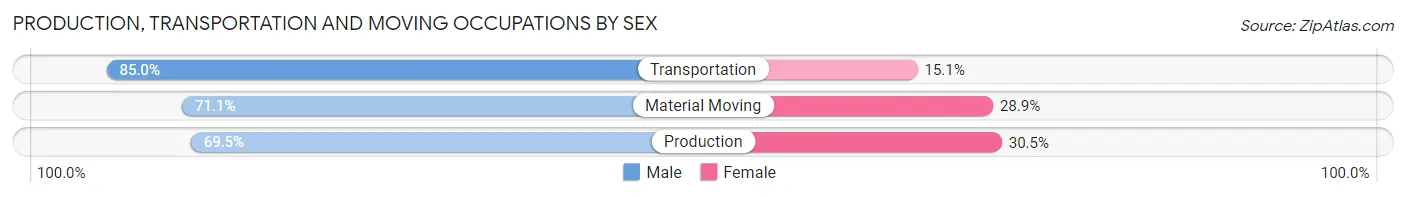
| Occupation | Male | Female |
| Production | 15,330 (69.5%) | 6,732 (30.5%) |
| Transportation | 12,813 (85.0%) | 2,270 (15.0%) |
| Material Moving | 9,764 (71.1%) | 3,967 (28.9%) |
| Total (Category) | 37,907 (74.5%) | 12,969 (25.5%) |
| Total (Overall) | 229,435 (52.0%) | 212,135 (48.0%) |
Employment Industries by Sex in Worcester County
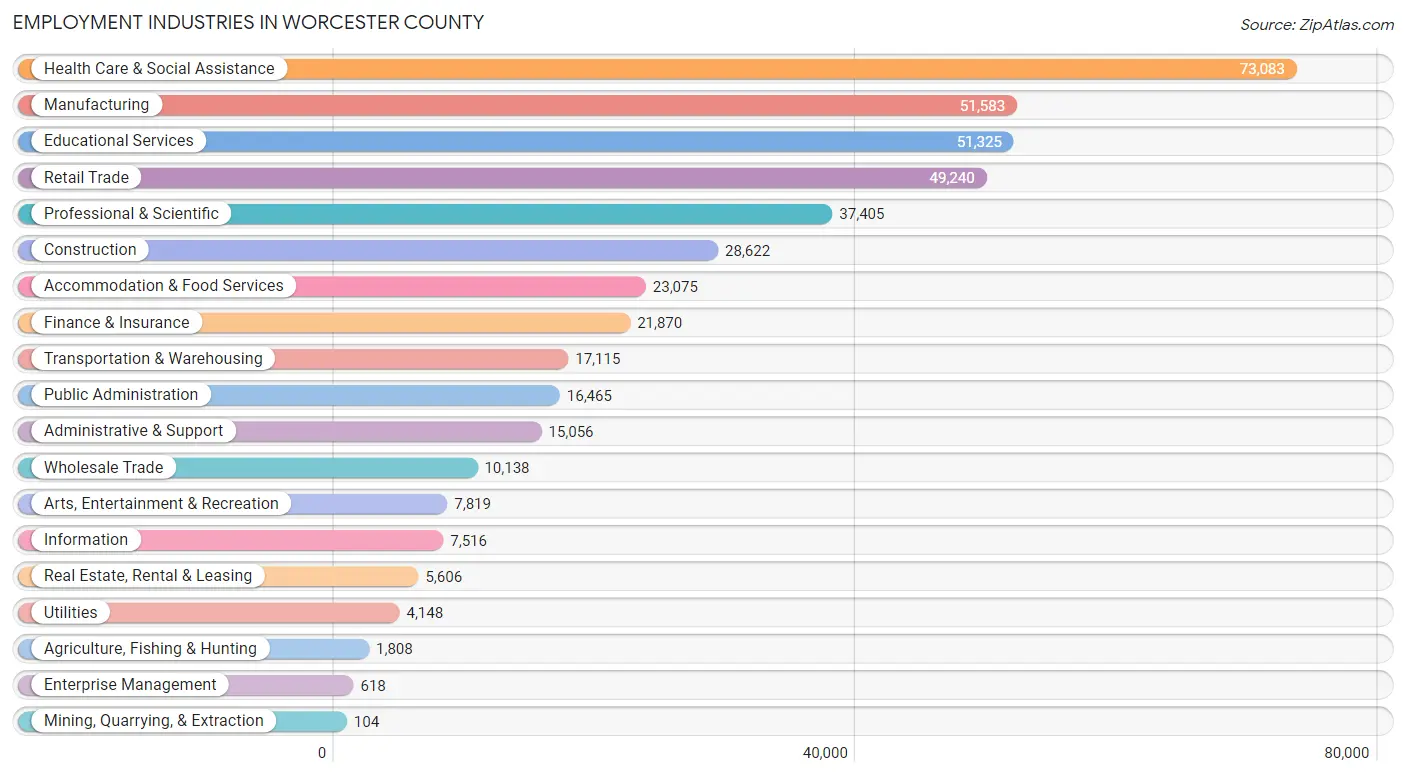
Employment Industries in Worcester County
The major employment industries in Worcester County include Health Care & Social Assistance (73,083 | 16.6%), Manufacturing (51,583 | 11.7%), Educational Services (51,325 | 11.6%), Retail Trade (49,240 | 11.2%), and Professional & Scientific (37,405 | 8.5%).
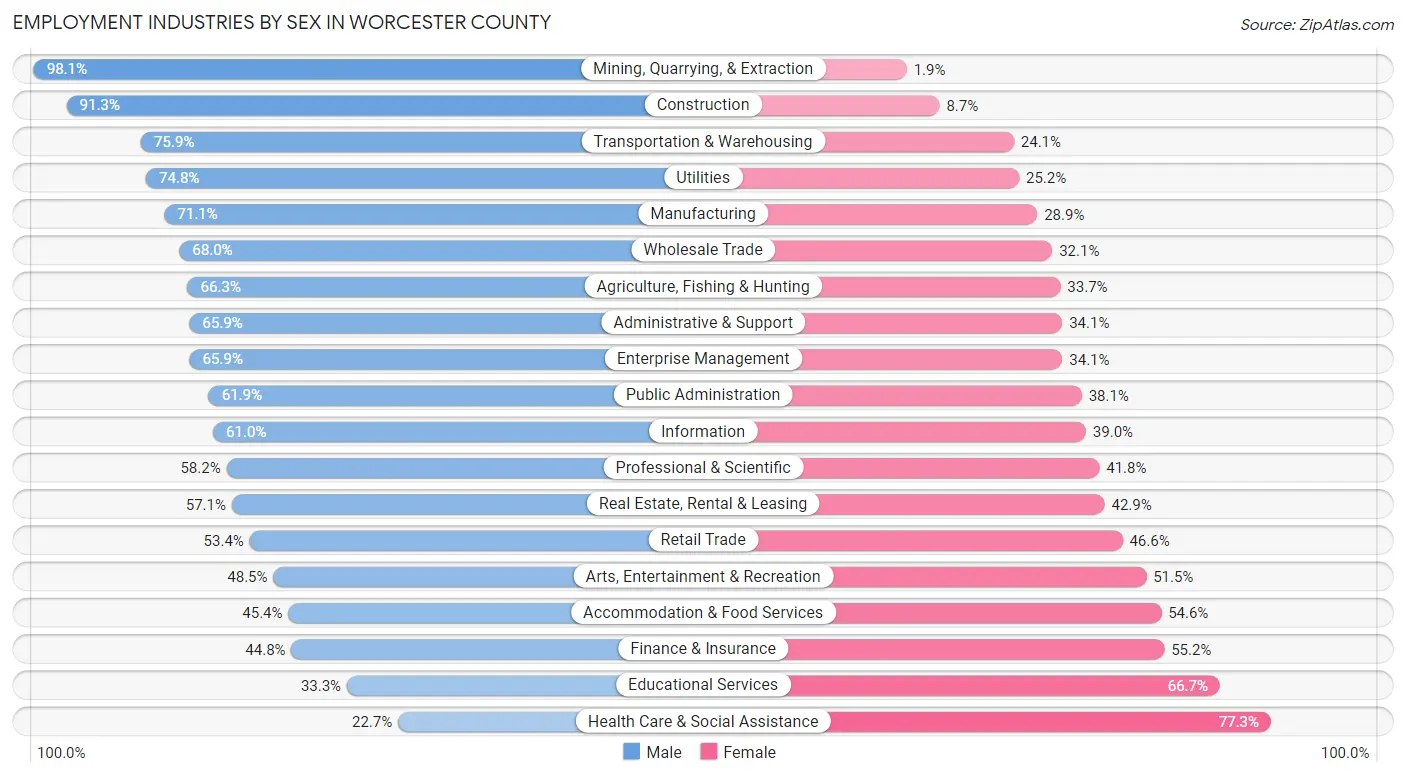
Employment Industries by Sex in Worcester County
The Worcester County industries that see more men than women are Mining, Quarrying, & Extraction (98.1%), Construction (91.3%), and Transportation & Warehousing (75.9%), whereas the industries that tend to have a higher number of women are Health Care & Social Assistance (77.3%), Educational Services (66.7%), and Finance & Insurance (55.2%).
| Industry | Male | Female |
| Agriculture, Fishing & Hunting | 1,198 (66.3%) | 610 (33.7%) |
| Mining, Quarrying, & Extraction | 102 (98.1%) | 2 (1.9%) |
| Construction | 26,132 (91.3%) | 2,490 (8.7%) |
| Manufacturing | 36,657 (71.1%) | 14,926 (28.9%) |
| Wholesale Trade | 6,889 (67.9%) | 3,249 (32.1%) |
| Retail Trade | 26,306 (53.4%) | 22,934 (46.6%) |
| Transportation & Warehousing | 12,991 (75.9%) | 4,124 (24.1%) |
| Utilities | 3,104 (74.8%) | 1,044 (25.2%) |
| Information | 4,584 (61.0%) | 2,932 (39.0%) |
| Finance & Insurance | 9,794 (44.8%) | 12,076 (55.2%) |
| Real Estate, Rental & Leasing | 3,202 (57.1%) | 2,404 (42.9%) |
| Professional & Scientific | 21,772 (58.2%) | 15,633 (41.8%) |
| Enterprise Management | 407 (65.9%) | 211 (34.1%) |
| Administrative & Support | 9,919 (65.9%) | 5,137 (34.1%) |
| Educational Services | 17,083 (33.3%) | 34,242 (66.7%) |
| Health Care & Social Assistance | 16,599 (22.7%) | 56,484 (77.3%) |
| Arts, Entertainment & Recreation | 3,793 (48.5%) | 4,026 (51.5%) |
| Accommodation & Food Services | 10,475 (45.4%) | 12,600 (54.6%) |
| Public Administration | 10,186 (61.9%) | 6,279 (38.1%) |
| Total | 229,435 (52.0%) | 212,135 (48.0%) |
Education in Worcester County
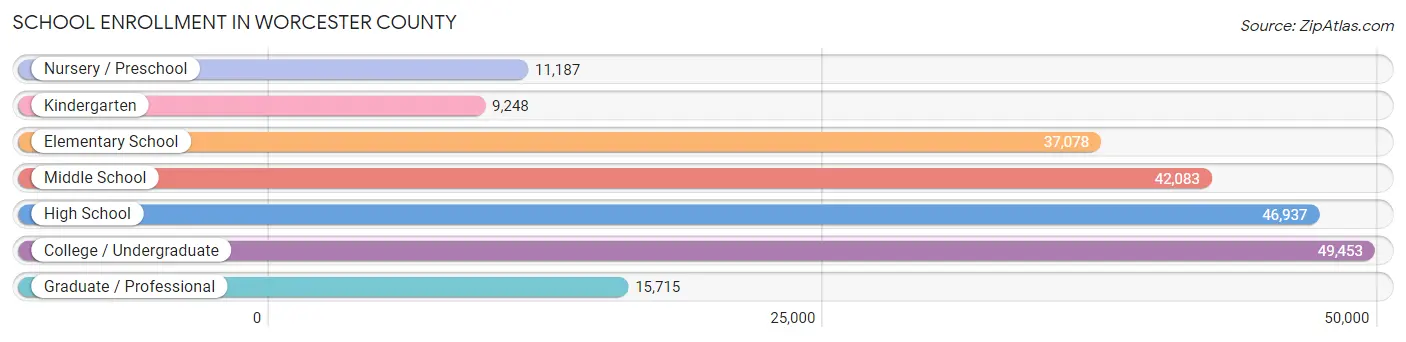
School Enrollment in Worcester County
The most common levels of schooling among the 211,701 students in Worcester County are college / undergraduate (49,453 | 23.4%), high school (46,937 | 22.2%), and middle school (42,083 | 19.9%).
| School Level | # Students | % Students |
| Nursery / Preschool | 11,187 | 5.3% |
| Kindergarten | 9,248 | 4.4% |
| Elementary School | 37,078 | 17.5% |
| Middle School | 42,083 | 19.9% |
| High School | 46,937 | 22.2% |
| College / Undergraduate | 49,453 | 23.4% |
| Graduate / Professional | 15,715 | 7.4% |
| Total | 211,701 | 100.0% |
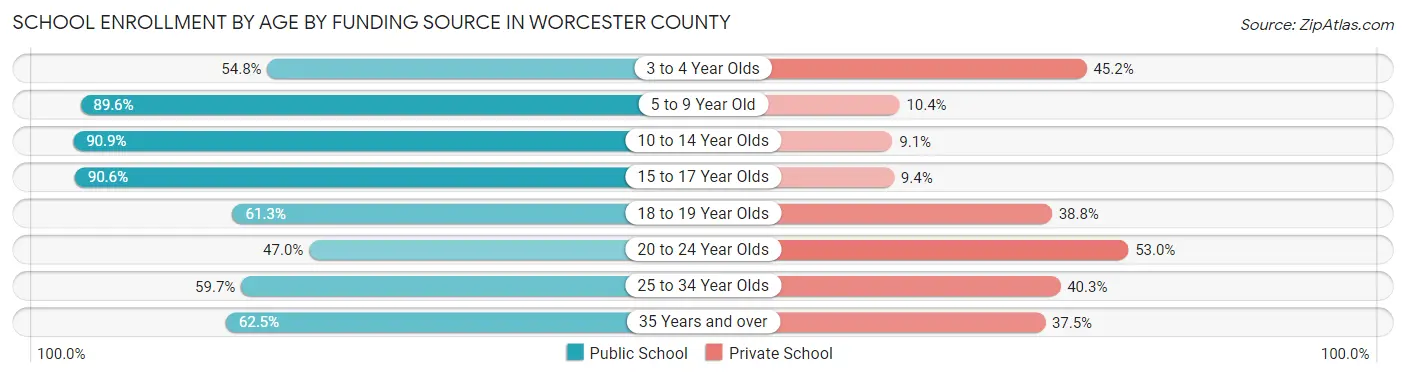
School Enrollment by Age by Funding Source in Worcester County
Out of a total of 211,701 students who are enrolled in schools in Worcester County, 48,903 (23.1%) attend a private institution, while the remaining 162,798 (76.9%) are enrolled in public schools. The age group of 20 to 24 year olds has the highest likelihood of being enrolled in private schools, with 14,612 (53.0% in the age bracket) enrolled. Conversely, the age group of 10 to 14 year olds has the lowest likelihood of being enrolled in a private school, with 47,712 (90.9% in the age bracket) attending a public institution.
| Age Bracket | Public School | Private School |
| 3 to 4 Year Olds | 4,913 (54.8%) | 4,058 (45.2%) |
| 5 to 9 Year Old | 39,378 (89.6%) | 4,568 (10.4%) |
| 10 to 14 Year Olds | 47,712 (90.9%) | 4,754 (9.1%) |
| 15 to 17 Year Olds | 29,655 (90.6%) | 3,062 (9.4%) |
| 18 to 19 Year Olds | 13,060 (61.3%) | 8,262 (38.8%) |
| 20 to 24 Year Olds | 12,960 (47.0%) | 14,612 (53.0%) |
| 25 to 34 Year Olds | 8,007 (59.7%) | 5,413 (40.3%) |
| 35 Years and over | 7,056 (62.5%) | 4,231 (37.5%) |
| Total | 162,798 (76.9%) | 48,903 (23.1%) |
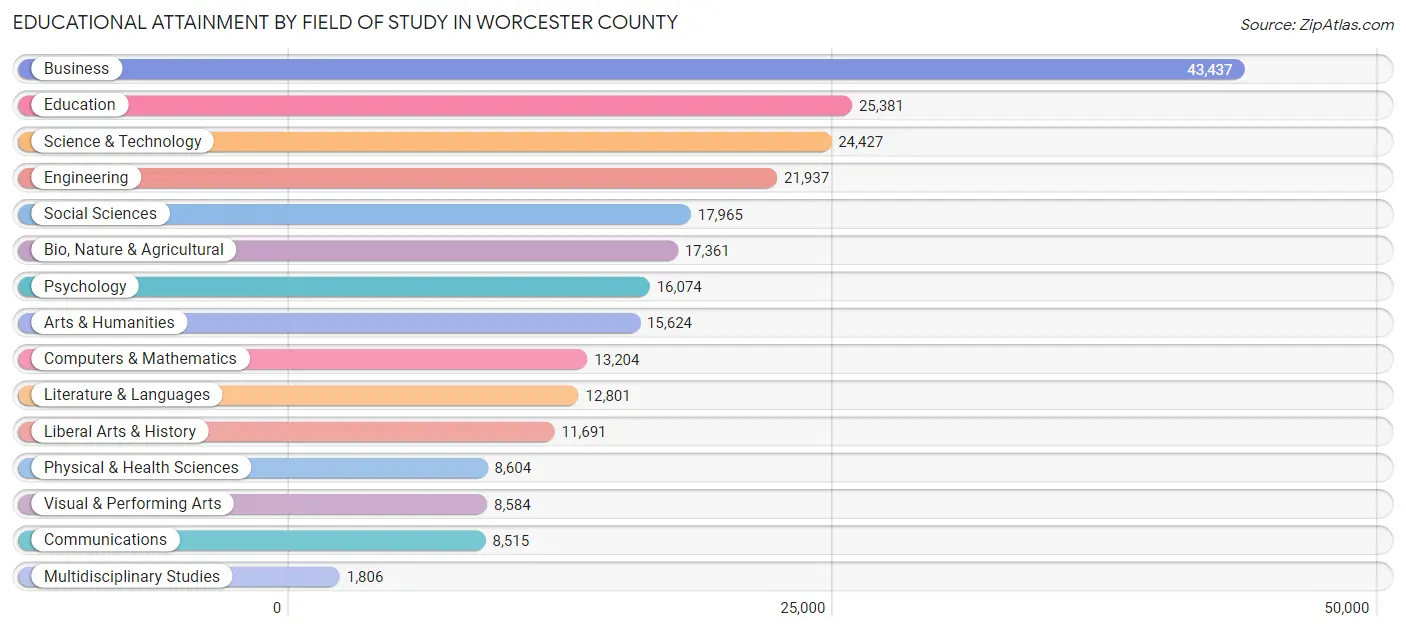
Educational Attainment by Field of Study in Worcester County
Business (43,437 | 17.6%), education (25,381 | 10.3%), science & technology (24,427 | 9.9%), engineering (21,937 | 8.9%), and social sciences (17,965 | 7.3%) are the most common fields of study among 247,411 individuals in Worcester County who have obtained a bachelor's degree or higher.
| Field of Study | # Graduates | % Graduates |
| Computers & Mathematics | 13,204 | 5.3% |
| Bio, Nature & Agricultural | 17,361 | 7.0% |
| Physical & Health Sciences | 8,604 | 3.5% |
| Psychology | 16,074 | 6.5% |
| Social Sciences | 17,965 | 7.3% |
| Engineering | 21,937 | 8.9% |
| Multidisciplinary Studies | 1,806 | 0.7% |
| Science & Technology | 24,427 | 9.9% |
| Business | 43,437 | 17.6% |
| Education | 25,381 | 10.3% |
| Literature & Languages | 12,801 | 5.2% |
| Liberal Arts & History | 11,691 | 4.7% |
| Visual & Performing Arts | 8,584 | 3.5% |
| Communications | 8,515 | 3.4% |
| Arts & Humanities | 15,624 | 6.3% |
| Total | 247,411 | 100.0% |
Transportation & Commute in Worcester County
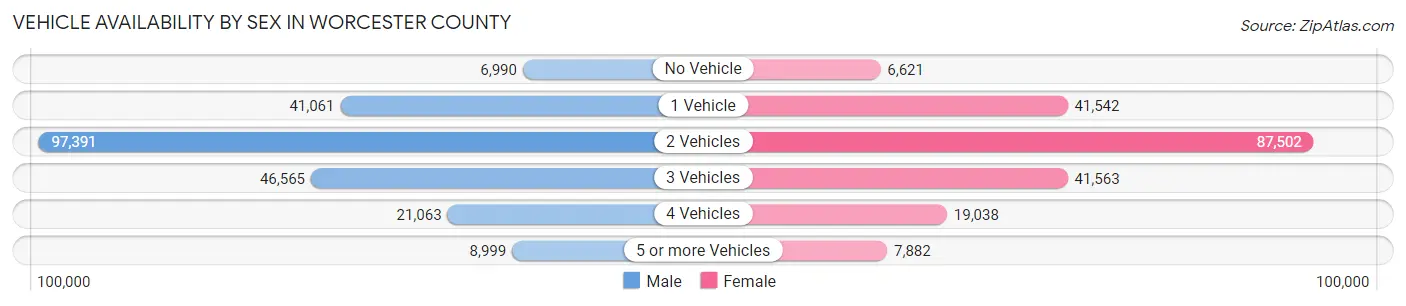
Vehicle Availability by Sex in Worcester County
The most prevalent vehicle ownership categories in Worcester County are males with 2 vehicles (97,391, accounting for 43.9%) and females with 2 vehicles (87,502, making up 47.7%).
| Vehicles Available | Male | Female |
| No Vehicle | 6,990 (3.2%) | 6,621 (3.2%) |
| 1 Vehicle | 41,061 (18.5%) | 41,542 (20.3%) |
| 2 Vehicles | 97,391 (43.9%) | 87,502 (42.9%) |
| 3 Vehicles | 46,565 (21.0%) | 41,563 (20.4%) |
| 4 Vehicles | 21,063 (9.5%) | 19,038 (9.3%) |
| 5 or more Vehicles | 8,999 (4.1%) | 7,882 (3.9%) |
| Total | 222,069 (100.0%) | 204,148 (100.0%) |
Commute Time in Worcester County
The most frequently occuring commute durations in Worcester County are 30 to 34 minutes (50,119 commuters, 13.3%), 15 to 19 minutes (49,078 commuters, 13.0%), and 10 to 14 minutes (48,263 commuters, 12.8%).
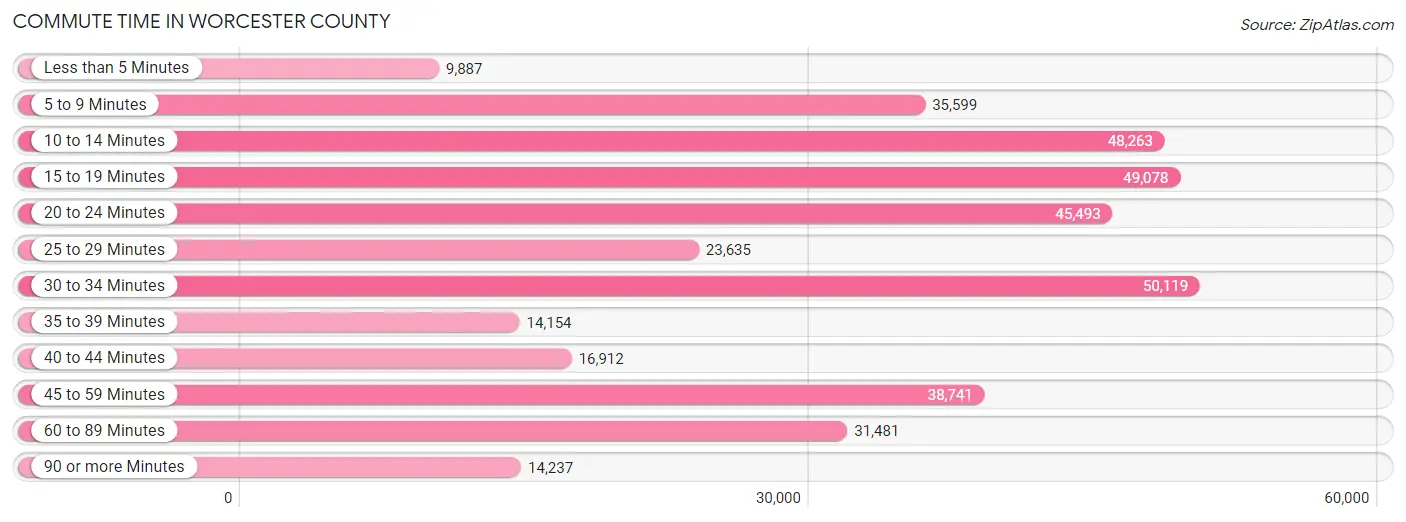
| Commute Time | # Commuters | % Commuters |
| Less than 5 Minutes | 9,887 | 2.6% |
| 5 to 9 Minutes | 35,599 | 9.4% |
| 10 to 14 Minutes | 48,263 | 12.8% |
| 15 to 19 Minutes | 49,078 | 13.0% |
| 20 to 24 Minutes | 45,493 | 12.0% |
| 25 to 29 Minutes | 23,635 | 6.3% |
| 30 to 34 Minutes | 50,119 | 13.3% |
| 35 to 39 Minutes | 14,154 | 3.7% |
| 40 to 44 Minutes | 16,912 | 4.5% |
| 45 to 59 Minutes | 38,741 | 10.3% |
| 60 to 89 Minutes | 31,481 | 8.3% |
| 90 or more Minutes | 14,237 | 3.8% |
Commute Time by Sex in Worcester County
The most common commute times in Worcester County are 30 to 34 minutes (26,664 commuters, 13.6%) for males and 15 to 19 minutes (25,747 commuters, 14.2%) for females.
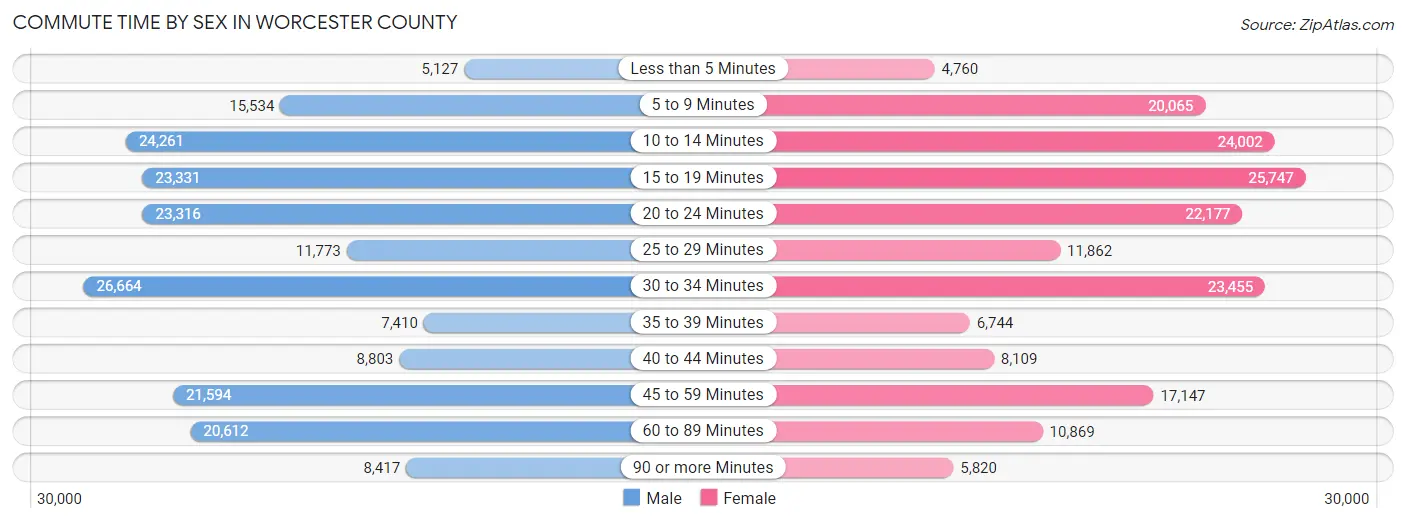
| Commute Time | Male | Female |
| Less than 5 Minutes | 5,127 (2.6%) | 4,760 (2.6%) |
| 5 to 9 Minutes | 15,534 (7.9%) | 20,065 (11.1%) |
| 10 to 14 Minutes | 24,261 (12.3%) | 24,002 (13.3%) |
| 15 to 19 Minutes | 23,331 (11.8%) | 25,747 (14.2%) |
| 20 to 24 Minutes | 23,316 (11.8%) | 22,177 (12.3%) |
| 25 to 29 Minutes | 11,773 (6.0%) | 11,862 (6.6%) |
| 30 to 34 Minutes | 26,664 (13.6%) | 23,455 (13.0%) |
| 35 to 39 Minutes | 7,410 (3.8%) | 6,744 (3.7%) |
| 40 to 44 Minutes | 8,803 (4.5%) | 8,109 (4.5%) |
| 45 to 59 Minutes | 21,594 (11.0%) | 17,147 (9.5%) |
| 60 to 89 Minutes | 20,612 (10.5%) | 10,869 (6.0%) |
| 90 or more Minutes | 8,417 (4.3%) | 5,820 (3.2%) |
Time of Departure to Work by Sex in Worcester County
The most frequent times of departure to work in Worcester County are 7:00 AM to 7:29 AM (29,075, 14.8%) for males and 7:00 AM to 7:29 AM (27,709, 15.3%) for females.
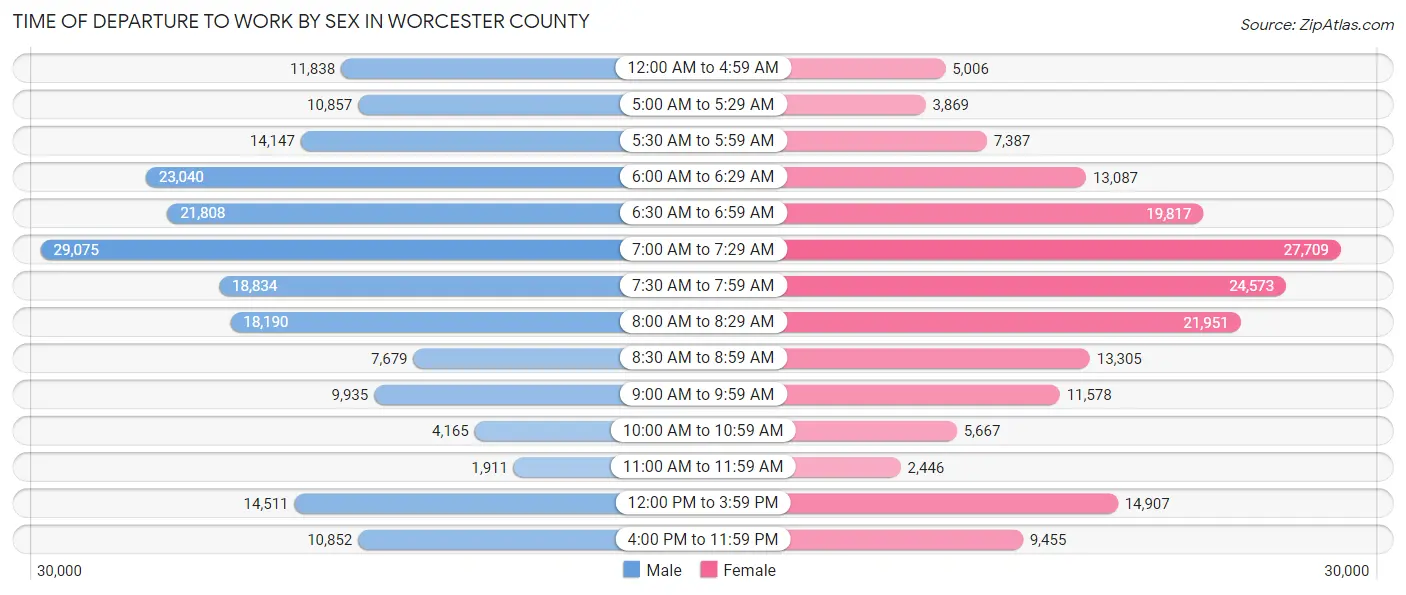
| Time of Departure | Male | Female |
| 12:00 AM to 4:59 AM | 11,838 (6.0%) | 5,006 (2.8%) |
| 5:00 AM to 5:29 AM | 10,857 (5.5%) | 3,869 (2.1%) |
| 5:30 AM to 5:59 AM | 14,147 (7.2%) | 7,387 (4.1%) |
| 6:00 AM to 6:29 AM | 23,040 (11.7%) | 13,087 (7.2%) |
| 6:30 AM to 6:59 AM | 21,808 (11.1%) | 19,817 (11.0%) |
| 7:00 AM to 7:29 AM | 29,075 (14.8%) | 27,709 (15.3%) |
| 7:30 AM to 7:59 AM | 18,834 (9.6%) | 24,573 (13.6%) |
| 8:00 AM to 8:29 AM | 18,190 (9.2%) | 21,951 (12.1%) |
| 8:30 AM to 8:59 AM | 7,679 (3.9%) | 13,305 (7.4%) |
| 9:00 AM to 9:59 AM | 9,935 (5.1%) | 11,578 (6.4%) |
| 10:00 AM to 10:59 AM | 4,165 (2.1%) | 5,667 (3.1%) |
| 11:00 AM to 11:59 AM | 1,911 (1.0%) | 2,446 (1.3%) |
| 12:00 PM to 3:59 PM | 14,511 (7.4%) | 14,907 (8.3%) |
| 4:00 PM to 11:59 PM | 10,852 (5.5%) | 9,455 (5.2%) |
| Total | 196,842 (100.0%) | 180,757 (100.0%) |
Housing Occupancy in Worcester County
Occupancy by Ownership in Worcester County
Of the total 330,319 dwellings in Worcester County, owner-occupied units account for 217,813 (65.9%), while renter-occupied units make up 112,506 (34.1%).
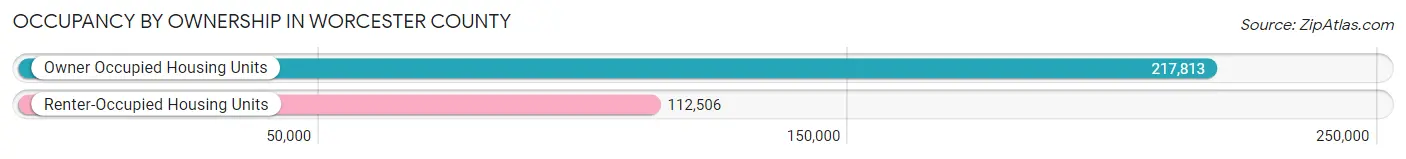
| Occupancy | # Housing Units | % Housing Units |
| Owner Occupied Housing Units | 217,813 | 65.9% |
| Renter-Occupied Housing Units | 112,506 | 34.1% |
| Total Occupied Housing Units | 330,319 | 100.0% |
Occupancy by Household Size in Worcester County
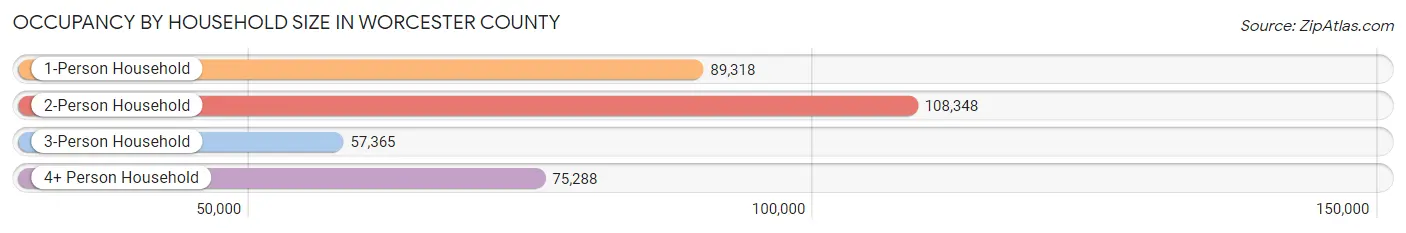
| Household Size | # Housing Units | % Housing Units |
| 1-Person Household | 89,318 | 27.0% |
| 2-Person Household | 108,348 | 32.8% |
| 3-Person Household | 57,365 | 17.4% |
| 4+ Person Household | 75,288 | 22.8% |
| Total Housing Units | 330,319 | 100.0% |
Occupancy by Ownership by Household Size in Worcester County
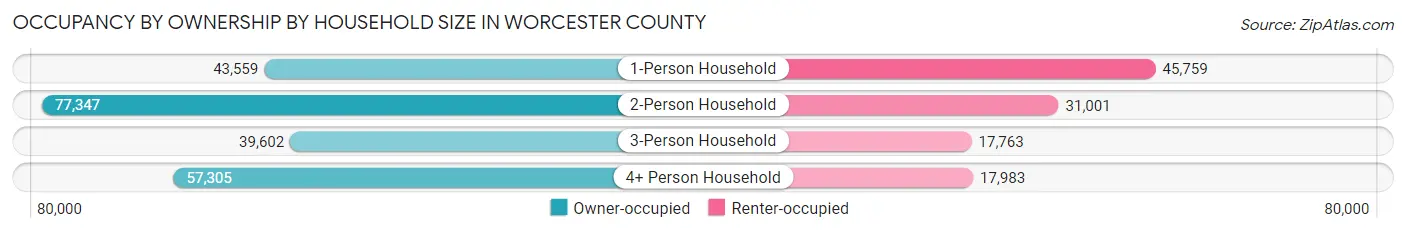
| Household Size | Owner-occupied | Renter-occupied |
| 1-Person Household | 43,559 (48.8%) | 45,759 (51.2%) |
| 2-Person Household | 77,347 (71.4%) | 31,001 (28.6%) |
| 3-Person Household | 39,602 (69.0%) | 17,763 (31.0%) |
| 4+ Person Household | 57,305 (76.1%) | 17,983 (23.9%) |
| Total Housing Units | 217,813 (65.9%) | 112,506 (34.1%) |
Occupancy by Educational Attainment in Worcester County
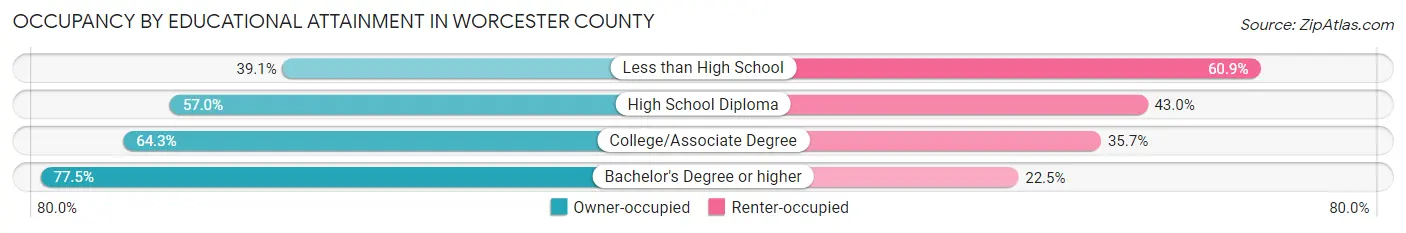
| Household Size | Owner-occupied | Renter-occupied |
| Less than High School | 9,442 (39.1%) | 14,712 (60.9%) |
| High School Diploma | 45,571 (57.0%) | 34,422 (43.0%) |
| College/Associate Degree | 60,803 (64.3%) | 33,697 (35.7%) |
| Bachelor's Degree or higher | 101,997 (77.5%) | 29,675 (22.5%) |
Occupancy by Age of Householder in Worcester County
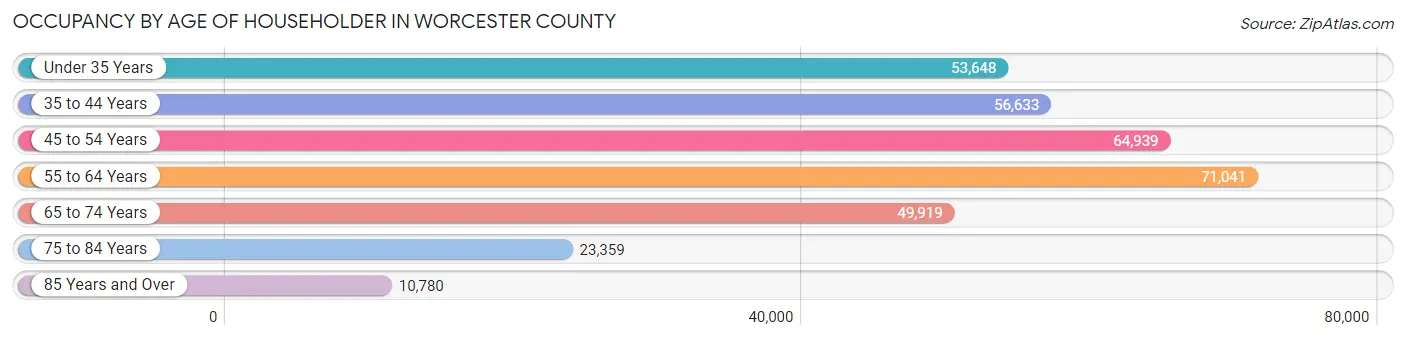
| Age Bracket | # Households | % Households |
| Under 35 Years | 53,648 | 16.2% |
| 35 to 44 Years | 56,633 | 17.1% |
| 45 to 54 Years | 64,939 | 19.7% |
| 55 to 64 Years | 71,041 | 21.5% |
| 65 to 74 Years | 49,919 | 15.1% |
| 75 to 84 Years | 23,359 | 7.1% |
| 85 Years and Over | 10,780 | 3.3% |
| Total | 330,319 | 100.0% |
Housing Finances in Worcester County
Median Income by Occupancy in Worcester County
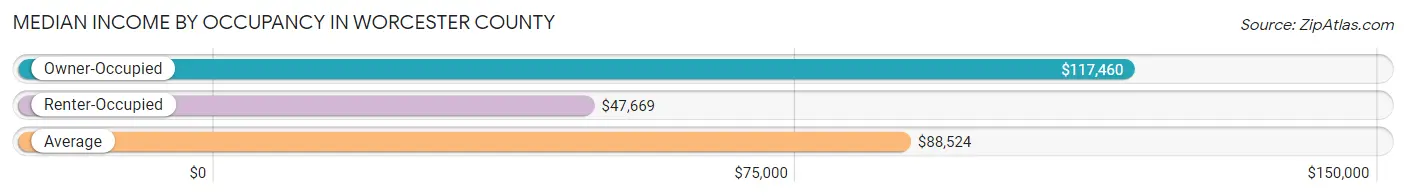
| Occupancy Type | # Households | Median Income |
| Owner-Occupied | 217,813 (65.9%) | $117,460 |
| Renter-Occupied | 112,506 (34.1%) | $47,669 |
| Average | 330,319 (100.0%) | $88,524 |
Occupancy by Householder Income Bracket in Worcester County
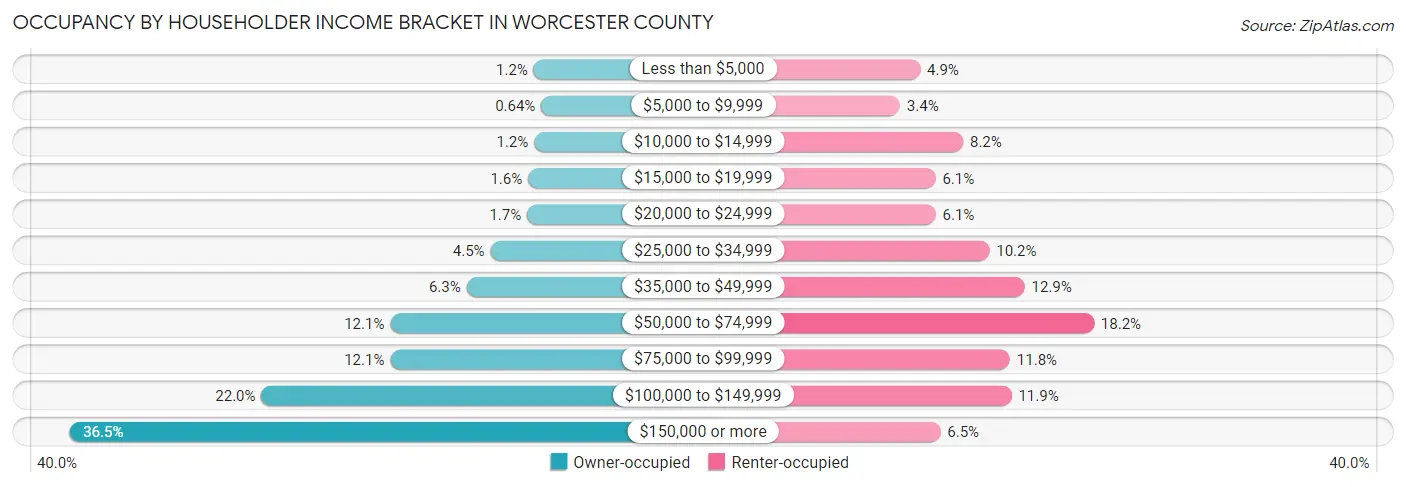
| Income Bracket | Owner-occupied | Renter-occupied |
| Less than $5,000 | 2,631 (1.2%) | 5,538 (4.9%) |
| $5,000 to $9,999 | 1,393 (0.6%) | 3,799 (3.4%) |
| $10,000 to $14,999 | 2,564 (1.2%) | 9,209 (8.2%) |
| $15,000 to $19,999 | 3,572 (1.6%) | 6,850 (6.1%) |
| $20,000 to $24,999 | 3,744 (1.7%) | 6,859 (6.1%) |
| $25,000 to $34,999 | 9,827 (4.5%) | 11,461 (10.2%) |
| $35,000 to $49,999 | 13,797 (6.3%) | 14,491 (12.9%) |
| $50,000 to $74,999 | 26,442 (12.1%) | 20,432 (18.2%) |
| $75,000 to $99,999 | 26,447 (12.1%) | 13,235 (11.8%) |
| $100,000 to $149,999 | 47,833 (22.0%) | 13,364 (11.9%) |
| $150,000 or more | 79,563 (36.5%) | 7,268 (6.5%) |
| Total | 217,813 (100.0%) | 112,506 (100.0%) |
Monthly Housing Cost Tiers in Worcester County
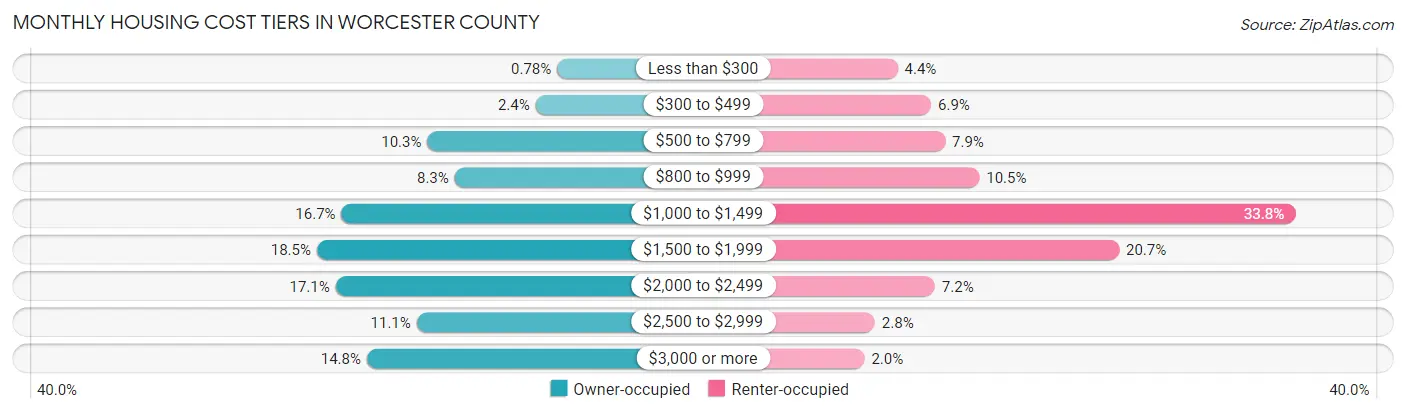
| Monthly Cost | Owner-occupied | Renter-occupied |
| Less than $300 | 1,695 (0.8%) | 4,987 (4.4%) |
| $300 to $499 | 5,162 (2.4%) | 7,762 (6.9%) |
| $500 to $799 | 22,532 (10.3%) | 8,927 (7.9%) |
| $800 to $999 | 18,143 (8.3%) | 11,758 (10.4%) |
| $1,000 to $1,499 | 36,300 (16.7%) | 37,989 (33.8%) |
| $1,500 to $1,999 | 40,250 (18.5%) | 23,333 (20.7%) |
| $2,000 to $2,499 | 37,245 (17.1%) | 8,075 (7.2%) |
| $2,500 to $2,999 | 24,240 (11.1%) | 3,100 (2.8%) |
| $3,000 or more | 32,246 (14.8%) | 2,243 (2.0%) |
| Total | 217,813 (100.0%) | 112,506 (100.0%) |
Physical Housing Characteristics in Worcester County
Housing Structures in Worcester County
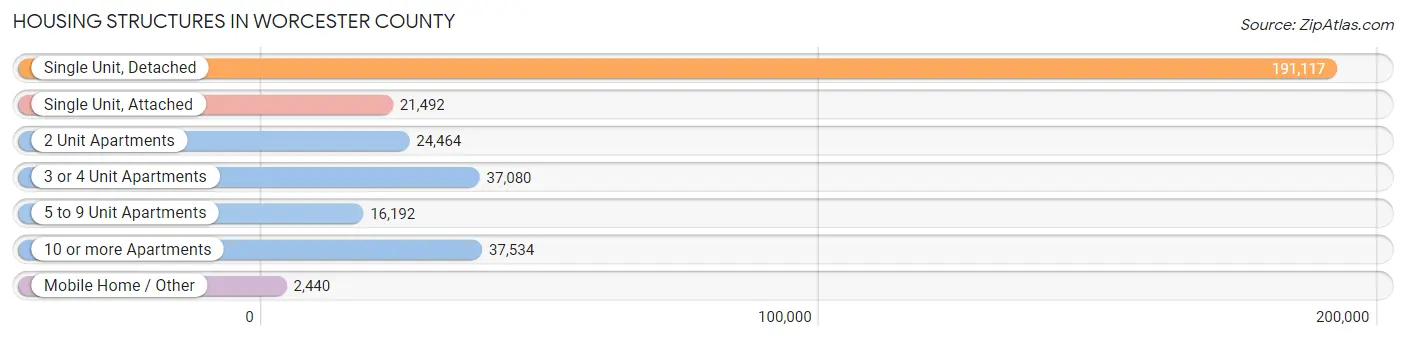
| Structure Type | # Housing Units | % Housing Units |
| Single Unit, Detached | 191,117 | 57.9% |
| Single Unit, Attached | 21,492 | 6.5% |
| 2 Unit Apartments | 24,464 | 7.4% |
| 3 or 4 Unit Apartments | 37,080 | 11.2% |
| 5 to 9 Unit Apartments | 16,192 | 4.9% |
| 10 or more Apartments | 37,534 | 11.4% |
| Mobile Home / Other | 2,440 | 0.7% |
| Total | 330,319 | 100.0% |
Housing Structures by Occupancy in Worcester County
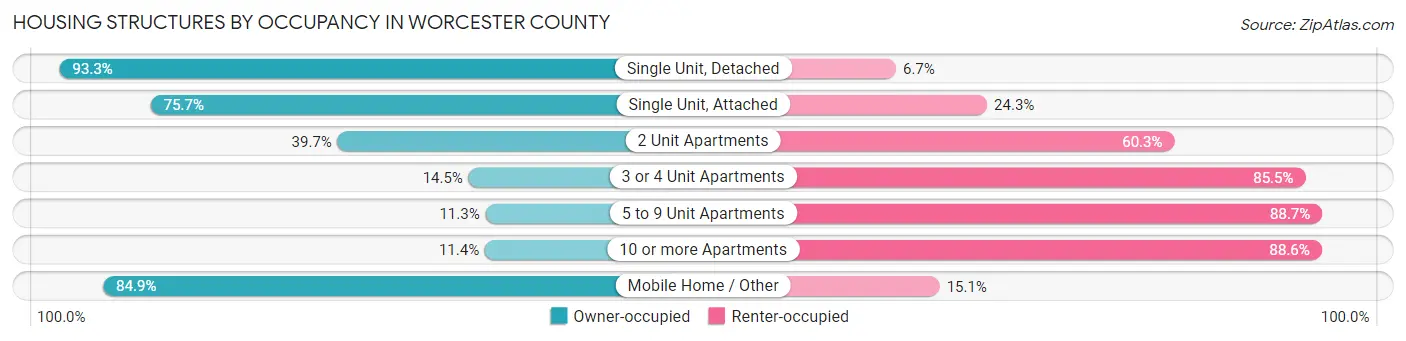
| Structure Type | Owner-occupied | Renter-occupied |
| Single Unit, Detached | 178,287 (93.3%) | 12,830 (6.7%) |
| Single Unit, Attached | 16,277 (75.7%) | 5,215 (24.3%) |
| 2 Unit Apartments | 9,716 (39.7%) | 14,748 (60.3%) |
| 3 or 4 Unit Apartments | 5,373 (14.5%) | 31,707 (85.5%) |
| 5 to 9 Unit Apartments | 1,824 (11.3%) | 14,368 (88.7%) |
| 10 or more Apartments | 4,265 (11.4%) | 33,269 (88.6%) |
| Mobile Home / Other | 2,071 (84.9%) | 369 (15.1%) |
| Total | 217,813 (65.9%) | 112,506 (34.1%) |
Housing Structures by Number of Rooms in Worcester County
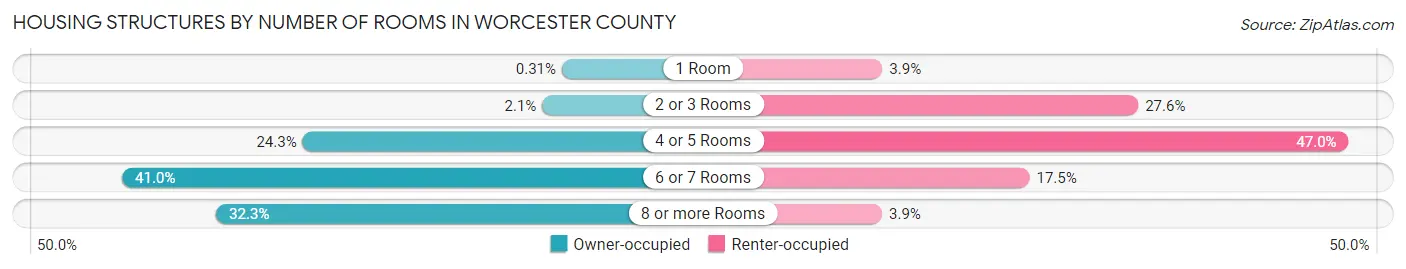
| Number of Rooms | Owner-occupied | Renter-occupied |
| 1 Room | 667 (0.3%) | 4,421 (3.9%) |
| 2 or 3 Rooms | 4,636 (2.1%) | 31,039 (27.6%) |
| 4 or 5 Rooms | 52,924 (24.3%) | 52,917 (47.0%) |
| 6 or 7 Rooms | 89,260 (41.0%) | 19,737 (17.5%) |
| 8 or more Rooms | 70,326 (32.3%) | 4,392 (3.9%) |
| Total | 217,813 (100.0%) | 112,506 (100.0%) |
Housing Structure by Heating Type in Worcester County
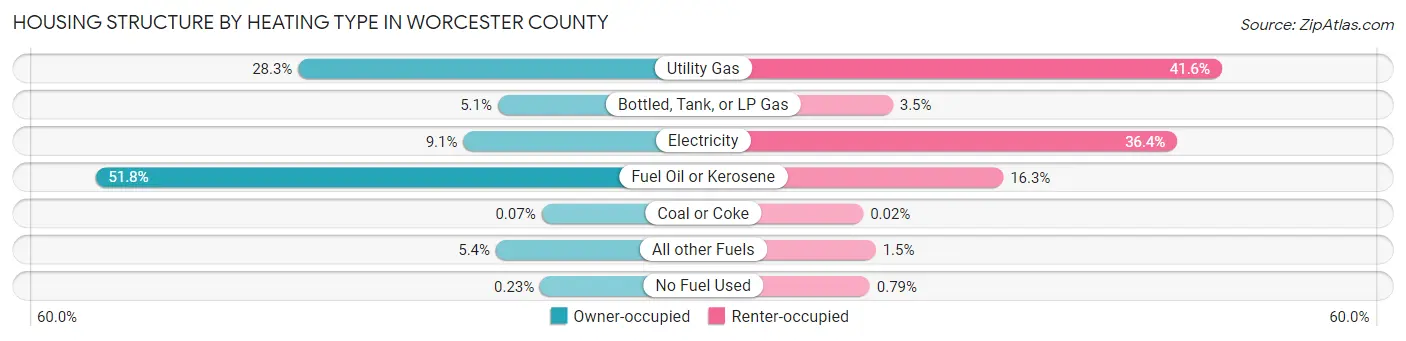
| Heating Type | Owner-occupied | Renter-occupied |
| Utility Gas | 61,593 (28.3%) | 46,802 (41.6%) |
| Bottled, Tank, or LP Gas | 11,185 (5.1%) | 3,876 (3.5%) |
| Electricity | 19,917 (9.1%) | 40,972 (36.4%) |
| Fuel Oil or Kerosene | 112,797 (51.8%) | 18,285 (16.3%) |
| Coal or Coke | 150 (0.1%) | 26 (0.0%) |
| All other Fuels | 11,664 (5.4%) | 1,654 (1.5%) |
| No Fuel Used | 507 (0.2%) | 891 (0.8%) |
| Total | 217,813 (100.0%) | 112,506 (100.0%) |
Household Vehicle Usage in Worcester County
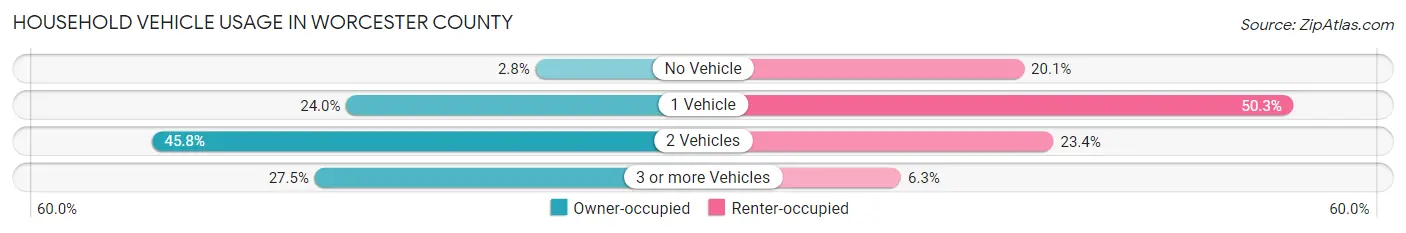
| Vehicles per Household | Owner-occupied | Renter-occupied |
| No Vehicle | 6,008 (2.8%) | 22,590 (20.1%) |
| 1 Vehicle | 52,181 (24.0%) | 56,548 (50.3%) |
| 2 Vehicles | 99,721 (45.8%) | 26,292 (23.4%) |
| 3 or more Vehicles | 59,903 (27.5%) | 7,076 (6.3%) |
| Total | 217,813 (100.0%) | 112,506 (100.0%) |
Real Estate & Mortgages in Worcester County
Real Estate and Mortgage Overview in Worcester County
| Characteristic | Without Mortgage | With Mortgage |
| Housing Units | 66,858 | 150,955 |
| Median Property Value | $347,600 | $369,600 |
| Median Household Income | $79,628 | $63,814 |
| Monthly Housing Costs | $867 | $31,908 |
| Real Estate Taxes | $4,844 | $1,723 |
Property Value by Mortgage Status in Worcester County
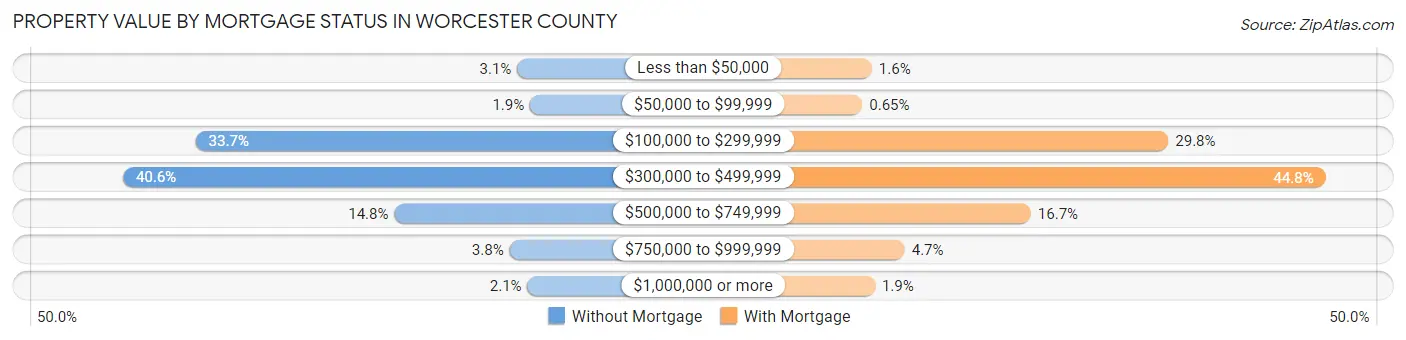
| Property Value | Without Mortgage | With Mortgage |
| Less than $50,000 | 2,067 (3.1%) | 2,360 (1.6%) |
| $50,000 to $99,999 | 1,242 (1.9%) | 982 (0.6%) |
| $100,000 to $299,999 | 22,535 (33.7%) | 44,964 (29.8%) |
| $300,000 to $499,999 | 27,165 (40.6%) | 67,560 (44.8%) |
| $500,000 to $749,999 | 9,885 (14.8%) | 25,211 (16.7%) |
| $750,000 to $999,999 | 2,553 (3.8%) | 7,080 (4.7%) |
| $1,000,000 or more | 1,411 (2.1%) | 2,798 (1.8%) |
| Total | 66,858 (100.0%) | 150,955 (100.0%) |
Household Income by Mortgage Status in Worcester County
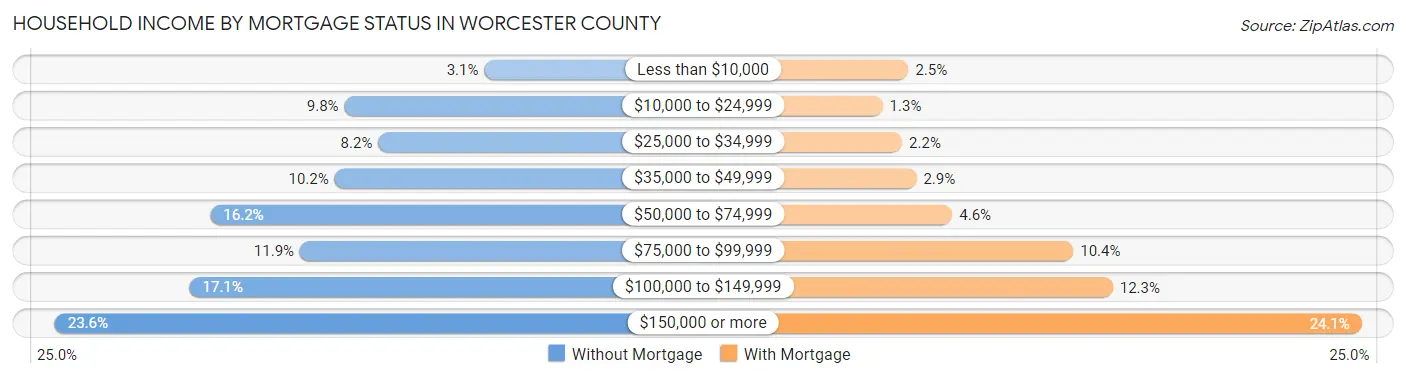
| Household Income | Without Mortgage | With Mortgage |
| Less than $10,000 | 2,078 (3.1%) | 3,798 (2.5%) |
| $10,000 to $24,999 | 6,529 (9.8%) | 1,946 (1.3%) |
| $25,000 to $34,999 | 5,456 (8.2%) | 3,351 (2.2%) |
| $35,000 to $49,999 | 6,843 (10.2%) | 4,371 (2.9%) |
| $50,000 to $74,999 | 10,795 (16.2%) | 6,954 (4.6%) |
| $75,000 to $99,999 | 7,950 (11.9%) | 15,647 (10.4%) |
| $100,000 to $149,999 | 11,458 (17.1%) | 18,497 (12.2%) |
| $150,000 or more | 15,749 (23.6%) | 36,375 (24.1%) |
| Total | 66,858 (100.0%) | 150,955 (100.0%) |
Property Value to Household Income Ratio in Worcester County
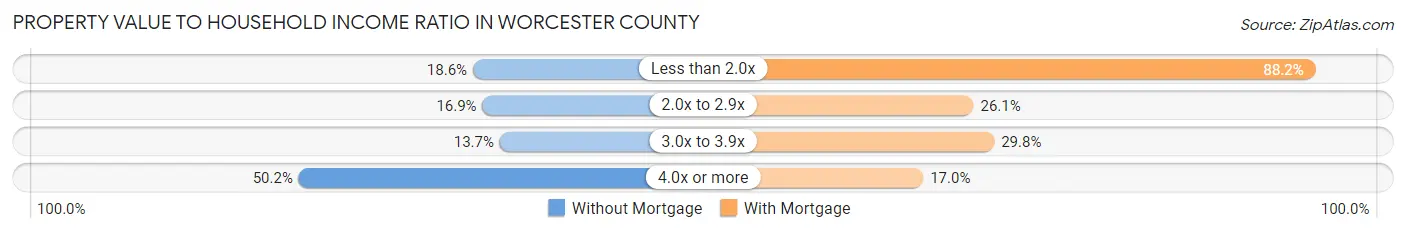
| Value-to-Income Ratio | Without Mortgage | With Mortgage |
| Less than 2.0x | 12,422 (18.6%) | 133,138 (88.2%) |
| 2.0x to 2.9x | 11,263 (16.9%) | 39,362 (26.1%) |
| 3.0x to 3.9x | 9,161 (13.7%) | 45,043 (29.8%) |
| 4.0x or more | 33,568 (50.2%) | 25,581 (17.0%) |
| Total | 66,858 (100.0%) | 150,955 (100.0%) |
Real Estate Taxes by Mortgage Status in Worcester County
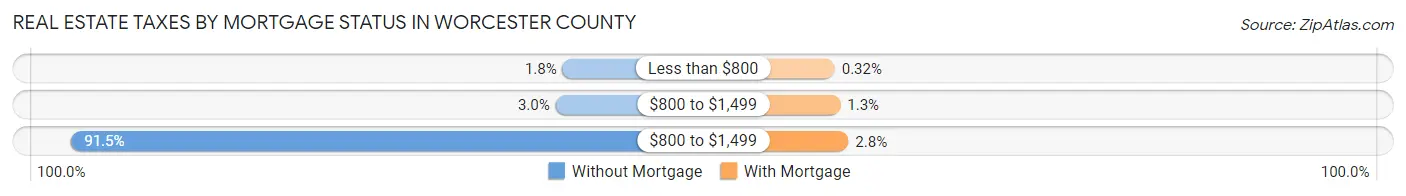
| Property Taxes | Without Mortgage | With Mortgage |
| Less than $800 | 1,167 (1.8%) | 486 (0.3%) |
| $800 to $1,499 | 2,020 (3.0%) | 2,007 (1.3%) |
| $800 to $1,499 | 61,153 (91.5%) | 4,244 (2.8%) |
| Total | 66,858 (100.0%) | 150,955 (100.0%) |
Health & Disability in Worcester County
Health Insurance Coverage by Age in Worcester County
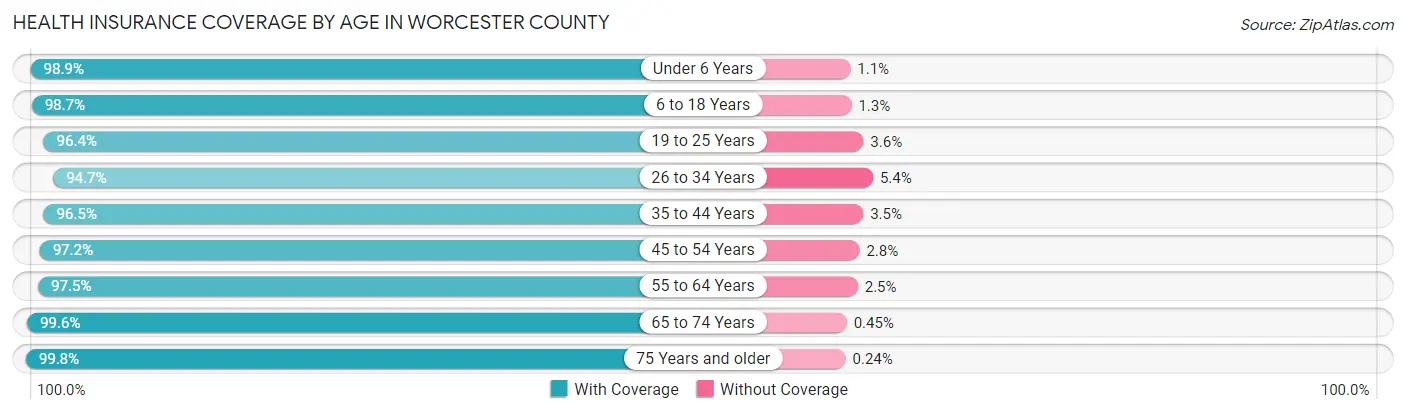
| Age Bracket | With Coverage | Without Coverage |
| Under 6 Years | 52,488 (98.9%) | 602 (1.1%) |
| 6 to 18 Years | 135,557 (98.7%) | 1,836 (1.3%) |
| 19 to 25 Years | 76,988 (96.4%) | 2,844 (3.6%) |
| 26 to 34 Years | 94,052 (94.7%) | 5,312 (5.3%) |
| 35 to 44 Years | 102,716 (96.5%) | 3,764 (3.5%) |
| 45 to 54 Years | 112,041 (97.2%) | 3,268 (2.8%) |
| 55 to 64 Years | 119,562 (97.5%) | 3,080 (2.5%) |
| 65 to 74 Years | 81,544 (99.6%) | 372 (0.4%) |
| 75 Years and older | 52,527 (99.8%) | 128 (0.2%) |
| Total | 827,475 (97.5%) | 21,206 (2.5%) |
Health Insurance Coverage by Citizenship Status in Worcester County
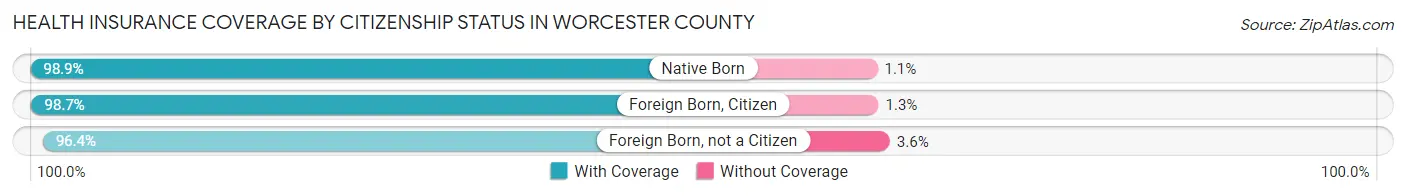
| Citizenship Status | With Coverage | Without Coverage |
| Native Born | 52,488 (98.9%) | 602 (1.1%) |
| Foreign Born, Citizen | 135,557 (98.7%) | 1,836 (1.3%) |
| Foreign Born, not a Citizen | 76,988 (96.4%) | 2,844 (3.6%) |
Health Insurance Coverage by Household Income in Worcester County
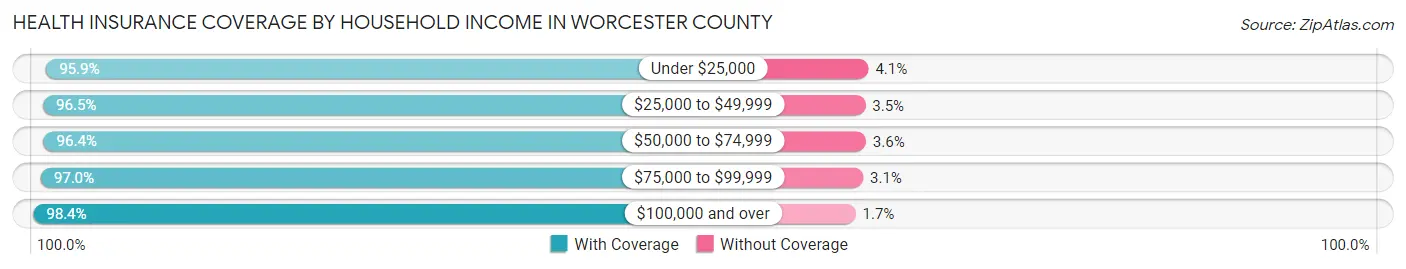
| Household Income | With Coverage | Without Coverage |
| Under $25,000 | 71,460 (95.9%) | 3,026 (4.1%) |
| $25,000 to $49,999 | 96,378 (96.5%) | 3,478 (3.5%) |
| $50,000 to $74,999 | 97,834 (96.4%) | 3,630 (3.6%) |
| $75,000 to $99,999 | 95,055 (97.0%) | 2,992 (3.0%) |
| $100,000 and over | 449,775 (98.4%) | 7,542 (1.7%) |
Public vs Private Health Insurance Coverage by Age in Worcester County
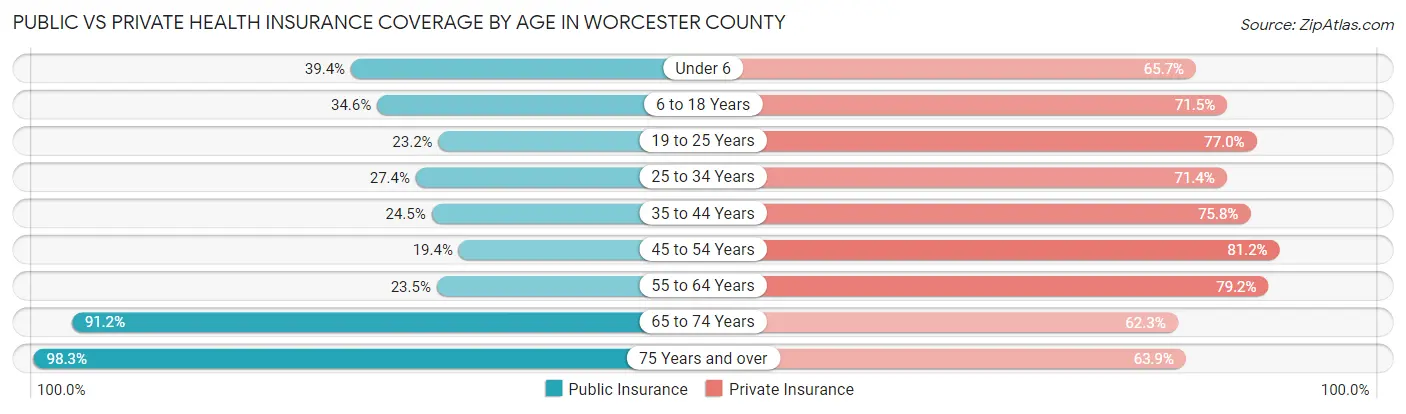
| Age Bracket | Public Insurance | Private Insurance |
| Under 6 | 20,932 (39.4%) | 34,890 (65.7%) |
| 6 to 18 Years | 47,515 (34.6%) | 98,235 (71.5%) |
| 19 to 25 Years | 18,515 (23.2%) | 61,429 (76.9%) |
| 25 to 34 Years | 27,219 (27.4%) | 70,978 (71.4%) |
| 35 to 44 Years | 26,059 (24.5%) | 80,714 (75.8%) |
| 45 to 54 Years | 22,390 (19.4%) | 93,661 (81.2%) |
| 55 to 64 Years | 28,822 (23.5%) | 97,097 (79.2%) |
| 65 to 74 Years | 74,731 (91.2%) | 51,037 (62.3%) |
| 75 Years and over | 51,769 (98.3%) | 33,622 (63.8%) |
| Total | 317,952 (37.5%) | 621,663 (73.3%) |
Disability Status by Sex by Age in Worcester County
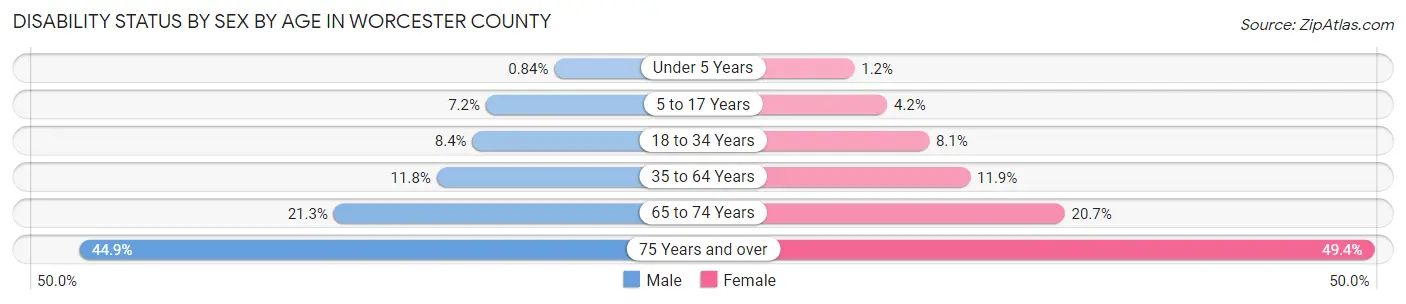
| Age Bracket | Male | Female |
| Under 5 Years | 193 (0.8%) | 251 (1.2%) |
| 5 to 17 Years | 4,915 (7.2%) | 2,732 (4.2%) |
| 18 to 34 Years | 8,186 (8.4%) | 7,678 (8.1%) |
| 35 to 64 Years | 20,153 (11.8%) | 20,610 (11.9%) |
| 65 to 74 Years | 8,394 (21.3%) | 8,791 (20.7%) |
| 75 Years and over | 9,586 (44.9%) | 15,481 (49.4%) |
Disability Class by Sex by Age in Worcester County
Disability Class: Hearing Difficulty
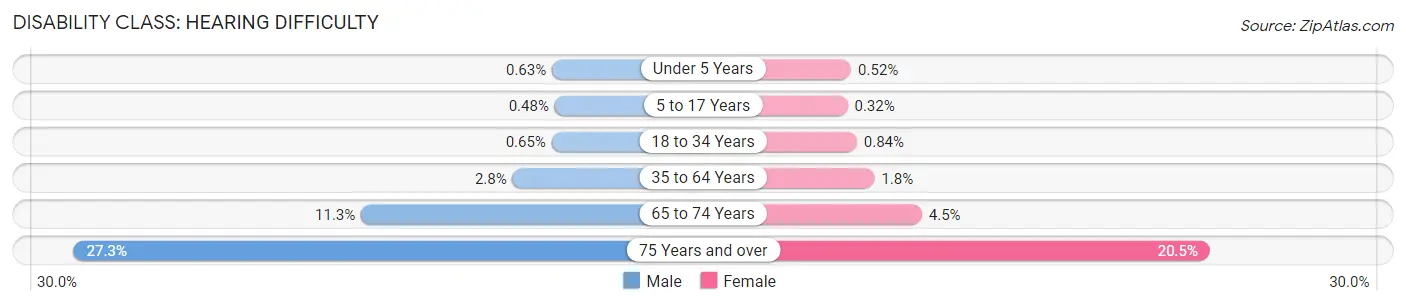
| Age Bracket | Male | Female |
| Under 5 Years | 143 (0.6%) | 113 (0.5%) |
| 5 to 17 Years | 330 (0.5%) | 207 (0.3%) |
| 18 to 34 Years | 631 (0.6%) | 793 (0.8%) |
| 35 to 64 Years | 4,842 (2.8%) | 3,151 (1.8%) |
| 65 to 74 Years | 4,434 (11.3%) | 1,898 (4.5%) |
| 75 Years and over | 5,816 (27.3%) | 6,419 (20.5%) |
Disability Class: Vision Difficulty
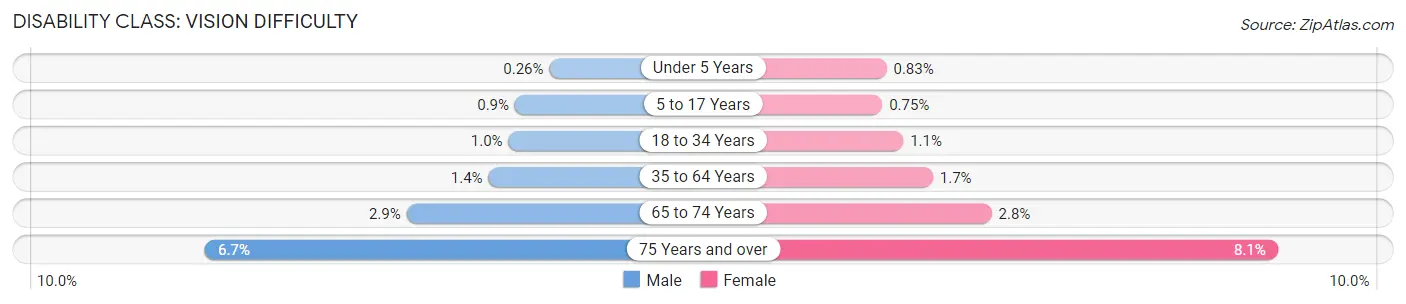
| Age Bracket | Male | Female |
| Under 5 Years | 59 (0.3%) | 179 (0.8%) |
| 5 to 17 Years | 612 (0.9%) | 485 (0.7%) |
| 18 to 34 Years | 984 (1.0%) | 1,082 (1.1%) |
| 35 to 64 Years | 2,377 (1.4%) | 2,925 (1.7%) |
| 65 to 74 Years | 1,146 (2.9%) | 1,183 (2.8%) |
| 75 Years and over | 1,419 (6.7%) | 2,533 (8.1%) |
Disability Class: Cognitive Difficulty
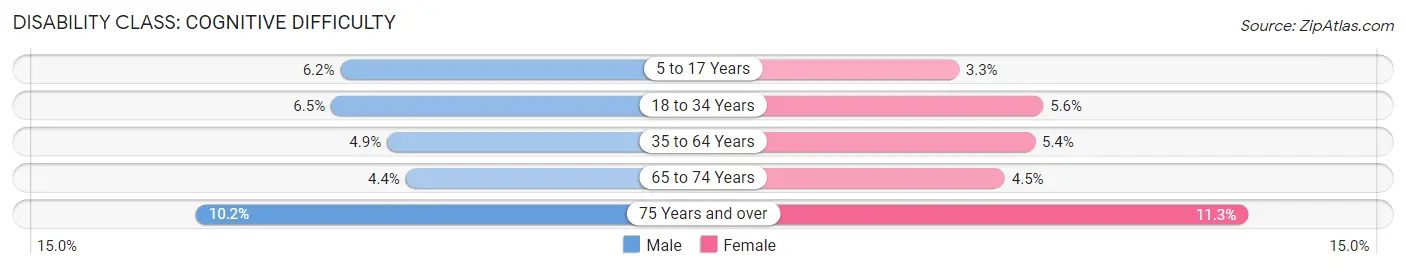
| Age Bracket | Male | Female |
| 5 to 17 Years | 4,241 (6.2%) | 2,124 (3.3%) |
| 18 to 34 Years | 6,270 (6.5%) | 5,327 (5.6%) |
| 35 to 64 Years | 8,414 (4.9%) | 9,317 (5.4%) |
| 65 to 74 Years | 1,729 (4.4%) | 1,930 (4.5%) |
| 75 Years and over | 2,182 (10.2%) | 3,544 (11.3%) |
Disability Class: Ambulatory Difficulty
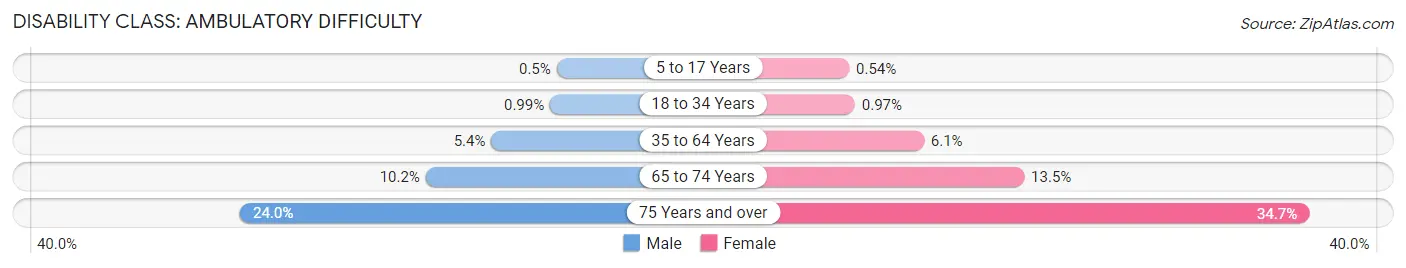
| Age Bracket | Male | Female |
| 5 to 17 Years | 342 (0.5%) | 353 (0.5%) |
| 18 to 34 Years | 956 (1.0%) | 919 (1.0%) |
| 35 to 64 Years | 9,165 (5.3%) | 10,541 (6.1%) |
| 65 to 74 Years | 4,027 (10.2%) | 5,757 (13.5%) |
| 75 Years and over | 5,119 (24.0%) | 10,866 (34.7%) |
Disability Class: Self-Care Difficulty
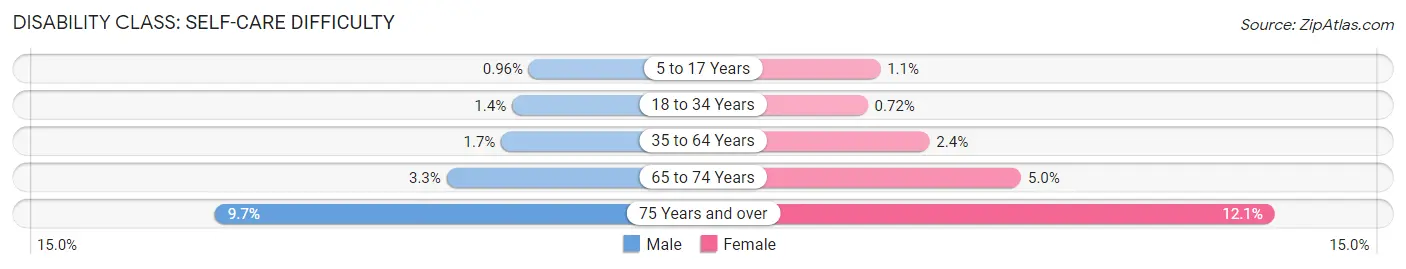
| Age Bracket | Male | Female |
| 5 to 17 Years | 652 (1.0%) | 695 (1.1%) |
| 18 to 34 Years | 1,388 (1.4%) | 688 (0.7%) |
| 35 to 64 Years | 2,970 (1.7%) | 4,228 (2.4%) |
| 65 to 74 Years | 1,279 (3.3%) | 2,121 (5.0%) |
| 75 Years and over | 2,070 (9.7%) | 3,775 (12.0%) |
Technology Access in Worcester County
Computing Device Access in Worcester County
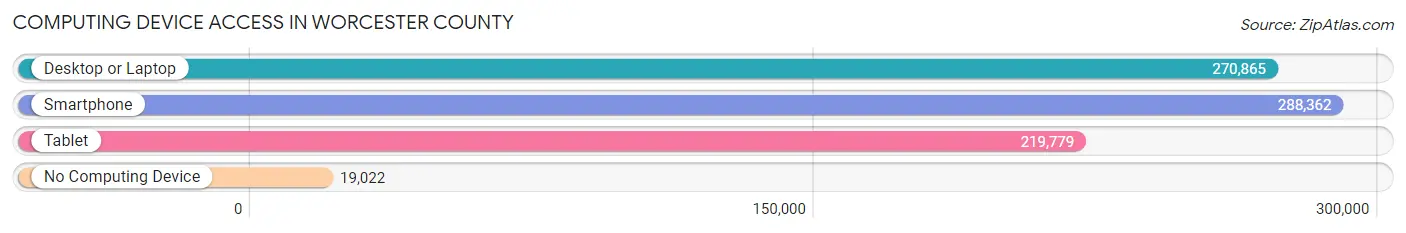
| Device Type | # Households | % Households |
| Desktop or Laptop | 270,865 | 82.0% |
| Smartphone | 288,362 | 87.3% |
| Tablet | 219,779 | 66.5% |
| No Computing Device | 19,022 | 5.8% |
| Total | 330,319 | 100.0% |
Internet Access in Worcester County
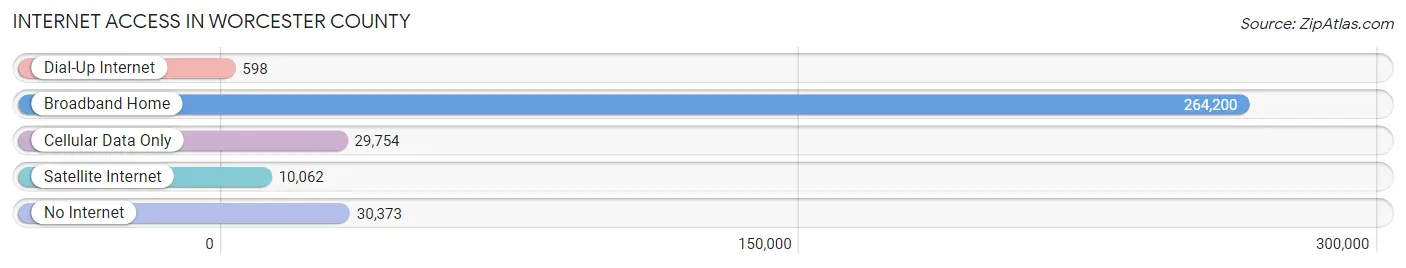
| Internet Type | # Households | % Households |
| Dial-Up Internet | 598 | 0.2% |
| Broadband Home | 264,200 | 80.0% |
| Cellular Data Only | 29,754 | 9.0% |
| Satellite Internet | 10,062 | 3.0% |
| No Internet | 30,373 | 9.2% |
| Total | 330,319 | 100.0% |
Worcester County Summary
Worcester County is located in the central part of Massachusetts and is the second most populous county in the state. It is bordered by Middlesex County to the north, Norfolk County to the east, Bristol County to the south, and Hampden County to the west. The county seat is the city of Worcester, which is also the largest city in the county. Worcester County is part of the Greater Boston metropolitan area and is home to a diverse population of over 800,000 people.
History
Worcester County was established in 1731 and was originally part of the Massachusetts Bay Colony. The county was named after the city of Worcester, England, which was the birthplace of the colony’s founder, John Winthrop. The county was originally divided into two townships, Worcester and Lancaster. In 1775, the county was divided into seven townships, which were later incorporated into the cities of Worcester, Fitchburg, Leominster, Gardner, Shrewsbury, and Westborough.
The county has a rich history of industry and manufacturing. In the 19th century, the county was home to a thriving textile industry, which was centered in the city of Worcester. The city was also home to a number of machine tool manufacturers, which helped to fuel the industrial revolution in the United States. In the 20th century, the county was home to a number of defense contractors, including the Raytheon Company, which is still headquartered in the city of Waltham.
Geography
Worcester County is located in the central part of Massachusetts and covers an area of 1,579 square miles. The county is bordered by Middlesex County to the north, Norfolk County to the east, Bristol County to the south, and Hampden County to the west. The county is divided into two distinct regions, the Blackstone Valley and the Central Massachusetts Plateau. The Blackstone Valley is located in the western part of the county and is characterized by rolling hills and valleys. The Central Massachusetts Plateau is located in the eastern part of the county and is characterized by flat, open land.
The county is home to a number of rivers, including the Blackstone River, the Nashua River, and the Quaboag River. The county is also home to a number of lakes, including Lake Quinsigamond, Lake Chargoggagoggmanchauggagoggchaubunagungamaugg, and Lake Rohunta.
Economy
Worcester County has a diverse economy that is centered around the city of Worcester. The county is home to a number of major employers, including the University of Massachusetts Medical School, UMass Memorial Health Care, and the Hanover Insurance Group. The county is also home to a number of manufacturing companies, including the Raytheon Company, which is headquartered in the city of Waltham.
The county is also home to a number of technology companies, including the software company EMC Corporation, which is headquartered in Hopkinton. The county is also home to a number of biotechnology companies, including Genzyme Corporation, which is headquartered in Cambridge.
Demographics
As of the 2010 census, Worcester County had a population of 816,817 people. The population was spread out with 24.3% under the age of 18, 10.3% from 18 to 24, 32.2% from 25 to 44, 22.2% from 45 to 64, and 10.9% who were 65 years of age or older. The median age was 36.3 years.
The racial makeup of the county was 79.2% White, 8.3% African American, 0.3% Native American, 5.2% Asian, 0.1% Pacific Islander, 4.2% from other races, and 2.7% from two or more races. Hispanic or Latino of any race were 8.7% of the population.
The median income for a household in the county was $60,879 and the median income for a family was $73,817. The per capita income for the county was $30,945. About 8.2% of families and 11.2% of the population were below the poverty line, including 15.2% of those under age 18 and 8.2% of those age 65 or over.
Common Questions
What is the Total Population of Worcester County?
Total Population of Worcester County is 858,898.
What is the Total Male Population of Worcester County?
Total Male Population of Worcester County is 426,680.
What is the Total Female Population of Worcester County?
Total Female Population of Worcester County is 432,218.
What is the Ratio of Males per 100 Females in Worcester County?
There are 98.72 Males per 100 Females in Worcester County.
What is the Ratio of Females per 100 Males in Worcester County?
There are 101.30 Females per 100 Males in Worcester County.
What is the Median Population Age in Worcester County?
Median Population Age in Worcester County is 40.2 Years.
What is the Average Family Size in Worcester County
Average Family Size in Worcester County is 3.1 People.
What is the Average Household Size in Worcester County
Average Household Size in Worcester County is 2.5 People.
What is Per Capita Income in Worcester County?
Per Capita income in Worcester County is $45,433.
What is the Median Family Income in Worcester County?
Median Family Income in Worcester County is $112,544.
What is the Median Household income in Worcester County?
Median Household Income in Worcester County is $88,524.
What is Income or Wage Gap in Worcester County?
Income or Wage Gap in Worcester County is 29.2%.
Women in Worcester County earn 70.8 cents for every dollar earned by a man.
What is Family Income Deficit in Worcester County?
Family Income Deficit in Worcester County is $10,289.
Families that are below poverty line in Worcester County earn $10,289 less on average than the poverty threshold level.
What is Inequality or Gini Index in Worcester County?
Inequality or Gini Index in Worcester County is 0.46.
How Large is the Labor Force in Worcester County?
There are 468,093 People in the Labor Forcein in Worcester County.
What is the Percentage of People in the Labor Force in Worcester County?
66.6% of People are in the Labor Force in Worcester County.
What is the Unemployment Rate in Worcester County?
Unemployment Rate in Worcester County is 5.6%.