Suffolk County, MA
Suffolk County Map
Suffolk County Overview
785,443
TOTAL POPULATION
380,529
MALE POPULATION
404,914
FEMALE POPULATION
93.98
MALES / 100 FEMALES
106.41
FEMALES / 100 MALES
33.6
MEDIAN AGE
3.1
AVG FAMILY SIZE
2.3
AVG HOUSEHOLD SIZE
$53,173
PER CAPITA INCOME
$102,723
AVG FAMILY INCOME
$87,669
AVG HOUSEHOLD INCOME
16.8%
WAGE / INCOME GAP [ % ]
83.2¢/ $1
WAGE / INCOME GAP [ $ ]
$10,840
FAMILY INCOME DEFICIT
0.53
INEQUALITY / GINI INDEX
467,030
LABOR FORCE [ PEOPLE ]
69.7%
PERCENT IN LABOR FORCE
6.7%
UNEMPLOYMENT RATE
Race in Suffolk County
The most populous races in Suffolk County are White / Caucasian (387,745 | 49.4%), Hispanic or Latino (184,846 | 23.5%), and Black / African American (155,625 | 19.8%).
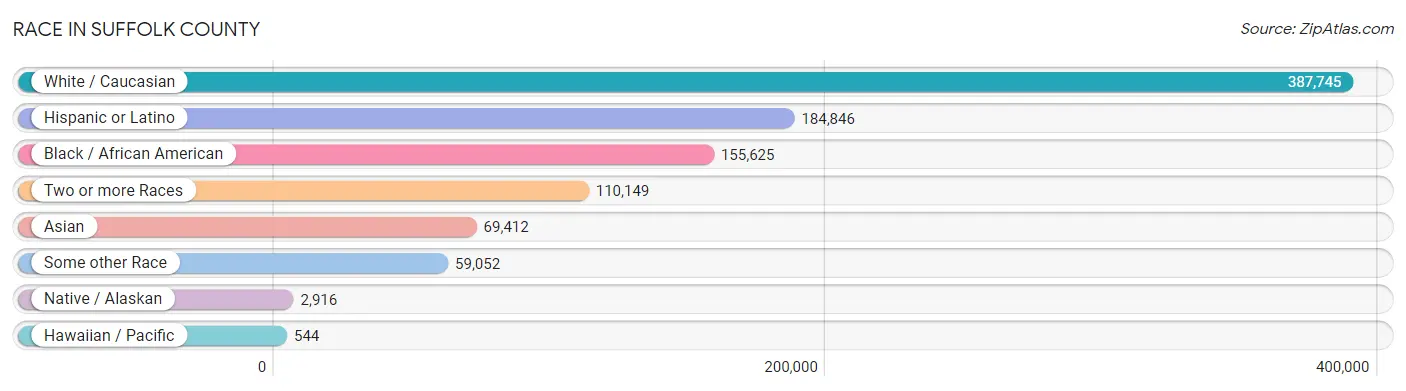
| Race | # Population | % Population |
| Asian | 69,412 | 8.8% |
| Black / African American | 155,625 | 19.8% |
| Hawaiian / Pacific | 544 | 0.1% |
| Hispanic or Latino | 184,846 | 23.5% |
| Native / Alaskan | 2,916 | 0.4% |
| White / Caucasian | 387,745 | 49.4% |
| Two or more Races | 110,149 | 14.0% |
| Some other Race | 59,052 | 7.5% |
| Total | 785,443 | 100.0% |
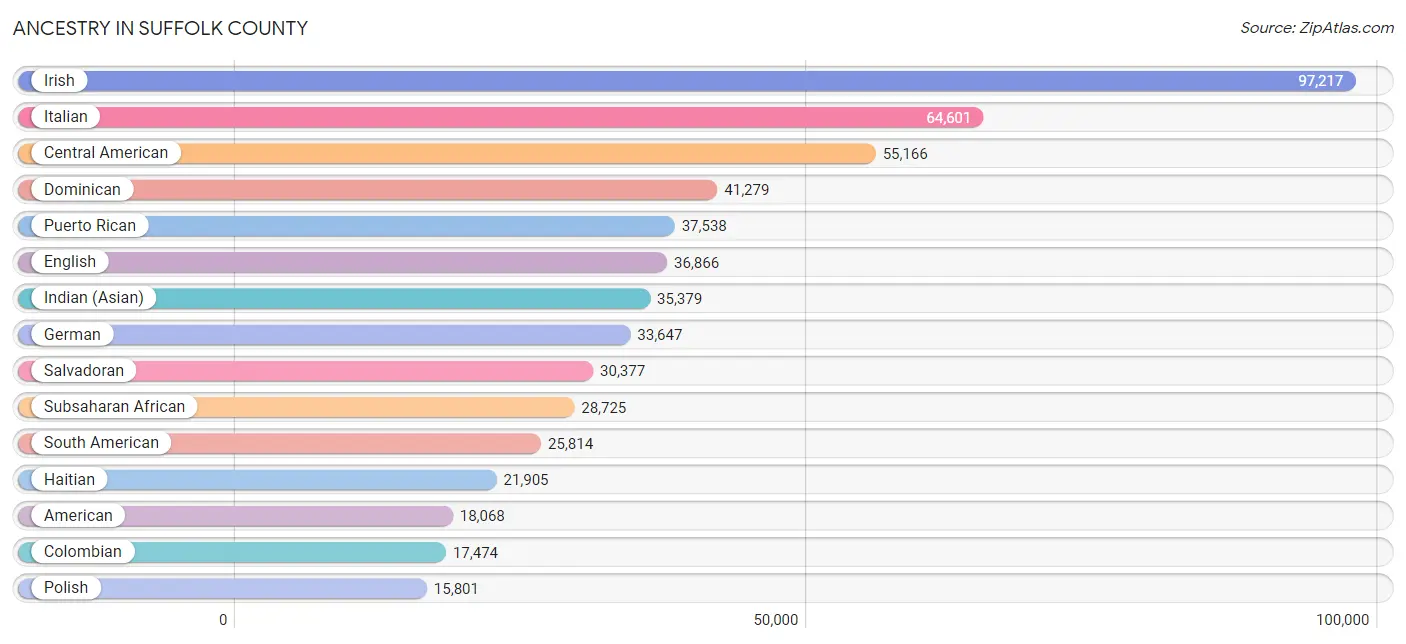
Ancestry in Suffolk County
The most populous ancestries reported in Suffolk County are Irish (97,217 | 12.4%), Italian (64,601 | 8.2%), Central American (55,166 | 7.0%), Dominican (41,279 | 5.3%), and Puerto Rican (37,538 | 4.8%), together accounting for 37.7% of all Suffolk County residents.
| Ancestry | # Population | % Population |
| Afghan | 163 | 0.0% |
| African | 5,291 | 0.7% |
| Alaska Native | 34 | 0.0% |
| Alaskan Athabascan | 27 | 0.0% |
| Albanian | 3,180 | 0.4% |
| Alsatian | 78 | 0.0% |
| American | 18,068 | 2.3% |
| Apache | 88 | 0.0% |
| Arab | 10,227 | 1.3% |
| Argentinean | 584 | 0.1% |
| Armenian | 1,380 | 0.2% |
| Assyrian / Chaldean / Syriac | 50 | 0.0% |
| Australian | 224 | 0.0% |
| Austrian | 967 | 0.1% |
| Bahamian | 74 | 0.0% |
| Bangladeshi | 8 | 0.0% |
| Barbadian | 2,825 | 0.4% |
| Basque | 88 | 0.0% |
| Belgian | 715 | 0.1% |
| Belizean | 180 | 0.0% |
| Bermudan | 154 | 0.0% |
| Bhutanese | 2,472 | 0.3% |
| Blackfeet | 496 | 0.1% |
| Bolivian | 364 | 0.1% |
| Brazilian | 6,189 | 0.8% |
| British | 2,849 | 0.4% |
| British West Indian | 2,397 | 0.3% |
| Bulgarian | 323 | 0.0% |
| Burmese | 4,924 | 0.6% |
| Cajun | 112 | 0.0% |
| Cambodian | 18 | 0.0% |
| Canadian | 2,287 | 0.3% |
| Cape Verdean | 12,750 | 1.6% |
| Carpatho Rusyn | 34 | 0.0% |
| Celtic | 72 | 0.0% |
| Central American | 55,166 | 7.0% |
| Central American Indian | 1,591 | 0.2% |
| Cherokee | 1,061 | 0.1% |
| Cheyenne | 93 | 0.0% |
| Chickasaw | 15 | 0.0% |
| Chilean | 680 | 0.1% |
| Chippewa | 26 | 0.0% |
| Choctaw | 121 | 0.0% |
| Colombian | 17,474 | 2.2% |
| Comanche | 6 | 0.0% |
| Costa Rican | 1,442 | 0.2% |
| Creek | 31 | 0.0% |
| Croatian | 712 | 0.1% |
| Cuban | 2,824 | 0.4% |
| Cypriot | 87 | 0.0% |
| Czech | 1,344 | 0.2% |
| Czechoslovakian | 85 | 0.0% |
| Danish | 1,381 | 0.2% |
| Dominican | 41,279 | 5.3% |
| Dutch | 2,754 | 0.4% |
| Dutch West Indian | 35 | 0.0% |
| Eastern European | 4,587 | 0.6% |
| Ecuadorian | 2,046 | 0.3% |
| Egyptian | 530 | 0.1% |
| English | 36,866 | 4.7% |
| Estonian | 218 | 0.0% |
| Ethiopian | 1,882 | 0.2% |
| European | 8,161 | 1.0% |
| Filipino | 828 | 0.1% |
| Finnish | 936 | 0.1% |
| French | 12,536 | 1.6% |
| French American Indian | 21 | 0.0% |
| French Canadian | 9,375 | 1.2% |
| German | 33,647 | 4.3% |
| German Russian | 57 | 0.0% |
| Ghanaian | 743 | 0.1% |
| Greek | 6,913 | 0.9% |
| Guamanian / Chamorro | 28 | 0.0% |
| Guatemalan | 10,712 | 1.4% |
| Guyanese | 671 | 0.1% |
| Haitian | 21,905 | 2.8% |
| Honduran | 9,272 | 1.2% |
| Hungarian | 1,889 | 0.2% |
| Icelander | 27 | 0.0% |
| Indian (Asian) | 35,379 | 4.5% |
| Indonesian | 447 | 0.1% |
| Inupiat | 35 | 0.0% |
| Iranian | 1,375 | 0.2% |
| Iraqi | 203 | 0.0% |
| Irish | 97,217 | 12.4% |
| Iroquois | 38 | 0.0% |
| Israeli | 506 | 0.1% |
| Italian | 64,601 | 8.2% |
| Jamaican | 11,958 | 1.5% |
| Japanese | 1,285 | 0.2% |
| Jordanian | 148 | 0.0% |
| Kenyan | 636 | 0.1% |
| Korean | 3,707 | 0.5% |
| Laotian | 312 | 0.0% |
| Latvian | 355 | 0.1% |
| Lebanese | 2,447 | 0.3% |
| Liberian | 293 | 0.0% |
| Lithuanian | 2,551 | 0.3% |
| Luxembourger | 32 | 0.0% |
| Macedonian | 33 | 0.0% |
| Malaysian | 118 | 0.0% |
| Maltese | 98 | 0.0% |
| Mexican | 8,630 | 1.1% |
| Mexican American Indian | 325 | 0.0% |
| Mongolian | 128 | 0.0% |
| Moroccan | 2,572 | 0.3% |
| Native Hawaiian | 578 | 0.1% |
| Navajo | 227 | 0.0% |
| New Zealander | 174 | 0.0% |
| Nicaraguan | 700 | 0.1% |
| Nigerian | 3,491 | 0.4% |
| Northern European | 783 | 0.1% |
| Norwegian | 3,144 | 0.4% |
| Okinawan | 67 | 0.0% |
| Osage | 6 | 0.0% |
| Pakistani | 644 | 0.1% |
| Palestinian | 332 | 0.0% |
| Panamanian | 658 | 0.1% |
| Paraguayan | 125 | 0.0% |
| Peruvian | 2,228 | 0.3% |
| Polish | 15,801 | 2.0% |
| Portuguese | 7,559 | 1.0% |
| Potawatomi | 21 | 0.0% |
| Puerto Rican | 37,538 | 4.8% |
| Romanian | 877 | 0.1% |
| Russian | 8,289 | 1.1% |
| Salvadoran | 30,377 | 3.9% |
| Samoan | 145 | 0.0% |
| Scandinavian | 1,149 | 0.2% |
| Scotch-Irish | 2,747 | 0.4% |
| Scottish | 7,870 | 1.0% |
| Senegalese | 36 | 0.0% |
| Serbian | 549 | 0.1% |
| Sierra Leonean | 398 | 0.1% |
| Sioux | 46 | 0.0% |
| Slavic | 171 | 0.0% |
| Slovak | 801 | 0.1% |
| Slovene | 168 | 0.0% |
| Somali | 1,514 | 0.2% |
| South African | 303 | 0.0% |
| South American | 25,814 | 3.3% |
| South American Indian | 332 | 0.0% |
| Spaniard | 1,762 | 0.2% |
| Spanish | 1,277 | 0.2% |
| Spanish American | 109 | 0.0% |
| Sri Lankan | 12,666 | 1.6% |
| Subsaharan African | 28,725 | 3.7% |
| Sudanese | 350 | 0.0% |
| Swedish | 5,697 | 0.7% |
| Swiss | 1,300 | 0.2% |
| Syrian | 577 | 0.1% |
| Thai | 13,230 | 1.7% |
| Tlingit-Haida | 21 | 0.0% |
| Trinidadian and Tobagonian | 5,580 | 0.7% |
| Turkish | 1,472 | 0.2% |
| U.S. Virgin Islander | 144 | 0.0% |
| Ugandan | 131 | 0.0% |
| Ukrainian | 2,029 | 0.3% |
| Uruguayan | 178 | 0.0% |
| Venezuelan | 2,086 | 0.3% |
| Vietnamese | 484 | 0.1% |
| Welsh | 2,009 | 0.3% |
| West Indian | 1,949 | 0.3% |
| Yugoslavian | 828 | 0.1% |
| Zimbabwean | 52 | 0.0% | View All 165 Rows |
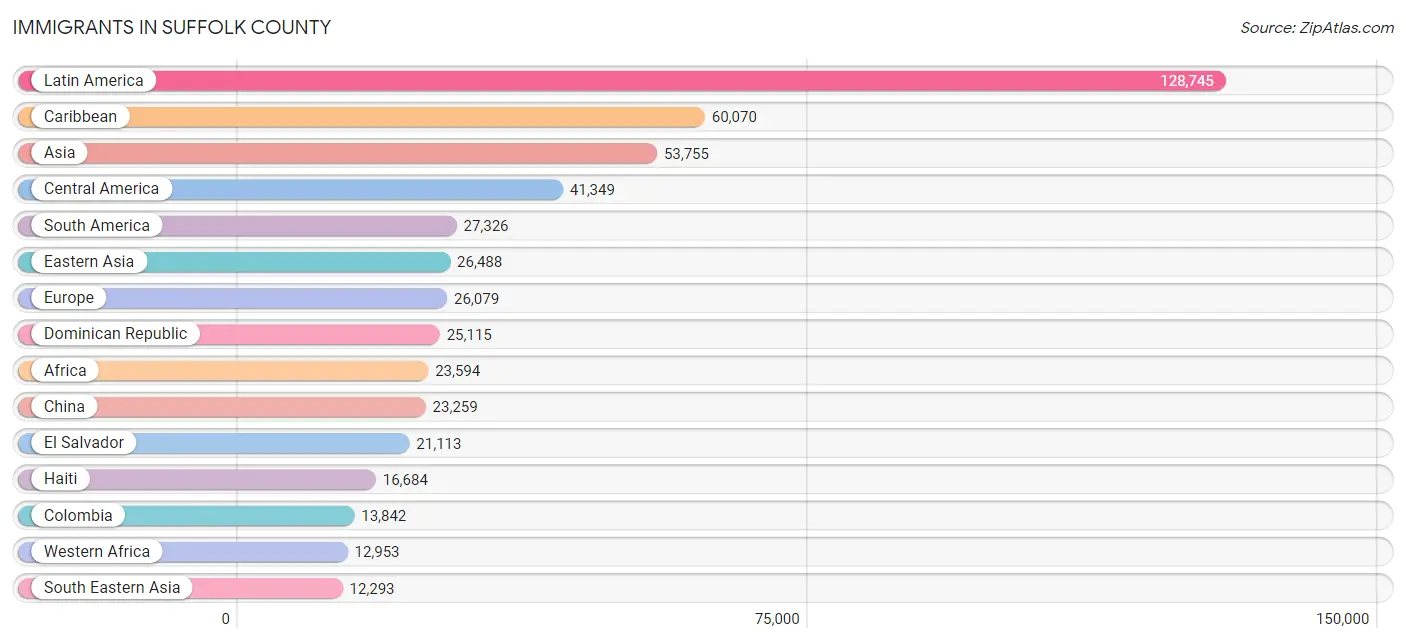
Immigrants in Suffolk County
The most numerous immigrant groups reported in Suffolk County came from Latin America (128,745 | 16.4%), Caribbean (60,070 | 7.6%), Asia (53,755 | 6.8%), Central America (41,349 | 5.3%), and South America (27,326 | 3.5%), together accounting for 39.6% of all Suffolk County residents.
| Immigration Origin | # Population | % Population |
| Afghanistan | 104 | 0.0% |
| Africa | 23,594 | 3.0% |
| Albania | 2,711 | 0.4% |
| Argentina | 492 | 0.1% |
| Armenia | 60 | 0.0% |
| Asia | 53,755 | 6.8% |
| Australia | 394 | 0.1% |
| Austria | 80 | 0.0% |
| Azores | 102 | 0.0% |
| Bahamas | 66 | 0.0% |
| Bangladesh | 548 | 0.1% |
| Barbados | 1,524 | 0.2% |
| Belarus | 347 | 0.0% |
| Belgium | 178 | 0.0% |
| Belize | 41 | 0.0% |
| Bolivia | 183 | 0.0% |
| Bosnia and Herzegovina | 743 | 0.1% |
| Brazil | 7,051 | 0.9% |
| Bulgaria | 303 | 0.0% |
| Cabo Verde | 8,903 | 1.1% |
| Cambodia | 641 | 0.1% |
| Cameroon | 334 | 0.0% |
| Canada | 2,759 | 0.4% |
| Caribbean | 60,070 | 7.6% |
| Central America | 41,349 | 5.3% |
| Chile | 599 | 0.1% |
| China | 23,259 | 3.0% |
| Colombia | 13,842 | 1.8% |
| Congo | 12 | 0.0% |
| Costa Rica | 722 | 0.1% |
| Croatia | 145 | 0.0% |
| Cuba | 917 | 0.1% |
| Czechoslovakia | 313 | 0.0% |
| Denmark | 216 | 0.0% |
| Dominica | 1,001 | 0.1% |
| Dominican Republic | 25,115 | 3.2% |
| Eastern Africa | 4,673 | 0.6% |
| Eastern Asia | 26,488 | 3.4% |
| Eastern Europe | 10,685 | 1.4% |
| Ecuador | 1,100 | 0.1% |
| Egypt | 332 | 0.0% |
| El Salvador | 21,113 | 2.7% |
| England | 706 | 0.1% |
| Eritrea | 151 | 0.0% |
| Ethiopia | 1,974 | 0.3% |
| Europe | 26,079 | 3.3% |
| France | 1,304 | 0.2% |
| Germany | 1,546 | 0.2% |
| Ghana | 765 | 0.1% |
| Greece | 1,224 | 0.2% |
| Grenada | 338 | 0.0% |
| Guatemala | 7,841 | 1.0% |
| Guyana | 629 | 0.1% |
| Haiti | 16,684 | 2.1% |
| Honduras | 6,138 | 0.8% |
| Hong Kong | 1,209 | 0.2% |
| Hungary | 183 | 0.0% |
| India | 6,771 | 0.9% |
| Indonesia | 270 | 0.0% |
| Iran | 1,293 | 0.2% |
| Iraq | 103 | 0.0% |
| Ireland | 2,280 | 0.3% |
| Israel | 651 | 0.1% |
| Italy | 2,785 | 0.4% |
| Jamaica | 7,828 | 1.0% |
| Japan | 764 | 0.1% |
| Jordan | 116 | 0.0% |
| Kazakhstan | 132 | 0.0% |
| Kenya | 959 | 0.1% |
| Korea | 2,447 | 0.3% |
| Kuwait | 506 | 0.1% |
| Laos | 43 | 0.0% |
| Latin America | 128,745 | 16.4% |
| Latvia | 131 | 0.0% |
| Lebanon | 347 | 0.0% |
| Liberia | 126 | 0.0% |
| Lithuania | 84 | 0.0% |
| Malaysia | 207 | 0.0% |
| Mexico | 2,781 | 0.4% |
| Middle Africa | 962 | 0.1% |
| Moldova | 65 | 0.0% |
| Morocco | 2,421 | 0.3% |
| Nepal | 414 | 0.1% |
| Netherlands | 234 | 0.0% |
| Nicaragua | 345 | 0.0% |
| Nigeria | 1,837 | 0.2% |
| North Macedonia | 21 | 0.0% |
| Northern Africa | 3,589 | 0.5% |
| Northern Europe | 5,459 | 0.7% |
| Norway | 42 | 0.0% |
| Oceania | 613 | 0.1% |
| Pakistan | 1,018 | 0.1% |
| Panama | 473 | 0.1% |
| Peru | 1,708 | 0.2% |
| Philippines | 1,577 | 0.2% |
| Poland | 990 | 0.1% |
| Portugal | 841 | 0.1% |
| Romania | 493 | 0.1% |
| Russia | 2,376 | 0.3% |
| Saudi Arabia | 327 | 0.0% |
| Scotland | 207 | 0.0% |
| Senegal | 32 | 0.0% |
| Serbia | 202 | 0.0% |
| Sierra Leone | 551 | 0.1% |
| Singapore | 240 | 0.0% |
| Somalia | 905 | 0.1% |
| South Africa | 622 | 0.1% |
| South America | 27,326 | 3.5% |
| South Central Asia | 10,528 | 1.3% |
| South Eastern Asia | 12,293 | 1.6% |
| Southern Europe | 6,126 | 0.8% |
| Spain | 1,276 | 0.2% |
| Sri Lanka | 134 | 0.0% |
| St. Vincent and the Grenadines | 174 | 0.0% |
| Sudan | 147 | 0.0% |
| Sweden | 286 | 0.0% |
| Switzerland | 343 | 0.0% |
| Syria | 177 | 0.0% |
| Taiwan | 1,015 | 0.1% |
| Thailand | 511 | 0.1% |
| Trinidad and Tobago | 4,634 | 0.6% |
| Turkey | 1,045 | 0.1% |
| Uganda | 191 | 0.0% |
| Ukraine | 1,130 | 0.1% |
| Uruguay | 86 | 0.0% |
| Uzbekistan | 61 | 0.0% |
| Venezuela | 1,528 | 0.2% |
| Vietnam | 8,415 | 1.1% |
| West Indies | 361 | 0.1% |
| Western Africa | 12,953 | 1.7% |
| Western Asia | 4,269 | 0.5% |
| Western Europe | 3,685 | 0.5% |
| Yemen | 223 | 0.0% |
| Zaire | 118 | 0.0% |
| Zimbabwe | 48 | 0.0% | View All 135 Rows |
Sex and Age in Suffolk County
Sex and Age in Suffolk County
The most populous age groups in Suffolk County are 25 to 29 Years (46,348 | 12.2%) for men and 25 to 29 Years (47,829 | 11.8%) for women.
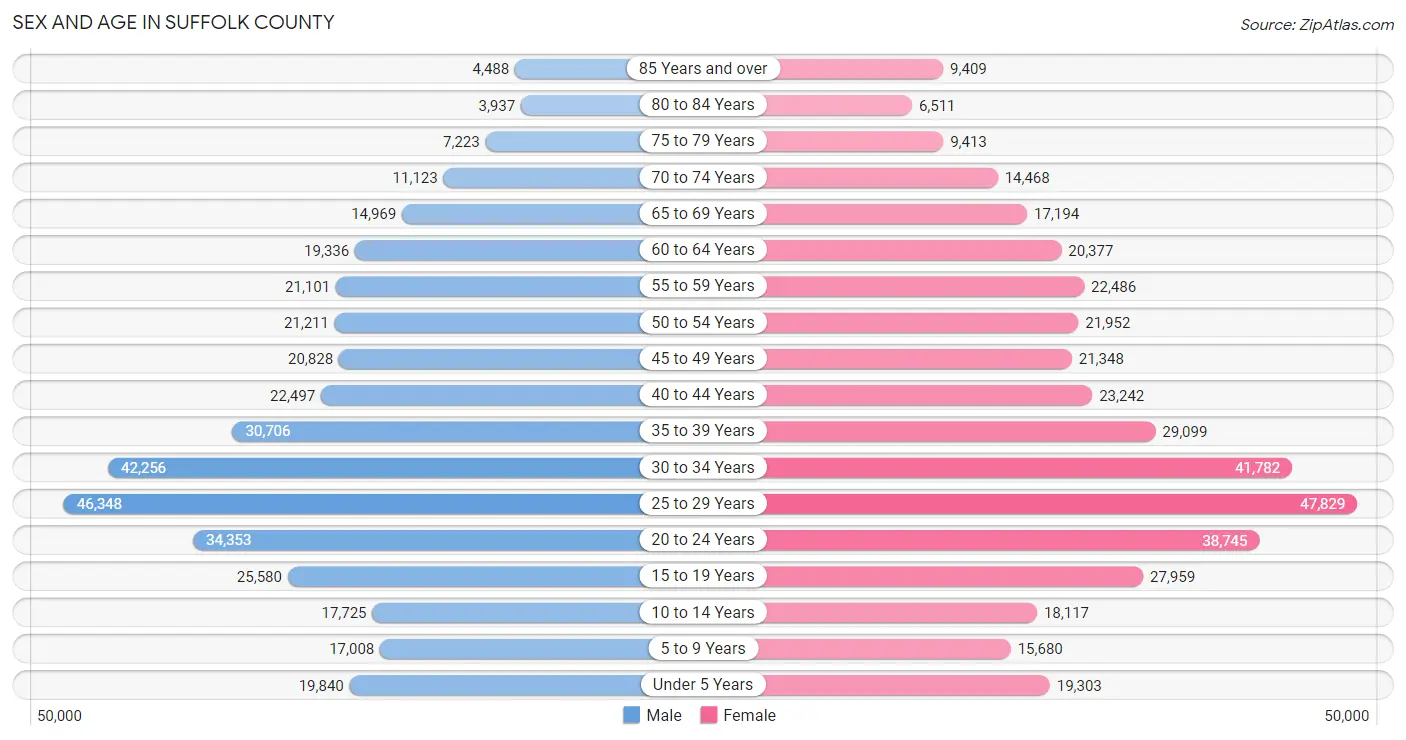
| Age Bracket | Male | Female |
| Under 5 Years | 19,840 (5.2%) | 19,303 (4.8%) |
| 5 to 9 Years | 17,008 (4.5%) | 15,680 (3.9%) |
| 10 to 14 Years | 17,725 (4.7%) | 18,117 (4.5%) |
| 15 to 19 Years | 25,580 (6.7%) | 27,959 (6.9%) |
| 20 to 24 Years | 34,353 (9.0%) | 38,745 (9.6%) |
| 25 to 29 Years | 46,348 (12.2%) | 47,829 (11.8%) |
| 30 to 34 Years | 42,256 (11.1%) | 41,782 (10.3%) |
| 35 to 39 Years | 30,706 (8.1%) | 29,099 (7.2%) |
| 40 to 44 Years | 22,497 (5.9%) | 23,242 (5.7%) |
| 45 to 49 Years | 20,828 (5.5%) | 21,348 (5.3%) |
| 50 to 54 Years | 21,211 (5.6%) | 21,952 (5.4%) |
| 55 to 59 Years | 21,101 (5.6%) | 22,486 (5.6%) |
| 60 to 64 Years | 19,336 (5.1%) | 20,377 (5.0%) |
| 65 to 69 Years | 14,969 (3.9%) | 17,194 (4.3%) |
| 70 to 74 Years | 11,123 (2.9%) | 14,468 (3.6%) |
| 75 to 79 Years | 7,223 (1.9%) | 9,413 (2.3%) |
| 80 to 84 Years | 3,937 (1.0%) | 6,511 (1.6%) |
| 85 Years and over | 4,488 (1.2%) | 9,409 (2.3%) |
| Total | 380,529 (100.0%) | 404,914 (100.0%) |
Families and Households in Suffolk County
Median Family Size in Suffolk County
The median family size in Suffolk County is 3.12 persons per family, with married-couple families (94,536 | 61.6%) accounting for the largest median family size of 3.16 persons per family. On the other hand, single male/father families (14,398 | 9.4%) represent the smallest median family size with 2.77 persons per family.
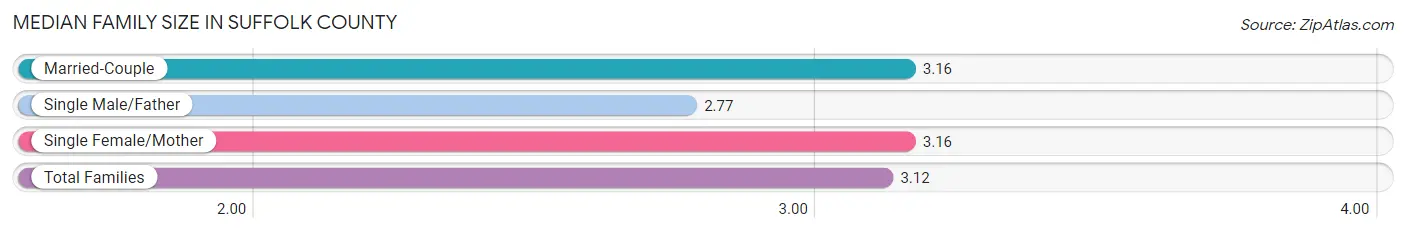
| Family Type | # Families | Family Size |
| Married-Couple | 94,536 (61.6%) | 3.16 |
| Single Male/Father | 14,398 (9.4%) | 2.77 |
| Single Female/Mother | 44,663 (29.1%) | 3.16 |
| Total Families | 153,597 (100.0%) | 3.12 |
Median Household Size in Suffolk County
The median household size in Suffolk County is 2.32 persons per household, with single female/mother households (44,663 | 14.0%) accounting for the largest median household size of 3.37 persons per household. non-family households (165,710 | 51.9%) represent the smallest median household size with 1.45 persons per household.
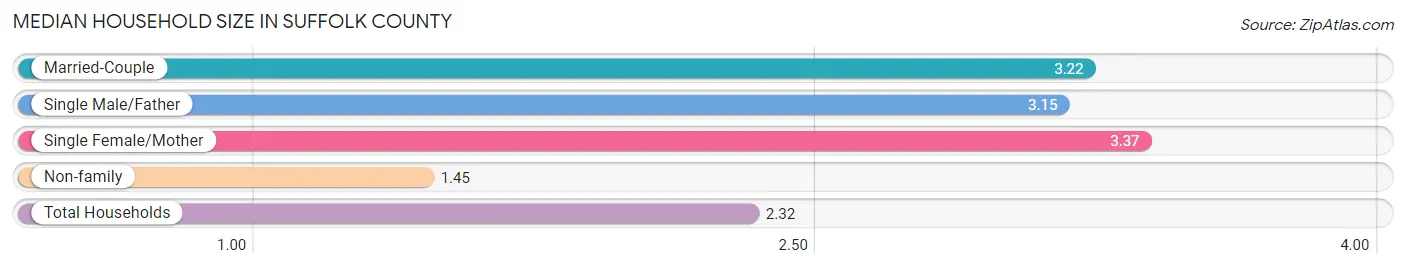
| Household Type | # Households | Household Size |
| Married-Couple | 94,536 (29.6%) | 3.22 |
| Single Male/Father | 14,398 (4.5%) | 3.15 |
| Single Female/Mother | 44,663 (14.0%) | 3.37 |
| Non-family | 165,710 (51.9%) | 1.45 |
| Total Households | 319,307 (100.0%) | 2.32 |
Household Size by Marriage Status in Suffolk County
Out of a total of 319,307 households in Suffolk County, 153,597 (48.1%) are family households, while 165,710 (51.9%) are nonfamily households. The most numerous type of family households are 2-person households, comprising 65,193, and the most common type of nonfamily households are 1-person households, comprising 115,058.
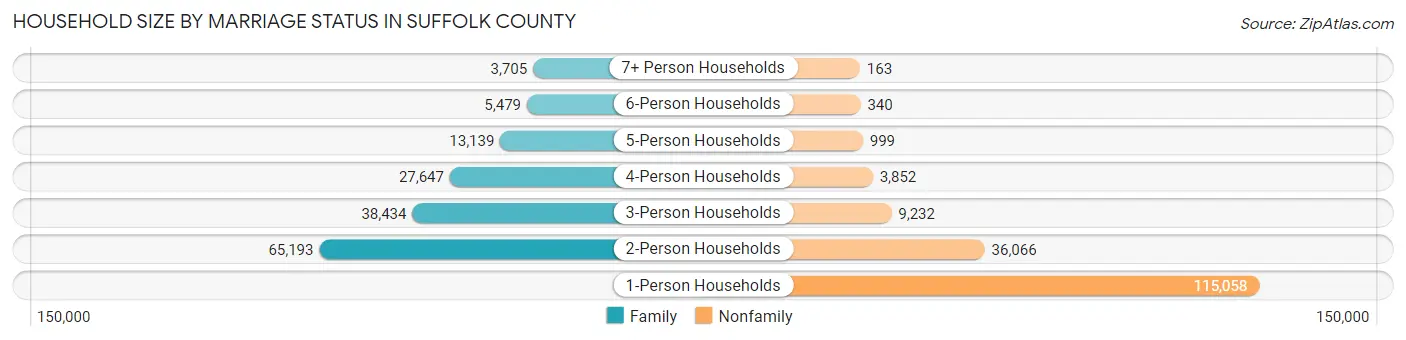
| Household Size | Family Households | Nonfamily Households |
| 1-Person Households | - | 115,058 (36.0%) |
| 2-Person Households | 65,193 (20.4%) | 36,066 (11.3%) |
| 3-Person Households | 38,434 (12.0%) | 9,232 (2.9%) |
| 4-Person Households | 27,647 (8.7%) | 3,852 (1.2%) |
| 5-Person Households | 13,139 (4.1%) | 999 (0.3%) |
| 6-Person Households | 5,479 (1.7%) | 340 (0.1%) |
| 7+ Person Households | 3,705 (1.2%) | 163 (0.1%) |
| Total | 153,597 (48.1%) | 165,710 (51.9%) |
Female Fertility in Suffolk County
Fertility by Age in Suffolk County
Average fertility rate in Suffolk County is 33.0 births per 1,000 women. Women in the age bracket of 20 to 34 years have the highest fertility rate with 38.0 births per 1,000 women. Women in the age bracket of 20 to 34 years acount for 64.2% of all women with births.
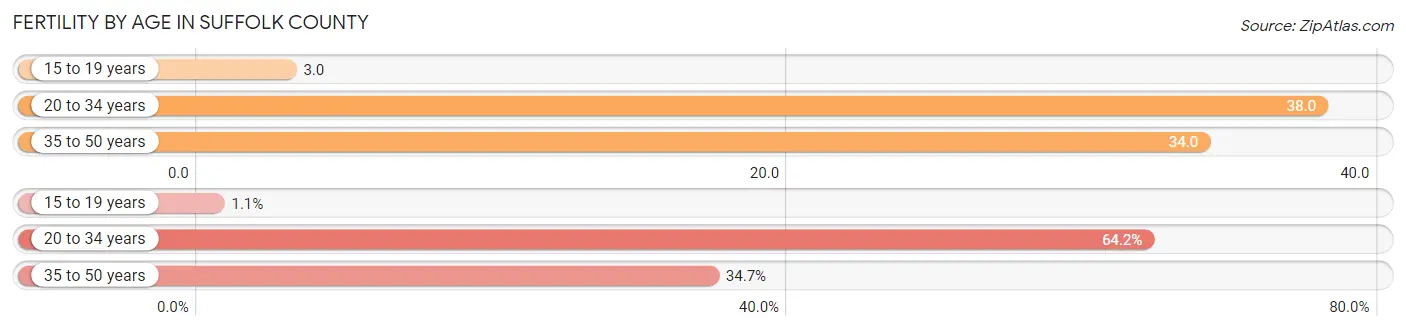
| Age Bracket | Women with Births | Births / 1,000 Women |
| 15 to 19 years | 86 (1.1%) | 3.0 |
| 20 to 34 years | 4,931 (64.2%) | 38.0 |
| 35 to 50 years | 2,662 (34.7%) | 34.0 |
| Total | 7,679 (100.0%) | 33.0 |
Fertility by Age by Marriage Status in Suffolk County
68.4% of women with births (7,679) in Suffolk County are married. The highest percentage of unmarried women with births falls into 15 to 19 years age bracket with 100.0% of them unmarried at the time of birth, while the lowest percentage of unmarried women with births belong to 35 to 50 years age bracket with 25.9% of them unmarried.
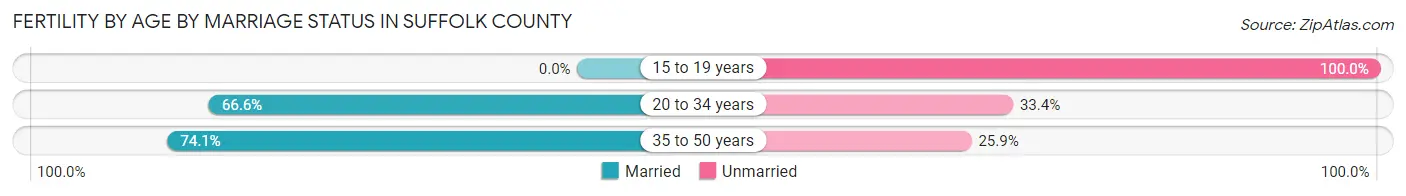
| Age Bracket | Married | Unmarried |
| 15 to 19 years | 0 (0.0%) | 86 (100.0%) |
| 20 to 34 years | 3,284 (66.6%) | 1,647 (33.4%) |
| 35 to 50 years | 1,973 (74.1%) | 689 (25.9%) |
| Total | 5,252 (68.4%) | 2,427 (31.6%) |
Fertility by Education in Suffolk County
Average fertility rate in Suffolk County is 33.0 births per 1,000 women. Women with the education attainment of graduate degree have the highest fertility rate of 44.0 births per 1,000 women, while women with the education attainment of college or associate's degree have the lowest fertility at 23.0 births per 1,000 women. Women with the education attainment of bachelor's degree represent 28.4% of all women with births.
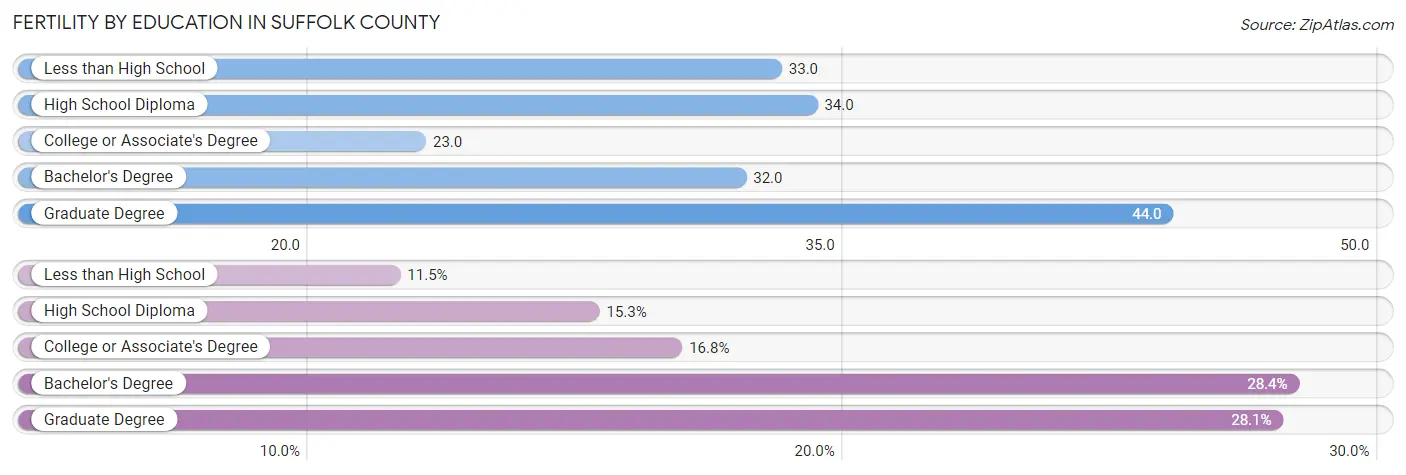
| Educational Attainment | Women with Births | Births / 1,000 Women |
| Less than High School | 885 (11.5%) | 33.0 |
| High School Diploma | 1,171 (15.2%) | 34.0 |
| College or Associate's Degree | 1,290 (16.8%) | 23.0 |
| Bachelor's Degree | 2,178 (28.4%) | 32.0 |
| Graduate Degree | 2,155 (28.1%) | 44.0 |
| Total | 7,679 (100.0%) | 33.0 |
Fertility by Education by Marriage Status in Suffolk County
31.6% of women with births in Suffolk County are unmarried. Women with the educational attainment of graduate degree are most likely to be married with 95.8% of them married at childbirth, while women with the educational attainment of college or associate's degree are least likely to be married with 63.2% of them unmarried at childbirth.
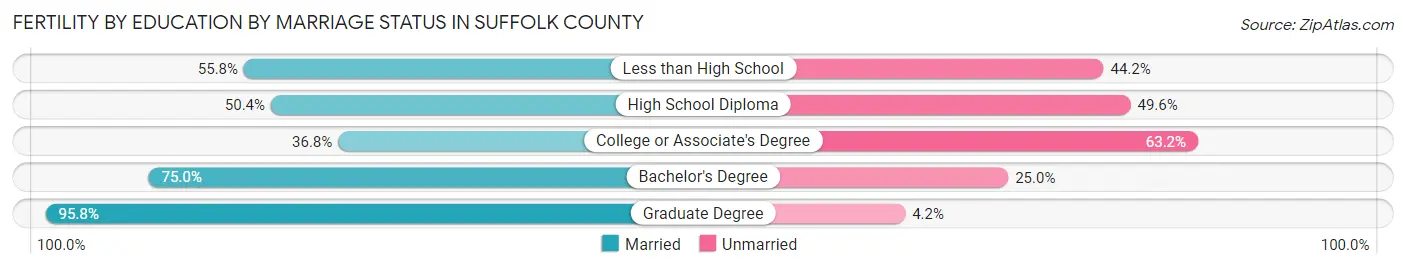
| Educational Attainment | Married | Unmarried |
| Less than High School | 494 (55.8%) | 391 (44.2%) |
| High School Diploma | 590 (50.4%) | 581 (49.6%) |
| College or Associate's Degree | 475 (36.8%) | 815 (63.2%) |
| Bachelor's Degree | 1,634 (75.0%) | 544 (25.0%) |
| Graduate Degree | 2,064 (95.8%) | 91 (4.2%) |
| Total | 5,252 (68.4%) | 2,427 (31.6%) |
Income in Suffolk County
Income Overview in Suffolk County
Per Capita Income in Suffolk County is $53,173, while median incomes of families and households are $102,723 and $87,669 respectively.
| Characteristic | Number | Measure |
| Per Capita Income | 785,443 | $53,173 |
| Median Family Income | 153,597 | $102,723 |
| Mean Family Income | 153,597 | $149,926 |
| Median Household Income | 319,307 | $87,669 |
| Mean Household Income | 319,307 | $128,245 |
| Income Deficit | 153,597 | $10,840 |
| Wage / Income Gap (%) | 785,443 | 16.82% |
| Wage / Income Gap ($) | 785,443 | 83.18¢ per $1 |
| Gini / Inequality Index | 785,443 | 0.53 |
Earnings by Sex in Suffolk County
Average Earnings in Suffolk County are $50,415, $55,479 for men and $46,146 for women, a difference of 16.8%.
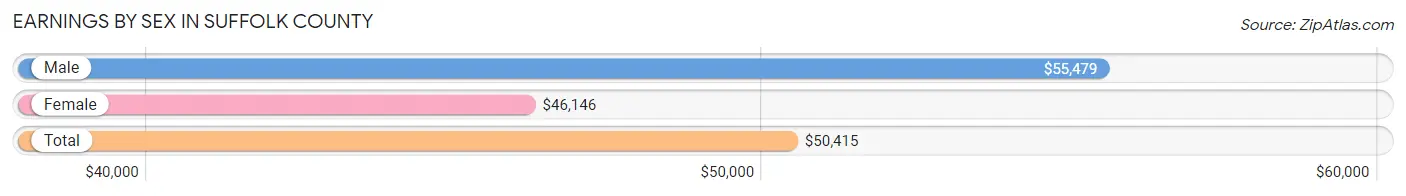
| Sex | Number | Average Earnings |
| Male | 241,842 (49.6%) | $55,479 |
| Female | 245,897 (50.4%) | $46,146 |
| Total | 487,739 (100.0%) | $50,415 |
Earnings by Sex by Income Bracket in Suffolk County
The most common earnings brackets in Suffolk County are $100,000+ for men (60,819 | 25.2%) and $100,000+ for women (44,004 | 17.9%).
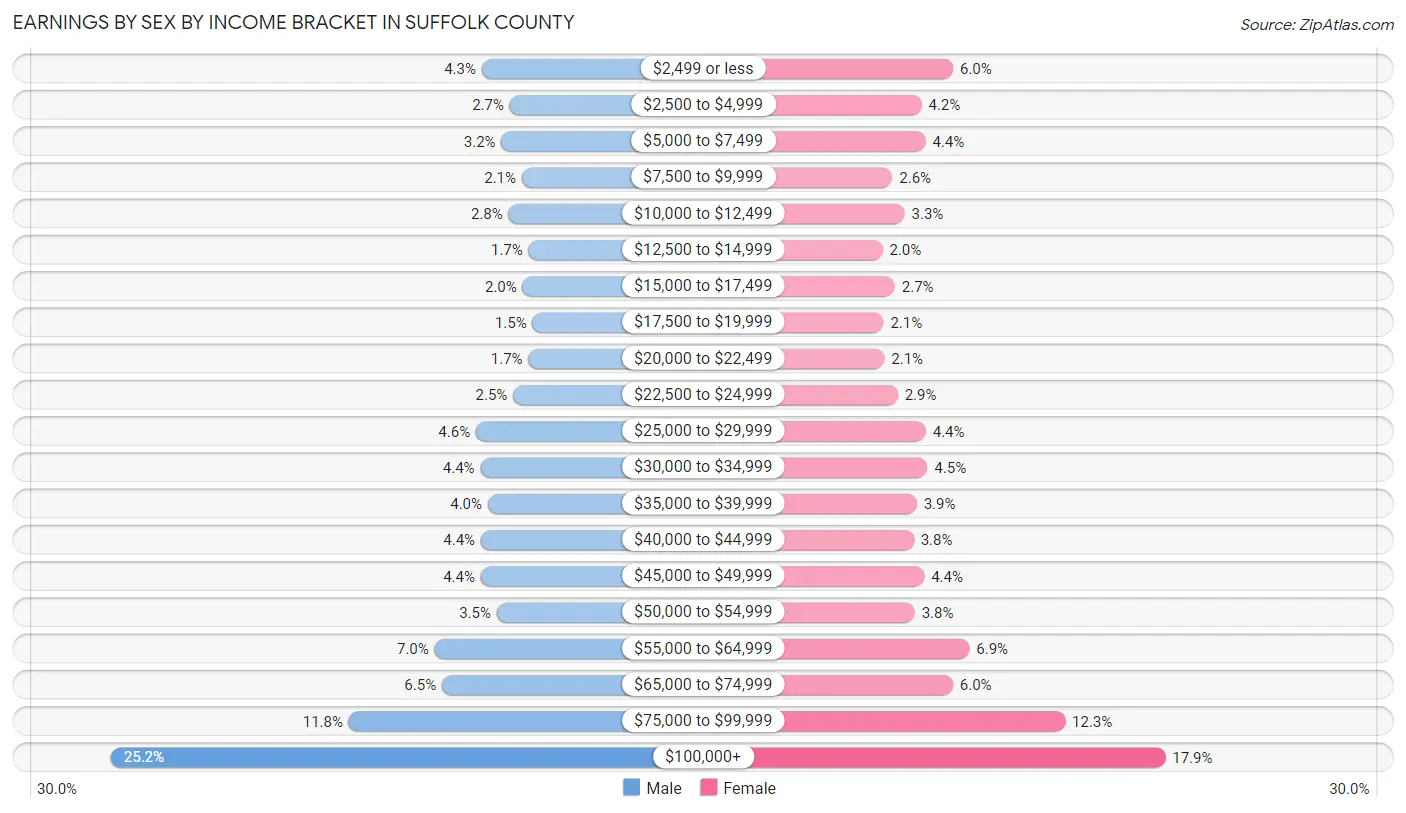
| Income | Male | Female |
| $2,499 or less | 10,403 (4.3%) | 14,683 (6.0%) |
| $2,500 to $4,999 | 6,598 (2.7%) | 10,333 (4.2%) |
| $5,000 to $7,499 | 7,738 (3.2%) | 10,875 (4.4%) |
| $7,500 to $9,999 | 4,964 (2.1%) | 6,307 (2.6%) |
| $10,000 to $12,499 | 6,778 (2.8%) | 7,981 (3.3%) |
| $12,500 to $14,999 | 4,033 (1.7%) | 4,935 (2.0%) |
| $15,000 to $17,499 | 4,853 (2.0%) | 6,650 (2.7%) |
| $17,500 to $19,999 | 3,500 (1.5%) | 5,068 (2.1%) |
| $20,000 to $22,499 | 4,055 (1.7%) | 5,200 (2.1%) |
| $22,500 to $24,999 | 6,148 (2.5%) | 7,044 (2.9%) |
| $25,000 to $29,999 | 11,209 (4.6%) | 10,908 (4.4%) |
| $30,000 to $34,999 | 10,593 (4.4%) | 11,141 (4.5%) |
| $35,000 to $39,999 | 9,572 (4.0%) | 9,662 (3.9%) |
| $40,000 to $44,999 | 10,509 (4.3%) | 9,244 (3.8%) |
| $45,000 to $49,999 | 10,546 (4.4%) | 10,696 (4.3%) |
| $50,000 to $54,999 | 8,377 (3.5%) | 9,398 (3.8%) |
| $55,000 to $64,999 | 16,841 (7.0%) | 16,946 (6.9%) |
| $65,000 to $74,999 | 15,812 (6.5%) | 14,660 (6.0%) |
| $75,000 to $99,999 | 28,494 (11.8%) | 30,162 (12.3%) |
| $100,000+ | 60,819 (25.2%) | 44,004 (17.9%) |
| Total | 241,842 (100.0%) | 245,897 (100.0%) |
Earnings by Sex by Educational Attainment in Suffolk County
Average earnings in Suffolk County are $64,507 for men and $56,078 for women, a difference of 13.1%. Men with an educational attainment of graduate degree enjoy the highest average annual earnings of $104,145, while those with less than high school education earn the least with $33,802. Women with an educational attainment of graduate degree earn the most with the average annual earnings of $86,605, while those with less than high school education have the smallest earnings of $24,451.
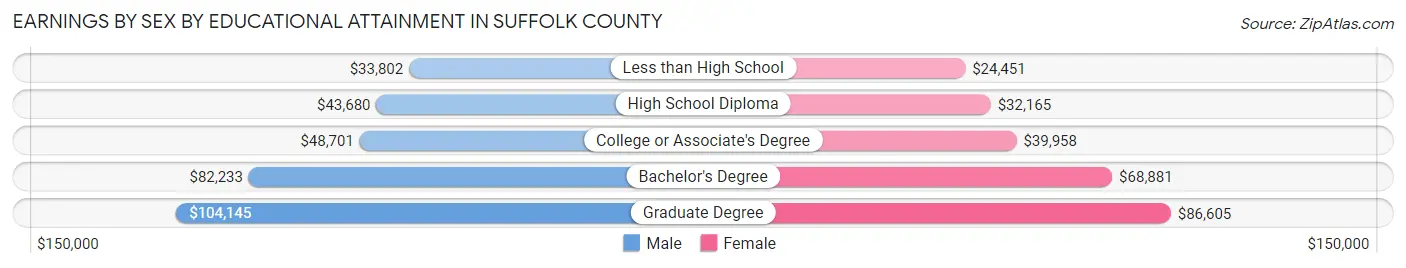
| Educational Attainment | Male Income | Female Income |
| Less than High School | $33,802 | $24,451 |
| High School Diploma | $43,680 | $32,165 |
| College or Associate's Degree | $48,701 | $39,958 |
| Bachelor's Degree | $82,233 | $68,881 |
| Graduate Degree | $104,145 | $86,605 |
| Total | $64,507 | $56,078 |
Family Income in Suffolk County
Family Income Brackets in Suffolk County
According to the Suffolk County family income data, there are 35,020 families falling into the $200,000+ income range, which is the most common income bracket and makes up 22.8% of all families. Conversely, the $10,000 to $14,999 income bracket is the least frequent group with only 4,608 families (3.0%) belonging to this category.
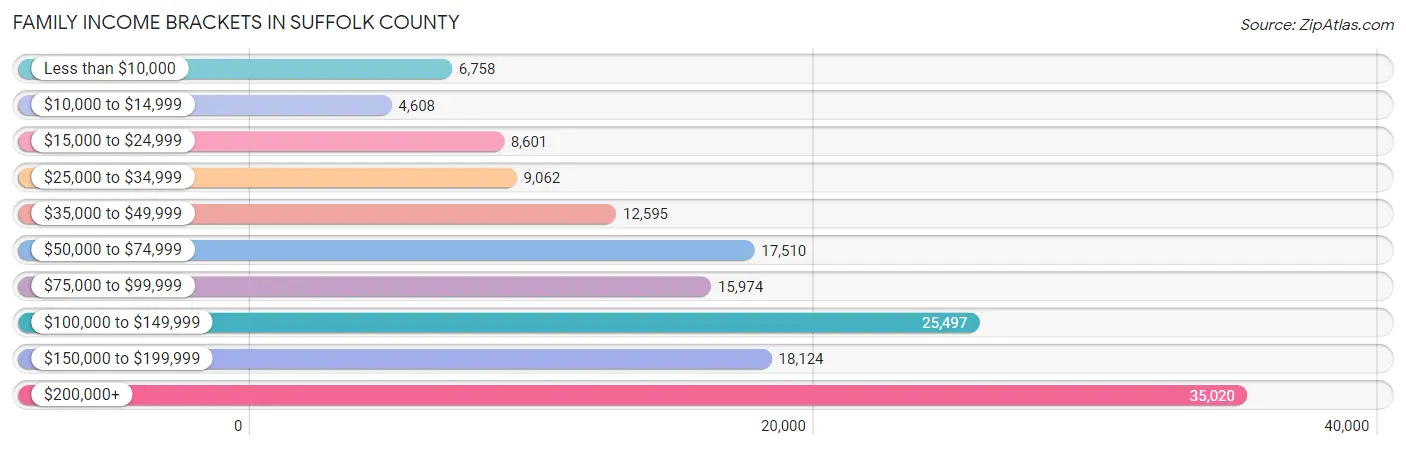
| Income Bracket | # Families | % Families |
| Less than $10,000 | 6,758 | 4.4% |
| $10,000 to $14,999 | 4,608 | 3.0% |
| $15,000 to $24,999 | 8,601 | 5.6% |
| $25,000 to $34,999 | 9,062 | 5.9% |
| $35,000 to $49,999 | 12,595 | 8.2% |
| $50,000 to $74,999 | 17,510 | 11.4% |
| $75,000 to $99,999 | 15,974 | 10.4% |
| $100,000 to $149,999 | 25,497 | 16.6% |
| $150,000 to $199,999 | 18,124 | 11.8% |
| $200,000+ | 35,020 | 22.8% |
Family Income by Famaliy Size in Suffolk County
7+ person families (2,842 | 1.8%) account for the highest median family income in Suffolk County with $133,750 per family, while 2-person families (70,901 | 46.2%) have the highest median income of $48,702 per family member.
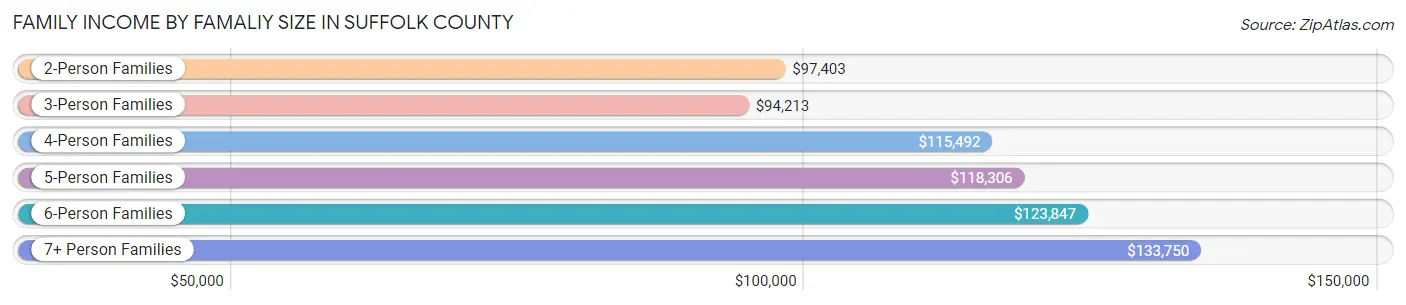
| Income Bracket | # Families | Median Income |
| 2-Person Families | 70,901 (46.2%) | $97,403 |
| 3-Person Families | 38,758 (25.2%) | $94,213 |
| 4-Person Families | 25,236 (16.4%) | $115,492 |
| 5-Person Families | 11,588 (7.5%) | $118,306 |
| 6-Person Families | 4,272 (2.8%) | $123,847 |
| 7+ Person Families | 2,842 (1.8%) | $133,750 |
| Total | 153,597 (100.0%) | $102,723 |
Family Income by Number of Earners in Suffolk County
The median family income in Suffolk County is $102,723, with families comprising 3+ earners (22,176) having the highest median family income of $154,043, while families with no earners (16,394) have the lowest median family income of $23,425, accounting for 14.4% and 10.7% of families, respectively.
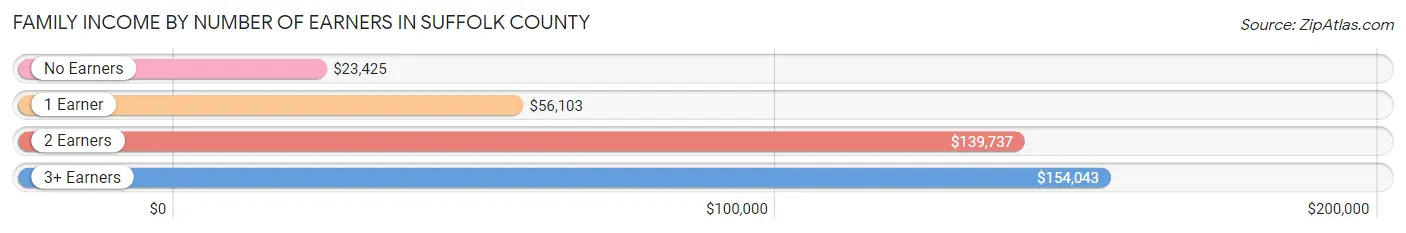
| Number of Earners | # Families | Median Income |
| No Earners | 16,394 (10.7%) | $23,425 |
| 1 Earner | 44,210 (28.8%) | $56,103 |
| 2 Earners | 70,817 (46.1%) | $139,737 |
| 3+ Earners | 22,176 (14.4%) | $154,043 |
| Total | 153,597 (100.0%) | $102,723 |
Household Income in Suffolk County
Household Income Brackets in Suffolk County
With 58,752 households falling in the category, the $200,000+ income range is the most frequent in Suffolk County, accounting for 18.4% of all households. In contrast, only 17,562 households (5.5%) fall into the $25,000 to $34,999 income bracket, making it the least populous group.
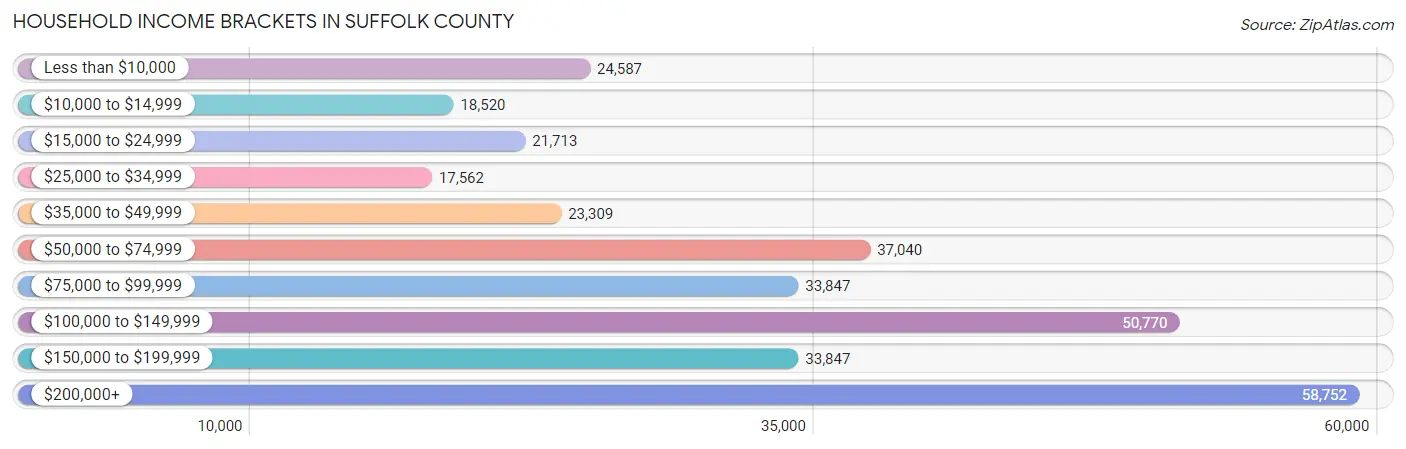
| Income Bracket | # Households | % Households |
| Less than $10,000 | 24,587 | 7.7% |
| $10,000 to $14,999 | 18,520 | 5.8% |
| $15,000 to $24,999 | 21,713 | 6.8% |
| $25,000 to $34,999 | 17,562 | 5.5% |
| $35,000 to $49,999 | 23,309 | 7.3% |
| $50,000 to $74,999 | 37,040 | 11.6% |
| $75,000 to $99,999 | 33,847 | 10.6% |
| $100,000 to $149,999 | 50,770 | 15.9% |
| $150,000 to $199,999 | 33,847 | 10.6% |
| $200,000+ | 58,752 | 18.4% |
Household Income by Householder Age in Suffolk County
The median household income in Suffolk County is $87,669, with the highest median household income of $111,011 found in the 25 to 44 years age bracket for the primary householder. A total of 138,810 households (43.5%) fall into this category. Meanwhile, the 15 to 24 years age bracket for the primary householder has the lowest median household income of $38,267, with 18,120 households (5.7%) in this group.
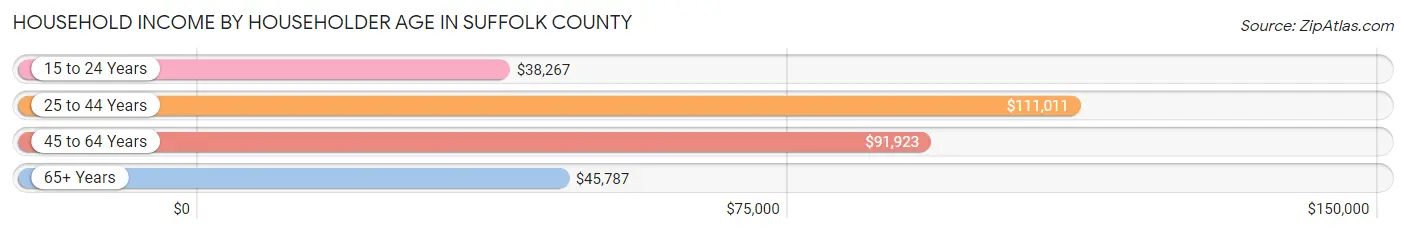
| Income Bracket | # Households | Median Income |
| 15 to 24 Years | 18,120 (5.7%) | $38,267 |
| 25 to 44 Years | 138,810 (43.5%) | $111,011 |
| 45 to 64 Years | 99,638 (31.2%) | $91,923 |
| 65+ Years | 62,739 (19.7%) | $45,787 |
| Total | 319,307 (100.0%) | $87,669 |
Poverty in Suffolk County
Income Below Poverty by Sex and Age in Suffolk County
With 15.8% poverty level for males and 18.2% for females among the residents of Suffolk County, 18 to 24 year old males and 18 to 24 year old females are the most vulnerable to poverty, with 10,886 males (30.6%) and 13,029 females (34.0%) in their respective age groups living below the poverty level.
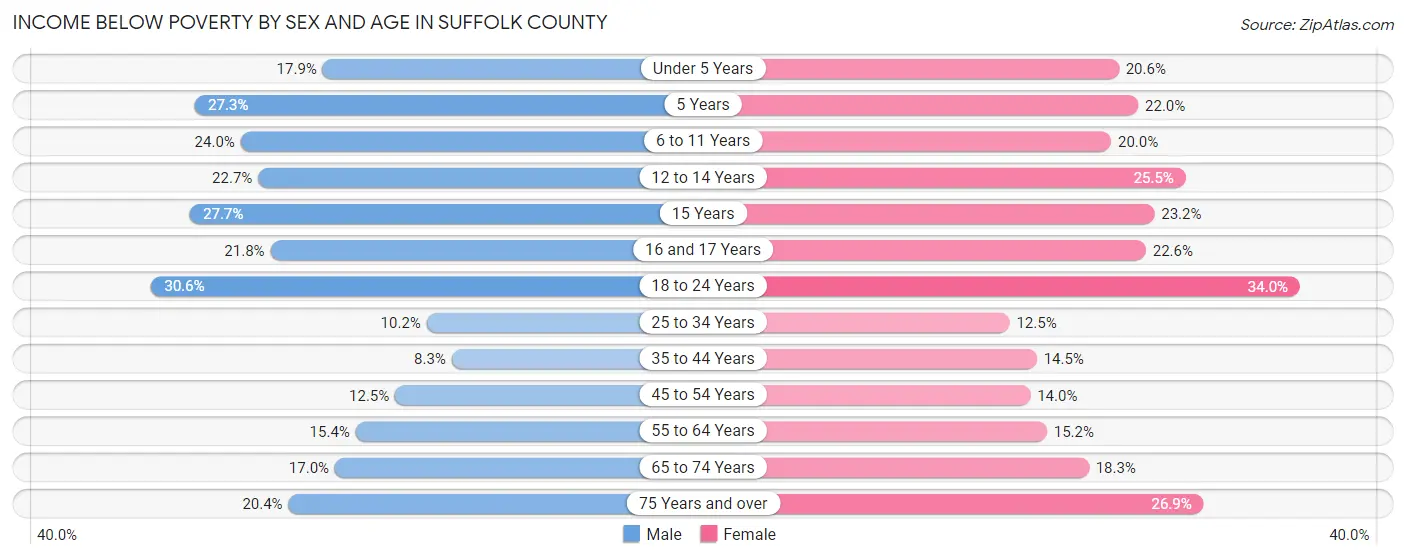
| Age Bracket | Male | Female |
| Under 5 Years | 3,469 (17.9%) | 3,862 (20.6%) |
| 5 Years | 1,095 (27.3%) | 537 (22.0%) |
| 6 to 11 Years | 4,616 (24.0%) | 3,998 (20.0%) |
| 12 to 14 Years | 2,448 (22.7%) | 2,676 (25.5%) |
| 15 Years | 1,045 (27.7%) | 911 (23.2%) |
| 16 and 17 Years | 1,472 (21.7%) | 1,413 (22.6%) |
| 18 to 24 Years | 10,886 (30.6%) | 13,029 (34.0%) |
| 25 to 34 Years | 8,892 (10.2%) | 11,115 (12.4%) |
| 35 to 44 Years | 4,387 (8.3%) | 7,559 (14.5%) |
| 45 to 54 Years | 5,210 (12.5%) | 6,048 (14.0%) |
| 55 to 64 Years | 6,188 (15.4%) | 6,502 (15.2%) |
| 65 to 74 Years | 4,373 (17.0%) | 5,753 (18.3%) |
| 75 Years and over | 3,082 (20.4%) | 6,411 (26.9%) |
| Total | 57,163 (15.8%) | 69,814 (18.2%) |
Income Above Poverty by Sex and Age in Suffolk County
According to the poverty statistics in Suffolk County, males aged 35 to 44 years and females aged 25 to 34 years are the age groups that are most secure financially, with 91.7% of males and 87.5% of females in these age groups living above the poverty line.
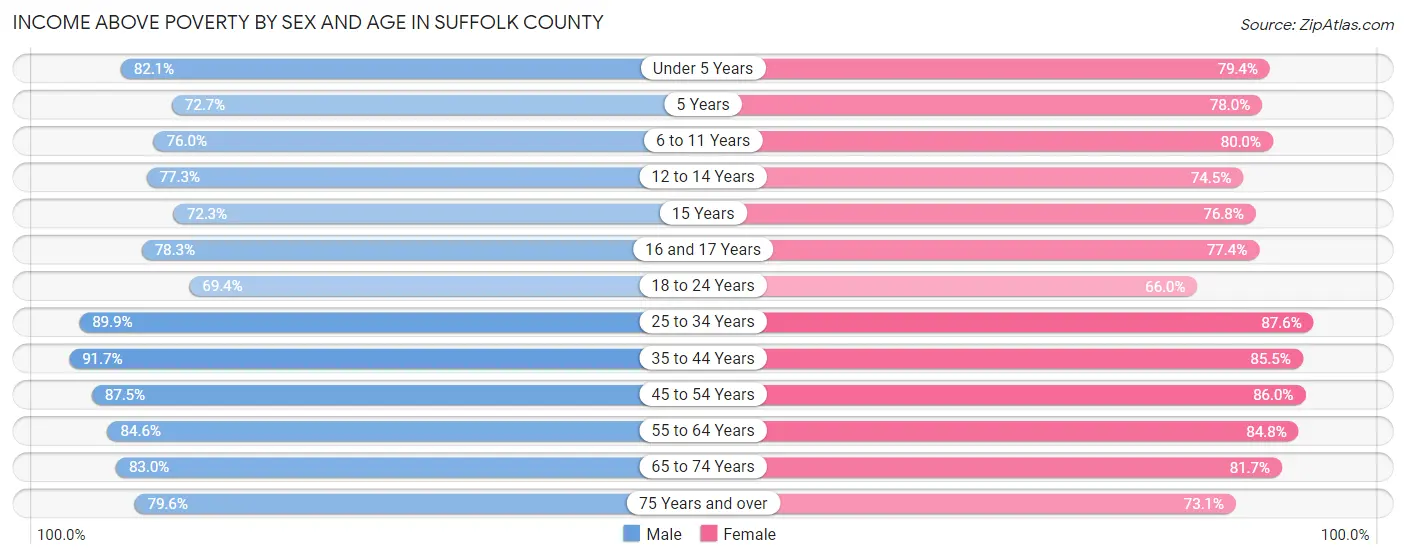
| Age Bracket | Male | Female |
| Under 5 Years | 15,944 (82.1%) | 14,924 (79.4%) |
| 5 Years | 2,910 (72.7%) | 1,904 (78.0%) |
| 6 to 11 Years | 14,649 (76.0%) | 15,998 (80.0%) |
| 12 to 14 Years | 8,355 (77.3%) | 7,804 (74.5%) |
| 15 Years | 2,726 (72.3%) | 3,015 (76.8%) |
| 16 and 17 Years | 5,296 (78.2%) | 4,848 (77.4%) |
| 18 to 24 Years | 24,705 (69.4%) | 25,284 (66.0%) |
| 25 to 34 Years | 78,748 (89.8%) | 78,172 (87.5%) |
| 35 to 44 Years | 48,560 (91.7%) | 44,692 (85.5%) |
| 45 to 54 Years | 36,506 (87.5%) | 37,178 (86.0%) |
| 55 to 64 Years | 33,949 (84.6%) | 36,231 (84.8%) |
| 65 to 74 Years | 21,409 (83.0%) | 25,631 (81.7%) |
| 75 Years and over | 12,022 (79.6%) | 17,457 (73.1%) |
| Total | 305,779 (84.3%) | 313,138 (81.8%) |
Income Below Poverty Among Married-Couple Families in Suffolk County
The poverty statistics for married-couple families in Suffolk County show that 5.9% or 5,573 of the total 94,536 families live below the poverty line. Families with 5 or more children have the highest poverty rate of 31.9%, comprising of 130 families. On the other hand, families with 1 or 2 children have the lowest poverty rate of 5.0%, which includes 1,589 families.
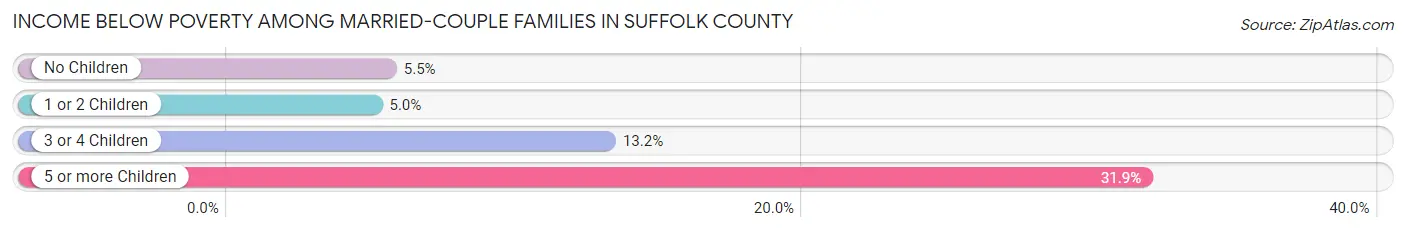
| Children | Above Poverty | Below Poverty |
| No Children | 54,148 (94.5%) | 3,167 (5.5%) |
| 1 or 2 Children | 30,005 (95.0%) | 1,589 (5.0%) |
| 3 or 4 Children | 4,532 (86.8%) | 687 (13.2%) |
| 5 or more Children | 278 (68.1%) | 130 (31.9%) |
| Total | 88,963 (94.1%) | 5,573 (5.9%) |
Income Below Poverty Among Single-Parent Households in Suffolk County
According to the poverty data in Suffolk County, 14.5% or 2,084 single-father households and 24.4% or 10,911 single-mother households are living below the poverty line. Among single-father households, those with 3 or 4 children have the highest poverty rate, with 276 households (38.4%) experiencing poverty. Likewise, among single-mother households, those with 5 or more children have the highest poverty rate, with 113 households (76.9%) falling below the poverty line.
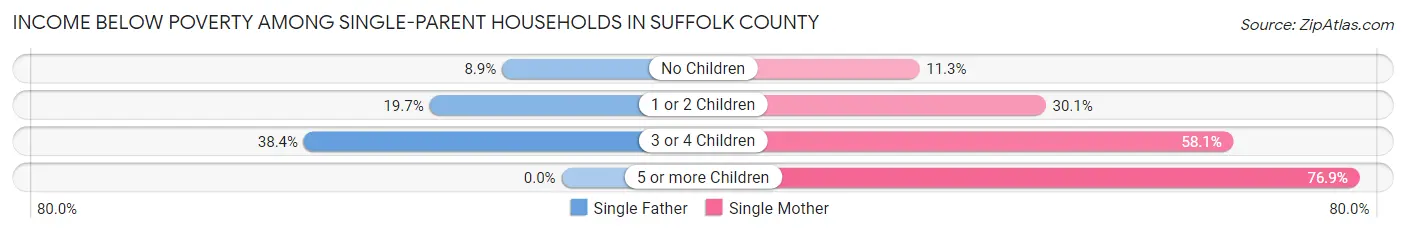
| Children | Single Father | Single Mother |
| No Children | 723 (8.9%) | 2,127 (11.3%) |
| 1 or 2 Children | 1,085 (19.7%) | 6,689 (30.1%) |
| 3 or 4 Children | 276 (38.4%) | 1,982 (58.1%) |
| 5 or more Children | 0 (0.0%) | 113 (76.9%) |
| Total | 2,084 (14.5%) | 10,911 (24.4%) |
Income Below Poverty Among Married-Couple vs Single-Parent Households in Suffolk County
The poverty data for Suffolk County shows that 5,573 of the married-couple family households (5.9%) and 12,995 of the single-parent households (22.0%) are living below the poverty level. Within the married-couple family households, those with 5 or more children have the highest poverty rate, with 130 households (31.9%) falling below the poverty line. Among the single-parent households, those with 5 or more children have the highest poverty rate, with 113 household (76.9%) living below poverty.
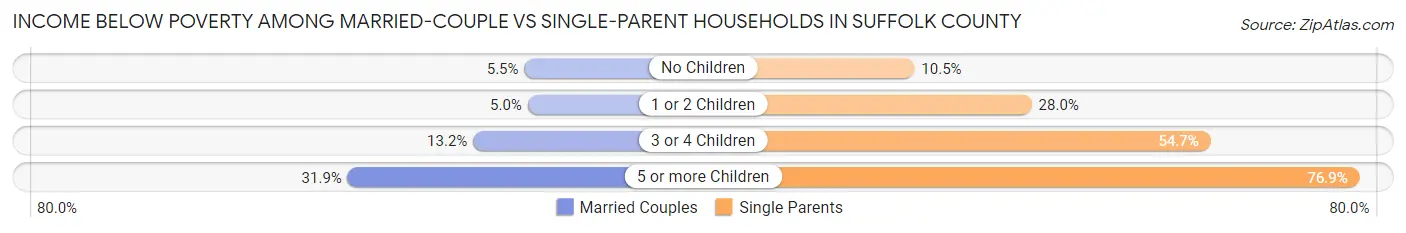
| Children | Married-Couple Families | Single-Parent Households |
| No Children | 3,167 (5.5%) | 2,850 (10.5%) |
| 1 or 2 Children | 1,589 (5.0%) | 7,774 (28.0%) |
| 3 or 4 Children | 687 (13.2%) | 2,258 (54.7%) |
| 5 or more Children | 130 (31.9%) | 113 (76.9%) |
| Total | 5,573 (5.9%) | 12,995 (22.0%) |
Employment Characteristics in Suffolk County
Employment by Class of Employer in Suffolk County
Among the 424,949 employed individuals in Suffolk County, private company employees (273,565 | 64.4%), not-for-profit organizations (78,300 | 18.4%), and local government employees (25,836 | 6.1%) make up the most common classes of employment.
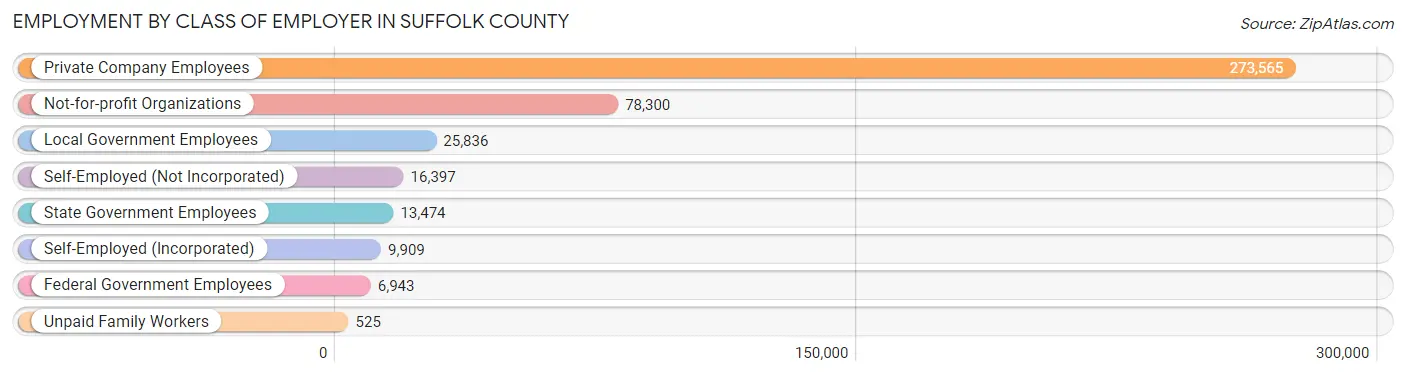
| Employer Class | # Employees | % Employees |
| Private Company Employees | 273,565 | 64.4% |
| Self-Employed (Incorporated) | 9,909 | 2.3% |
| Self-Employed (Not Incorporated) | 16,397 | 3.9% |
| Not-for-profit Organizations | 78,300 | 18.4% |
| Local Government Employees | 25,836 | 6.1% |
| State Government Employees | 13,474 | 3.2% |
| Federal Government Employees | 6,943 | 1.6% |
| Unpaid Family Workers | 525 | 0.1% |
| Total | 424,949 | 100.0% |
Employment Status by Age in Suffolk County
According to the labor force statistics for Suffolk County, out of the total population over 16 years of age (670,057), 69.7% or 467,030 individuals are in the labor force, with 6.7% or 31,291 of them unemployed. The age group with the highest labor force participation rate is 30 to 34 years, with 90.2% or 75,802 individuals in the labor force. Within the labor force, the 16 to 19 years age range has the highest percentage of unemployed individuals, with 22.3% or 4,006 of them being unemployed.
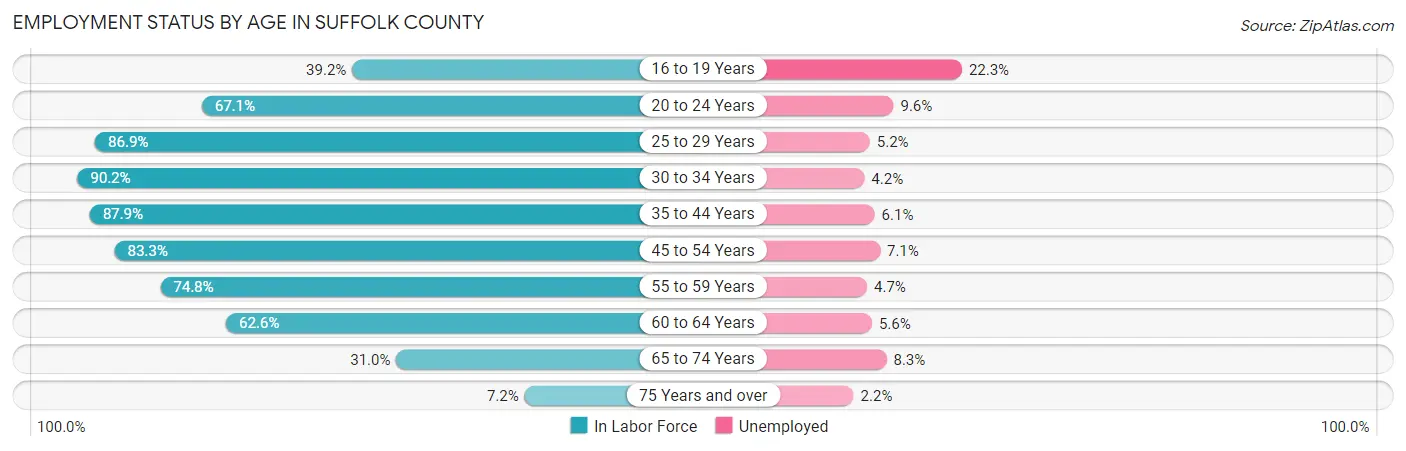
| Age Bracket | In Labor Force | Unemployed |
| 16 to 19 Years | 17,964 (39.2%) | 4,006 (22.3%) |
| 20 to 24 Years | 49,049 (67.1%) | 4,709 (9.6%) |
| 25 to 29 Years | 81,840 (86.9%) | 4,256 (5.2%) |
| 30 to 34 Years | 75,802 (90.2%) | 3,184 (4.2%) |
| 35 to 44 Years | 92,773 (87.9%) | 5,659 (6.1%) |
| 45 to 54 Years | 71,087 (83.3%) | 5,047 (7.1%) |
| 55 to 59 Years | 32,603 (74.8%) | 1,532 (4.7%) |
| 60 to 64 Years | 24,860 (62.6%) | 1,392 (5.6%) |
| 65 to 74 Years | 17,904 (31.0%) | 1,486 (8.3%) |
| 75 Years and over | 2,951 (7.2%) | 65 (2.2%) |
| Total | 467,030 (69.7%) | 31,291 (6.7%) |
Employment Status by Educational Attainment in Suffolk County
According to labor force statistics for Suffolk County, 83.7% of individuals (378,657) out of the total population between 25 and 64 years of age (452,398) are in the labor force, with 5.6% or 21,205 of them being unemployed. The group with the highest labor force participation rate are those with the educational attainment of bachelor's degree or higher, with 90.2% or 217,719 individuals in the labor force. Within the labor force, individuals with less than high school education have the highest percentage of unemployment, with 12.9% or 4,141 of them being unemployed.
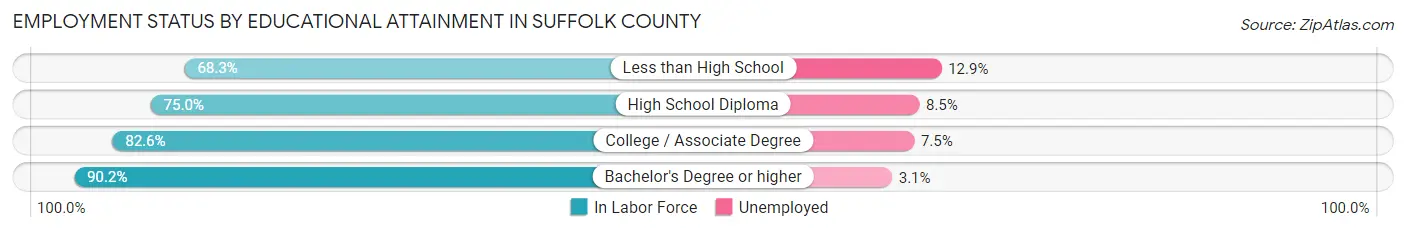
| Educational Attainment | In Labor Force | Unemployed |
| Less than High School | 32,100 (68.3%) | 6,063 (12.9%) |
| High School Diploma | 63,784 (75.0%) | 7,229 (8.5%) |
| College / Associate Degree | 65,237 (82.6%) | 5,924 (7.5%) |
| Bachelor's Degree or higher | 217,719 (90.2%) | 7,483 (3.1%) |
| Total | 378,657 (83.7%) | 25,334 (5.6%) |
Employment Occupations by Sex in Suffolk County
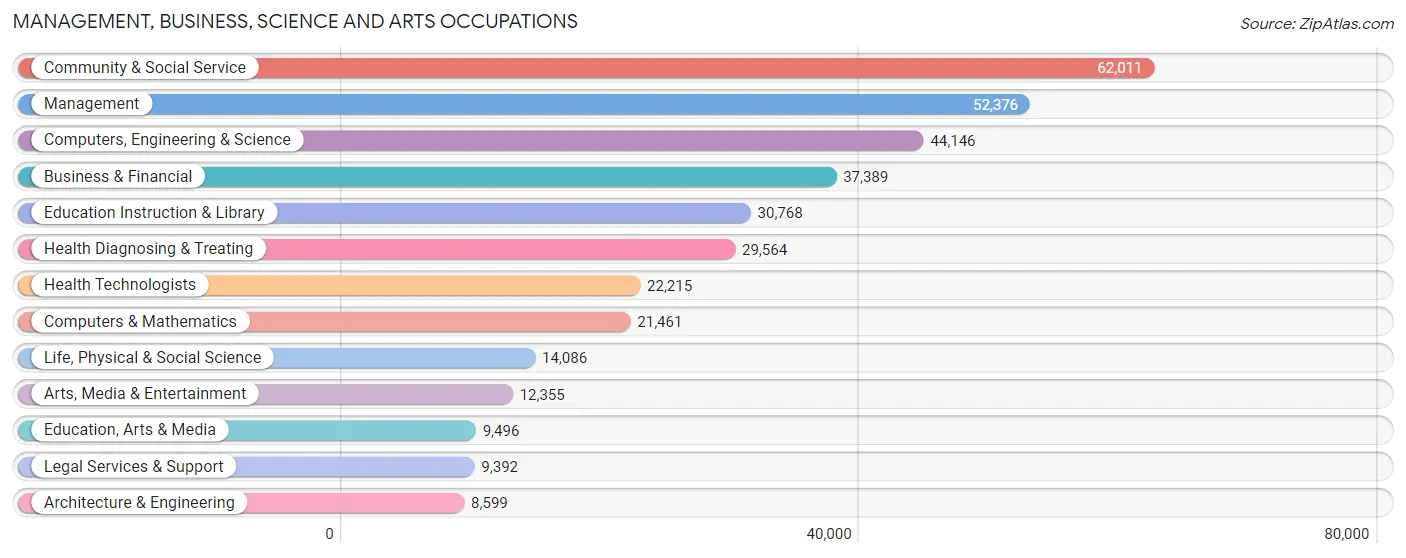
Management, Business, Science and Arts Occupations
The most common Management, Business, Science and Arts occupations in Suffolk County are Community & Social Service (62,011 | 14.3%), Management (52,376 | 12.0%), Computers, Engineering & Science (44,146 | 10.2%), Business & Financial (37,389 | 8.6%), and Education Instruction & Library (30,768 | 7.1%).
Management, Business, Science and Arts Occupations by Sex
Within the Management, Business, Science and Arts occupations in Suffolk County, the most male-oriented occupations are Architecture & Engineering (75.6%), Computers & Mathematics (69.7%), and Computers, Engineering & Science (65.5%), while the most female-oriented occupations are Health Technologists (72.4%), Health Diagnosing & Treating (71.6%), and Education, Arts & Media (69.0%).
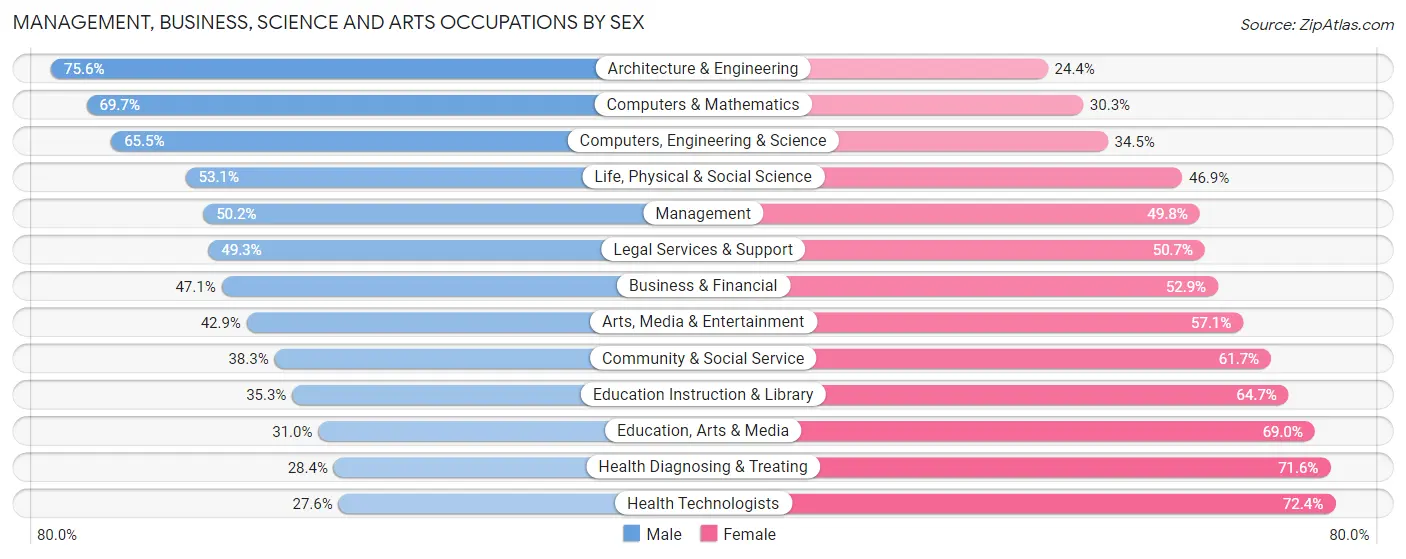
| Occupation | Male | Female |
| Management | 26,290 (50.2%) | 26,086 (49.8%) |
| Business & Financial | 17,624 (47.1%) | 19,765 (52.9%) |
| Computers, Engineering & Science | 28,932 (65.5%) | 15,214 (34.5%) |
| Computers & Mathematics | 14,952 (69.7%) | 6,509 (30.3%) |
| Architecture & Engineering | 6,497 (75.6%) | 2,102 (24.4%) |
| Life, Physical & Social Science | 7,483 (53.1%) | 6,603 (46.9%) |
| Community & Social Service | 23,753 (38.3%) | 38,258 (61.7%) |
| Education, Arts & Media | 2,943 (31.0%) | 6,553 (69.0%) |
| Legal Services & Support | 4,633 (49.3%) | 4,759 (50.7%) |
| Education Instruction & Library | 10,872 (35.3%) | 19,896 (64.7%) |
| Arts, Media & Entertainment | 5,305 (42.9%) | 7,050 (57.1%) |
| Health Diagnosing & Treating | 8,400 (28.4%) | 21,164 (71.6%) |
| Health Technologists | 6,133 (27.6%) | 16,082 (72.4%) |
| Total (Category) | 104,999 (46.6%) | 120,487 (53.4%) |
| Total (Overall) | 215,277 (49.5%) | 219,634 (50.5%) |
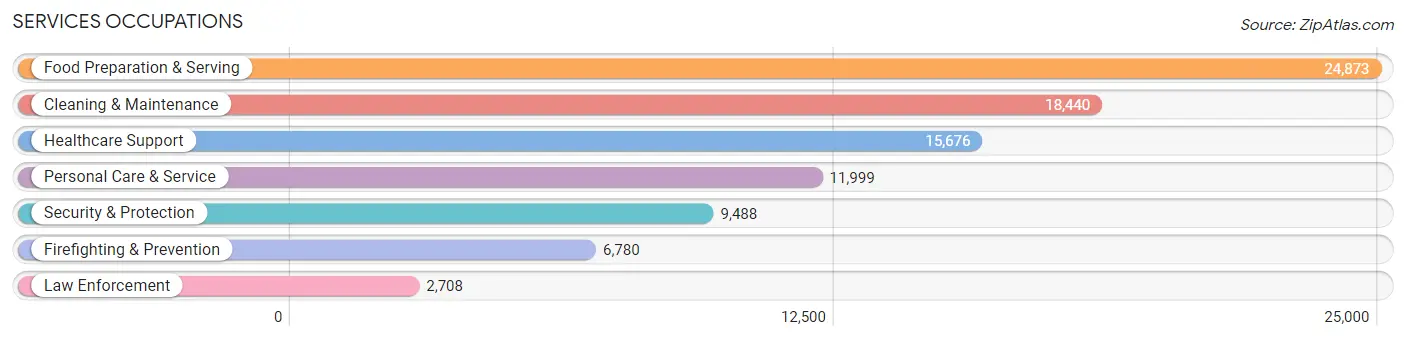
Services Occupations
The most common Services occupations in Suffolk County are Food Preparation & Serving (24,873 | 5.7%), Cleaning & Maintenance (18,440 | 4.2%), Healthcare Support (15,676 | 3.6%), Personal Care & Service (11,999 | 2.8%), and Security & Protection (9,488 | 2.2%).
Services Occupations by Sex
Within the Services occupations in Suffolk County, the most male-oriented occupations are Law Enforcement (81.9%), Security & Protection (77.2%), and Firefighting & Prevention (75.4%), while the most female-oriented occupations are Healthcare Support (87.5%), Personal Care & Service (70.4%), and Food Preparation & Serving (46.5%).
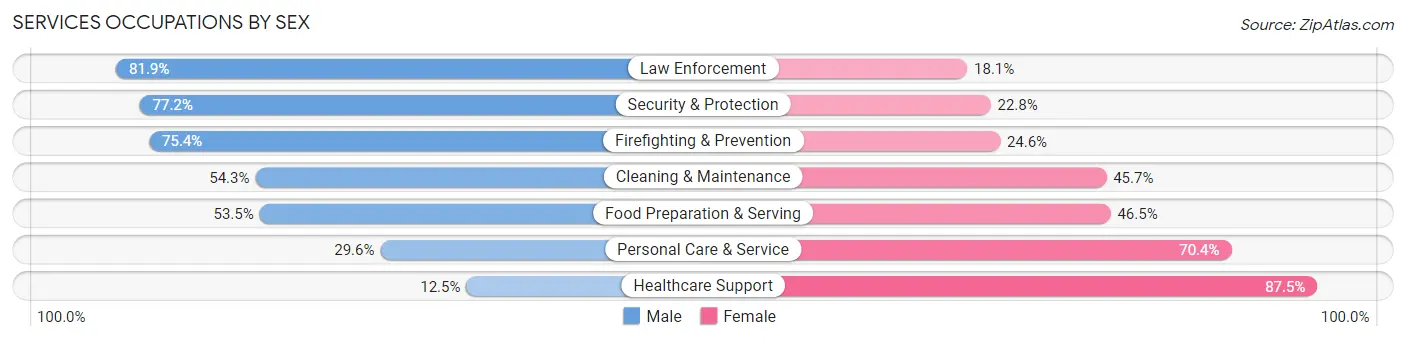
| Occupation | Male | Female |
| Healthcare Support | 1,965 (12.5%) | 13,711 (87.5%) |
| Security & Protection | 7,327 (77.2%) | 2,161 (22.8%) |
| Firefighting & Prevention | 5,110 (75.4%) | 1,670 (24.6%) |
| Law Enforcement | 2,217 (81.9%) | 491 (18.1%) |
| Food Preparation & Serving | 13,301 (53.5%) | 11,572 (46.5%) |
| Cleaning & Maintenance | 10,017 (54.3%) | 8,423 (45.7%) |
| Personal Care & Service | 3,547 (29.6%) | 8,452 (70.4%) |
| Total (Category) | 36,157 (44.9%) | 44,319 (55.1%) |
| Total (Overall) | 215,277 (49.5%) | 219,634 (50.5%) |
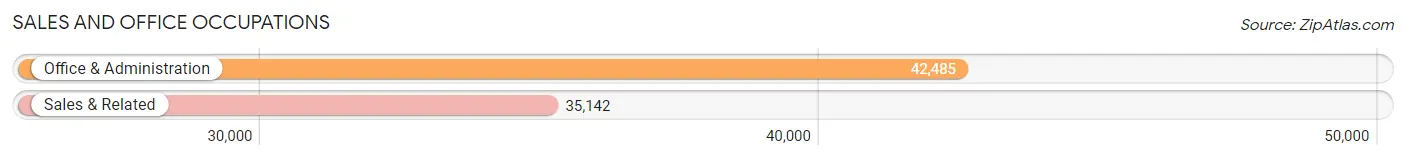
Sales and Office Occupations
The most common Sales and Office occupations in Suffolk County are Office & Administration (42,485 | 9.8%), and Sales & Related (35,142 | 8.1%).
Sales and Office Occupations by Sex
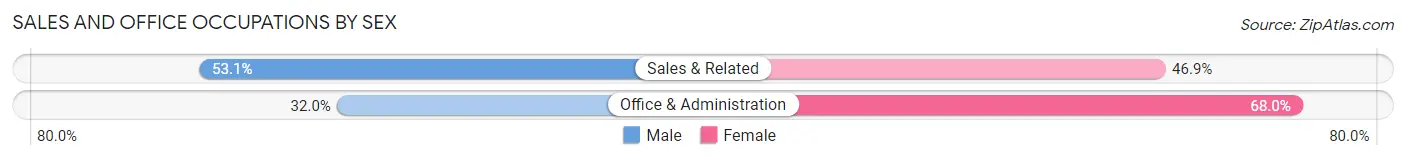
| Occupation | Male | Female |
| Sales & Related | 18,673 (53.1%) | 16,469 (46.9%) |
| Office & Administration | 13,590 (32.0%) | 28,895 (68.0%) |
| Total (Category) | 32,263 (41.6%) | 45,364 (58.4%) |
| Total (Overall) | 215,277 (49.5%) | 219,634 (50.5%) |
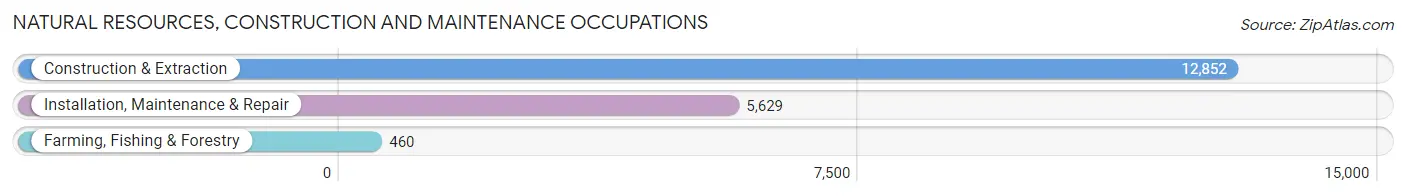
Natural Resources, Construction and Maintenance Occupations
The most common Natural Resources, Construction and Maintenance occupations in Suffolk County are Construction & Extraction (12,852 | 3.0%), Installation, Maintenance & Repair (5,629 | 1.3%), and Farming, Fishing & Forestry (460 | 0.1%).
Natural Resources, Construction and Maintenance Occupations by Sex
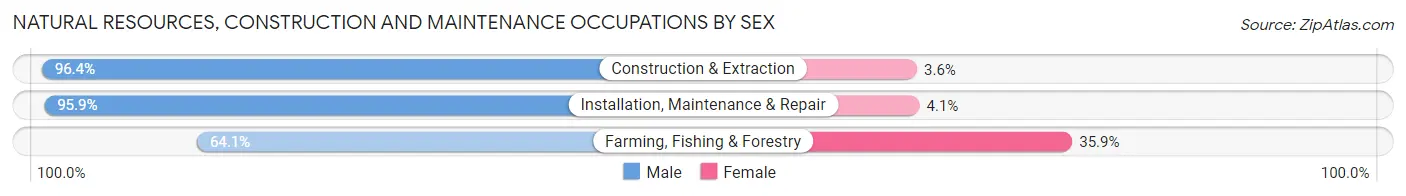
| Occupation | Male | Female |
| Farming, Fishing & Forestry | 295 (64.1%) | 165 (35.9%) |
| Construction & Extraction | 12,392 (96.4%) | 460 (3.6%) |
| Installation, Maintenance & Repair | 5,399 (95.9%) | 230 (4.1%) |
| Total (Category) | 18,086 (95.5%) | 855 (4.5%) |
| Total (Overall) | 215,277 (49.5%) | 219,634 (50.5%) |
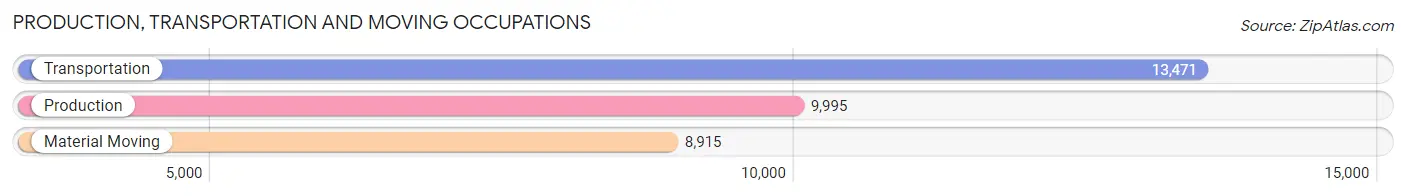
Production, Transportation and Moving Occupations
The most common Production, Transportation and Moving occupations in Suffolk County are Transportation (13,471 | 3.1%), Production (9,995 | 2.3%), and Material Moving (8,915 | 2.1%).
Production, Transportation and Moving Occupations by Sex
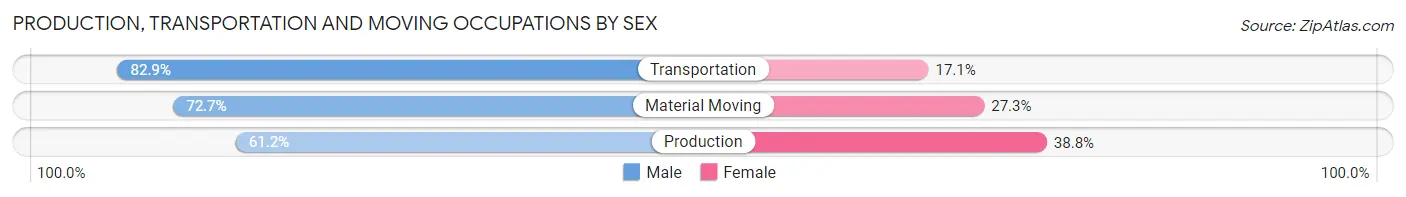
| Occupation | Male | Female |
| Production | 6,119 (61.2%) | 3,876 (38.8%) |
| Transportation | 11,171 (82.9%) | 2,300 (17.1%) |
| Material Moving | 6,482 (72.7%) | 2,433 (27.3%) |
| Total (Category) | 23,772 (73.4%) | 8,609 (26.6%) |
| Total (Overall) | 215,277 (49.5%) | 219,634 (50.5%) |
Employment Industries by Sex in Suffolk County
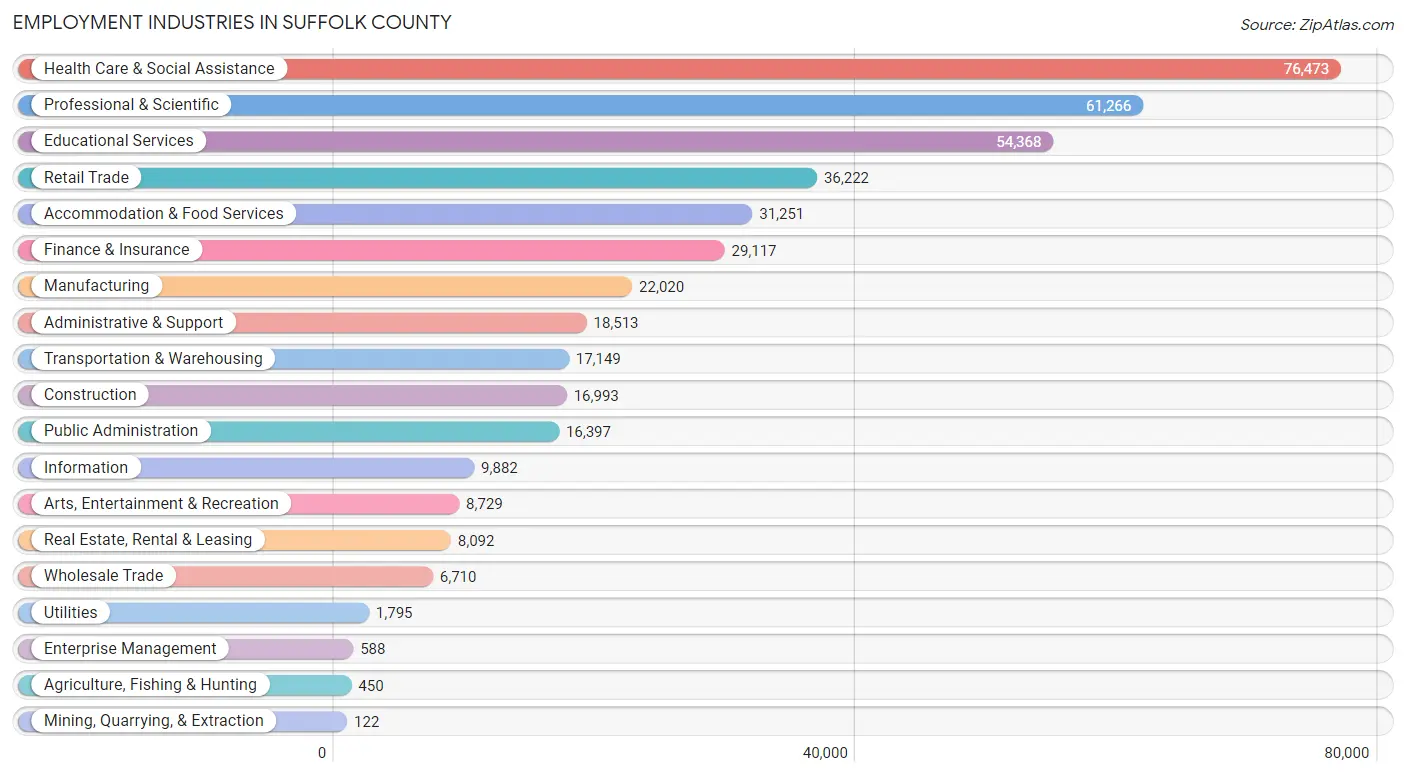
Employment Industries in Suffolk County
The major employment industries in Suffolk County include Health Care & Social Assistance (76,473 | 17.6%), Professional & Scientific (61,266 | 14.1%), Educational Services (54,368 | 12.5%), Retail Trade (36,222 | 8.3%), and Accommodation & Food Services (31,251 | 7.2%).
Employment Industries by Sex in Suffolk County
The Suffolk County industries that see more men than women are Mining, Quarrying, & Extraction (100.0%), Construction (90.5%), and Transportation & Warehousing (74.6%), whereas the industries that tend to have a higher number of women are Health Care & Social Assistance (73.6%), Educational Services (63.0%), and Retail Trade (49.5%).
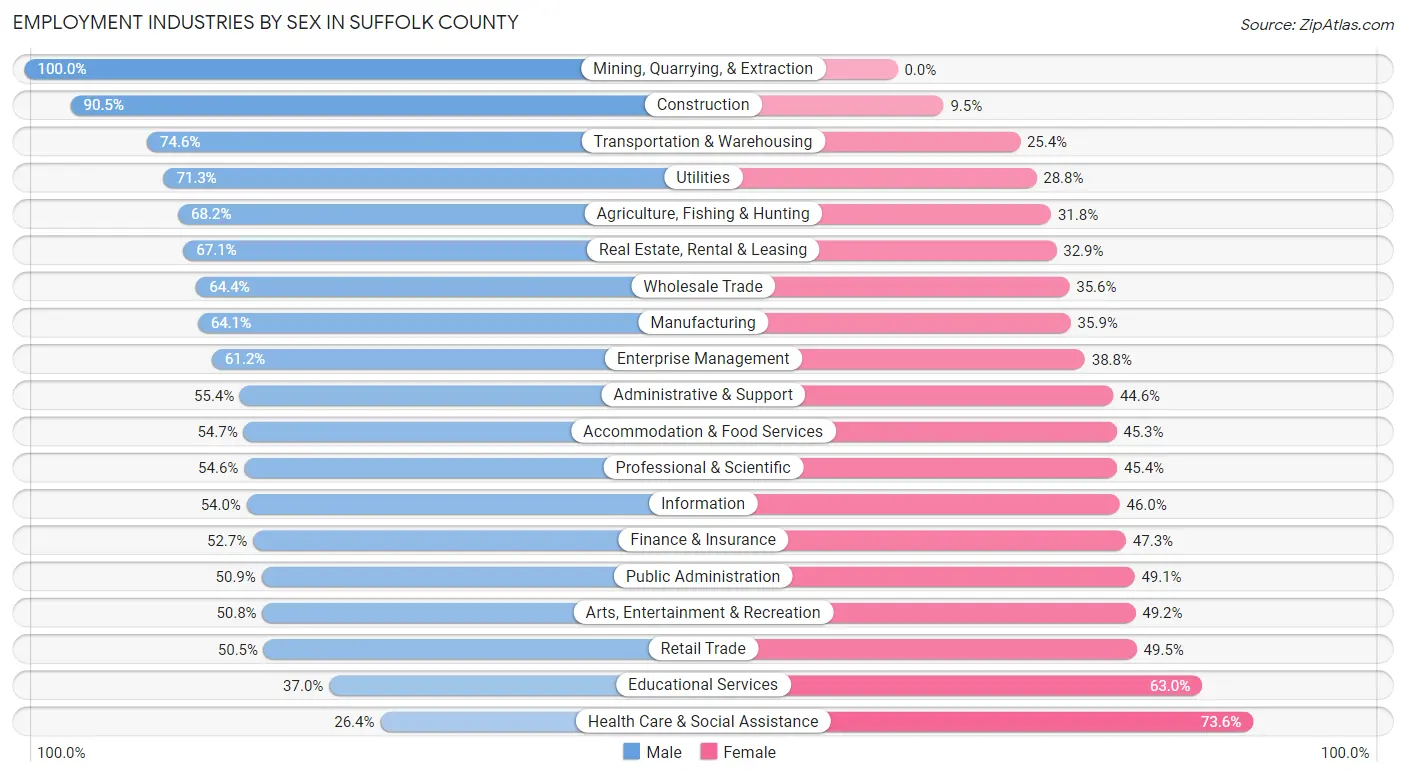
| Industry | Male | Female |
| Agriculture, Fishing & Hunting | 307 (68.2%) | 143 (31.8%) |
| Mining, Quarrying, & Extraction | 122 (100.0%) | 0 (0.0%) |
| Construction | 15,373 (90.5%) | 1,620 (9.5%) |
| Manufacturing | 14,124 (64.1%) | 7,896 (35.9%) |
| Wholesale Trade | 4,323 (64.4%) | 2,387 (35.6%) |
| Retail Trade | 18,286 (50.5%) | 17,936 (49.5%) |
| Transportation & Warehousing | 12,800 (74.6%) | 4,349 (25.4%) |
| Utilities | 1,279 (71.3%) | 516 (28.7%) |
| Information | 5,339 (54.0%) | 4,543 (46.0%) |
| Finance & Insurance | 15,347 (52.7%) | 13,770 (47.3%) |
| Real Estate, Rental & Leasing | 5,431 (67.1%) | 2,661 (32.9%) |
| Professional & Scientific | 33,425 (54.6%) | 27,841 (45.4%) |
| Enterprise Management | 360 (61.2%) | 228 (38.8%) |
| Administrative & Support | 10,254 (55.4%) | 8,259 (44.6%) |
| Educational Services | 20,092 (37.0%) | 34,276 (63.0%) |
| Health Care & Social Assistance | 20,172 (26.4%) | 56,301 (73.6%) |
| Arts, Entertainment & Recreation | 4,432 (50.8%) | 4,297 (49.2%) |
| Accommodation & Food Services | 17,091 (54.7%) | 14,160 (45.3%) |
| Public Administration | 8,353 (50.9%) | 8,044 (49.1%) |
| Total | 215,277 (49.5%) | 219,634 (50.5%) |
Education in Suffolk County
School Enrollment in Suffolk County
The most common levels of schooling among the 207,997 students in Suffolk County are college / undergraduate (74,118 | 35.6%), graduate / professional (32,741 | 15.7%), and high school (30,062 | 14.4%).
| School Level | # Students | % Students |
| Nursery / Preschool | 8,396 | 4.0% |
| Kindergarten | 8,711 | 4.2% |
| Elementary School | 26,460 | 12.7% |
| Middle School | 27,509 | 13.2% |
| High School | 30,062 | 14.4% |
| College / Undergraduate | 74,118 | 35.6% |
| Graduate / Professional | 32,741 | 15.7% |
| Total | 207,997 | 100.0% |
School Enrollment by Age by Funding Source in Suffolk County
Out of a total of 207,997 students who are enrolled in schools in Suffolk County, 95,887 (46.1%) attend a private institution, while the remaining 112,110 (53.9%) are enrolled in public schools. The age group of 20 to 24 year olds has the highest likelihood of being enrolled in private schools, with 33,504 (75.5% in the age bracket) enrolled. Conversely, the age group of 10 to 14 year olds has the lowest likelihood of being enrolled in a private school, with 30,555 (87.0% in the age bracket) attending a public institution.
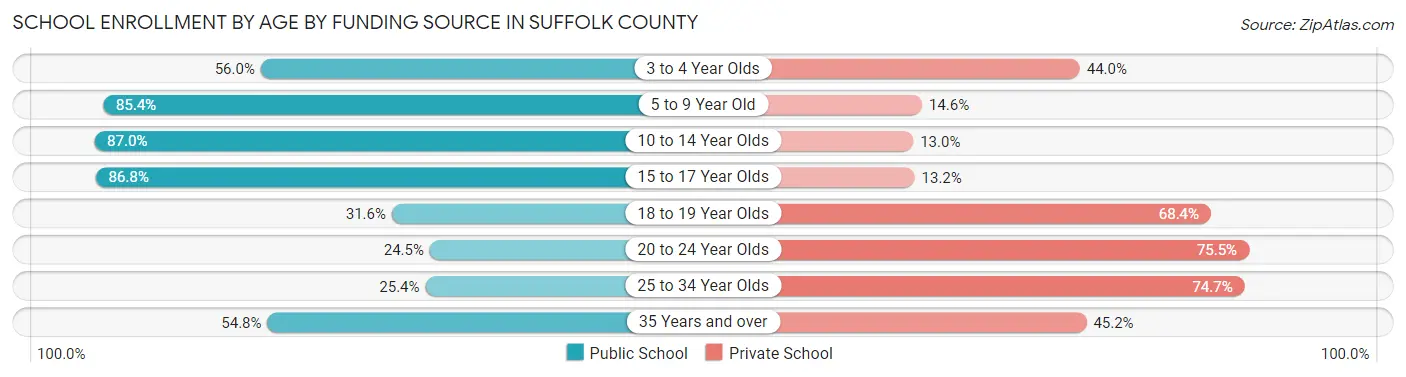
| Age Bracket | Public School | Private School |
| 3 to 4 Year Olds | 4,870 (56.0%) | 3,823 (44.0%) |
| 5 to 9 Year Old | 26,071 (85.4%) | 4,452 (14.6%) |
| 10 to 14 Year Olds | 30,555 (87.0%) | 4,551 (13.0%) |
| 15 to 17 Year Olds | 17,620 (86.8%) | 2,681 (13.2%) |
| 18 to 19 Year Olds | 9,359 (31.6%) | 20,249 (68.4%) |
| 20 to 24 Year Olds | 10,886 (24.5%) | 33,504 (75.5%) |
| 25 to 34 Year Olds | 7,522 (25.4%) | 22,146 (74.7%) |
| 35 Years and over | 5,318 (54.8%) | 4,390 (45.2%) |
| Total | 112,110 (53.9%) | 95,887 (46.1%) |
Educational Attainment by Field of Study in Suffolk County
Business (51,520 | 17.2%), social sciences (37,891 | 12.7%), bio, nature & agricultural (25,254 | 8.4%), science & technology (23,568 | 7.9%), and engineering (22,574 | 7.5%) are the most common fields of study among 299,060 individuals in Suffolk County who have obtained a bachelor's degree or higher.
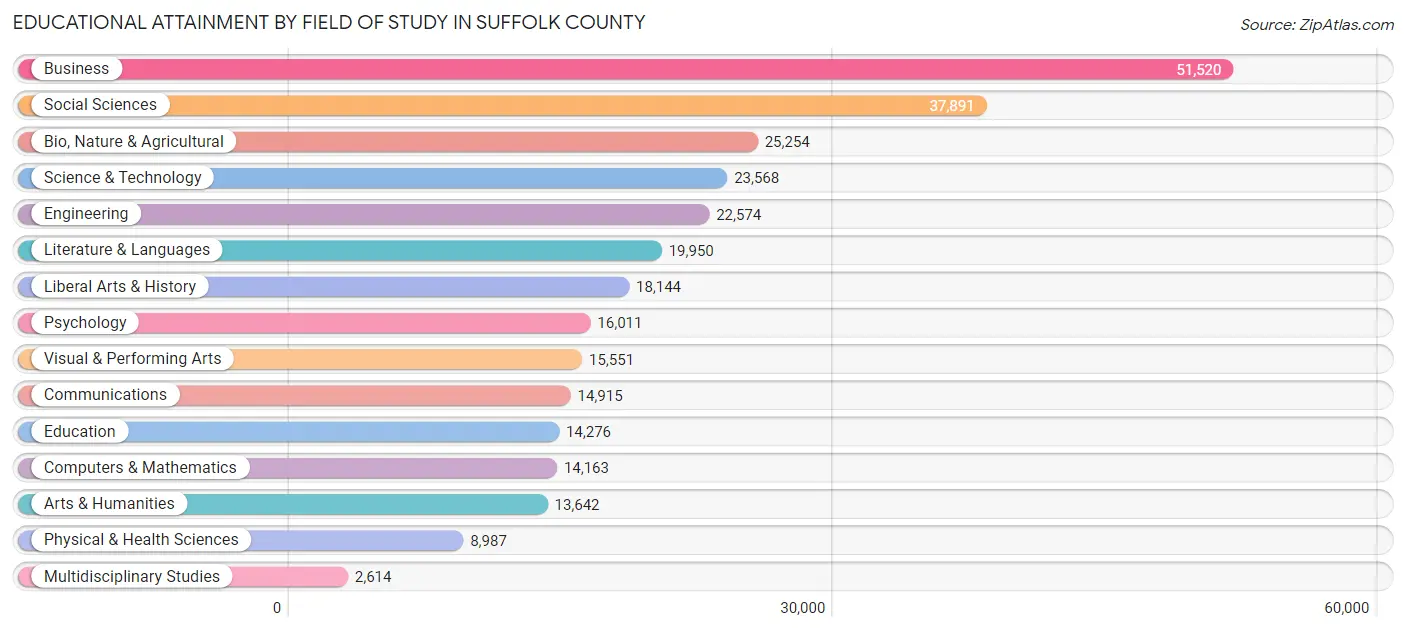
| Field of Study | # Graduates | % Graduates |
| Computers & Mathematics | 14,163 | 4.7% |
| Bio, Nature & Agricultural | 25,254 | 8.4% |
| Physical & Health Sciences | 8,987 | 3.0% |
| Psychology | 16,011 | 5.3% |
| Social Sciences | 37,891 | 12.7% |
| Engineering | 22,574 | 7.5% |
| Multidisciplinary Studies | 2,614 | 0.9% |
| Science & Technology | 23,568 | 7.9% |
| Business | 51,520 | 17.2% |
| Education | 14,276 | 4.8% |
| Literature & Languages | 19,950 | 6.7% |
| Liberal Arts & History | 18,144 | 6.1% |
| Visual & Performing Arts | 15,551 | 5.2% |
| Communications | 14,915 | 5.0% |
| Arts & Humanities | 13,642 | 4.6% |
| Total | 299,060 | 100.0% |
Transportation & Commute in Suffolk County
Vehicle Availability by Sex in Suffolk County
The most prevalent vehicle ownership categories in Suffolk County are males with 1 vehicle (81,826, accounting for 39.8%) and females with 1 vehicle (85,235, making up 39.8%).
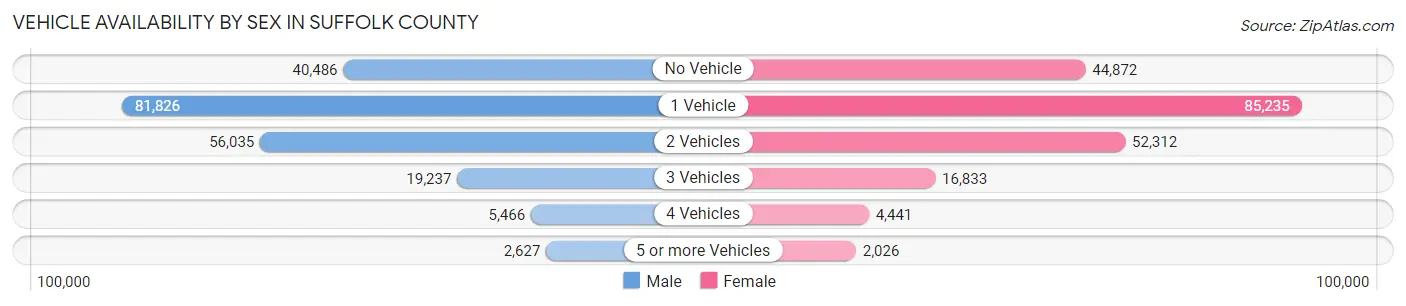
| Vehicles Available | Male | Female |
| No Vehicle | 40,486 (19.7%) | 44,872 (21.8%) |
| 1 Vehicle | 81,826 (39.8%) | 85,235 (41.4%) |
| 2 Vehicles | 56,035 (27.2%) | 52,312 (25.4%) |
| 3 Vehicles | 19,237 (9.3%) | 16,833 (8.2%) |
| 4 Vehicles | 5,466 (2.7%) | 4,441 (2.2%) |
| 5 or more Vehicles | 2,627 (1.3%) | 2,026 (1.0%) |
| Total | 205,677 (100.0%) | 205,719 (100.0%) |
Commute Time in Suffolk County
The most frequently occuring commute durations in Suffolk County are 30 to 34 minutes (69,172 commuters, 19.2%), 20 to 24 minutes (47,106 commuters, 13.0%), and 15 to 19 minutes (45,068 commuters, 12.5%).
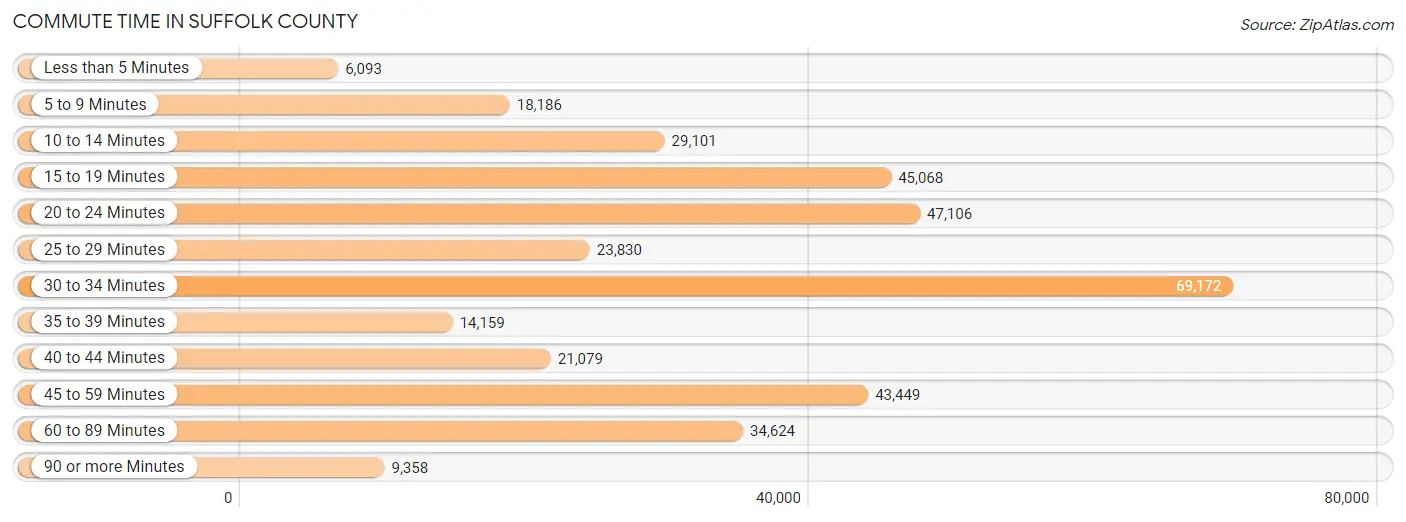
| Commute Time | # Commuters | % Commuters |
| Less than 5 Minutes | 6,093 | 1.7% |
| 5 to 9 Minutes | 18,186 | 5.0% |
| 10 to 14 Minutes | 29,101 | 8.1% |
| 15 to 19 Minutes | 45,068 | 12.5% |
| 20 to 24 Minutes | 47,106 | 13.0% |
| 25 to 29 Minutes | 23,830 | 6.6% |
| 30 to 34 Minutes | 69,172 | 19.2% |
| 35 to 39 Minutes | 14,159 | 3.9% |
| 40 to 44 Minutes | 21,079 | 5.8% |
| 45 to 59 Minutes | 43,449 | 12.0% |
| 60 to 89 Minutes | 34,624 | 9.6% |
| 90 or more Minutes | 9,358 | 2.6% |
Commute Time by Sex in Suffolk County
The most common commute times in Suffolk County are 30 to 34 minutes (35,212 commuters, 19.6%) for males and 30 to 34 minutes (33,960 commuters, 18.7%) for females.
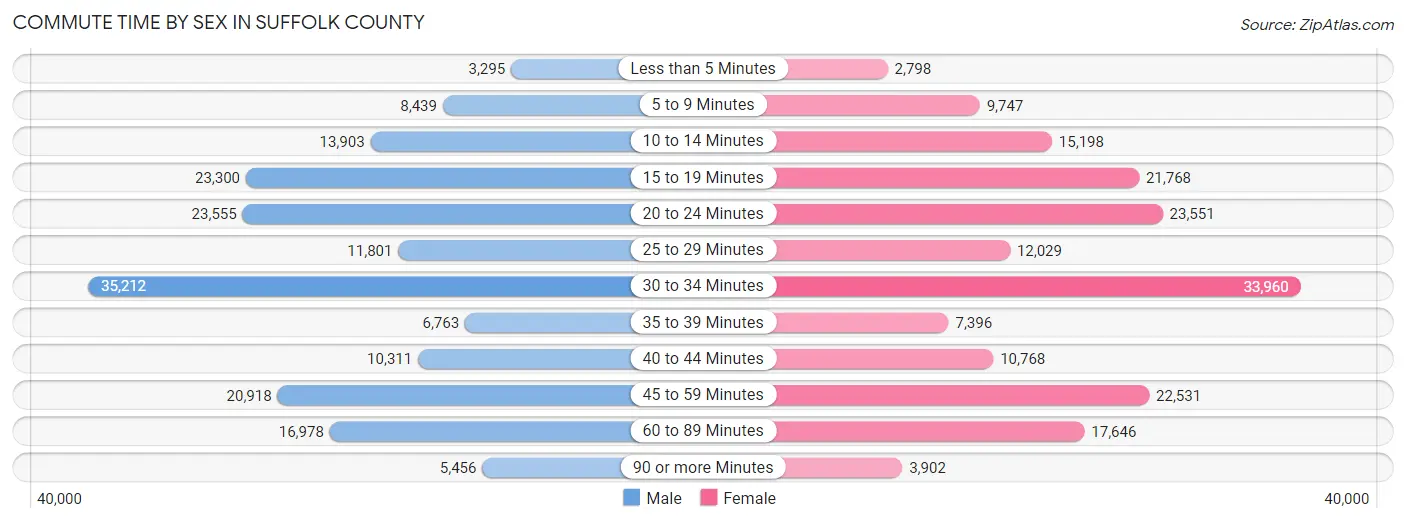
| Commute Time | Male | Female |
| Less than 5 Minutes | 3,295 (1.8%) | 2,798 (1.5%) |
| 5 to 9 Minutes | 8,439 (4.7%) | 9,747 (5.4%) |
| 10 to 14 Minutes | 13,903 (7.7%) | 15,198 (8.4%) |
| 15 to 19 Minutes | 23,300 (13.0%) | 21,768 (12.0%) |
| 20 to 24 Minutes | 23,555 (13.1%) | 23,551 (13.0%) |
| 25 to 29 Minutes | 11,801 (6.6%) | 12,029 (6.6%) |
| 30 to 34 Minutes | 35,212 (19.6%) | 33,960 (18.7%) |
| 35 to 39 Minutes | 6,763 (3.8%) | 7,396 (4.1%) |
| 40 to 44 Minutes | 10,311 (5.7%) | 10,768 (5.9%) |
| 45 to 59 Minutes | 20,918 (11.6%) | 22,531 (12.4%) |
| 60 to 89 Minutes | 16,978 (9.4%) | 17,646 (9.7%) |
| 90 or more Minutes | 5,456 (3.0%) | 3,902 (2.1%) |
Time of Departure to Work by Sex in Suffolk County
The most frequent times of departure to work in Suffolk County are 8:00 AM to 8:29 AM (25,913, 14.4%) for males and 8:00 AM to 8:29 AM (31,578, 17.4%) for females.

| Time of Departure | Male | Female |
| 12:00 AM to 4:59 AM | 7,438 (4.1%) | 4,928 (2.7%) |
| 5:00 AM to 5:29 AM | 6,432 (3.6%) | 3,189 (1.8%) |
| 5:30 AM to 5:59 AM | 7,603 (4.2%) | 4,097 (2.3%) |
| 6:00 AM to 6:29 AM | 15,516 (8.6%) | 12,257 (6.8%) |
| 6:30 AM to 6:59 AM | 12,660 (7.0%) | 13,203 (7.3%) |
| 7:00 AM to 7:29 AM | 24,105 (13.4%) | 25,692 (14.2%) |
| 7:30 AM to 7:59 AM | 17,246 (9.6%) | 22,225 (12.3%) |
| 8:00 AM to 8:29 AM | 25,913 (14.4%) | 31,578 (17.4%) |
| 8:30 AM to 8:59 AM | 12,368 (6.9%) | 16,824 (9.3%) |
| 9:00 AM to 9:59 AM | 17,197 (9.6%) | 16,104 (8.9%) |
| 10:00 AM to 10:59 AM | 6,995 (3.9%) | 6,729 (3.7%) |
| 11:00 AM to 11:59 AM | 2,897 (1.6%) | 2,943 (1.6%) |
| 12:00 PM to 3:59 PM | 14,581 (8.1%) | 12,264 (6.8%) |
| 4:00 PM to 11:59 PM | 8,980 (5.0%) | 9,261 (5.1%) |
| Total | 179,931 (100.0%) | 181,294 (100.0%) |
Housing Occupancy in Suffolk County
Occupancy by Ownership in Suffolk County
Of the total 319,307 dwellings in Suffolk County, owner-occupied units account for 115,640 (36.2%), while renter-occupied units make up 203,667 (63.8%).
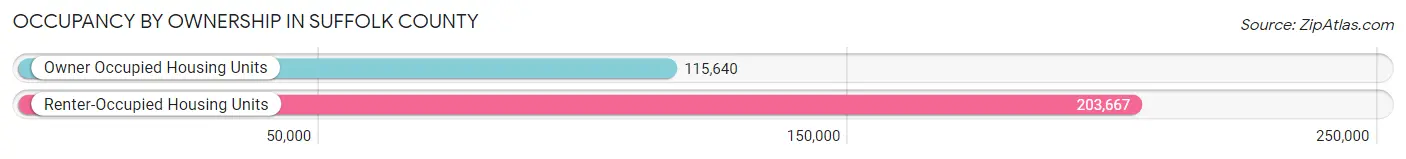
| Occupancy | # Housing Units | % Housing Units |
| Owner Occupied Housing Units | 115,640 | 36.2% |
| Renter-Occupied Housing Units | 203,667 | 63.8% |
| Total Occupied Housing Units | 319,307 | 100.0% |
Occupancy by Household Size in Suffolk County
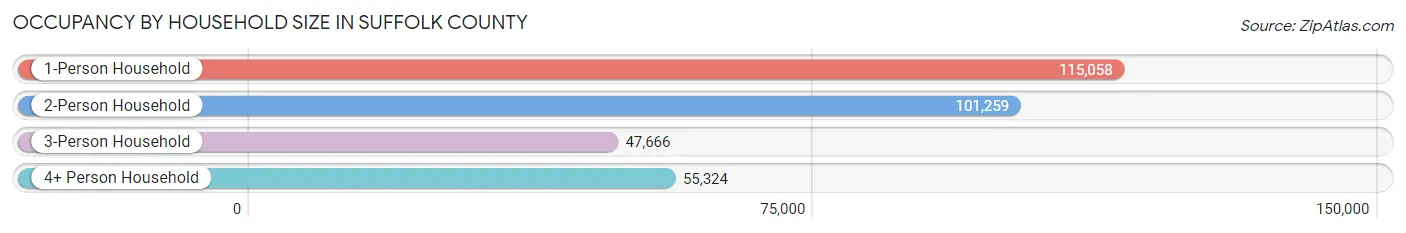
| Household Size | # Housing Units | % Housing Units |
| 1-Person Household | 115,058 | 36.0% |
| 2-Person Household | 101,259 | 31.7% |
| 3-Person Household | 47,666 | 14.9% |
| 4+ Person Household | 55,324 | 17.3% |
| Total Housing Units | 319,307 | 100.0% |
Occupancy by Ownership by Household Size in Suffolk County
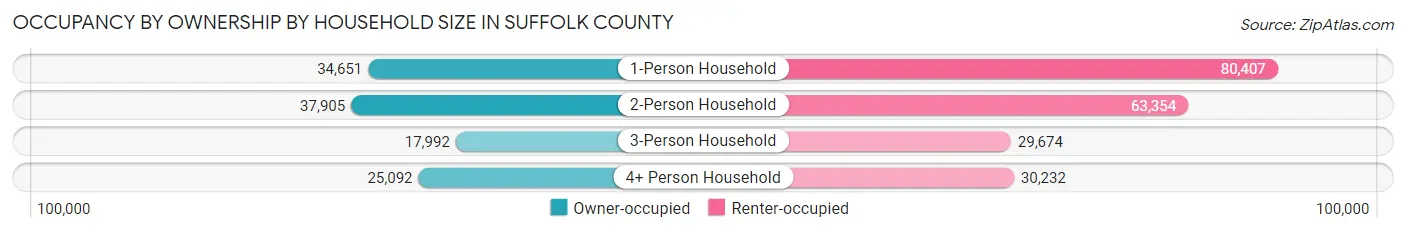
| Household Size | Owner-occupied | Renter-occupied |
| 1-Person Household | 34,651 (30.1%) | 80,407 (69.9%) |
| 2-Person Household | 37,905 (37.4%) | 63,354 (62.6%) |
| 3-Person Household | 17,992 (37.8%) | 29,674 (62.3%) |
| 4+ Person Household | 25,092 (45.4%) | 30,232 (54.6%) |
| Total Housing Units | 115,640 (36.2%) | 203,667 (63.8%) |
Occupancy by Educational Attainment in Suffolk County
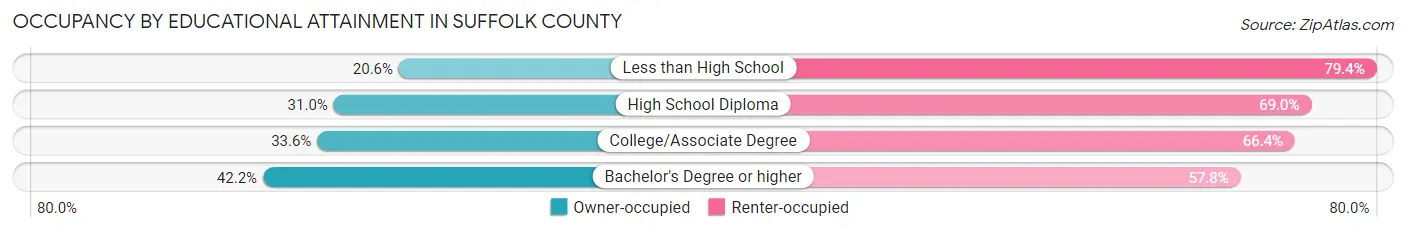
| Household Size | Owner-occupied | Renter-occupied |
| Less than High School | 7,352 (20.6%) | 28,272 (79.4%) |
| High School Diploma | 17,769 (31.0%) | 39,590 (69.0%) |
| College/Associate Degree | 19,475 (33.6%) | 38,507 (66.4%) |
| Bachelor's Degree or higher | 71,044 (42.2%) | 97,298 (57.8%) |
Occupancy by Age of Householder in Suffolk County
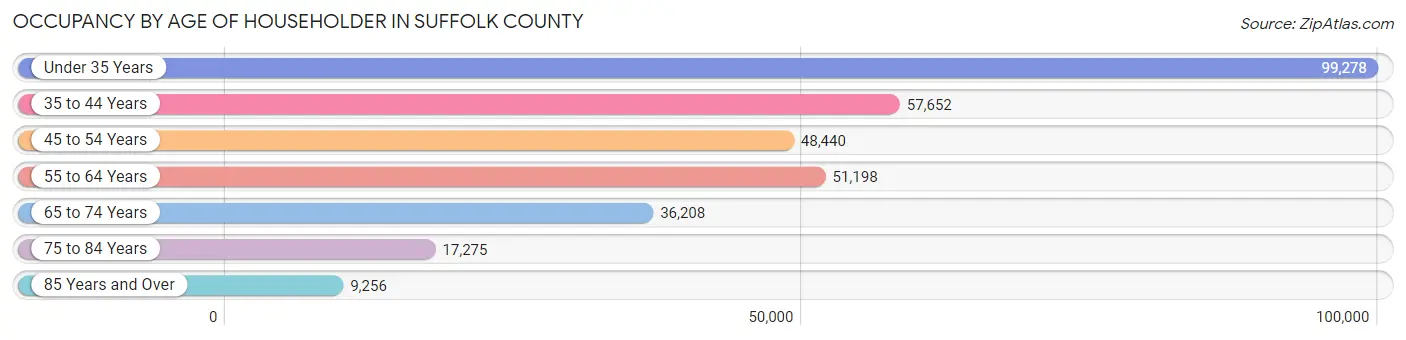
| Age Bracket | # Households | % Households |
| Under 35 Years | 99,278 | 31.1% |
| 35 to 44 Years | 57,652 | 18.1% |
| 45 to 54 Years | 48,440 | 15.2% |
| 55 to 64 Years | 51,198 | 16.0% |
| 65 to 74 Years | 36,208 | 11.3% |
| 75 to 84 Years | 17,275 | 5.4% |
| 85 Years and Over | 9,256 | 2.9% |
| Total | 319,307 | 100.0% |
Housing Finances in Suffolk County
Median Income by Occupancy in Suffolk County
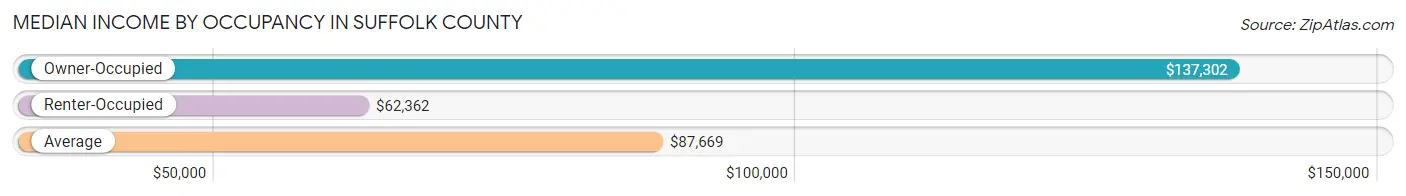
| Occupancy Type | # Households | Median Income |
| Owner-Occupied | 115,640 (36.2%) | $137,302 |
| Renter-Occupied | 203,667 (63.8%) | $62,362 |
| Average | 319,307 (100.0%) | $87,669 |
Occupancy by Householder Income Bracket in Suffolk County
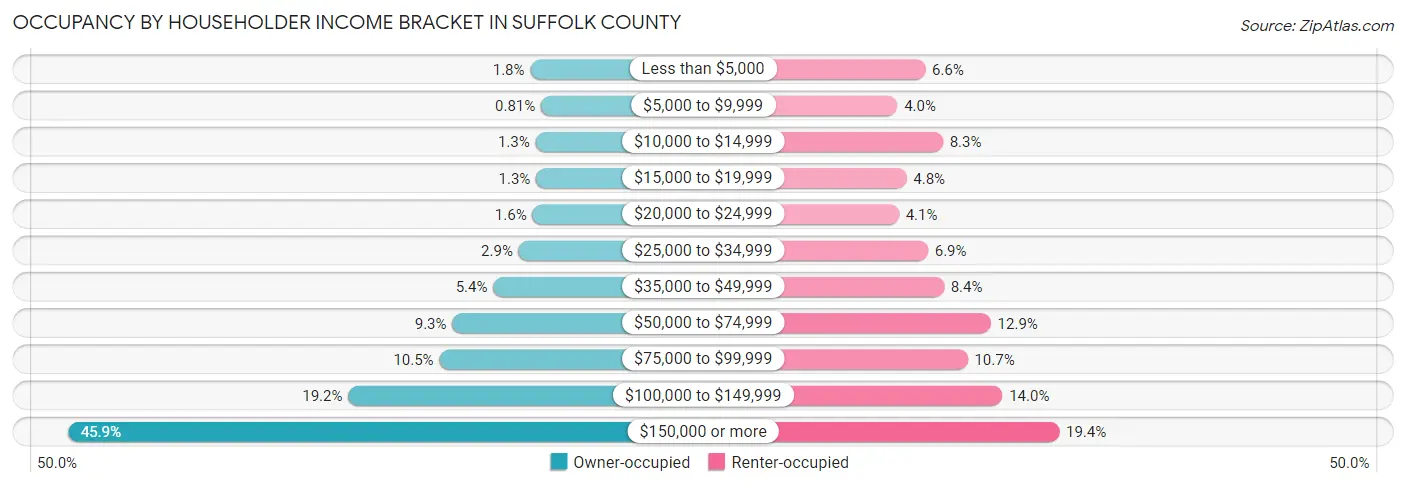
| Income Bracket | Owner-occupied | Renter-occupied |
| Less than $5,000 | 2,121 (1.8%) | 13,492 (6.6%) |
| $5,000 to $9,999 | 941 (0.8%) | 8,078 (4.0%) |
| $10,000 to $14,999 | 1,546 (1.3%) | 16,899 (8.3%) |
| $15,000 to $19,999 | 1,477 (1.3%) | 9,855 (4.8%) |
| $20,000 to $24,999 | 1,883 (1.6%) | 8,364 (4.1%) |
| $25,000 to $34,999 | 3,399 (2.9%) | 14,018 (6.9%) |
| $35,000 to $49,999 | 6,193 (5.4%) | 17,107 (8.4%) |
| $50,000 to $74,999 | 10,709 (9.3%) | 26,209 (12.9%) |
| $75,000 to $99,999 | 12,131 (10.5%) | 21,720 (10.7%) |
| $100,000 to $149,999 | 22,171 (19.2%) | 28,451 (14.0%) |
| $150,000 or more | 53,069 (45.9%) | 39,474 (19.4%) |
| Total | 115,640 (100.0%) | 203,667 (100.0%) |
Monthly Housing Cost Tiers in Suffolk County
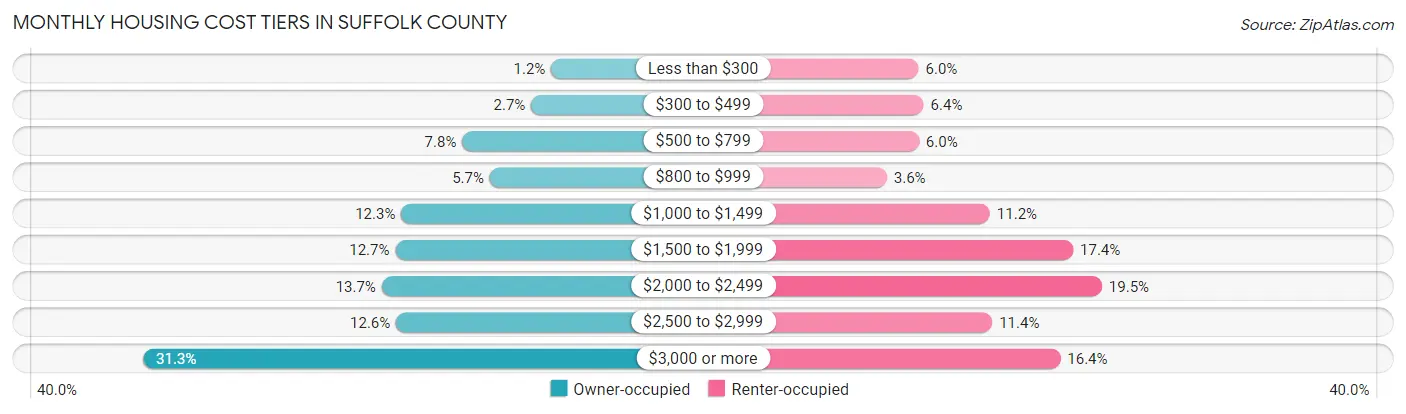
| Monthly Cost | Owner-occupied | Renter-occupied |
| Less than $300 | 1,412 (1.2%) | 12,176 (6.0%) |
| $300 to $499 | 3,107 (2.7%) | 12,941 (6.4%) |
| $500 to $799 | 8,985 (7.8%) | 12,226 (6.0%) |
| $800 to $999 | 6,642 (5.7%) | 7,417 (3.6%) |
| $1,000 to $1,499 | 14,182 (12.3%) | 22,881 (11.2%) |
| $1,500 to $1,999 | 14,684 (12.7%) | 35,354 (17.4%) |
| $2,000 to $2,499 | 15,848 (13.7%) | 39,672 (19.5%) |
| $2,500 to $2,999 | 14,621 (12.6%) | 23,228 (11.4%) |
| $3,000 or more | 36,159 (31.3%) | 33,440 (16.4%) |
| Total | 115,640 (100.0%) | 203,667 (100.0%) |
Physical Housing Characteristics in Suffolk County
Housing Structures in Suffolk County
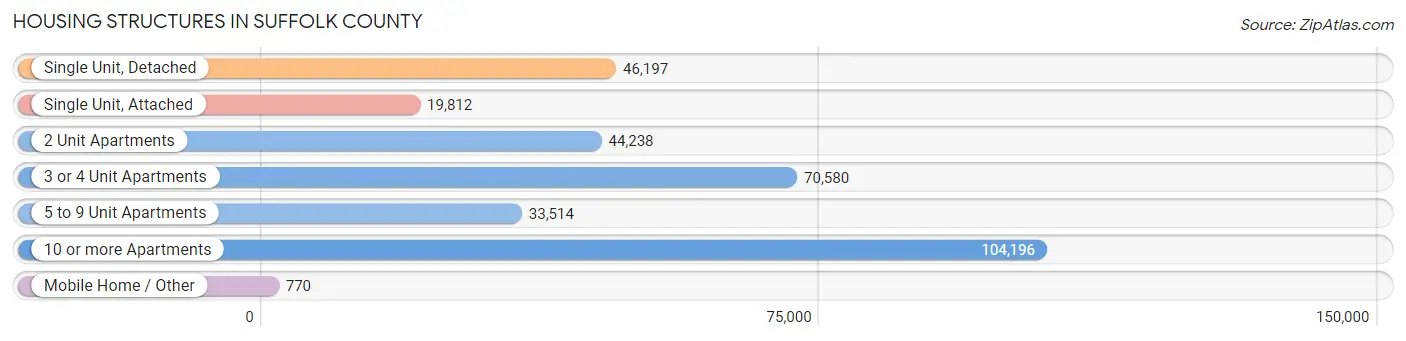
| Structure Type | # Housing Units | % Housing Units |
| Single Unit, Detached | 46,197 | 14.5% |
| Single Unit, Attached | 19,812 | 6.2% |
| 2 Unit Apartments | 44,238 | 13.9% |
| 3 or 4 Unit Apartments | 70,580 | 22.1% |
| 5 to 9 Unit Apartments | 33,514 | 10.5% |
| 10 or more Apartments | 104,196 | 32.6% |
| Mobile Home / Other | 770 | 0.2% |
| Total | 319,307 | 100.0% |
Housing Structures by Occupancy in Suffolk County
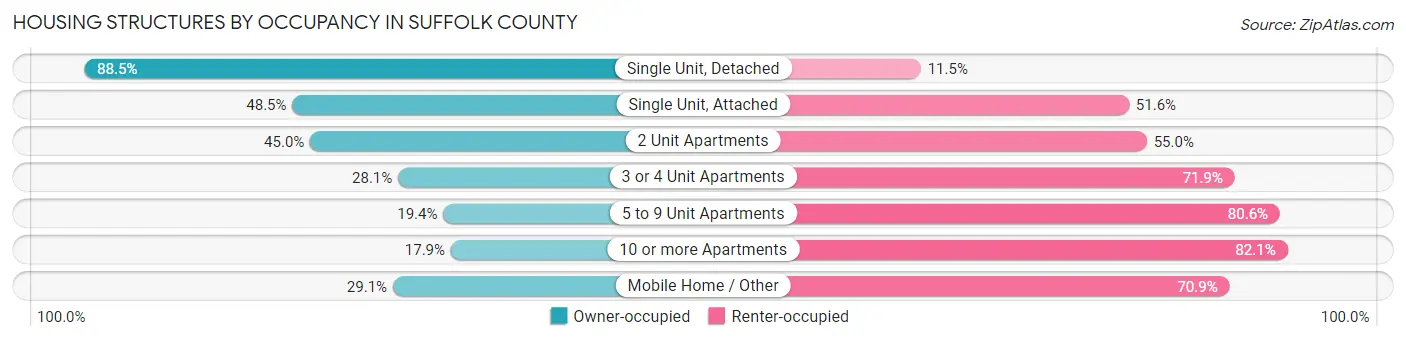
| Structure Type | Owner-occupied | Renter-occupied |
| Single Unit, Detached | 40,899 (88.5%) | 5,298 (11.5%) |
| Single Unit, Attached | 9,598 (48.4%) | 10,214 (51.5%) |
| 2 Unit Apartments | 19,918 (45.0%) | 24,320 (55.0%) |
| 3 or 4 Unit Apartments | 19,820 (28.1%) | 50,760 (71.9%) |
| 5 to 9 Unit Apartments | 6,496 (19.4%) | 27,018 (80.6%) |
| 10 or more Apartments | 18,685 (17.9%) | 85,511 (82.1%) |
| Mobile Home / Other | 224 (29.1%) | 546 (70.9%) |
| Total | 115,640 (36.2%) | 203,667 (63.8%) |
Housing Structures by Number of Rooms in Suffolk County
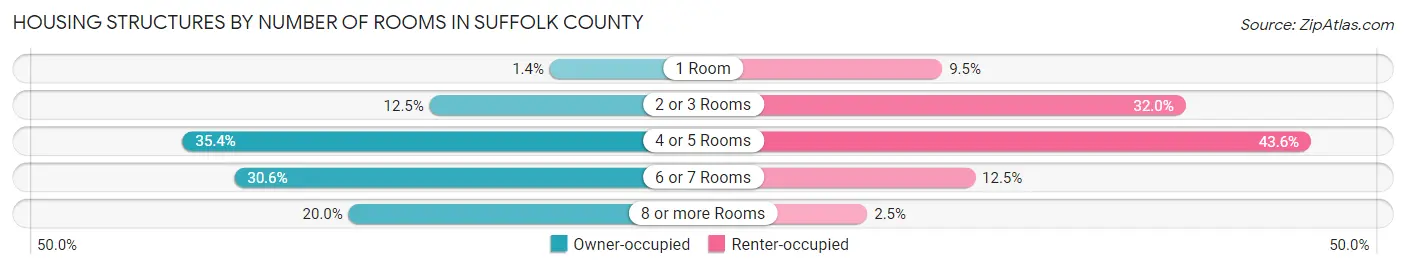
| Number of Rooms | Owner-occupied | Renter-occupied |
| 1 Room | 1,652 (1.4%) | 19,265 (9.5%) |
| 2 or 3 Rooms | 14,499 (12.5%) | 65,082 (32.0%) |
| 4 or 5 Rooms | 40,933 (35.4%) | 88,720 (43.6%) |
| 6 or 7 Rooms | 35,387 (30.6%) | 25,457 (12.5%) |
| 8 or more Rooms | 23,169 (20.0%) | 5,143 (2.5%) |
| Total | 115,640 (100.0%) | 203,667 (100.0%) |
Housing Structure by Heating Type in Suffolk County
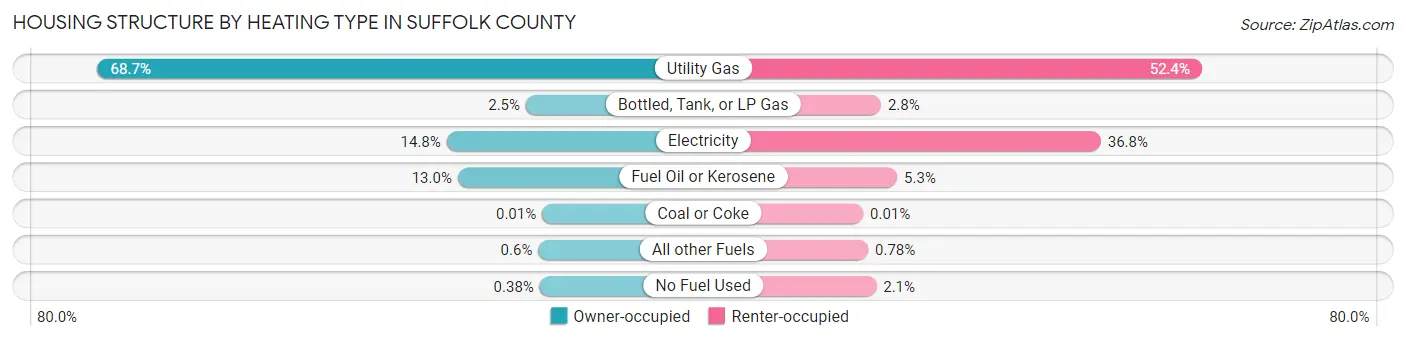
| Heating Type | Owner-occupied | Renter-occupied |
| Utility Gas | 79,447 (68.7%) | 106,645 (52.4%) |
| Bottled, Tank, or LP Gas | 2,908 (2.5%) | 5,649 (2.8%) |
| Electricity | 17,064 (14.8%) | 74,872 (36.8%) |
| Fuel Oil or Kerosene | 15,081 (13.0%) | 10,728 (5.3%) |
| Coal or Coke | 8 (0.0%) | 13 (0.0%) |
| All other Fuels | 698 (0.6%) | 1,582 (0.8%) |
| No Fuel Used | 434 (0.4%) | 4,178 (2.1%) |
| Total | 115,640 (100.0%) | 203,667 (100.0%) |
Household Vehicle Usage in Suffolk County
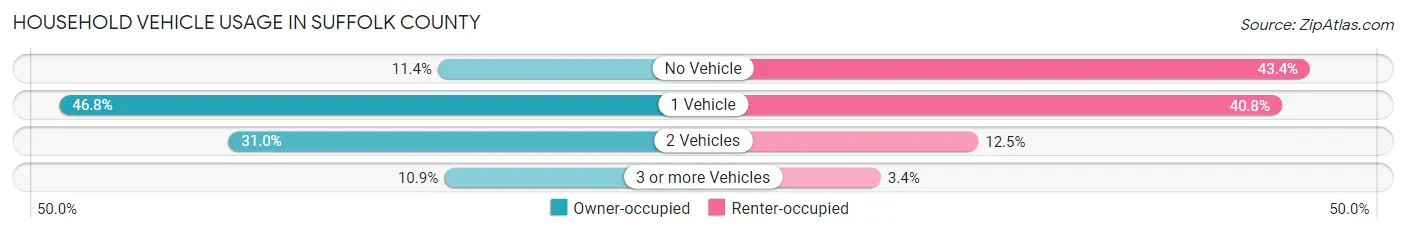
| Vehicles per Household | Owner-occupied | Renter-occupied |
| No Vehicle | 13,214 (11.4%) | 88,399 (43.4%) |
| 1 Vehicle | 54,059 (46.8%) | 83,063 (40.8%) |
| 2 Vehicles | 35,816 (31.0%) | 25,352 (12.4%) |
| 3 or more Vehicles | 12,551 (10.8%) | 6,853 (3.4%) |
| Total | 115,640 (100.0%) | 203,667 (100.0%) |
Real Estate & Mortgages in Suffolk County
Real Estate and Mortgage Overview in Suffolk County
| Characteristic | Without Mortgage | With Mortgage |
| Housing Units | 34,266 | 81,374 |
| Median Property Value | $641,200 | $654,700 |
| Median Household Income | $100,124 | $41,043 |
| Monthly Housing Costs | $970 | $34,432 |
| Real Estate Taxes | $4,576 | $1,695 |
Property Value by Mortgage Status in Suffolk County
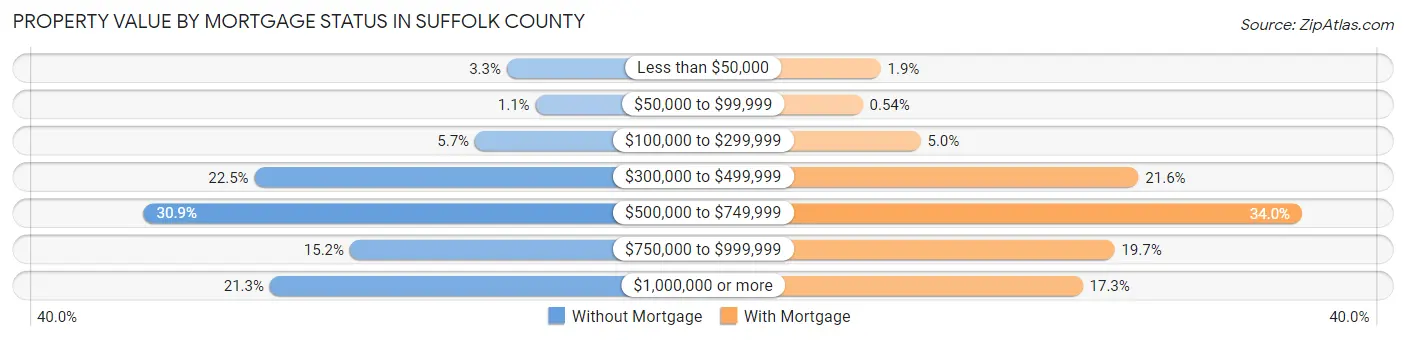
| Property Value | Without Mortgage | With Mortgage |
| Less than $50,000 | 1,118 (3.3%) | 1,558 (1.9%) |
| $50,000 to $99,999 | 370 (1.1%) | 438 (0.5%) |
| $100,000 to $299,999 | 1,951 (5.7%) | 4,028 (5.0%) |
| $300,000 to $499,999 | 7,707 (22.5%) | 17,540 (21.5%) |
| $500,000 to $749,999 | 10,599 (30.9%) | 27,676 (34.0%) |
| $750,000 to $999,999 | 5,215 (15.2%) | 16,057 (19.7%) |
| $1,000,000 or more | 7,306 (21.3%) | 14,077 (17.3%) |
| Total | 34,266 (100.0%) | 81,374 (100.0%) |
Household Income by Mortgage Status in Suffolk County
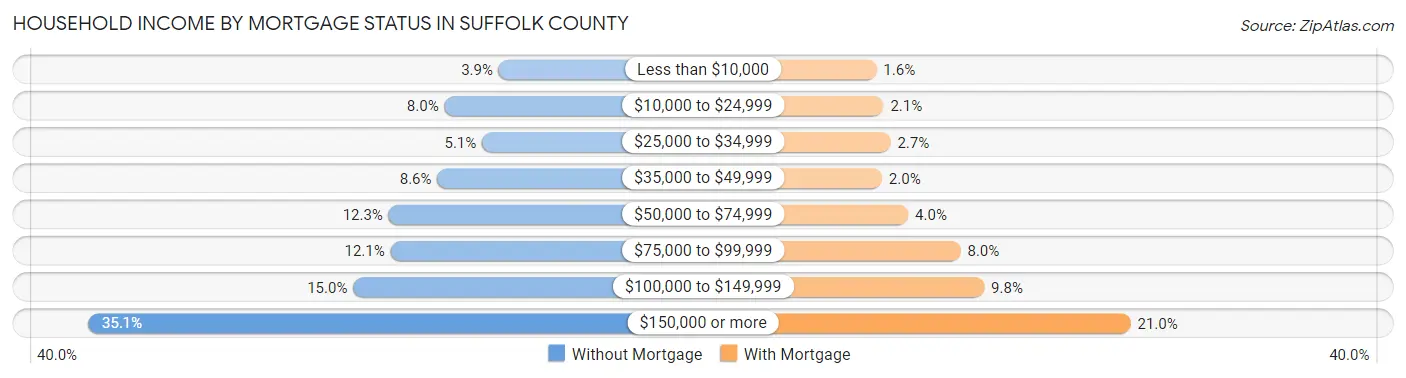
| Household Income | Without Mortgage | With Mortgage |
| Less than $10,000 | 1,326 (3.9%) | 1,291 (1.6%) |
| $10,000 to $24,999 | 2,743 (8.0%) | 1,736 (2.1%) |
| $25,000 to $34,999 | 1,761 (5.1%) | 2,163 (2.7%) |
| $35,000 to $49,999 | 2,929 (8.6%) | 1,638 (2.0%) |
| $50,000 to $74,999 | 4,202 (12.3%) | 3,264 (4.0%) |
| $75,000 to $99,999 | 4,153 (12.1%) | 6,507 (8.0%) |
| $100,000 to $149,999 | 5,126 (15.0%) | 7,978 (9.8%) |
| $150,000 or more | 12,026 (35.1%) | 17,045 (20.9%) |
| Total | 34,266 (100.0%) | 81,374 (100.0%) |
Property Value to Household Income Ratio in Suffolk County
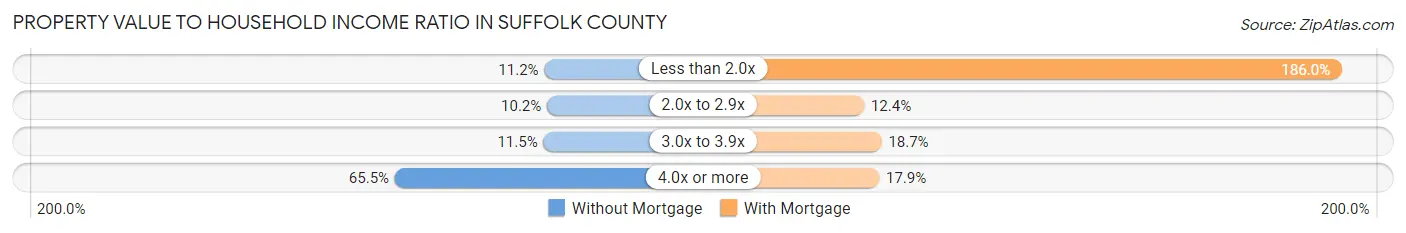
| Value-to-Income Ratio | Without Mortgage | With Mortgage |
| Less than 2.0x | 3,838 (11.2%) | 151,348 (186.0%) |
| 2.0x to 2.9x | 3,501 (10.2%) | 10,064 (12.4%) |
| 3.0x to 3.9x | 3,951 (11.5%) | 15,231 (18.7%) |
| 4.0x or more | 22,444 (65.5%) | 14,528 (17.8%) |
| Total | 34,266 (100.0%) | 81,374 (100.0%) |
Real Estate Taxes by Mortgage Status in Suffolk County
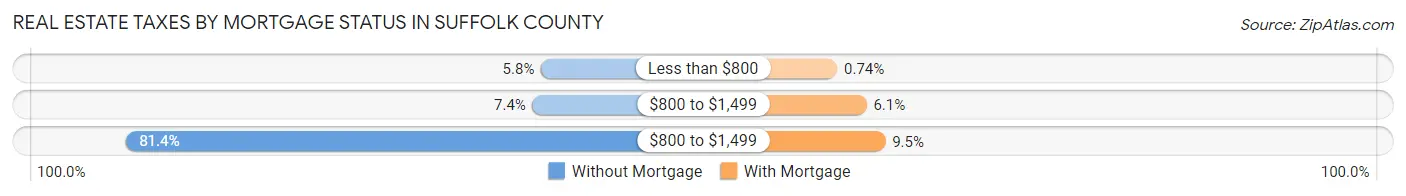
| Property Taxes | Without Mortgage | With Mortgage |
| Less than $800 | 1,995 (5.8%) | 605 (0.7%) |
| $800 to $1,499 | 2,529 (7.4%) | 4,970 (6.1%) |
| $800 to $1,499 | 27,904 (81.4%) | 7,751 (9.5%) |
| Total | 34,266 (100.0%) | 81,374 (100.0%) |
Health & Disability in Suffolk County
Health Insurance Coverage by Age in Suffolk County
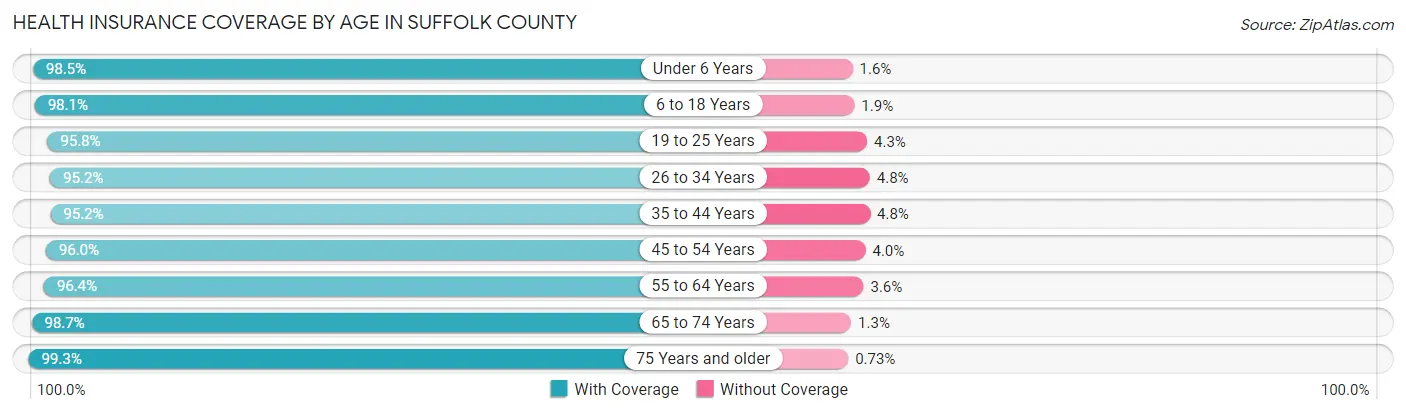
| Age Bracket | With Coverage | Without Coverage |
| Under 6 Years | 45,182 (98.5%) | 710 (1.5%) |
| 6 to 18 Years | 95,259 (98.1%) | 1,831 (1.9%) |
| 19 to 25 Years | 104,786 (95.8%) | 4,651 (4.3%) |
| 26 to 34 Years | 151,237 (95.2%) | 7,572 (4.8%) |
| 35 to 44 Years | 100,031 (95.2%) | 5,051 (4.8%) |
| 45 to 54 Years | 81,567 (96.0%) | 3,361 (4.0%) |
| 55 to 64 Years | 79,925 (96.4%) | 2,974 (3.6%) |
| 65 to 74 Years | 56,435 (98.7%) | 731 (1.3%) |
| 75 Years and older | 38,686 (99.3%) | 286 (0.7%) |
| Total | 753,108 (96.5%) | 27,167 (3.5%) |
Health Insurance Coverage by Citizenship Status in Suffolk County
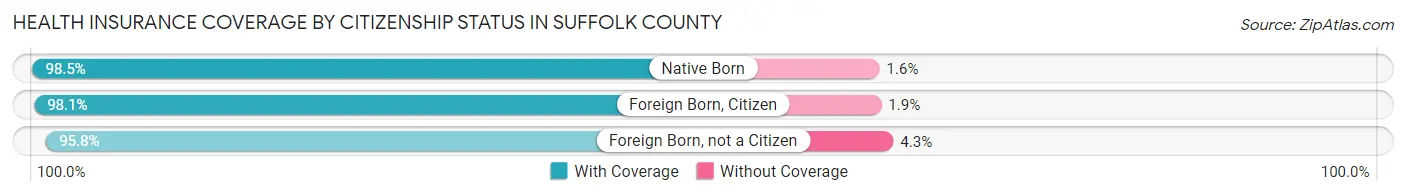
| Citizenship Status | With Coverage | Without Coverage |
| Native Born | 45,182 (98.5%) | 710 (1.5%) |
| Foreign Born, Citizen | 95,259 (98.1%) | 1,831 (1.9%) |
| Foreign Born, not a Citizen | 104,786 (95.8%) | 4,651 (4.3%) |
Health Insurance Coverage by Household Income in Suffolk County
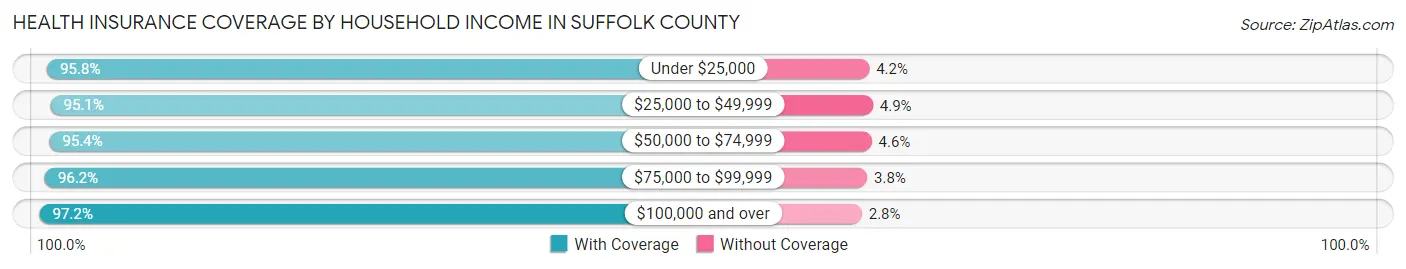
| Household Income | With Coverage | Without Coverage |
| Under $25,000 | 102,078 (95.8%) | 4,478 (4.2%) |
| $25,000 to $49,999 | 84,246 (95.1%) | 4,319 (4.9%) |
| $50,000 to $74,999 | 77,687 (95.4%) | 3,781 (4.6%) |
| $75,000 to $99,999 | 73,941 (96.2%) | 2,924 (3.8%) |
| $100,000 and over | 376,241 (97.2%) | 10,877 (2.8%) |
Public vs Private Health Insurance Coverage by Age in Suffolk County
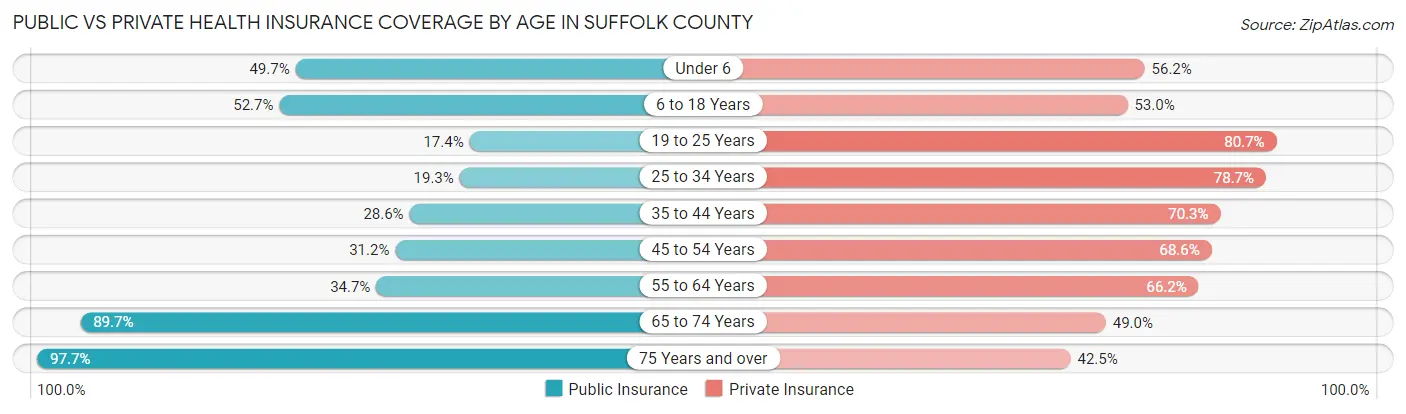
| Age Bracket | Public Insurance | Private Insurance |
| Under 6 | 22,818 (49.7%) | 25,794 (56.2%) |
| 6 to 18 Years | 51,183 (52.7%) | 51,486 (53.0%) |
| 19 to 25 Years | 19,069 (17.4%) | 88,268 (80.7%) |
| 25 to 34 Years | 30,591 (19.3%) | 125,000 (78.7%) |
| 35 to 44 Years | 30,022 (28.6%) | 73,834 (70.3%) |
| 45 to 54 Years | 26,508 (31.2%) | 58,288 (68.6%) |
| 55 to 64 Years | 28,803 (34.7%) | 54,896 (66.2%) |
| 65 to 74 Years | 51,263 (89.7%) | 28,017 (49.0%) |
| 75 Years and over | 38,061 (97.7%) | 16,546 (42.5%) |
| Total | 298,318 (38.2%) | 522,129 (66.9%) |
Disability Status by Sex by Age in Suffolk County
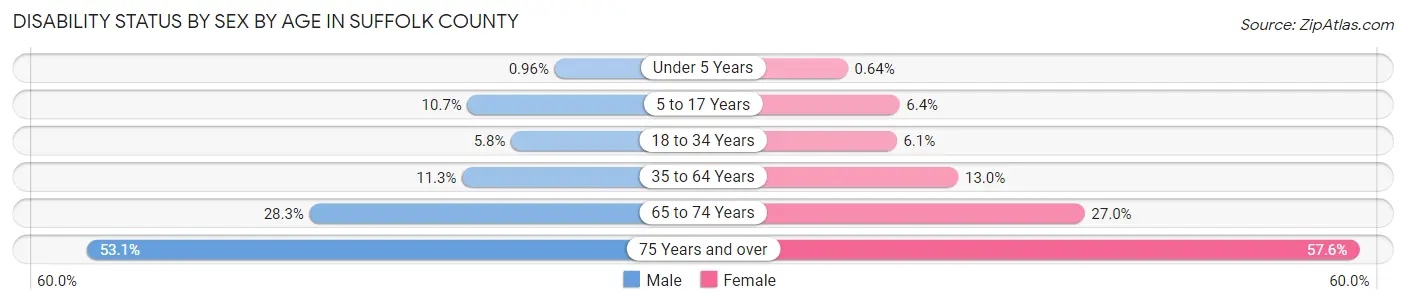
| Age Bracket | Male | Female |
| Under 5 Years | 191 (1.0%) | 123 (0.6%) |
| 5 to 17 Years | 4,825 (10.7%) | 2,826 (6.4%) |
| 18 to 34 Years | 7,951 (5.8%) | 8,875 (6.1%) |
| 35 to 64 Years | 15,153 (11.3%) | 17,894 (13.0%) |
| 65 to 74 Years | 7,283 (28.2%) | 8,480 (27.0%) |
| 75 Years and over | 8,017 (53.1%) | 13,751 (57.6%) |
Disability Class by Sex by Age in Suffolk County
Disability Class: Hearing Difficulty
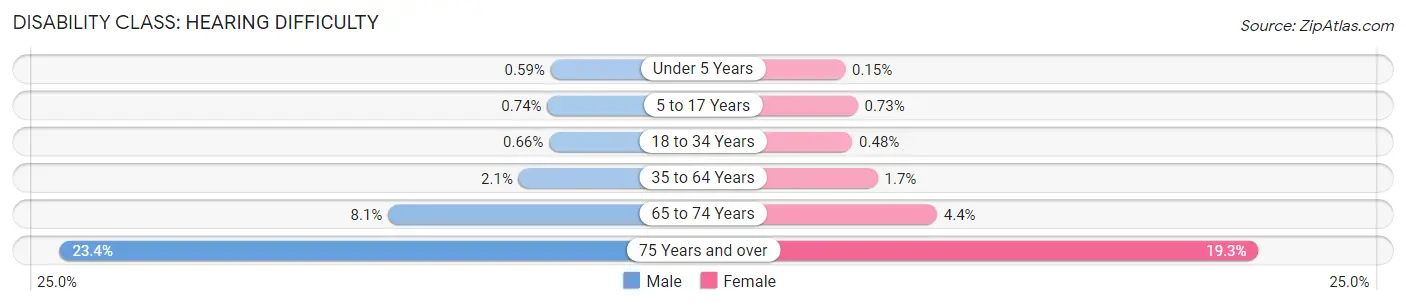
| Age Bracket | Male | Female |
| Under 5 Years | 118 (0.6%) | 29 (0.2%) |
| 5 to 17 Years | 336 (0.7%) | 321 (0.7%) |
| 18 to 34 Years | 909 (0.7%) | 697 (0.5%) |
| 35 to 64 Years | 2,785 (2.1%) | 2,290 (1.7%) |
| 65 to 74 Years | 2,096 (8.1%) | 1,383 (4.4%) |
| 75 Years and over | 3,531 (23.4%) | 4,614 (19.3%) |
Disability Class: Vision Difficulty
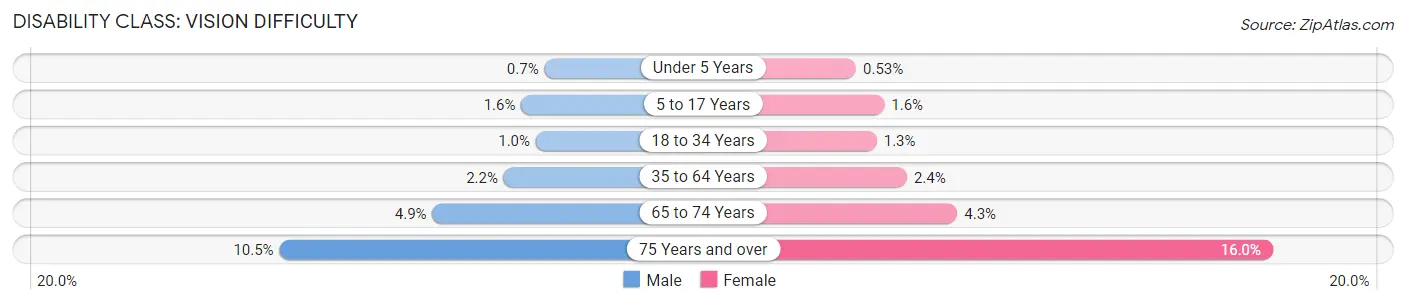
| Age Bracket | Male | Female |
| Under 5 Years | 138 (0.7%) | 102 (0.5%) |
| 5 to 17 Years | 706 (1.6%) | 699 (1.6%) |
| 18 to 34 Years | 1,403 (1.0%) | 1,897 (1.3%) |
| 35 to 64 Years | 2,982 (2.2%) | 3,342 (2.4%) |
| 65 to 74 Years | 1,254 (4.9%) | 1,346 (4.3%) |
| 75 Years and over | 1,592 (10.5%) | 3,819 (16.0%) |
Disability Class: Cognitive Difficulty
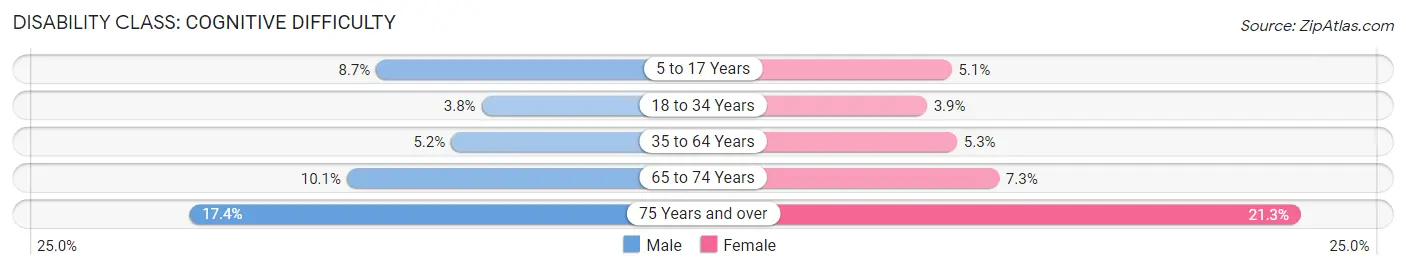
| Age Bracket | Male | Female |
| 5 to 17 Years | 3,934 (8.7%) | 2,243 (5.1%) |
| 18 to 34 Years | 5,201 (3.8%) | 5,739 (3.9%) |
| 35 to 64 Years | 7,024 (5.2%) | 7,375 (5.3%) |
| 65 to 74 Years | 2,590 (10.1%) | 2,289 (7.3%) |
| 75 Years and over | 2,622 (17.4%) | 5,083 (21.3%) |
Disability Class: Ambulatory Difficulty
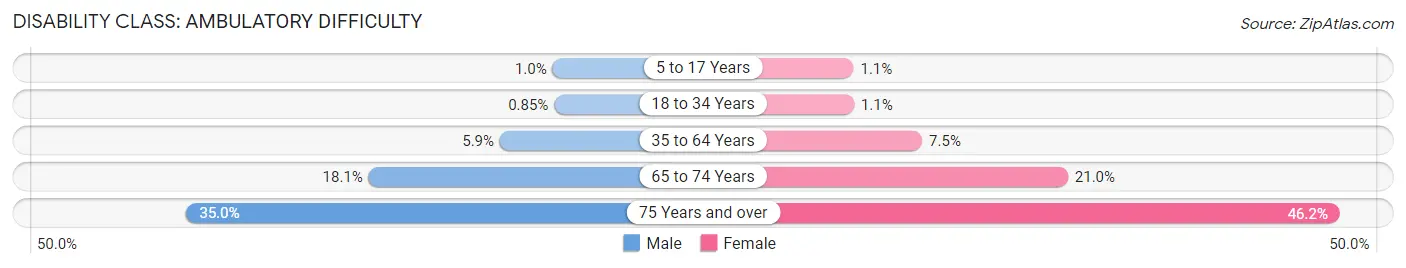
| Age Bracket | Male | Female |
| 5 to 17 Years | 451 (1.0%) | 482 (1.1%) |
| 18 to 34 Years | 1,161 (0.9%) | 1,647 (1.1%) |
| 35 to 64 Years | 7,934 (5.9%) | 10,314 (7.5%) |
| 65 to 74 Years | 4,660 (18.1%) | 6,584 (21.0%) |
| 75 Years and over | 5,285 (35.0%) | 11,030 (46.2%) |
Disability Class: Self-Care Difficulty
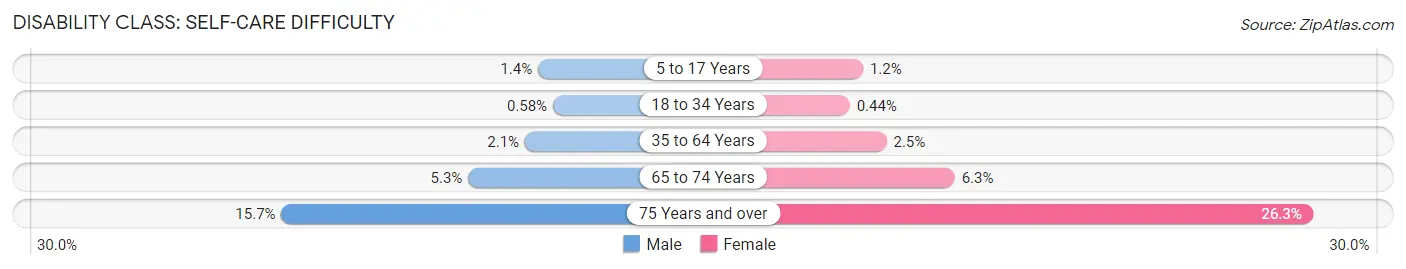
| Age Bracket | Male | Female |
| 5 to 17 Years | 636 (1.4%) | 519 (1.2%) |
| 18 to 34 Years | 798 (0.6%) | 638 (0.4%) |
| 35 to 64 Years | 2,876 (2.1%) | 3,438 (2.5%) |
| 65 to 74 Years | 1,367 (5.3%) | 1,973 (6.3%) |
| 75 Years and over | 2,372 (15.7%) | 6,270 (26.3%) |
Technology Access in Suffolk County
Computing Device Access in Suffolk County
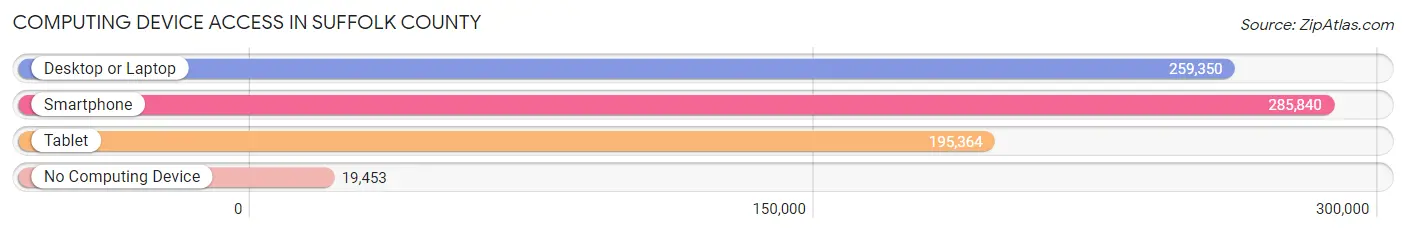
| Device Type | # Households | % Households |
| Desktop or Laptop | 259,350 | 81.2% |
| Smartphone | 285,840 | 89.5% |
| Tablet | 195,364 | 61.2% |
| No Computing Device | 19,453 | 6.1% |
| Total | 319,307 | 100.0% |
Internet Access in Suffolk County
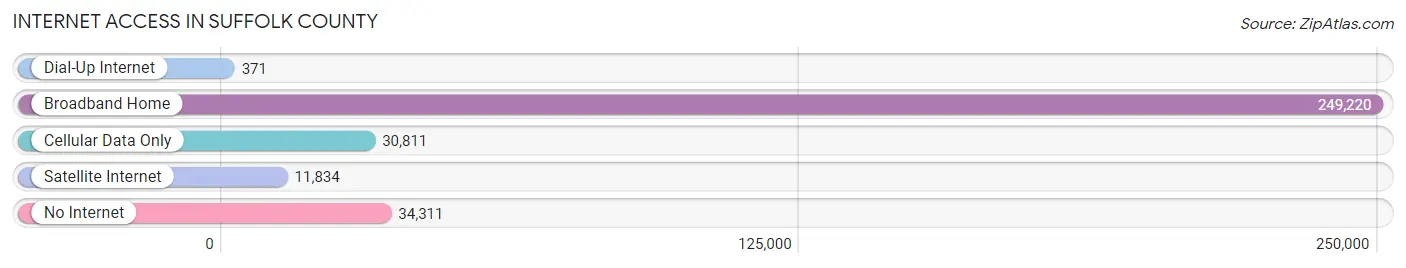
| Internet Type | # Households | % Households |
| Dial-Up Internet | 371 | 0.1% |
| Broadband Home | 249,220 | 78.0% |
| Cellular Data Only | 30,811 | 9.7% |
| Satellite Internet | 11,834 | 3.7% |
| No Internet | 34,311 | 10.7% |
| Total | 319,307 | 100.0% |
Suffolk County Summary
Suffolk County is a county located in the Commonwealth of Massachusetts, in the United States. It is the second-most populous county in Massachusetts, with a population of 807,252 as of the 2010 census. The county seat is Boston, the state capital and largest city. Suffolk County is included in the Boston-Cambridge-Newton, MA-NH Metropolitan Statistical Area.
Geography
Suffolk County is located in eastern Massachusetts, bordered by Norfolk County to the west, Middlesex County to the north, and Essex County to the northeast. The county is also bordered by the Atlantic Ocean to the east, and the cities of Boston, Chelsea, Revere, and Winthrop to the south. The county has a total area of 120 square miles, of which 79 square miles is land and 41 square miles is water.
The county is divided into two distinct regions: the North Shore and the South Shore. The North Shore is characterized by rocky coastline, picturesque harbors, and quaint towns, while the South Shore is known for its sandy beaches and larger cities. The county is also home to several islands, including the Boston Harbor Islands National Recreation Area, which consists of 34 islands and peninsulas.
Climate
Suffolk County has a humid continental climate, with warm summers and cold winters. The average annual temperature is 48°F, with an average high of 68°F in July and an average low of 28°F in January. The average annual precipitation is 43.5 inches, with an average of 4.5 inches of snowfall per year.
Demographics
As of the 2010 census, there were 807,252 people, 313,895 households, and 189,867 families residing in the county. The population density was 10,277 people per square mile. The racial makeup of the county was 73.2% White, 14.8% African American, 0.4% Native American, 6.0% Asian, 0.1% Pacific Islander, 3.2% from other races, and 2.3% from two or more races. Hispanic or Latino of any race were 8.9% of the population.
The median income for a household in the county was $54,523, and the median income for a family was $66,741. The per capita income for the county was $30,890. About 10.7% of families and 14.2% of the population were below the poverty line, including 19.1% of those under age 18 and 9.4% of those age 65 or over.
Economy
Suffolk County is home to a diverse economy, with a mix of industries including finance, healthcare, education, technology, and tourism. The county is home to several major employers, including Harvard University, Massachusetts General Hospital, and the Massachusetts Institute of Technology.
The county is also home to a thriving tourism industry, with attractions such as the Freedom Trail, Fenway Park, and the USS Constitution Museum. The county is also home to several major shopping centers, including the South Shore Plaza and the Burlington Mall.
History
Suffolk County was established in 1643, when it was separated from the Massachusetts Bay Colony. The county was named after Suffolk, England, and was originally part of the Massachusetts Bay Colony.
In the late 18th century, the county was home to a thriving whaling industry, with ships sailing from ports such as Nantucket and New Bedford. The county was also home to several major battles during the American Revolution, including the Battle of Bunker Hill and the Battle of Dorchester Heights.
In the 19th century, the county was home to a thriving textile industry, with factories located in cities such as Lowell and Lawrence. The county was also home to several major shipbuilding companies, including the Fore River Shipyard in Quincy.
In the 20th century, the county was home to a thriving technology industry, with companies such as Digital Equipment Corporation and Wang Laboratories located in the county. The county was also home to a thriving financial industry, with companies such as Fidelity Investments and State Street Corporation located in the county.
Today, Suffolk County is home to a thriving economy, with a mix of industries including finance, healthcare, education, technology, and tourism. The county is also home to several major employers, including Harvard University, Massachusetts General Hospital, and the Massachusetts Institute of Technology.
Common Questions
What is the Total Population of Suffolk County?
Total Population of Suffolk County is 785,443.
What is the Total Male Population of Suffolk County?
Total Male Population of Suffolk County is 380,529.
What is the Total Female Population of Suffolk County?
Total Female Population of Suffolk County is 404,914.
What is the Ratio of Males per 100 Females in Suffolk County?
There are 93.98 Males per 100 Females in Suffolk County.
What is the Ratio of Females per 100 Males in Suffolk County?
There are 106.41 Females per 100 Males in Suffolk County.
What is the Median Population Age in Suffolk County?
Median Population Age in Suffolk County is 33.6 Years.
What is the Average Family Size in Suffolk County
Average Family Size in Suffolk County is 3.1 People.
What is the Average Household Size in Suffolk County
Average Household Size in Suffolk County is 2.3 People.
What is Per Capita Income in Suffolk County?
Per Capita income in Suffolk County is $53,173.
What is the Median Family Income in Suffolk County?
Median Family Income in Suffolk County is $102,723.
What is the Median Household income in Suffolk County?
Median Household Income in Suffolk County is $87,669.
What is Income or Wage Gap in Suffolk County?
Income or Wage Gap in Suffolk County is 16.8%.
Women in Suffolk County earn 83.2 cents for every dollar earned by a man.
What is Family Income Deficit in Suffolk County?
Family Income Deficit in Suffolk County is $10,840.
Families that are below poverty line in Suffolk County earn $10,840 less on average than the poverty threshold level.
What is Inequality or Gini Index in Suffolk County?
Inequality or Gini Index in Suffolk County is 0.53.
How Large is the Labor Force in Suffolk County?
There are 467,030 People in the Labor Forcein in Suffolk County.
What is the Percentage of People in the Labor Force in Suffolk County?
69.7% of People are in the Labor Force in Suffolk County.
What is the Unemployment Rate in Suffolk County?
Unemployment Rate in Suffolk County is 6.7%.