Plymouth County, MA
Plymouth County Overview
529,548
TOTAL POPULATION
259,441
MALE POPULATION
270,107
FEMALE POPULATION
96.05
MALES / 100 FEMALES
104.11
FEMALES / 100 MALES
42.7
MEDIAN AGE
3.1
AVG FAMILY SIZE
2.6
AVG HOUSEHOLD SIZE
$53,423
PER CAPITA INCOME
$128,726
AVG FAMILY INCOME
$105,387
AVG HOUSEHOLD INCOME
31.8%
WAGE / INCOME GAP [ % ]
68.2¢/ $1
WAGE / INCOME GAP [ $ ]
$10,913
FAMILY INCOME DEFICIT
0.46
INEQUALITY / GINI INDEX
290,106
LABOR FORCE [ PEOPLE ]
67.0%
PERCENT IN LABOR FORCE
5.2%
UNEMPLOYMENT RATE
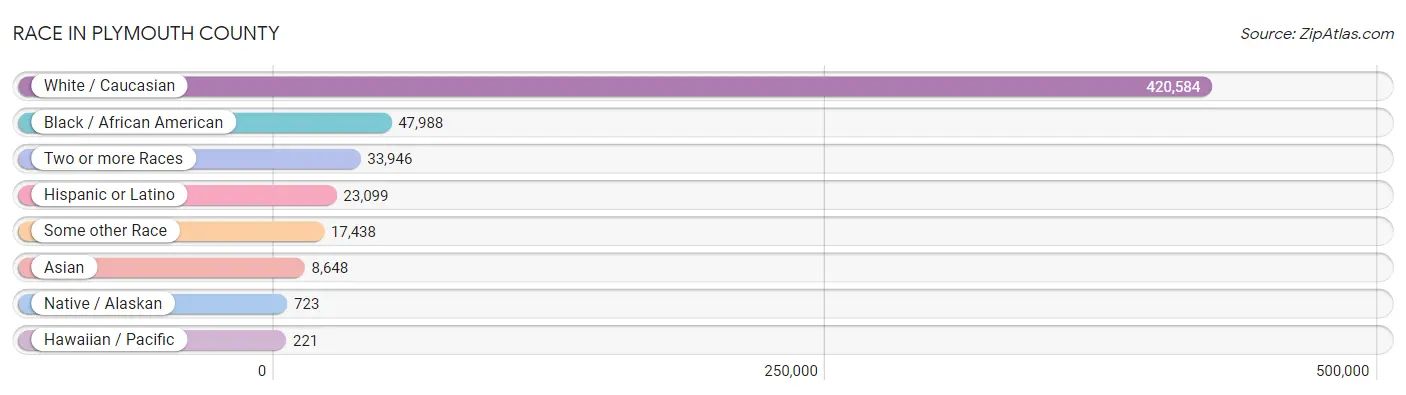
Race in Plymouth County
The most populous races in Plymouth County are White / Caucasian (420,584 | 79.4%), Black / African American (47,988 | 9.1%), and Two or more Races (33,946 | 6.4%).
| Race | # Population | % Population |
| Asian | 8,648 | 1.6% |
| Black / African American | 47,988 | 9.1% |
| Hawaiian / Pacific | 221 | 0.0% |
| Hispanic or Latino | 23,099 | 4.4% |
| Native / Alaskan | 723 | 0.1% |
| White / Caucasian | 420,584 | 79.4% |
| Two or more Races | 33,946 | 6.4% |
| Some other Race | 17,438 | 3.3% |
| Total | 529,548 | 100.0% |
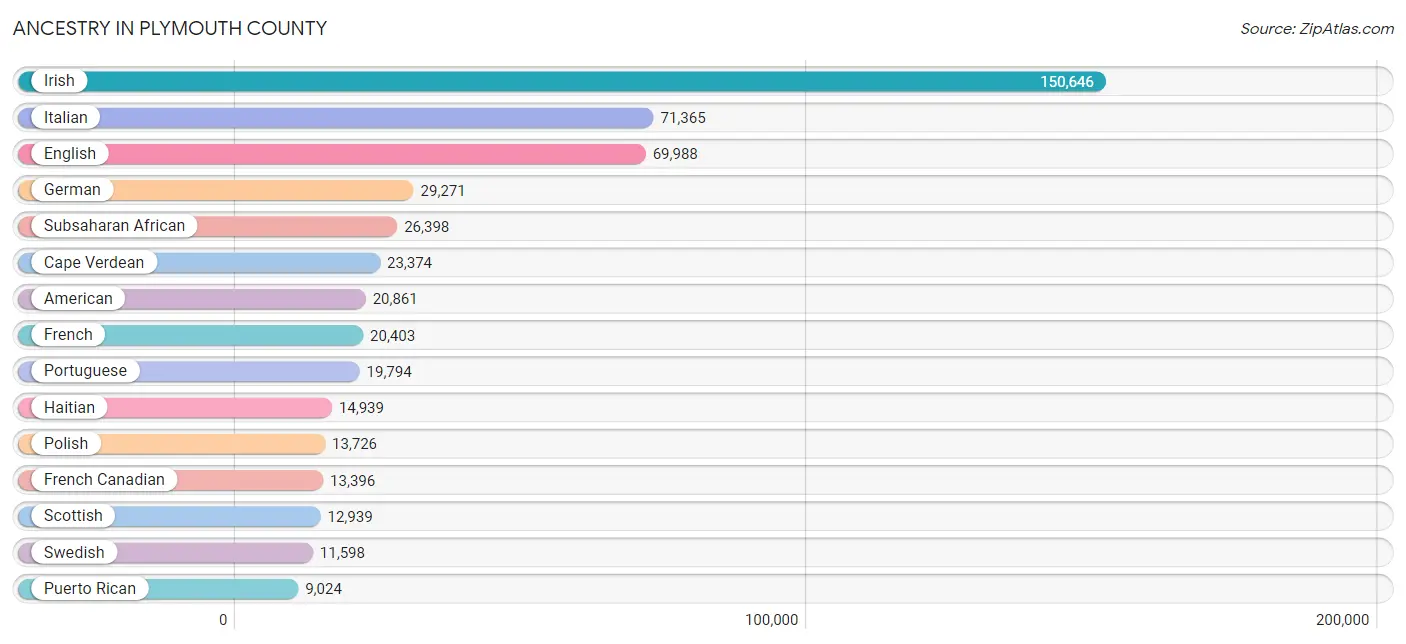
Ancestry in Plymouth County
The most populous ancestries reported in Plymouth County are Irish (150,646 | 28.4%), Italian (71,365 | 13.5%), English (69,988 | 13.2%), German (29,271 | 5.5%), and Subsaharan African (26,398 | 5.0%), together accounting for 65.7% of all Plymouth County residents.
| Ancestry | # Population | % Population |
| African | 1,535 | 0.3% |
| Albanian | 709 | 0.1% |
| American | 20,861 | 3.9% |
| Apache | 52 | 0.0% |
| Arab | 4,046 | 0.8% |
| Argentinean | 143 | 0.0% |
| Armenian | 1,397 | 0.3% |
| Assyrian / Chaldean / Syriac | 14 | 0.0% |
| Australian | 58 | 0.0% |
| Austrian | 687 | 0.1% |
| Bangladeshi | 336 | 0.1% |
| Barbadian | 438 | 0.1% |
| Basque | 7 | 0.0% |
| Belgian | 360 | 0.1% |
| Bhutanese | 561 | 0.1% |
| Blackfeet | 192 | 0.0% |
| Bolivian | 38 | 0.0% |
| Brazilian | 4,333 | 0.8% |
| British | 1,855 | 0.4% |
| British West Indian | 296 | 0.1% |
| Bulgarian | 257 | 0.1% |
| Burmese | 1,067 | 0.2% |
| Cajun | 141 | 0.0% |
| Cambodian | 9 | 0.0% |
| Canadian | 3,264 | 0.6% |
| Cape Verdean | 23,374 | 4.4% |
| Carpatho Rusyn | 46 | 0.0% |
| Celtic | 87 | 0.0% |
| Central American | 3,564 | 0.7% |
| Central American Indian | 201 | 0.0% |
| Cherokee | 500 | 0.1% |
| Chilean | 128 | 0.0% |
| Chippewa | 80 | 0.0% |
| Colombian | 777 | 0.2% |
| Costa Rican | 104 | 0.0% |
| Cree | 22 | 0.0% |
| Creek | 55 | 0.0% |
| Croatian | 172 | 0.0% |
| Cuban | 901 | 0.2% |
| Czech | 413 | 0.1% |
| Czechoslovakian | 335 | 0.1% |
| Danish | 909 | 0.2% |
| Delaware | 9 | 0.0% |
| Dominican | 2,139 | 0.4% |
| Dutch | 2,674 | 0.5% |
| Eastern European | 1,788 | 0.3% |
| Ecuadorian | 1,630 | 0.3% |
| Egyptian | 124 | 0.0% |
| English | 69,988 | 13.2% |
| Estonian | 27 | 0.0% |
| Ethiopian | 35 | 0.0% |
| European | 5,011 | 0.9% |
| Fijian | 16 | 0.0% |
| Filipino | 96 | 0.0% |
| Finnish | 2,052 | 0.4% |
| French | 20,403 | 3.8% |
| French American Indian | 187 | 0.0% |
| French Canadian | 13,396 | 2.5% |
| German | 29,271 | 5.5% |
| Ghanaian | 128 | 0.0% |
| Greek | 5,154 | 1.0% |
| Guamanian / Chamorro | 158 | 0.0% |
| Guatemalan | 955 | 0.2% |
| Guyanese | 146 | 0.0% |
| Haitian | 14,939 | 2.8% |
| Honduran | 1,008 | 0.2% |
| Hungarian | 1,272 | 0.2% |
| Icelander | 200 | 0.0% |
| Indian (Asian) | 3,453 | 0.6% |
| Indonesian | 15 | 0.0% |
| Iranian | 85 | 0.0% |
| Irish | 150,646 | 28.4% |
| Iroquois | 83 | 0.0% |
| Israeli | 45 | 0.0% |
| Italian | 71,365 | 13.5% |
| Jamaican | 1,377 | 0.3% |
| Japanese | 316 | 0.1% |
| Kenyan | 559 | 0.1% |
| Korean | 1,273 | 0.2% |
| Laotian | 100 | 0.0% |
| Latvian | 348 | 0.1% |
| Lebanese | 2,970 | 0.6% |
| Liberian | 70 | 0.0% |
| Lithuanian | 3,714 | 0.7% |
| Maltese | 23 | 0.0% |
| Mexican | 1,882 | 0.4% |
| Mexican American Indian | 23 | 0.0% |
| Mongolian | 17 | 0.0% |
| Moroccan | 227 | 0.0% |
| Native Hawaiian | 176 | 0.0% |
| Navajo | 109 | 0.0% |
| New Zealander | 50 | 0.0% |
| Nigerian | 488 | 0.1% |
| Northern European | 667 | 0.1% |
| Norwegian | 2,871 | 0.5% |
| Pakistani | 93 | 0.0% |
| Palestinian | 77 | 0.0% |
| Panamanian | 186 | 0.0% |
| Paraguayan | 34 | 0.0% |
| Pennsylvania German | 79 | 0.0% |
| Peruvian | 285 | 0.1% |
| Polish | 13,726 | 2.6% |
| Portuguese | 19,794 | 3.7% |
| Potawatomi | 127 | 0.0% |
| Puerto Rican | 9,024 | 1.7% |
| Romanian | 415 | 0.1% |
| Russian | 2,894 | 0.5% |
| Salvadoran | 1,238 | 0.2% |
| Samoan | 133 | 0.0% |
| Scandinavian | 852 | 0.2% |
| Scotch-Irish | 4,650 | 0.9% |
| Scottish | 12,939 | 2.4% |
| Seminole | 10 | 0.0% |
| Senegalese | 16 | 0.0% |
| Serbian | 162 | 0.0% |
| Shoshone | 4 | 0.0% |
| Sierra Leonean | 49 | 0.0% |
| Sioux | 25 | 0.0% |
| Slavic | 205 | 0.0% |
| Slovak | 357 | 0.1% |
| Slovene | 68 | 0.0% |
| Somali | 10 | 0.0% |
| South African | 126 | 0.0% |
| South American | 3,243 | 0.6% |
| South American Indian | 7 | 0.0% |
| Spaniard | 594 | 0.1% |
| Spanish | 510 | 0.1% |
| Sri Lankan | 1,974 | 0.4% |
| Subsaharan African | 26,398 | 5.0% |
| Sudanese | 4 | 0.0% |
| Swedish | 11,598 | 2.2% |
| Swiss | 540 | 0.1% |
| Syrian | 326 | 0.1% |
| Thai | 2,680 | 0.5% |
| Trinidadian and Tobagonian | 515 | 0.1% |
| Turkish | 251 | 0.1% |
| U.S. Virgin Islander | 100 | 0.0% |
| Ugandan | 51 | 0.0% |
| Ukrainian | 866 | 0.2% |
| Venezuelan | 163 | 0.0% |
| Vietnamese | 148 | 0.0% |
| Welsh | 1,619 | 0.3% |
| West Indian | 270 | 0.1% |
| Yugoslavian | 69 | 0.0% | View All 144 Rows |
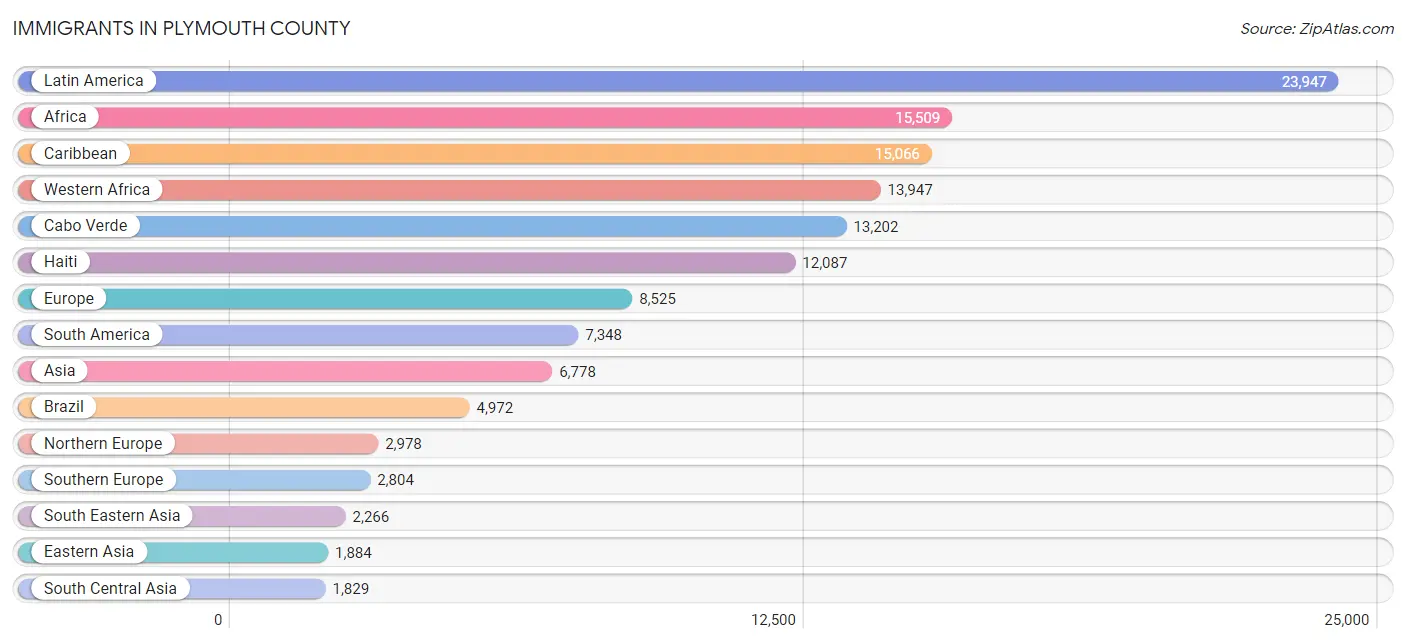
Immigrants in Plymouth County
The most numerous immigrant groups reported in Plymouth County came from Latin America (23,947 | 4.5%), Africa (15,509 | 2.9%), Caribbean (15,066 | 2.9%), Western Africa (13,947 | 2.6%), and Cabo Verde (13,202 | 2.5%), together accounting for 15.4% of all Plymouth County residents.
| Immigration Origin | # Population | % Population |
| Africa | 15,509 | 2.9% |
| Albania | 346 | 0.1% |
| Argentina | 7 | 0.0% |
| Armenia | 33 | 0.0% |
| Asia | 6,778 | 1.3% |
| Australia | 87 | 0.0% |
| Austria | 57 | 0.0% |
| Azores | 189 | 0.0% |
| Bangladesh | 54 | 0.0% |
| Barbados | 194 | 0.0% |
| Belarus | 11 | 0.0% |
| Bolivia | 22 | 0.0% |
| Bosnia and Herzegovina | 18 | 0.0% |
| Brazil | 4,972 | 0.9% |
| Bulgaria | 97 | 0.0% |
| Cabo Verde | 13,202 | 2.5% |
| Cambodia | 216 | 0.0% |
| Cameroon | 198 | 0.0% |
| Canada | 1,371 | 0.3% |
| Caribbean | 15,066 | 2.9% |
| Central America | 1,533 | 0.3% |
| Chile | 111 | 0.0% |
| China | 1,381 | 0.3% |
| Colombia | 605 | 0.1% |
| Costa Rica | 65 | 0.0% |
| Cuba | 189 | 0.0% |
| Czechoslovakia | 31 | 0.0% |
| Dominica | 63 | 0.0% |
| Dominican Republic | 874 | 0.2% |
| Eastern Africa | 654 | 0.1% |
| Eastern Asia | 1,884 | 0.4% |
| Eastern Europe | 1,459 | 0.3% |
| Ecuador | 1,180 | 0.2% |
| Egypt | 83 | 0.0% |
| El Salvador | 289 | 0.1% |
| England | 997 | 0.2% |
| Ethiopia | 36 | 0.0% |
| Europe | 8,525 | 1.6% |
| France | 365 | 0.1% |
| Germany | 750 | 0.1% |
| Ghana | 61 | 0.0% |
| Greece | 330 | 0.1% |
| Guatemala | 416 | 0.1% |
| Guyana | 25 | 0.0% |
| Haiti | 12,087 | 2.3% |
| Honduras | 574 | 0.1% |
| Hong Kong | 444 | 0.1% |
| Hungary | 40 | 0.0% |
| India | 1,445 | 0.3% |
| Indonesia | 50 | 0.0% |
| Iran | 43 | 0.0% |
| Iraq | 14 | 0.0% |
| Ireland | 1,141 | 0.2% |
| Israel | 37 | 0.0% |
| Italy | 566 | 0.1% |
| Jamaica | 985 | 0.2% |
| Japan | 58 | 0.0% |
| Kenya | 481 | 0.1% |
| Korea | 435 | 0.1% |
| Laos | 33 | 0.0% |
| Latin America | 23,947 | 4.5% |
| Latvia | 58 | 0.0% |
| Lebanon | 493 | 0.1% |
| Liberia | 38 | 0.0% |
| Lithuania | 52 | 0.0% |
| Malaysia | 36 | 0.0% |
| Mexico | 138 | 0.0% |
| Middle Africa | 439 | 0.1% |
| Moldova | 88 | 0.0% |
| Morocco | 183 | 0.0% |
| Nepal | 177 | 0.0% |
| Netherlands | 90 | 0.0% |
| Nicaragua | 41 | 0.0% |
| Nigeria | 494 | 0.1% |
| Northern Africa | 304 | 0.1% |
| Northern Europe | 2,978 | 0.6% |
| Norway | 7 | 0.0% |
| Oceania | 87 | 0.0% |
| Pakistan | 97 | 0.0% |
| Panama | 10 | 0.0% |
| Peru | 189 | 0.0% |
| Philippines | 506 | 0.1% |
| Poland | 274 | 0.1% |
| Portugal | 1,701 | 0.3% |
| Romania | 131 | 0.0% |
| Russia | 244 | 0.1% |
| Saudi Arabia | 33 | 0.0% |
| Scotland | 269 | 0.1% |
| Senegal | 57 | 0.0% |
| Sierra Leone | 38 | 0.0% |
| Singapore | 15 | 0.0% |
| South Africa | 130 | 0.0% |
| South America | 7,348 | 1.4% |
| South Central Asia | 1,829 | 0.4% |
| South Eastern Asia | 2,266 | 0.4% |
| Southern Europe | 2,804 | 0.5% |
| Spain | 207 | 0.0% |
| St. Vincent and the Grenadines | 69 | 0.0% |
| Sweden | 89 | 0.0% |
| Switzerland | 22 | 0.0% |
| Syria | 10 | 0.0% |
| Taiwan | 149 | 0.0% |
| Thailand | 176 | 0.0% |
| Trinidad and Tobago | 330 | 0.1% |
| Turkey | 92 | 0.0% |
| Uganda | 53 | 0.0% |
| Ukraine | 61 | 0.0% |
| Uruguay | 13 | 0.0% |
| Venezuela | 188 | 0.0% |
| Vietnam | 1,225 | 0.2% |
| West Indies | 16 | 0.0% |
| Western Africa | 13,947 | 2.6% |
| Western Asia | 779 | 0.2% |
| Western Europe | 1,284 | 0.2% |
| Zimbabwe | 21 | 0.0% | View All 115 Rows |
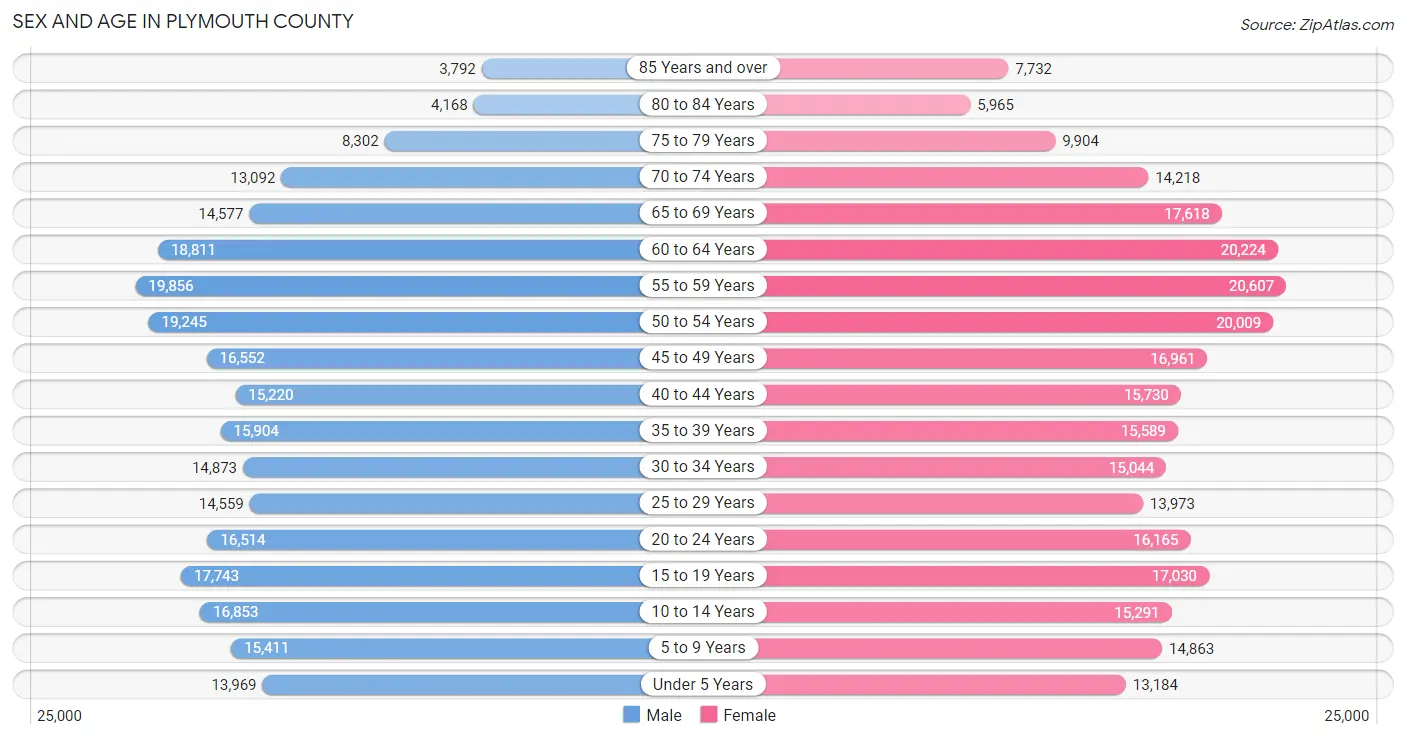
Sex and Age in Plymouth County
Sex and Age in Plymouth County
The most populous age groups in Plymouth County are 55 to 59 Years (19,856 | 7.6%) for men and 55 to 59 Years (20,607 | 7.6%) for women.
| Age Bracket | Male | Female |
| Under 5 Years | 13,969 (5.4%) | 13,184 (4.9%) |
| 5 to 9 Years | 15,411 (5.9%) | 14,863 (5.5%) |
| 10 to 14 Years | 16,853 (6.5%) | 15,291 (5.7%) |
| 15 to 19 Years | 17,743 (6.8%) | 17,030 (6.3%) |
| 20 to 24 Years | 16,514 (6.4%) | 16,165 (6.0%) |
| 25 to 29 Years | 14,559 (5.6%) | 13,973 (5.2%) |
| 30 to 34 Years | 14,873 (5.7%) | 15,044 (5.6%) |
| 35 to 39 Years | 15,904 (6.1%) | 15,589 (5.8%) |
| 40 to 44 Years | 15,220 (5.9%) | 15,730 (5.8%) |
| 45 to 49 Years | 16,552 (6.4%) | 16,961 (6.3%) |
| 50 to 54 Years | 19,245 (7.4%) | 20,009 (7.4%) |
| 55 to 59 Years | 19,856 (7.6%) | 20,607 (7.6%) |
| 60 to 64 Years | 18,811 (7.2%) | 20,224 (7.5%) |
| 65 to 69 Years | 14,577 (5.6%) | 17,618 (6.5%) |
| 70 to 74 Years | 13,092 (5.1%) | 14,218 (5.3%) |
| 75 to 79 Years | 8,302 (3.2%) | 9,904 (3.7%) |
| 80 to 84 Years | 4,168 (1.6%) | 5,965 (2.2%) |
| 85 Years and over | 3,792 (1.5%) | 7,732 (2.9%) |
| Total | 259,441 (100.0%) | 270,107 (100.0%) |
Families and Households in Plymouth County
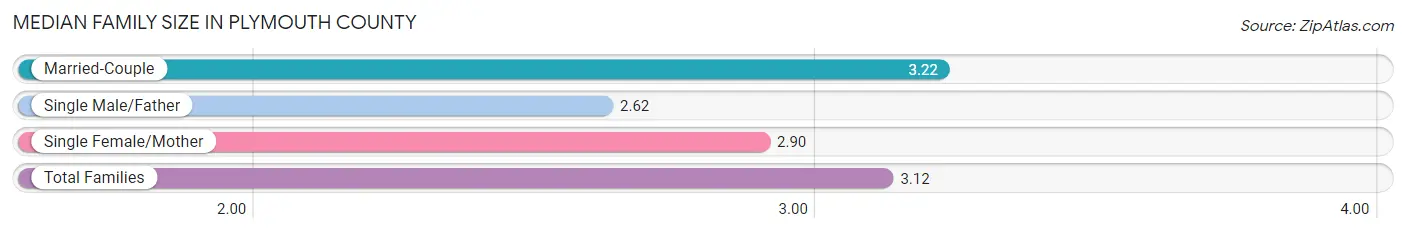
Median Family Size in Plymouth County
The median family size in Plymouth County is 3.12 persons per family, with married-couple families (105,824 | 76.0%) accounting for the largest median family size of 3.22 persons per family. On the other hand, single male/father families (9,946 | 7.1%) represent the smallest median family size with 2.62 persons per family.
| Family Type | # Families | Family Size |
| Married-Couple | 105,824 (76.0%) | 3.22 |
| Single Male/Father | 9,946 (7.1%) | 2.62 |
| Single Female/Mother | 23,438 (16.8%) | 2.90 |
| Total Families | 139,208 (100.0%) | 3.12 |
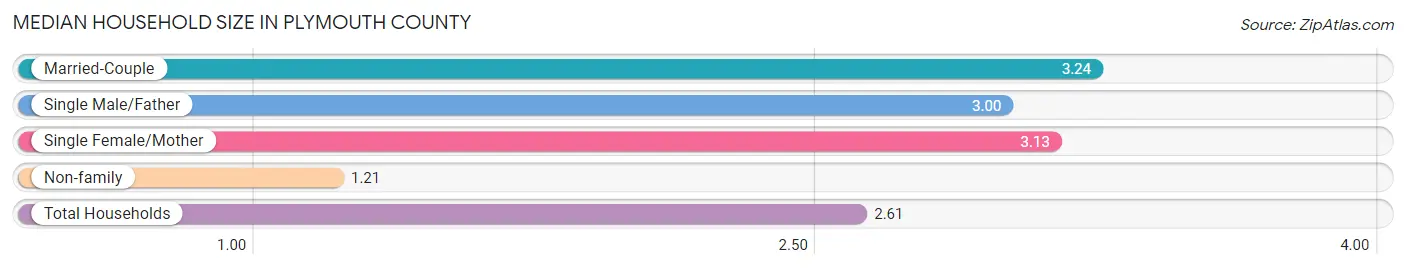
Median Household Size in Plymouth County
The median household size in Plymouth County is 2.61 persons per household, with married-couple households (105,824 | 53.2%) accounting for the largest median household size of 3.24 persons per household. non-family households (59,729 | 30.0%) represent the smallest median household size with 1.21 persons per household.
| Household Type | # Households | Household Size |
| Married-Couple | 105,824 (53.2%) | 3.24 |
| Single Male/Father | 9,946 (5.0%) | 3.00 |
| Single Female/Mother | 23,438 (11.8%) | 3.13 |
| Non-family | 59,729 (30.0%) | 1.21 |
| Total Households | 198,937 (100.0%) | 2.61 |
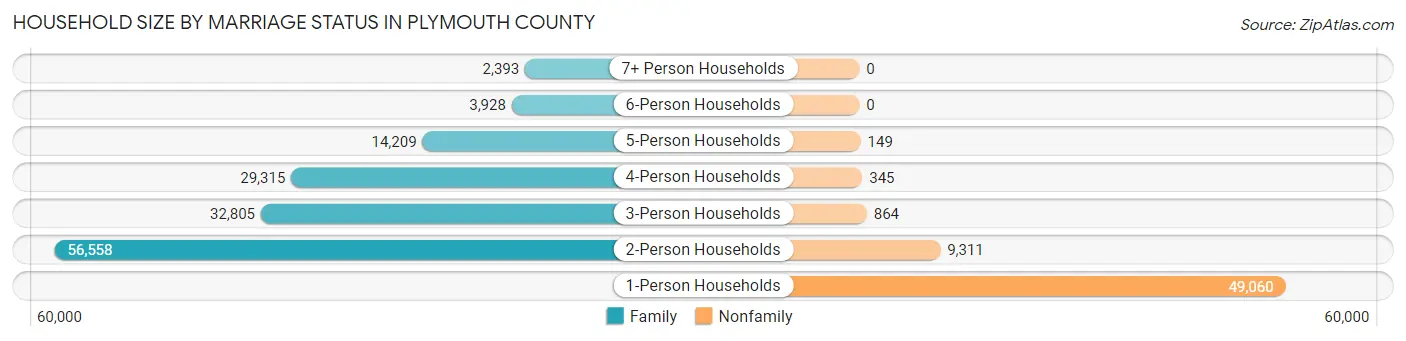
Household Size by Marriage Status in Plymouth County
Out of a total of 198,937 households in Plymouth County, 139,208 (70.0%) are family households, while 59,729 (30.0%) are nonfamily households. The most numerous type of family households are 2-person households, comprising 56,558, and the most common type of nonfamily households are 1-person households, comprising 49,060.
| Household Size | Family Households | Nonfamily Households |
| 1-Person Households | - | 49,060 (24.7%) |
| 2-Person Households | 56,558 (28.4%) | 9,311 (4.7%) |
| 3-Person Households | 32,805 (16.5%) | 864 (0.4%) |
| 4-Person Households | 29,315 (14.7%) | 345 (0.2%) |
| 5-Person Households | 14,209 (7.1%) | 149 (0.1%) |
| 6-Person Households | 3,928 (2.0%) | 0 (0.0%) |
| 7+ Person Households | 2,393 (1.2%) | 0 (0.0%) |
| Total | 139,208 (70.0%) | 59,729 (30.0%) |
Female Fertility in Plymouth County
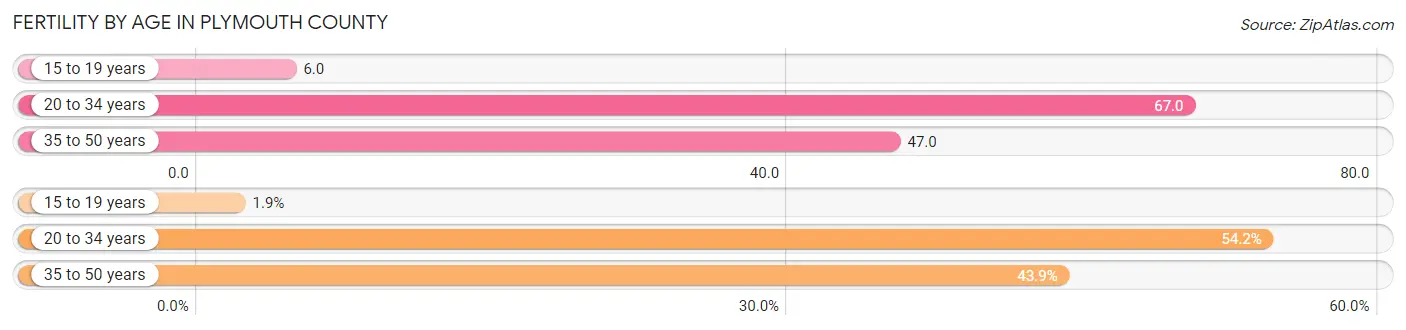
Fertility by Age in Plymouth County
Average fertility rate in Plymouth County is 49.0 births per 1,000 women. Women in the age bracket of 20 to 34 years have the highest fertility rate with 67.0 births per 1,000 women. Women in the age bracket of 20 to 34 years acount for 54.2% of all women with births.
| Age Bracket | Women with Births | Births / 1,000 Women |
| 15 to 19 years | 106 (1.9%) | 6.0 |
| 20 to 34 years | 3,008 (54.2%) | 67.0 |
| 35 to 50 years | 2,432 (43.9%) | 47.0 |
| Total | 5,546 (100.0%) | 49.0 |
Fertility by Age by Marriage Status in Plymouth County
78.2% of women with births (5,546) in Plymouth County are married. The highest percentage of unmarried women with births falls into 15 to 19 years age bracket with 67.0% of them unmarried at the time of birth, while the lowest percentage of unmarried women with births belong to 35 to 50 years age bracket with 16.3% of them unmarried.
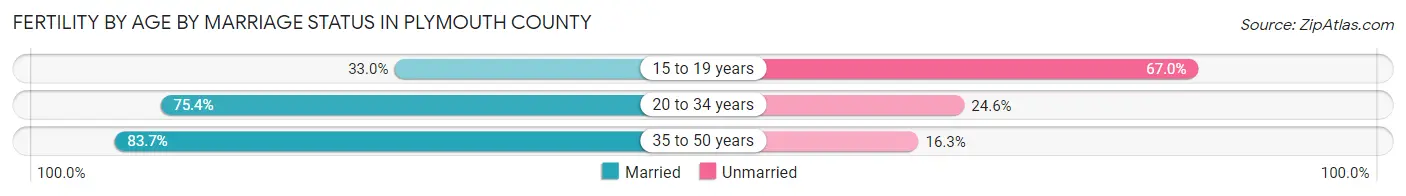
| Age Bracket | Married | Unmarried |
| 15 to 19 years | 35 (33.0%) | 71 (67.0%) |
| 20 to 34 years | 2,268 (75.4%) | 740 (24.6%) |
| 35 to 50 years | 2,036 (83.7%) | 396 (16.3%) |
| Total | 4,337 (78.2%) | 1,209 (21.8%) |
Fertility by Education in Plymouth County
Average fertility rate in Plymouth County is 49.0 births per 1,000 women. Women with the education attainment of bachelor's degree have the highest fertility rate of 62.0 births per 1,000 women, while women with the education attainment of less than high school have the lowest fertility at 14.0 births per 1,000 women. Women with the education attainment of bachelor's degree represent 33.8% of all women with births.
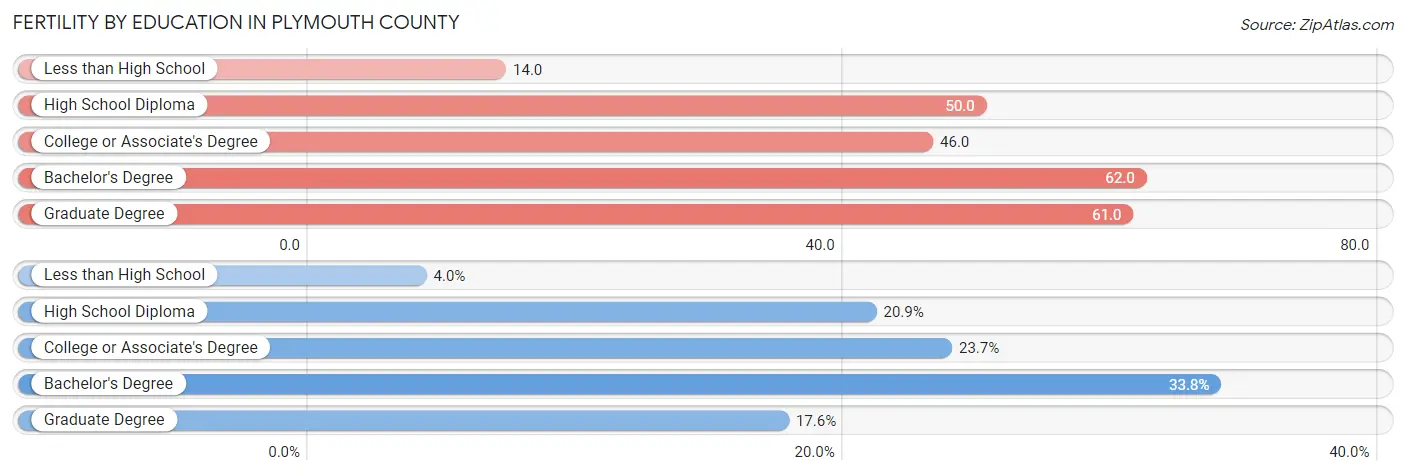
| Educational Attainment | Women with Births | Births / 1,000 Women |
| Less than High School | 223 (4.0%) | 14.0 |
| High School Diploma | 1,158 (20.9%) | 50.0 |
| College or Associate's Degree | 1,315 (23.7%) | 46.0 |
| Bachelor's Degree | 1,874 (33.8%) | 62.0 |
| Graduate Degree | 976 (17.6%) | 61.0 |
| Total | 5,546 (100.0%) | 49.0 |
Fertility by Education by Marriage Status in Plymouth County
21.8% of women with births in Plymouth County are unmarried. Women with the educational attainment of graduate degree are most likely to be married with 95.2% of them married at childbirth, while women with the educational attainment of less than high school are least likely to be married with 52.5% of them unmarried at childbirth.
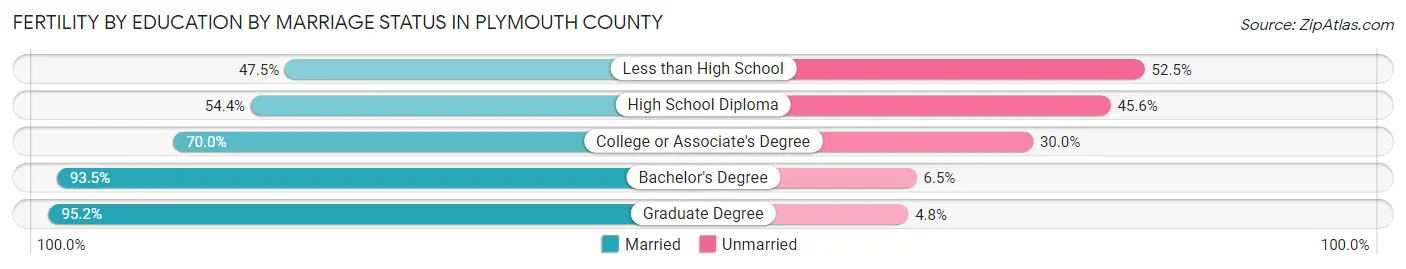
| Educational Attainment | Married | Unmarried |
| Less than High School | 106 (47.5%) | 117 (52.5%) |
| High School Diploma | 630 (54.4%) | 528 (45.6%) |
| College or Associate's Degree | 921 (70.0%) | 394 (30.0%) |
| Bachelor's Degree | 1,752 (93.5%) | 122 (6.5%) |
| Graduate Degree | 929 (95.2%) | 47 (4.8%) |
| Total | 4,337 (78.2%) | 1,209 (21.8%) |
Income in Plymouth County
Income Overview in Plymouth County
Per Capita Income in Plymouth County is $53,423, while median incomes of families and households are $128,726 and $105,387 respectively.
| Characteristic | Number | Measure |
| Per Capita Income | 529,548 | $53,423 |
| Median Family Income | 139,208 | $128,726 |
| Mean Family Income | 139,208 | $165,735 |
| Median Household Income | 198,937 | $105,387 |
| Mean Household Income | 198,937 | $140,463 |
| Income Deficit | 139,208 | $10,913 |
| Wage / Income Gap (%) | 529,548 | 31.85% |
| Wage / Income Gap ($) | 529,548 | 68.15¢ per $1 |
| Gini / Inequality Index | 529,548 | 0.46 |
Earnings by Sex in Plymouth County
Average Earnings in Plymouth County are $52,743, $63,199 for men and $43,072 for women, a difference of 31.9%.
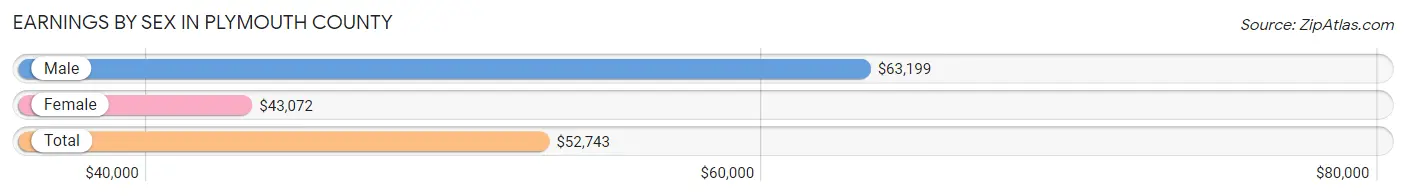
| Sex | Number | Average Earnings |
| Male | 155,065 (51.3%) | $63,199 |
| Female | 147,211 (48.7%) | $43,072 |
| Total | 302,276 (100.0%) | $52,743 |
Earnings by Sex by Income Bracket in Plymouth County
The most common earnings brackets in Plymouth County are $100,000+ for men (45,574 | 29.4%) and $100,000+ for women (22,786 | 15.5%).
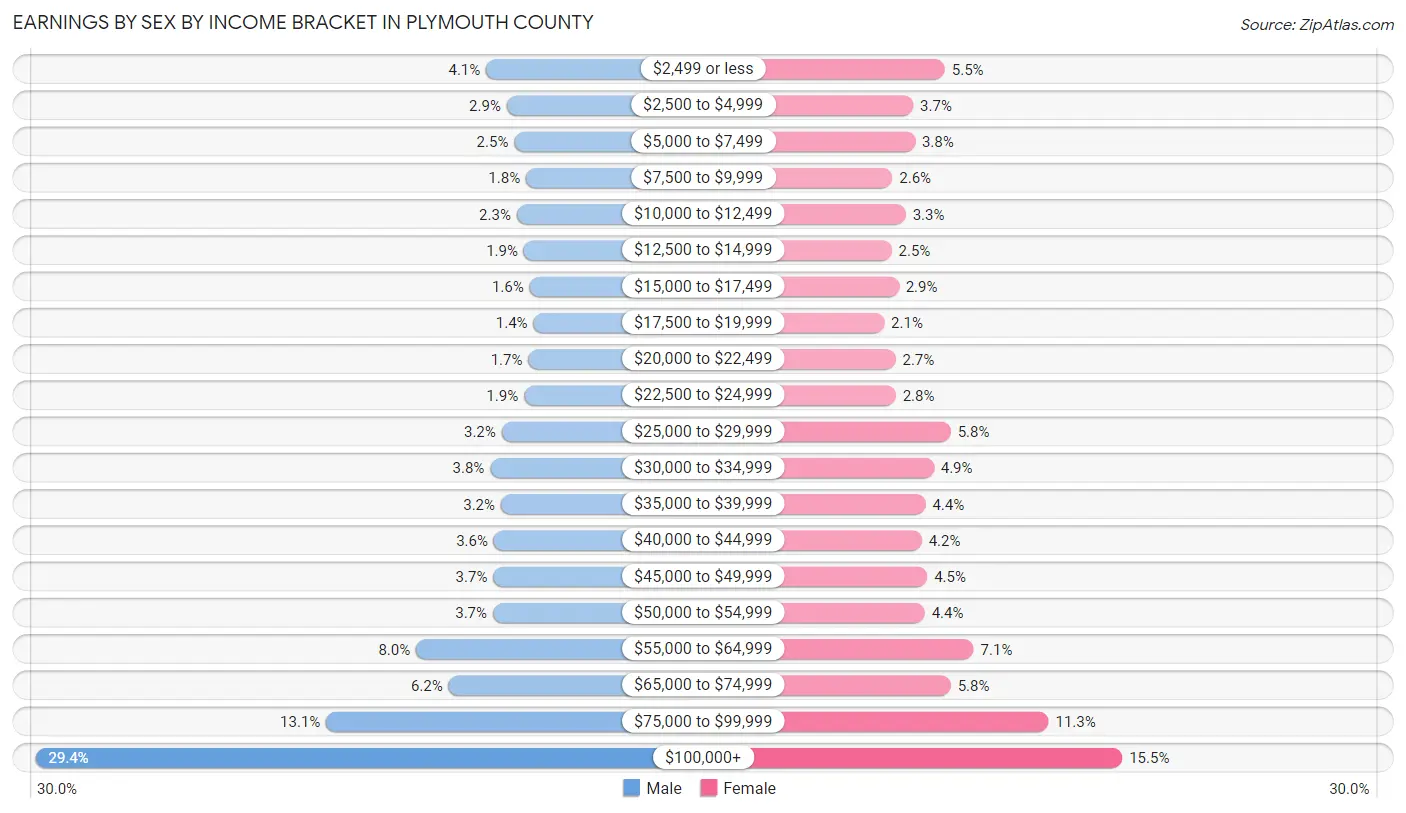
| Income | Male | Female |
| $2,499 or less | 6,296 (4.1%) | 8,115 (5.5%) |
| $2,500 to $4,999 | 4,492 (2.9%) | 5,492 (3.7%) |
| $5,000 to $7,499 | 3,851 (2.5%) | 5,638 (3.8%) |
| $7,500 to $9,999 | 2,817 (1.8%) | 3,772 (2.6%) |
| $10,000 to $12,499 | 3,621 (2.3%) | 4,869 (3.3%) |
| $12,500 to $14,999 | 3,015 (1.9%) | 3,706 (2.5%) |
| $15,000 to $17,499 | 2,508 (1.6%) | 4,292 (2.9%) |
| $17,500 to $19,999 | 2,168 (1.4%) | 3,085 (2.1%) |
| $20,000 to $22,499 | 2,616 (1.7%) | 4,040 (2.7%) |
| $22,500 to $24,999 | 2,991 (1.9%) | 4,041 (2.8%) |
| $25,000 to $29,999 | 4,952 (3.2%) | 8,597 (5.8%) |
| $30,000 to $34,999 | 5,936 (3.8%) | 7,197 (4.9%) |
| $35,000 to $39,999 | 5,011 (3.2%) | 6,509 (4.4%) |
| $40,000 to $44,999 | 5,626 (3.6%) | 6,191 (4.2%) |
| $45,000 to $49,999 | 5,679 (3.7%) | 6,647 (4.5%) |
| $50,000 to $54,999 | 5,708 (3.7%) | 6,446 (4.4%) |
| $55,000 to $64,999 | 12,405 (8.0%) | 10,493 (7.1%) |
| $65,000 to $74,999 | 9,568 (6.2%) | 8,594 (5.8%) |
| $75,000 to $99,999 | 20,231 (13.1%) | 16,701 (11.3%) |
| $100,000+ | 45,574 (29.4%) | 22,786 (15.5%) |
| Total | 155,065 (100.0%) | 147,211 (100.0%) |
Earnings by Sex by Educational Attainment in Plymouth County
Average earnings in Plymouth County are $73,548 for men and $51,171 for women, a difference of 30.4%. Men with an educational attainment of graduate degree enjoy the highest average annual earnings of $121,340, while those with less than high school education earn the least with $41,332. Women with an educational attainment of graduate degree earn the most with the average annual earnings of $83,490, while those with less than high school education have the smallest earnings of $27,371.
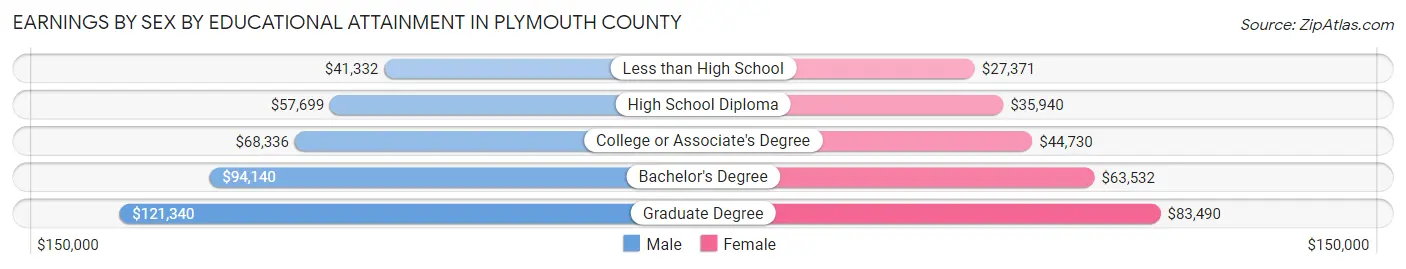
| Educational Attainment | Male Income | Female Income |
| Less than High School | $41,332 | $27,371 |
| High School Diploma | $57,699 | $35,940 |
| College or Associate's Degree | $68,336 | $44,730 |
| Bachelor's Degree | $94,140 | $63,532 |
| Graduate Degree | $121,340 | $83,490 |
| Total | $73,548 | $51,171 |
Family Income in Plymouth County
Family Income Brackets in Plymouth County
According to the Plymouth County family income data, there are 35,498 families falling into the $200,000+ income range, which is the most common income bracket and makes up 25.5% of all families. Conversely, the $10,000 to $14,999 income bracket is the least frequent group with only 1,253 families (0.9%) belonging to this category.
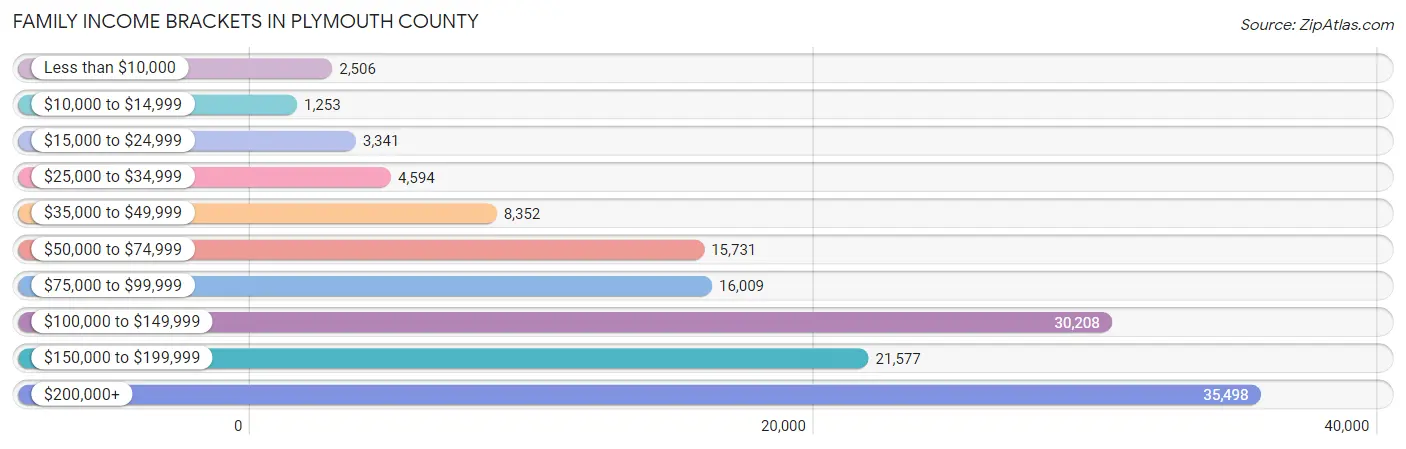
| Income Bracket | # Families | % Families |
| Less than $10,000 | 2,506 | 1.8% |
| $10,000 to $14,999 | 1,253 | 0.9% |
| $15,000 to $24,999 | 3,341 | 2.4% |
| $25,000 to $34,999 | 4,594 | 3.3% |
| $35,000 to $49,999 | 8,352 | 6.0% |
| $50,000 to $74,999 | 15,731 | 11.3% |
| $75,000 to $99,999 | 16,009 | 11.5% |
| $100,000 to $149,999 | 30,208 | 21.7% |
| $150,000 to $199,999 | 21,577 | 15.5% |
| $200,000+ | 35,498 | 25.5% |
Family Income by Famaliy Size in Plymouth County
5-person families (13,161 | 9.5%) account for the highest median family income in Plymouth County with $171,423 per family, while 2-person families (61,188 | 44.0%) have the highest median income of $51,650 per family member.
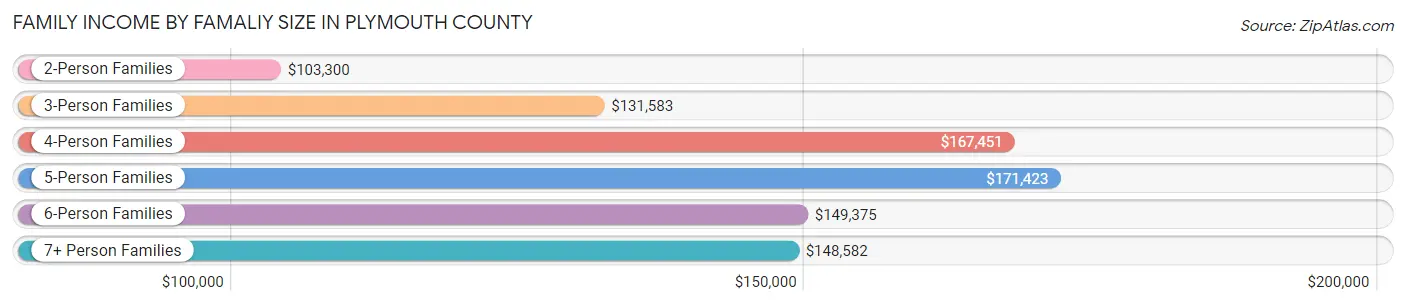
| Income Bracket | # Families | Median Income |
| 2-Person Families | 61,188 (44.0%) | $103,300 |
| 3-Person Families | 31,411 (22.6%) | $131,583 |
| 4-Person Families | 28,147 (20.2%) | $167,451 |
| 5-Person Families | 13,161 (9.5%) | $171,423 |
| 6-Person Families | 3,408 (2.5%) | $149,375 |
| 7+ Person Families | 1,893 (1.4%) | $148,582 |
| Total | 139,208 (100.0%) | $128,726 |
Family Income by Number of Earners in Plymouth County
The median family income in Plymouth County is $128,726, with families comprising 3+ earners (24,351) having the highest median family income of $187,448, while families with no earners (17,483) have the lowest median family income of $62,555, accounting for 17.5% and 12.6% of families, respectively.
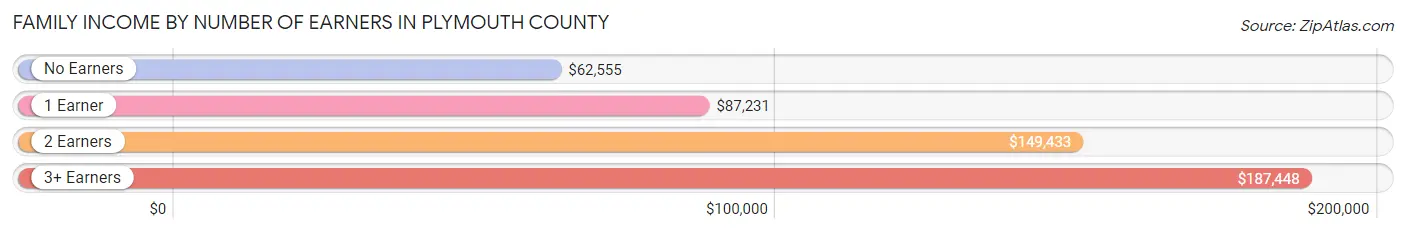
| Number of Earners | # Families | Median Income |
| No Earners | 17,483 (12.6%) | $62,555 |
| 1 Earner | 35,219 (25.3%) | $87,231 |
| 2 Earners | 62,155 (44.7%) | $149,433 |
| 3+ Earners | 24,351 (17.5%) | $187,448 |
| Total | 139,208 (100.0%) | $128,726 |
Household Income in Plymouth County
Household Income Brackets in Plymouth County
With 39,588 households falling in the category, the $200,000+ income range is the most frequent in Plymouth County, accounting for 19.9% of all households. In contrast, only 5,371 households (2.7%) fall into the $10,000 to $14,999 income bracket, making it the least populous group.
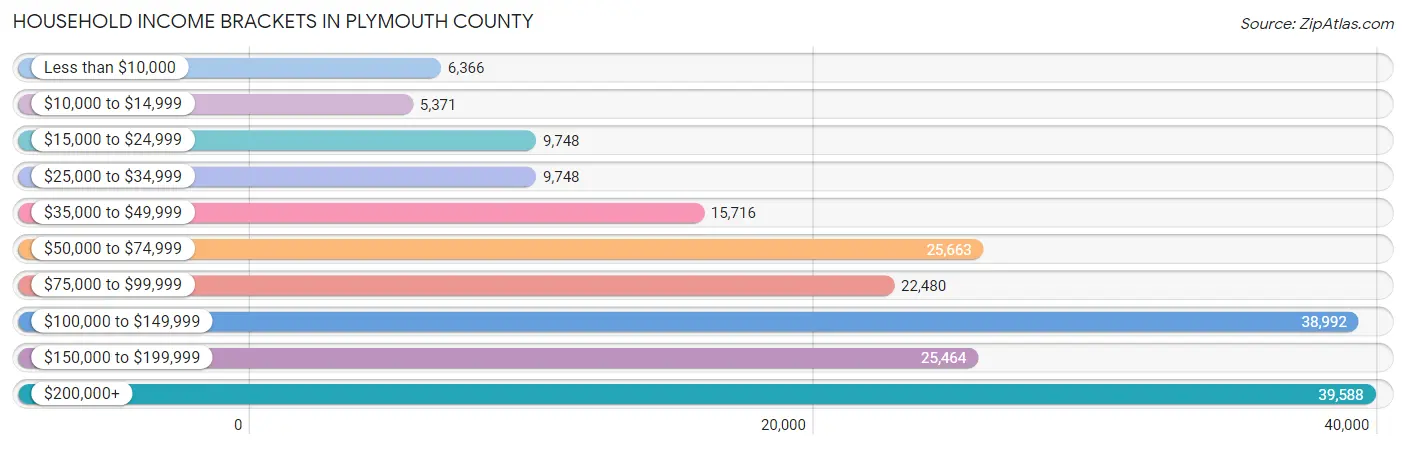
| Income Bracket | # Households | % Households |
| Less than $10,000 | 6,366 | 3.2% |
| $10,000 to $14,999 | 5,371 | 2.7% |
| $15,000 to $24,999 | 9,748 | 4.9% |
| $25,000 to $34,999 | 9,748 | 4.9% |
| $35,000 to $49,999 | 15,716 | 7.9% |
| $50,000 to $74,999 | 25,663 | 12.9% |
| $75,000 to $99,999 | 22,480 | 11.3% |
| $100,000 to $149,999 | 38,992 | 19.6% |
| $150,000 to $199,999 | 25,464 | 12.8% |
| $200,000+ | 39,588 | 19.9% |
Household Income by Householder Age in Plymouth County
The median household income in Plymouth County is $105,387, with the highest median household income of $131,410 found in the 45 to 64 years age bracket for the primary householder. A total of 84,574 households (42.5%) fall into this category. Meanwhile, the 15 to 24 years age bracket for the primary householder has the lowest median household income of $54,015, with 2,785 households (1.4%) in this group.
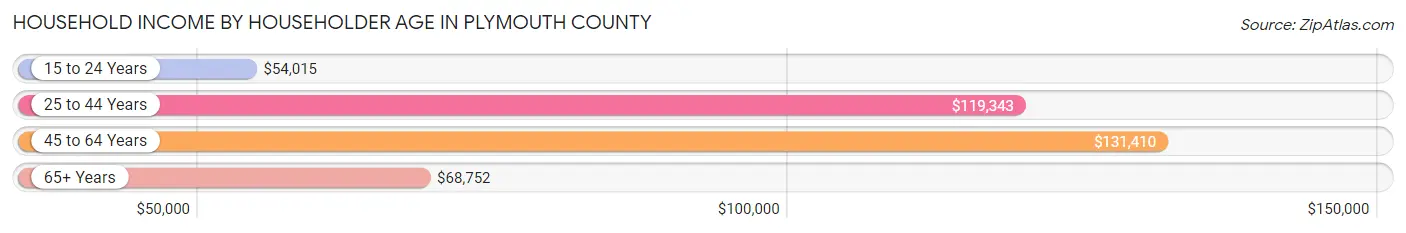
| Income Bracket | # Households | Median Income |
| 15 to 24 Years | 2,785 (1.4%) | $54,015 |
| 25 to 44 Years | 51,140 (25.7%) | $119,343 |
| 45 to 64 Years | 84,574 (42.5%) | $131,410 |
| 65+ Years | 60,438 (30.4%) | $68,752 |
| Total | 198,937 (100.0%) | $105,387 |
Poverty in Plymouth County
Income Below Poverty by Sex and Age in Plymouth County
With 5.7% poverty level for males and 7.6% for females among the residents of Plymouth County, 5 year old males and 75 year old and over females are the most vulnerable to poverty, with 254 males (8.8%) and 2,874 females (13.0%) in their respective age groups living below the poverty level.
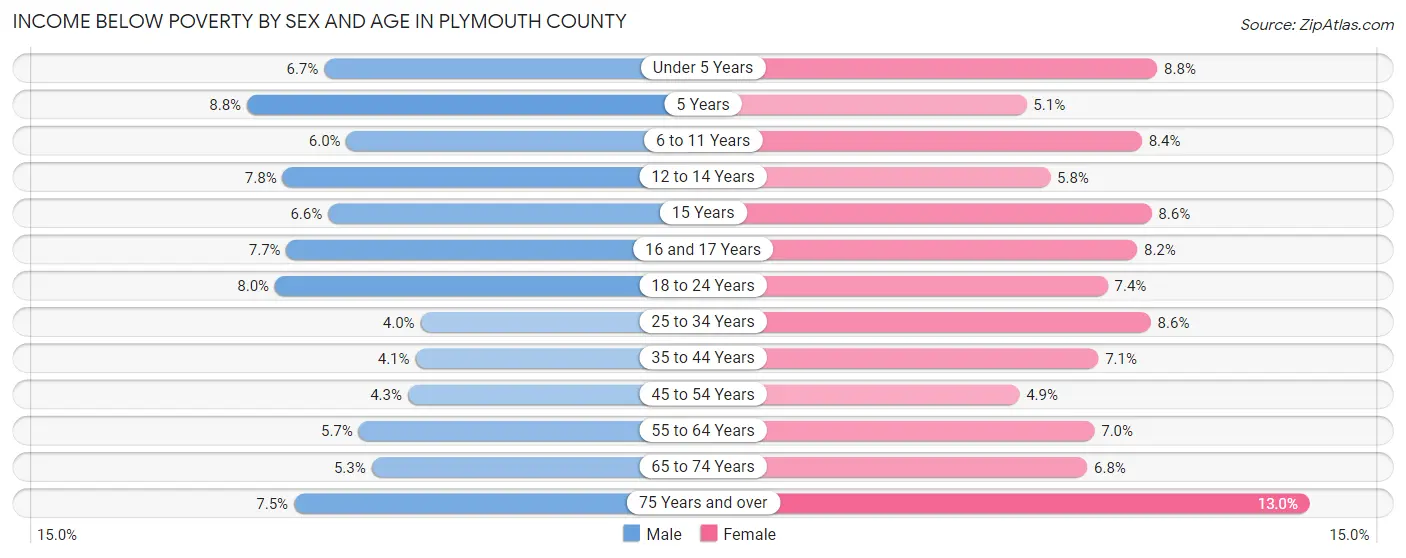
| Age Bracket | Male | Female |
| Under 5 Years | 918 (6.7%) | 1,133 (8.8%) |
| 5 Years | 254 (8.8%) | 147 (5.1%) |
| 6 to 11 Years | 1,131 (6.0%) | 1,479 (8.4%) |
| 12 to 14 Years | 801 (7.8%) | 527 (5.8%) |
| 15 Years | 218 (6.6%) | 314 (8.6%) |
| 16 and 17 Years | 590 (7.7%) | 556 (8.2%) |
| 18 to 24 Years | 1,758 (8.0%) | 1,566 (7.4%) |
| 25 to 34 Years | 1,145 (4.0%) | 2,494 (8.6%) |
| 35 to 44 Years | 1,259 (4.1%) | 2,235 (7.1%) |
| 45 to 54 Years | 1,527 (4.3%) | 1,827 (4.9%) |
| 55 to 64 Years | 2,175 (5.7%) | 2,857 (7.0%) |
| 65 to 74 Years | 1,452 (5.3%) | 2,150 (6.8%) |
| 75 Years and over | 1,160 (7.5%) | 2,874 (13.0%) |
| Total | 14,388 (5.7%) | 20,159 (7.6%) |
Income Above Poverty by Sex and Age in Plymouth County
According to the poverty statistics in Plymouth County, males aged 25 to 34 years and females aged 45 to 54 years are the age groups that are most secure financially, with 96.0% of males and 95.1% of females in these age groups living above the poverty line.
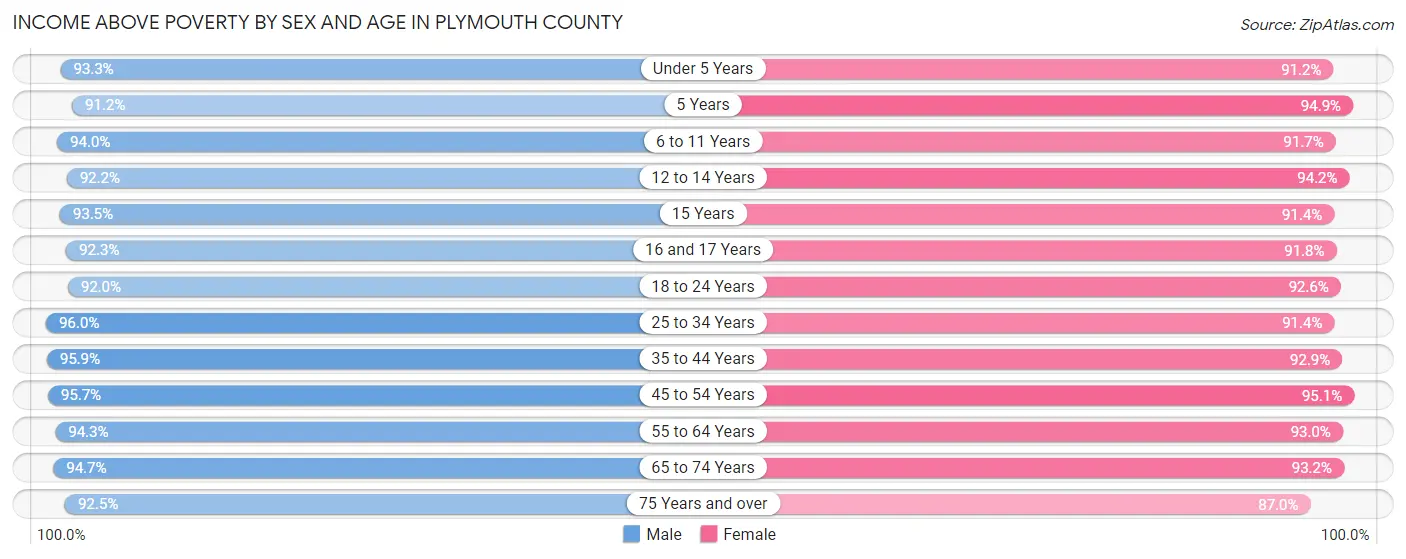
| Age Bracket | Male | Female |
| Under 5 Years | 12,872 (93.3%) | 11,764 (91.2%) |
| 5 Years | 2,628 (91.2%) | 2,713 (94.9%) |
| 6 to 11 Years | 17,590 (94.0%) | 16,230 (91.6%) |
| 12 to 14 Years | 9,441 (92.2%) | 8,557 (94.2%) |
| 15 Years | 3,109 (93.4%) | 3,328 (91.4%) |
| 16 and 17 Years | 7,062 (92.3%) | 6,209 (91.8%) |
| 18 to 24 Years | 20,148 (92.0%) | 19,583 (92.6%) |
| 25 to 34 Years | 27,600 (96.0%) | 26,516 (91.4%) |
| 35 to 44 Years | 29,273 (95.9%) | 29,075 (92.9%) |
| 45 to 54 Years | 33,756 (95.7%) | 35,125 (95.1%) |
| 55 to 64 Years | 35,975 (94.3%) | 37,773 (93.0%) |
| 65 to 74 Years | 25,723 (94.7%) | 29,336 (93.2%) |
| 75 Years and over | 14,298 (92.5%) | 19,180 (87.0%) |
| Total | 239,475 (94.3%) | 245,389 (92.4%) |
Income Below Poverty Among Married-Couple Families in Plymouth County
The poverty statistics for married-couple families in Plymouth County show that 2.0% or 2,142 of the total 105,824 families live below the poverty line. Families with 5 or more children have the highest poverty rate of 16.1%, comprising of 49 families. On the other hand, families with 1 or 2 children have the lowest poverty rate of 1.3%, which includes 438 families.
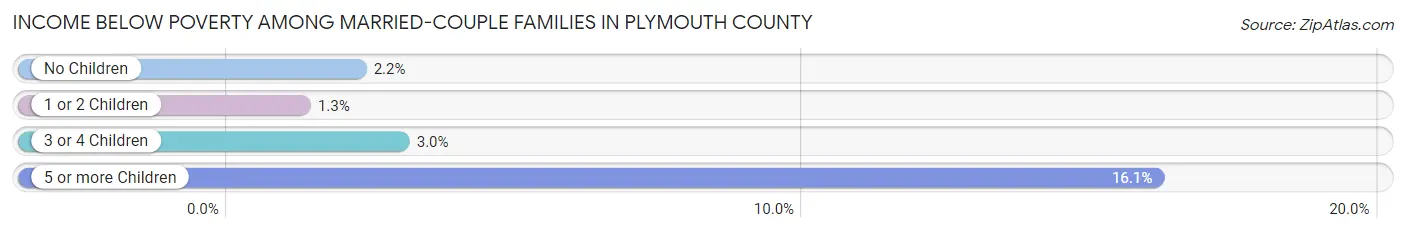
| Children | Above Poverty | Below Poverty |
| No Children | 61,226 (97.8%) | 1,401 (2.2%) |
| 1 or 2 Children | 33,963 (98.7%) | 438 (1.3%) |
| 3 or 4 Children | 8,238 (97.0%) | 254 (3.0%) |
| 5 or more Children | 255 (83.9%) | 49 (16.1%) |
| Total | 103,682 (98.0%) | 2,142 (2.0%) |
Income Below Poverty Among Single-Parent Households in Plymouth County
According to the poverty data in Plymouth County, 8.9% or 889 single-father households and 13.3% or 3,114 single-mother households are living below the poverty line. Among single-father households, those with 1 or 2 children have the highest poverty rate, with 620 households (13.3%) experiencing poverty. Likewise, among single-mother households, those with 5 or more children have the highest poverty rate, with 143 households (77.3%) falling below the poverty line.
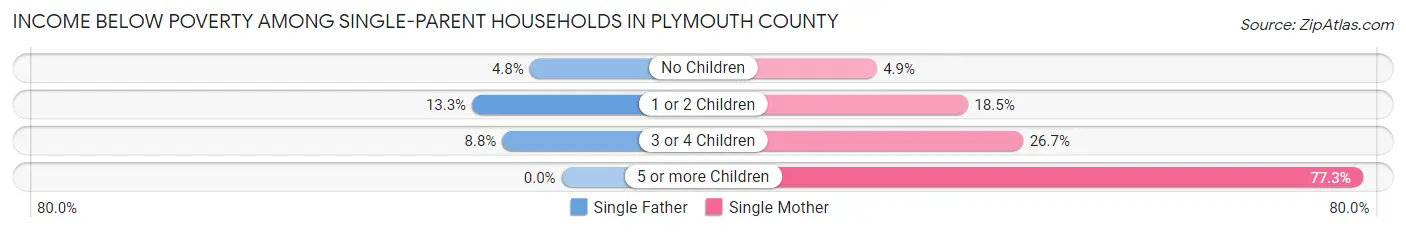
| Children | Single Father | Single Mother |
| No Children | 228 (4.8%) | 501 (4.9%) |
| 1 or 2 Children | 620 (13.3%) | 2,188 (18.4%) |
| 3 or 4 Children | 41 (8.8%) | 282 (26.7%) |
| 5 or more Children | 0 (0.0%) | 143 (77.3%) |
| Total | 889 (8.9%) | 3,114 (13.3%) |
Income Below Poverty Among Married-Couple vs Single-Parent Households in Plymouth County
The poverty data for Plymouth County shows that 2,142 of the married-couple family households (2.0%) and 4,003 of the single-parent households (12.0%) are living below the poverty level. Within the married-couple family households, those with 5 or more children have the highest poverty rate, with 49 households (16.1%) falling below the poverty line. Among the single-parent households, those with 5 or more children have the highest poverty rate, with 143 household (61.1%) living below poverty.
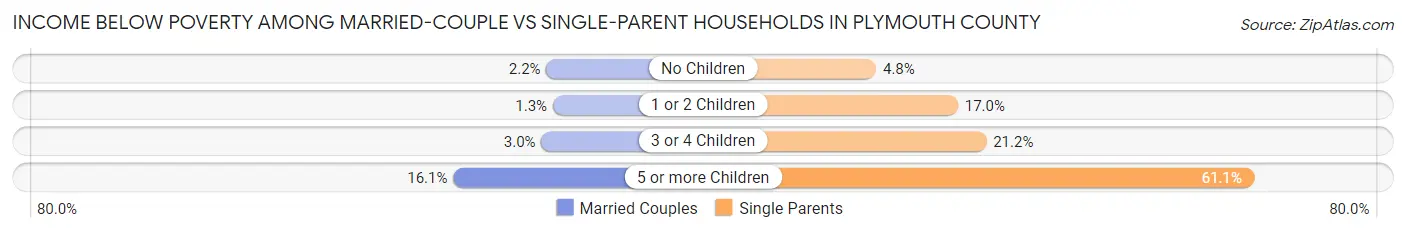
| Children | Married-Couple Families | Single-Parent Households |
| No Children | 1,401 (2.2%) | 729 (4.8%) |
| 1 or 2 Children | 438 (1.3%) | 2,808 (17.0%) |
| 3 or 4 Children | 254 (3.0%) | 323 (21.2%) |
| 5 or more Children | 49 (16.1%) | 143 (61.1%) |
| Total | 2,142 (2.0%) | 4,003 (12.0%) |
Employment Characteristics in Plymouth County
Employment by Class of Employer in Plymouth County
Among the 268,672 employed individuals in Plymouth County, private company employees (177,428 | 66.0%), not-for-profit organizations (27,343 | 10.2%), and local government employees (22,596 | 8.4%) make up the most common classes of employment.
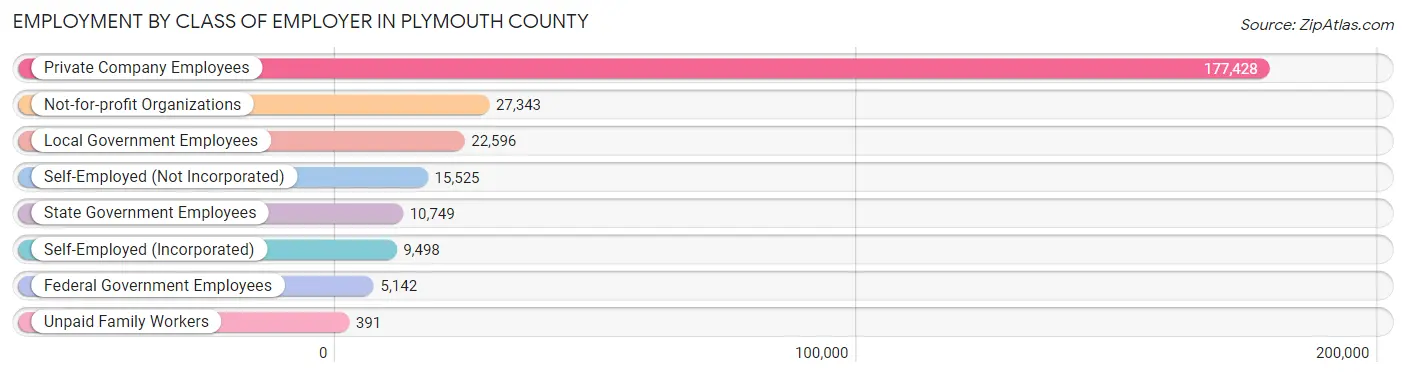
| Employer Class | # Employees | % Employees |
| Private Company Employees | 177,428 | 66.0% |
| Self-Employed (Incorporated) | 9,498 | 3.5% |
| Self-Employed (Not Incorporated) | 15,525 | 5.8% |
| Not-for-profit Organizations | 27,343 | 10.2% |
| Local Government Employees | 22,596 | 8.4% |
| State Government Employees | 10,749 | 4.0% |
| Federal Government Employees | 5,142 | 1.9% |
| Unpaid Family Workers | 391 | 0.2% |
| Total | 268,672 | 100.0% |
Employment Status by Age in Plymouth County
According to the labor force statistics for Plymouth County, out of the total population over 16 years of age (432,994), 67.0% or 290,106 individuals are in the labor force, with 5.2% or 15,086 of them unemployed. The age group with the highest labor force participation rate is 25 to 29 years, with 89.2% or 25,451 individuals in the labor force. Within the labor force, the 16 to 19 years age range has the highest percentage of unemployed individuals, with 15.1% or 1,985 of them being unemployed.
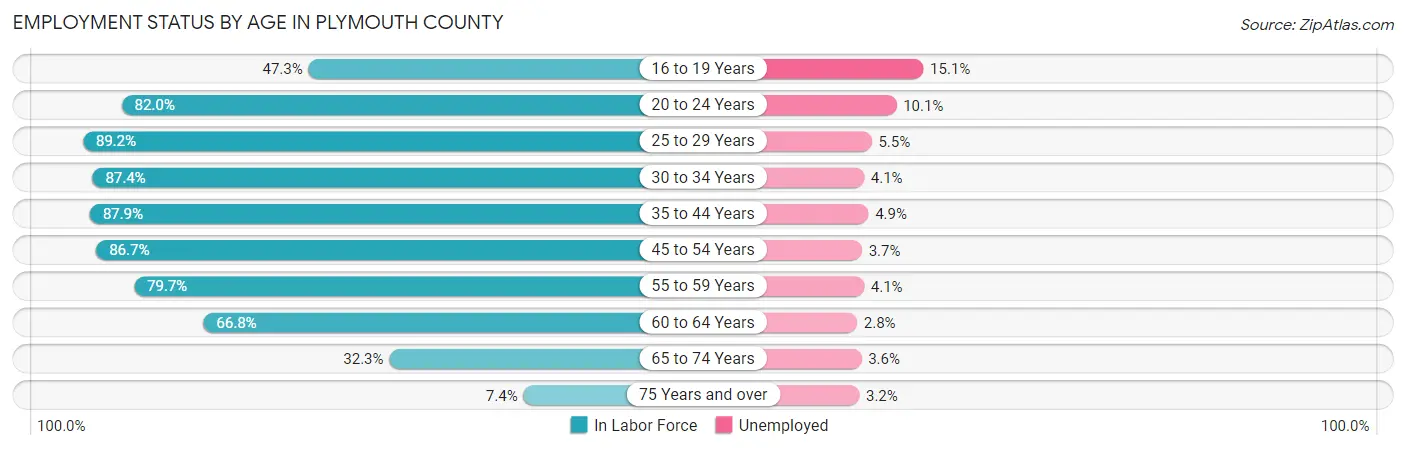
| Age Bracket | In Labor Force | Unemployed |
| 16 to 19 Years | 13,145 (47.3%) | 1,985 (15.1%) |
| 20 to 24 Years | 26,797 (82.0%) | 2,706 (10.1%) |
| 25 to 29 Years | 25,451 (89.2%) | 1,400 (5.5%) |
| 30 to 34 Years | 26,147 (87.4%) | 1,072 (4.1%) |
| 35 to 44 Years | 54,887 (87.9%) | 2,689 (4.9%) |
| 45 to 54 Years | 63,089 (86.7%) | 2,334 (3.7%) |
| 55 to 59 Years | 32,249 (79.7%) | 1,322 (4.1%) |
| 60 to 64 Years | 26,075 (66.8%) | 730 (2.8%) |
| 65 to 74 Years | 19,220 (32.3%) | 692 (3.6%) |
| 75 Years and over | 2,950 (7.4%) | 94 (3.2%) |
| Total | 290,106 (67.0%) | 15,086 (5.2%) |
Employment Status by Educational Attainment in Plymouth County
According to labor force statistics for Plymouth County, 83.4% of individuals (227,813) out of the total population between 25 and 64 years of age (273,157) are in the labor force, with 4.2% or 9,568 of them being unemployed. The group with the highest labor force participation rate are those with the educational attainment of bachelor's degree or higher, with 89.5% or 104,526 individuals in the labor force. Within the labor force, individuals with less than high school education have the highest percentage of unemployment, with 8.5% or 855 of them being unemployed.

| Educational Attainment | In Labor Force | Unemployed |
| Less than High School | 10,060 (65.2%) | 1,311 (8.5%) |
| High School Diploma | 53,993 (77.6%) | 4,453 (6.4%) |
| College / Associate Degree | 59,372 (83.2%) | 3,140 (4.4%) |
| Bachelor's Degree or higher | 104,526 (89.5%) | 2,920 (2.5%) |
| Total | 227,813 (83.4%) | 11,473 (4.2%) |
Employment Occupations by Sex in Plymouth County
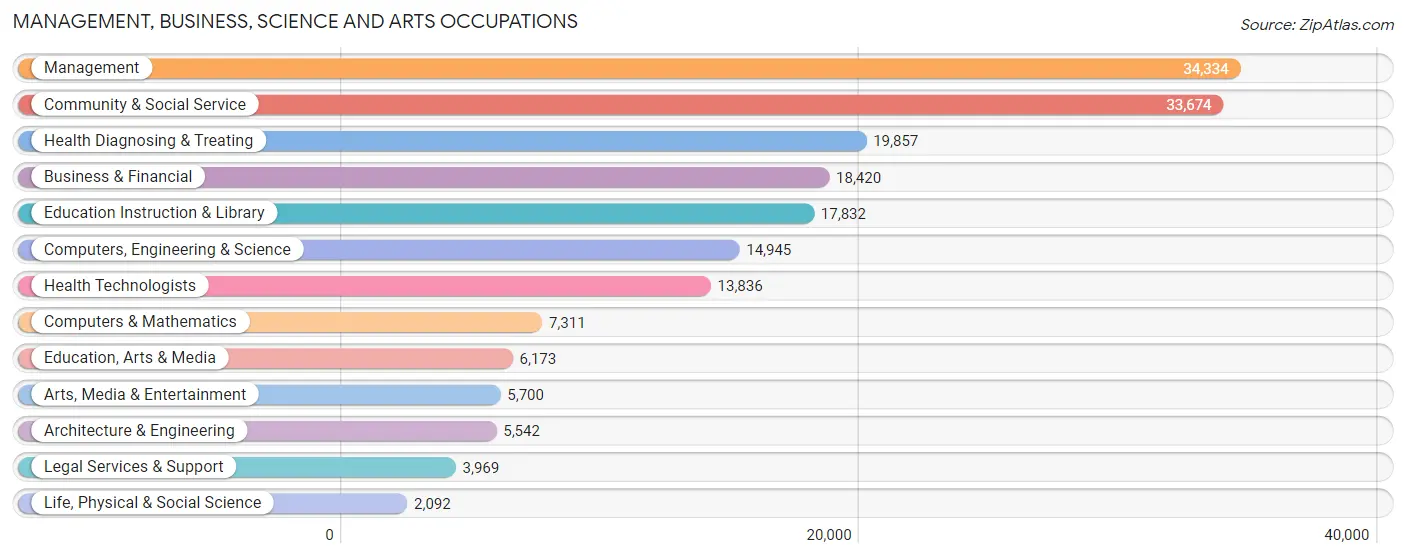
Management, Business, Science and Arts Occupations
The most common Management, Business, Science and Arts occupations in Plymouth County are Management (34,334 | 12.5%), Community & Social Service (33,674 | 12.3%), Health Diagnosing & Treating (19,857 | 7.2%), Business & Financial (18,420 | 6.7%), and Education Instruction & Library (17,832 | 6.5%).
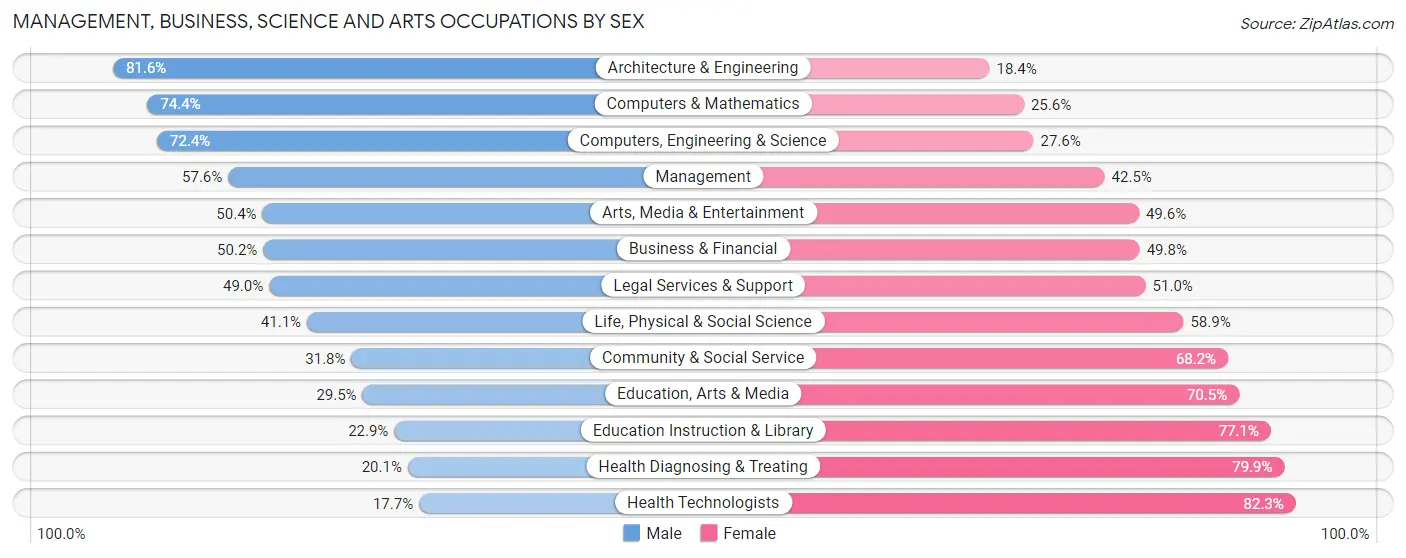
Management, Business, Science and Arts Occupations by Sex
Within the Management, Business, Science and Arts occupations in Plymouth County, the most male-oriented occupations are Architecture & Engineering (81.6%), Computers & Mathematics (74.4%), and Computers, Engineering & Science (72.4%), while the most female-oriented occupations are Health Technologists (82.3%), Health Diagnosing & Treating (79.9%), and Education Instruction & Library (77.1%).
| Occupation | Male | Female |
| Management | 19,758 (57.6%) | 14,576 (42.4%) |
| Business & Financial | 9,255 (50.2%) | 9,165 (49.8%) |
| Computers, Engineering & Science | 10,818 (72.4%) | 4,127 (27.6%) |
| Computers & Mathematics | 5,438 (74.4%) | 1,873 (25.6%) |
| Architecture & Engineering | 4,520 (81.6%) | 1,022 (18.4%) |
| Life, Physical & Social Science | 860 (41.1%) | 1,232 (58.9%) |
| Community & Social Service | 10,722 (31.8%) | 22,952 (68.2%) |
| Education, Arts & Media | 1,822 (29.5%) | 4,351 (70.5%) |
| Legal Services & Support | 1,945 (49.0%) | 2,024 (51.0%) |
| Education Instruction & Library | 4,083 (22.9%) | 13,749 (77.1%) |
| Arts, Media & Entertainment | 2,872 (50.4%) | 2,828 (49.6%) |
| Health Diagnosing & Treating | 3,988 (20.1%) | 15,869 (79.9%) |
| Health Technologists | 2,453 (17.7%) | 11,383 (82.3%) |
| Total (Category) | 54,541 (45.0%) | 66,689 (55.0%) |
| Total (Overall) | 140,404 (51.1%) | 134,232 (48.9%) |
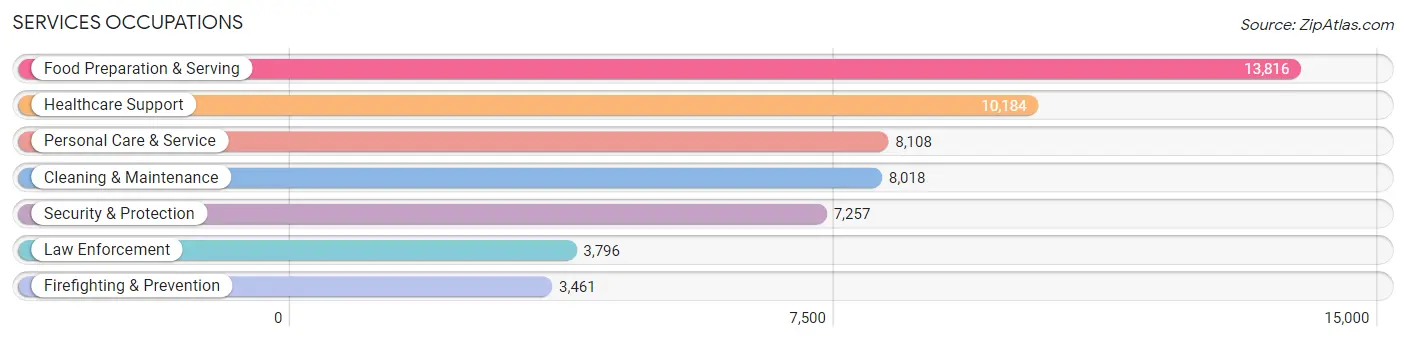
Services Occupations
The most common Services occupations in Plymouth County are Food Preparation & Serving (13,816 | 5.0%), Healthcare Support (10,184 | 3.7%), Personal Care & Service (8,108 | 2.9%), Cleaning & Maintenance (8,018 | 2.9%), and Security & Protection (7,257 | 2.6%).
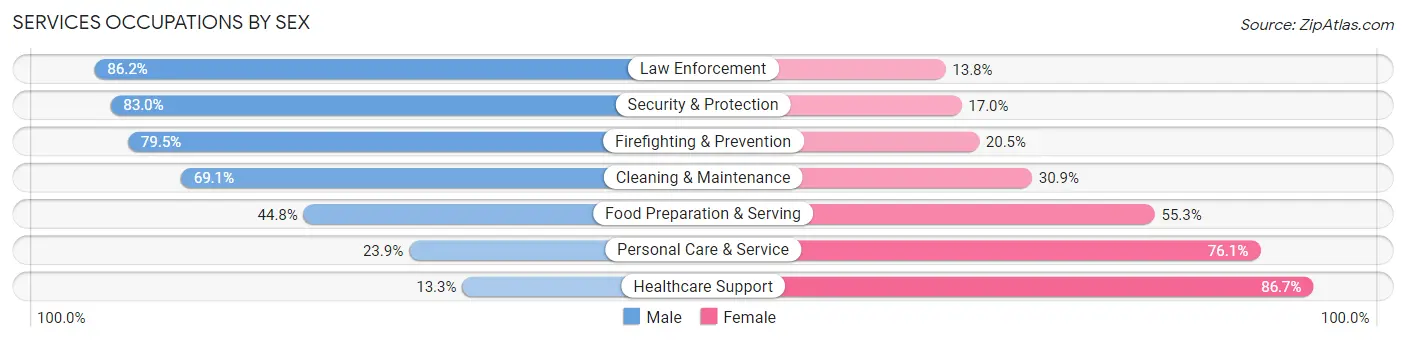
Services Occupations by Sex
Within the Services occupations in Plymouth County, the most male-oriented occupations are Law Enforcement (86.2%), Security & Protection (83.0%), and Firefighting & Prevention (79.5%), while the most female-oriented occupations are Healthcare Support (86.7%), Personal Care & Service (76.1%), and Food Preparation & Serving (55.2%).
| Occupation | Male | Female |
| Healthcare Support | 1,357 (13.3%) | 8,827 (86.7%) |
| Security & Protection | 6,024 (83.0%) | 1,233 (17.0%) |
| Firefighting & Prevention | 2,753 (79.5%) | 708 (20.5%) |
| Law Enforcement | 3,271 (86.2%) | 525 (13.8%) |
| Food Preparation & Serving | 6,182 (44.8%) | 7,634 (55.2%) |
| Cleaning & Maintenance | 5,537 (69.1%) | 2,481 (30.9%) |
| Personal Care & Service | 1,936 (23.9%) | 6,172 (76.1%) |
| Total (Category) | 21,036 (44.4%) | 26,347 (55.6%) |
| Total (Overall) | 140,404 (51.1%) | 134,232 (48.9%) |
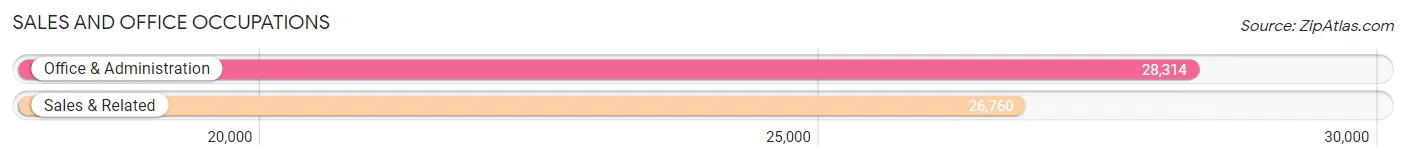
Sales and Office Occupations
The most common Sales and Office occupations in Plymouth County are Office & Administration (28,314 | 10.3%), and Sales & Related (26,760 | 9.7%).
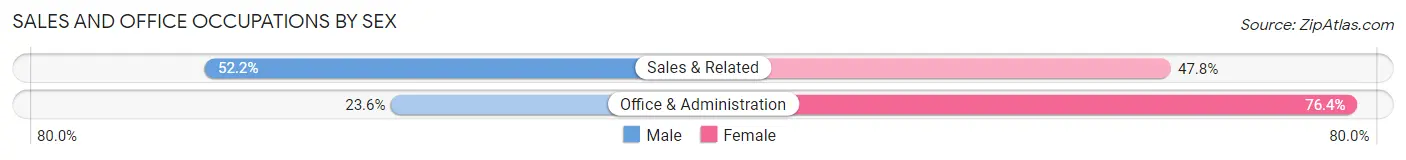
Sales and Office Occupations by Sex
| Occupation | Male | Female |
| Sales & Related | 13,976 (52.2%) | 12,784 (47.8%) |
| Office & Administration | 6,677 (23.6%) | 21,637 (76.4%) |
| Total (Category) | 20,653 (37.5%) | 34,421 (62.5%) |
| Total (Overall) | 140,404 (51.1%) | 134,232 (48.9%) |
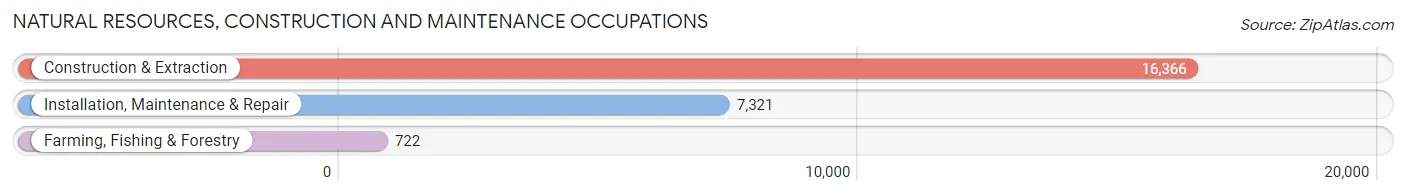
Natural Resources, Construction and Maintenance Occupations
The most common Natural Resources, Construction and Maintenance occupations in Plymouth County are Construction & Extraction (16,366 | 6.0%), Installation, Maintenance & Repair (7,321 | 2.7%), and Farming, Fishing & Forestry (722 | 0.3%).
Natural Resources, Construction and Maintenance Occupations by Sex
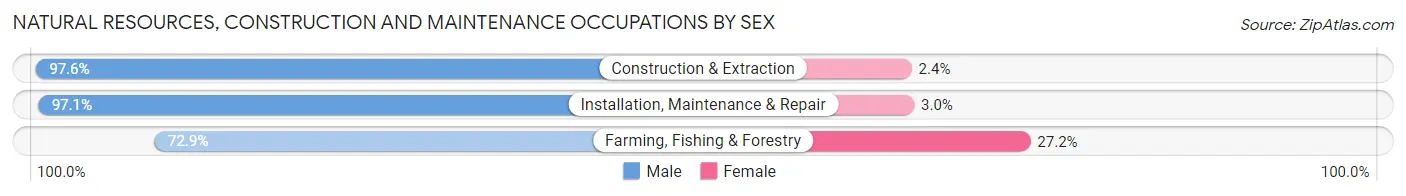
| Occupation | Male | Female |
| Farming, Fishing & Forestry | 526 (72.9%) | 196 (27.2%) |
| Construction & Extraction | 15,966 (97.6%) | 400 (2.4%) |
| Installation, Maintenance & Repair | 7,105 (97.1%) | 216 (2.9%) |
| Total (Category) | 23,597 (96.7%) | 812 (3.3%) |
| Total (Overall) | 140,404 (51.1%) | 134,232 (48.9%) |
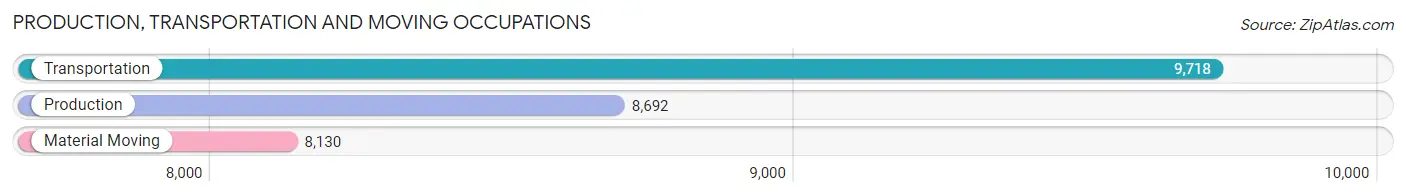
Production, Transportation and Moving Occupations
The most common Production, Transportation and Moving occupations in Plymouth County are Transportation (9,718 | 3.5%), Production (8,692 | 3.2%), and Material Moving (8,130 | 3.0%).
Production, Transportation and Moving Occupations by Sex

| Occupation | Male | Female |
| Production | 6,050 (69.6%) | 2,642 (30.4%) |
| Transportation | 8,491 (87.4%) | 1,227 (12.6%) |
| Material Moving | 6,036 (74.2%) | 2,094 (25.8%) |
| Total (Category) | 20,577 (77.5%) | 5,963 (22.5%) |
| Total (Overall) | 140,404 (51.1%) | 134,232 (48.9%) |
Employment Industries by Sex in Plymouth County
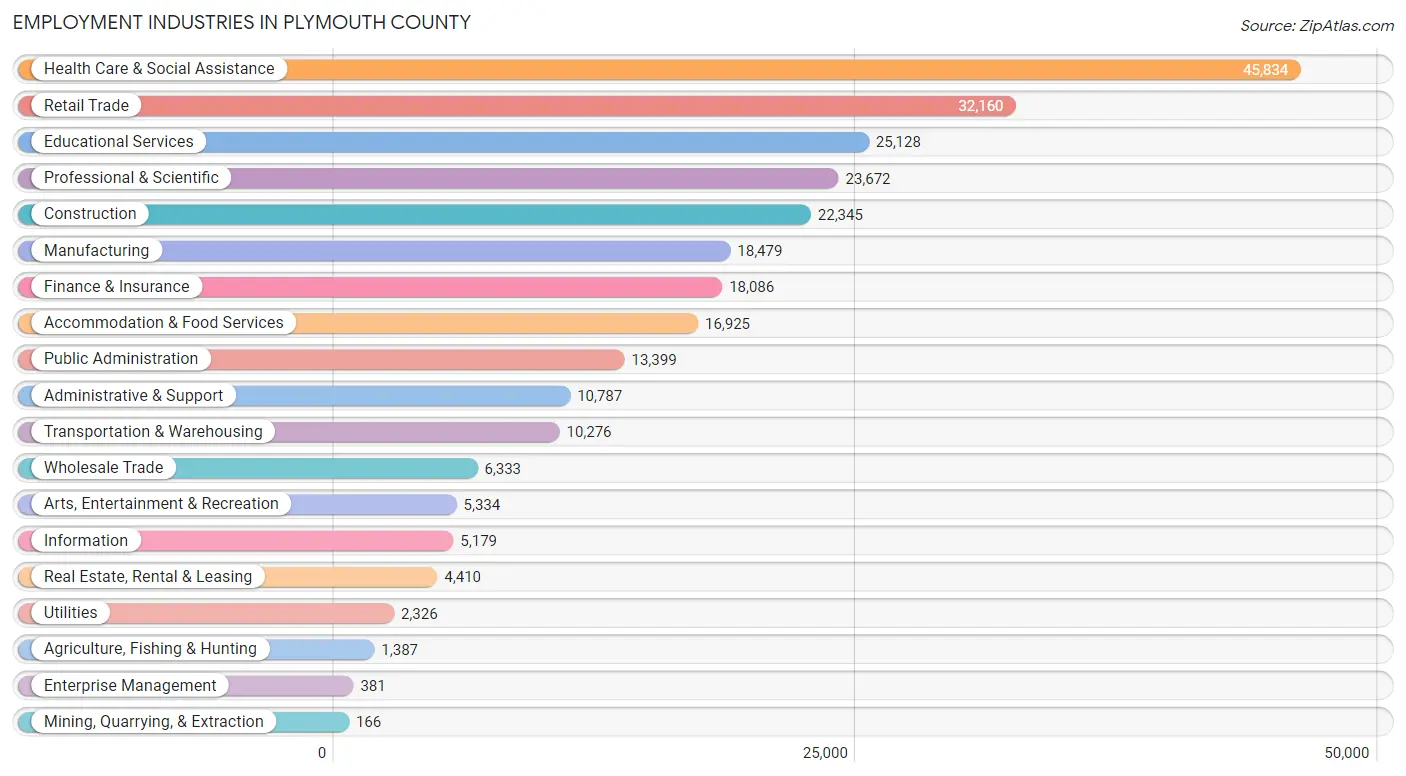
Employment Industries in Plymouth County
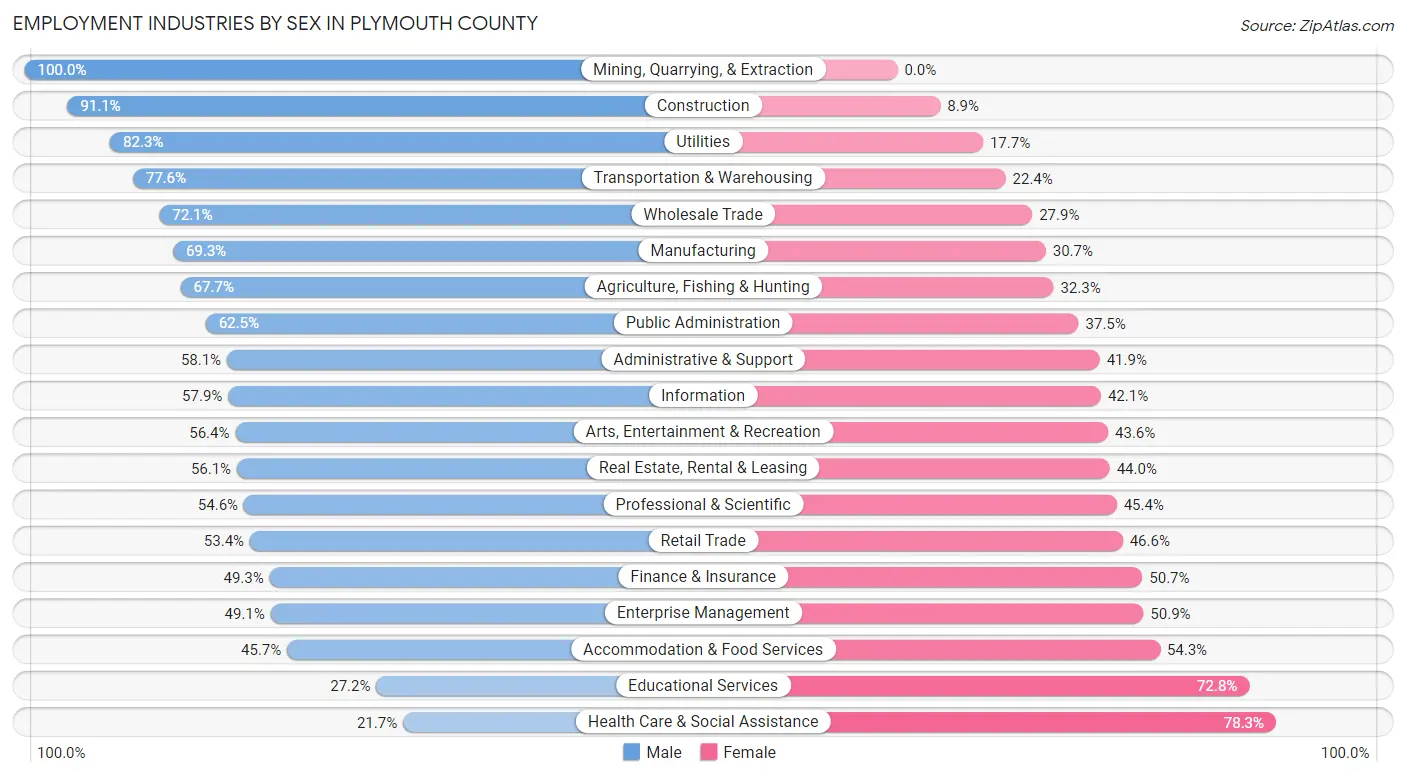
The major employment industries in Plymouth County include Health Care & Social Assistance (45,834 | 16.7%), Retail Trade (32,160 | 11.7%), Educational Services (25,128 | 9.1%), Professional & Scientific (23,672 | 8.6%), and Construction (22,345 | 8.1%).
Employment Industries by Sex in Plymouth County
The Plymouth County industries that see more men than women are Mining, Quarrying, & Extraction (100.0%), Construction (91.1%), and Utilities (82.3%), whereas the industries that tend to have a higher number of women are Health Care & Social Assistance (78.3%), Educational Services (72.8%), and Accommodation & Food Services (54.3%).
| Industry | Male | Female |
| Agriculture, Fishing & Hunting | 939 (67.7%) | 448 (32.3%) |
| Mining, Quarrying, & Extraction | 166 (100.0%) | 0 (0.0%) |
| Construction | 20,364 (91.1%) | 1,981 (8.9%) |
| Manufacturing | 12,804 (69.3%) | 5,675 (30.7%) |
| Wholesale Trade | 4,566 (72.1%) | 1,767 (27.9%) |
| Retail Trade | 17,160 (53.4%) | 15,000 (46.6%) |
| Transportation & Warehousing | 7,974 (77.6%) | 2,302 (22.4%) |
| Utilities | 1,914 (82.3%) | 412 (17.7%) |
| Information | 2,997 (57.9%) | 2,182 (42.1%) |
| Finance & Insurance | 8,917 (49.3%) | 9,169 (50.7%) |
| Real Estate, Rental & Leasing | 2,472 (56.0%) | 1,938 (44.0%) |
| Professional & Scientific | 12,927 (54.6%) | 10,745 (45.4%) |
| Enterprise Management | 187 (49.1%) | 194 (50.9%) |
| Administrative & Support | 6,269 (58.1%) | 4,518 (41.9%) |
| Educational Services | 6,834 (27.2%) | 18,294 (72.8%) |
| Health Care & Social Assistance | 9,937 (21.7%) | 35,897 (78.3%) |
| Arts, Entertainment & Recreation | 3,008 (56.4%) | 2,326 (43.6%) |
| Accommodation & Food Services | 7,728 (45.7%) | 9,197 (54.3%) |
| Public Administration | 8,374 (62.5%) | 5,025 (37.5%) |
| Total | 140,404 (51.1%) | 134,232 (48.9%) |
Education in Plymouth County
School Enrollment in Plymouth County
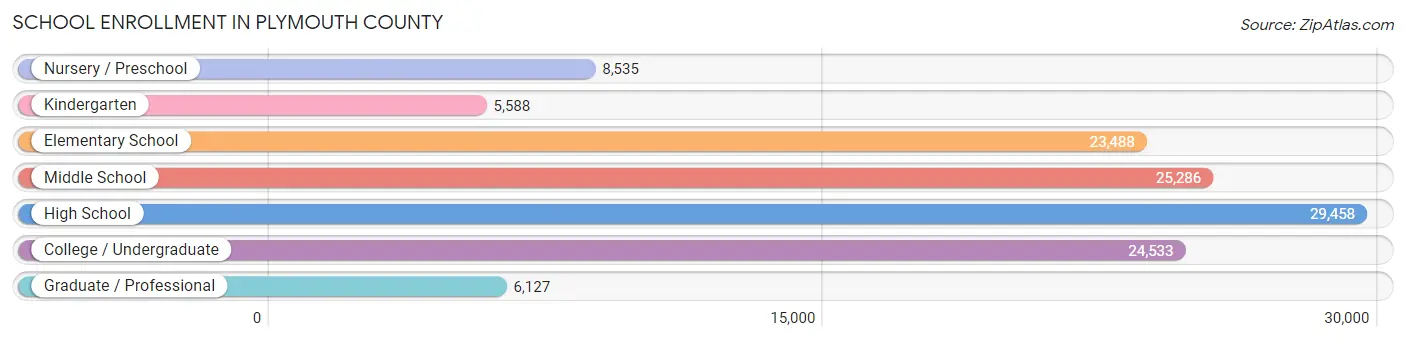
The most common levels of schooling among the 123,015 students in Plymouth County are high school (29,458 | 23.9%), middle school (25,286 | 20.6%), and college / undergraduate (24,533 | 19.9%).
| School Level | # Students | % Students |
| Nursery / Preschool | 8,535 | 6.9% |
| Kindergarten | 5,588 | 4.5% |
| Elementary School | 23,488 | 19.1% |
| Middle School | 25,286 | 20.6% |
| High School | 29,458 | 23.9% |
| College / Undergraduate | 24,533 | 19.9% |
| Graduate / Professional | 6,127 | 5.0% |
| Total | 123,015 | 100.0% |
School Enrollment by Age by Funding Source in Plymouth County
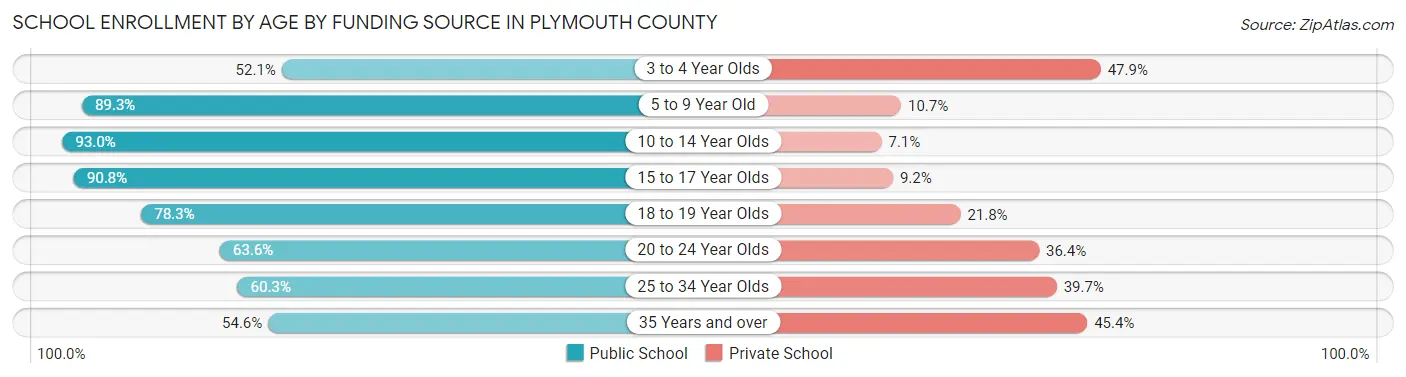
Out of a total of 123,015 students who are enrolled in schools in Plymouth County, 22,635 (18.4%) attend a private institution, while the remaining 100,380 (81.6%) are enrolled in public schools. The age group of 3 to 4 year olds has the highest likelihood of being enrolled in private schools, with 3,155 (47.9% in the age bracket) enrolled. Conversely, the age group of 10 to 14 year olds has the lowest likelihood of being enrolled in a private school, with 29,201 (92.9% in the age bracket) attending a public institution.
| Age Bracket | Public School | Private School |
| 3 to 4 Year Olds | 3,435 (52.1%) | 3,155 (47.9%) |
| 5 to 9 Year Old | 25,024 (89.3%) | 2,996 (10.7%) |
| 10 to 14 Year Olds | 29,201 (92.9%) | 2,215 (7.0%) |
| 15 to 17 Year Olds | 18,992 (90.8%) | 1,920 (9.2%) |
| 18 to 19 Year Olds | 8,268 (78.2%) | 2,298 (21.7%) |
| 20 to 24 Year Olds | 8,590 (63.6%) | 4,915 (36.4%) |
| 25 to 34 Year Olds | 3,569 (60.3%) | 2,348 (39.7%) |
| 35 Years and over | 3,327 (54.6%) | 2,762 (45.4%) |
| Total | 100,380 (81.6%) | 22,635 (18.4%) |
Educational Attainment by Field of Study in Plymouth County
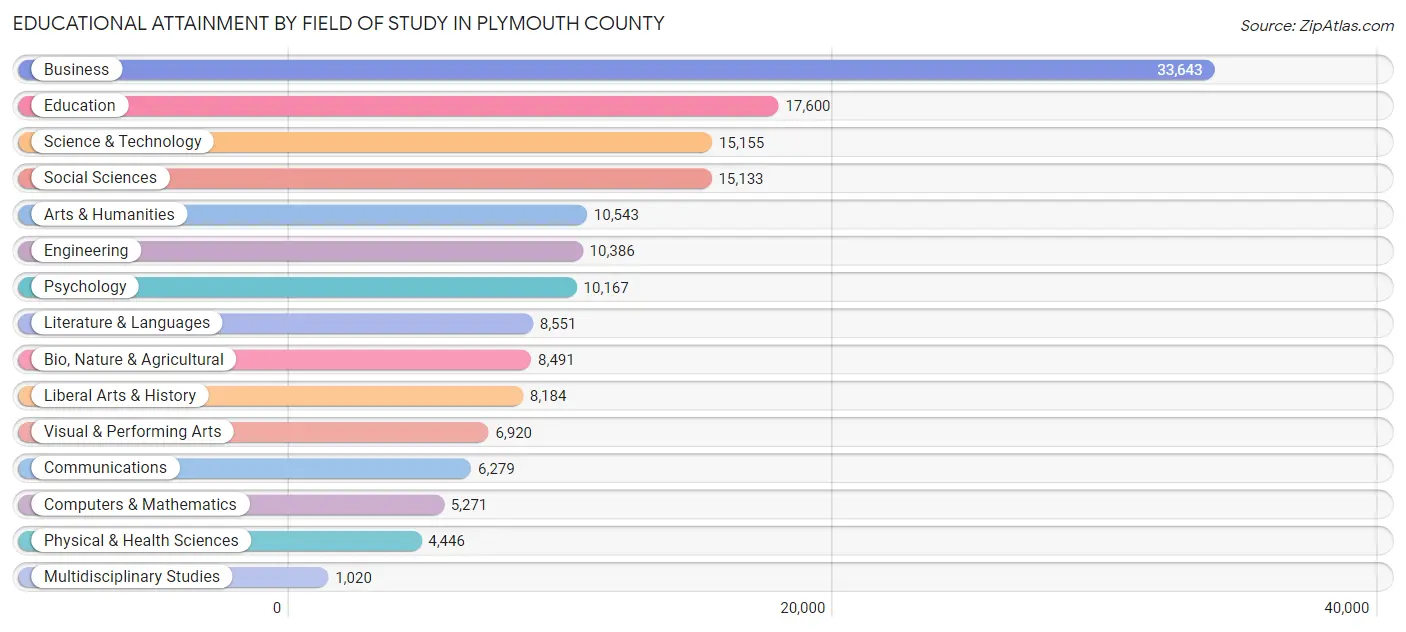
Business (33,643 | 20.8%), education (17,600 | 10.9%), science & technology (15,155 | 9.4%), social sciences (15,133 | 9.3%), and arts & humanities (10,543 | 6.5%) are the most common fields of study among 161,789 individuals in Plymouth County who have obtained a bachelor's degree or higher.
| Field of Study | # Graduates | % Graduates |
| Computers & Mathematics | 5,271 | 3.3% |
| Bio, Nature & Agricultural | 8,491 | 5.2% |
| Physical & Health Sciences | 4,446 | 2.8% |
| Psychology | 10,167 | 6.3% |
| Social Sciences | 15,133 | 9.3% |
| Engineering | 10,386 | 6.4% |
| Multidisciplinary Studies | 1,020 | 0.6% |
| Science & Technology | 15,155 | 9.4% |
| Business | 33,643 | 20.8% |
| Education | 17,600 | 10.9% |
| Literature & Languages | 8,551 | 5.3% |
| Liberal Arts & History | 8,184 | 5.1% |
| Visual & Performing Arts | 6,920 | 4.3% |
| Communications | 6,279 | 3.9% |
| Arts & Humanities | 10,543 | 6.5% |
| Total | 161,789 | 100.0% |
Transportation & Commute in Plymouth County
Vehicle Availability by Sex in Plymouth County
The most prevalent vehicle ownership categories in Plymouth County are males with 2 vehicles (62,859, accounting for 45.8%) and females with 2 vehicles (55,580, making up 48.4%).
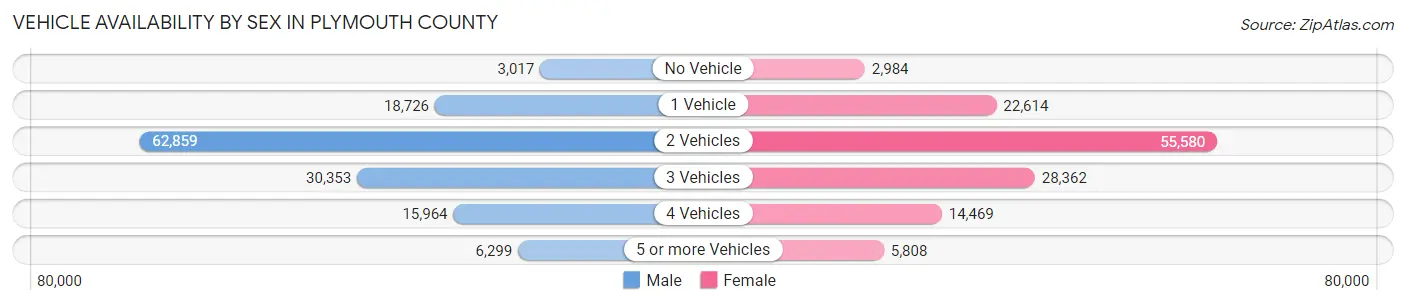
| Vehicles Available | Male | Female |
| No Vehicle | 3,017 (2.2%) | 2,984 (2.3%) |
| 1 Vehicle | 18,726 (13.7%) | 22,614 (17.4%) |
| 2 Vehicles | 62,859 (45.8%) | 55,580 (42.8%) |
| 3 Vehicles | 30,353 (22.1%) | 28,362 (21.8%) |
| 4 Vehicles | 15,964 (11.6%) | 14,469 (11.2%) |
| 5 or more Vehicles | 6,299 (4.6%) | 5,808 (4.5%) |
| Total | 137,218 (100.0%) | 129,817 (100.0%) |
Commute Time in Plymouth County
The most frequently occuring commute durations in Plymouth County are 30 to 34 minutes (29,795 commuters, 12.7%), 60 to 89 minutes (29,039 commuters, 12.4%), and 20 to 24 minutes (27,098 commuters, 11.6%).
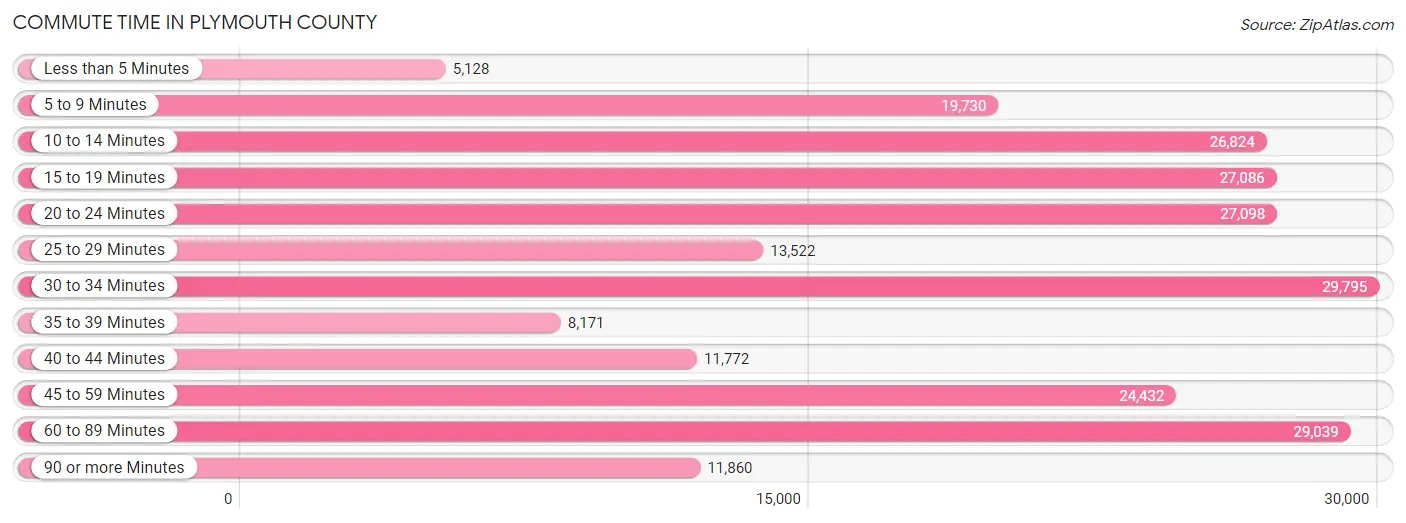
| Commute Time | # Commuters | % Commuters |
| Less than 5 Minutes | 5,128 | 2.2% |
| 5 to 9 Minutes | 19,730 | 8.4% |
| 10 to 14 Minutes | 26,824 | 11.4% |
| 15 to 19 Minutes | 27,086 | 11.6% |
| 20 to 24 Minutes | 27,098 | 11.6% |
| 25 to 29 Minutes | 13,522 | 5.8% |
| 30 to 34 Minutes | 29,795 | 12.7% |
| 35 to 39 Minutes | 8,171 | 3.5% |
| 40 to 44 Minutes | 11,772 | 5.0% |
| 45 to 59 Minutes | 24,432 | 10.4% |
| 60 to 89 Minutes | 29,039 | 12.4% |
| 90 or more Minutes | 11,860 | 5.1% |
Commute Time by Sex in Plymouth County
The most common commute times in Plymouth County are 60 to 89 minutes (17,645 commuters, 14.6%) for males and 10 to 14 minutes (14,829 commuters, 13.1%) for females.
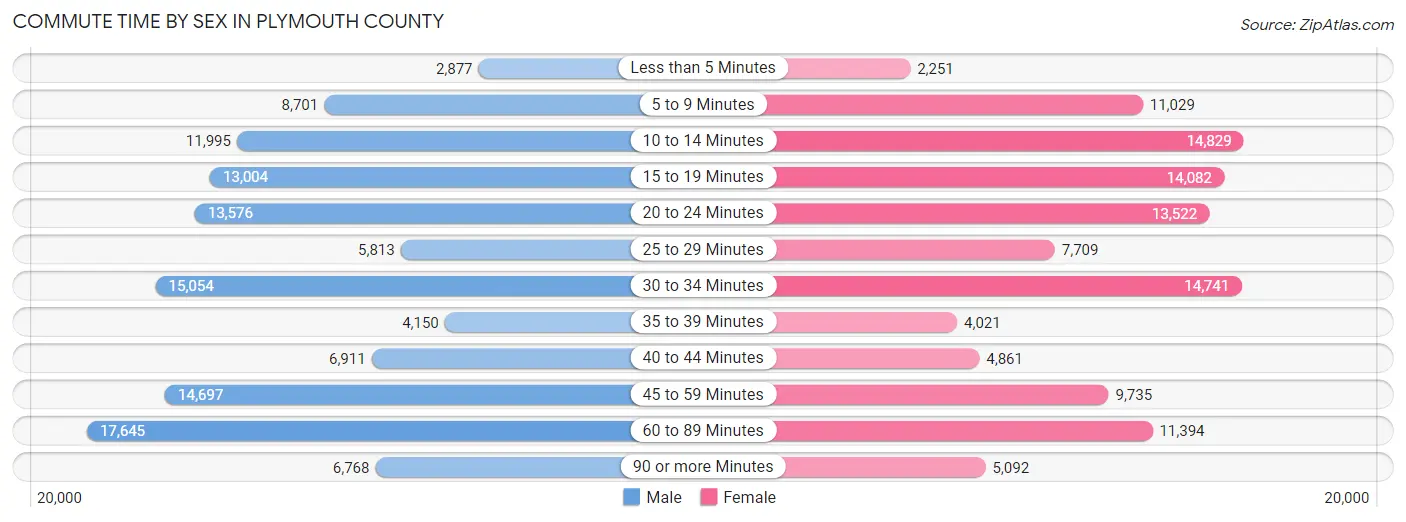
| Commute Time | Male | Female |
| Less than 5 Minutes | 2,877 (2.4%) | 2,251 (2.0%) |
| 5 to 9 Minutes | 8,701 (7.2%) | 11,029 (9.7%) |
| 10 to 14 Minutes | 11,995 (9.9%) | 14,829 (13.1%) |
| 15 to 19 Minutes | 13,004 (10.7%) | 14,082 (12.4%) |
| 20 to 24 Minutes | 13,576 (11.2%) | 13,522 (11.9%) |
| 25 to 29 Minutes | 5,813 (4.8%) | 7,709 (6.8%) |
| 30 to 34 Minutes | 15,054 (12.4%) | 14,741 (13.0%) |
| 35 to 39 Minutes | 4,150 (3.4%) | 4,021 (3.5%) |
| 40 to 44 Minutes | 6,911 (5.7%) | 4,861 (4.3%) |
| 45 to 59 Minutes | 14,697 (12.1%) | 9,735 (8.6%) |
| 60 to 89 Minutes | 17,645 (14.6%) | 11,394 (10.1%) |
| 90 or more Minutes | 6,768 (5.6%) | 5,092 (4.5%) |
Time of Departure to Work by Sex in Plymouth County
The most frequent times of departure to work in Plymouth County are 7:00 AM to 7:29 AM (17,124, 14.1%) for males and 7:00 AM to 7:29 AM (17,564, 15.5%) for females.
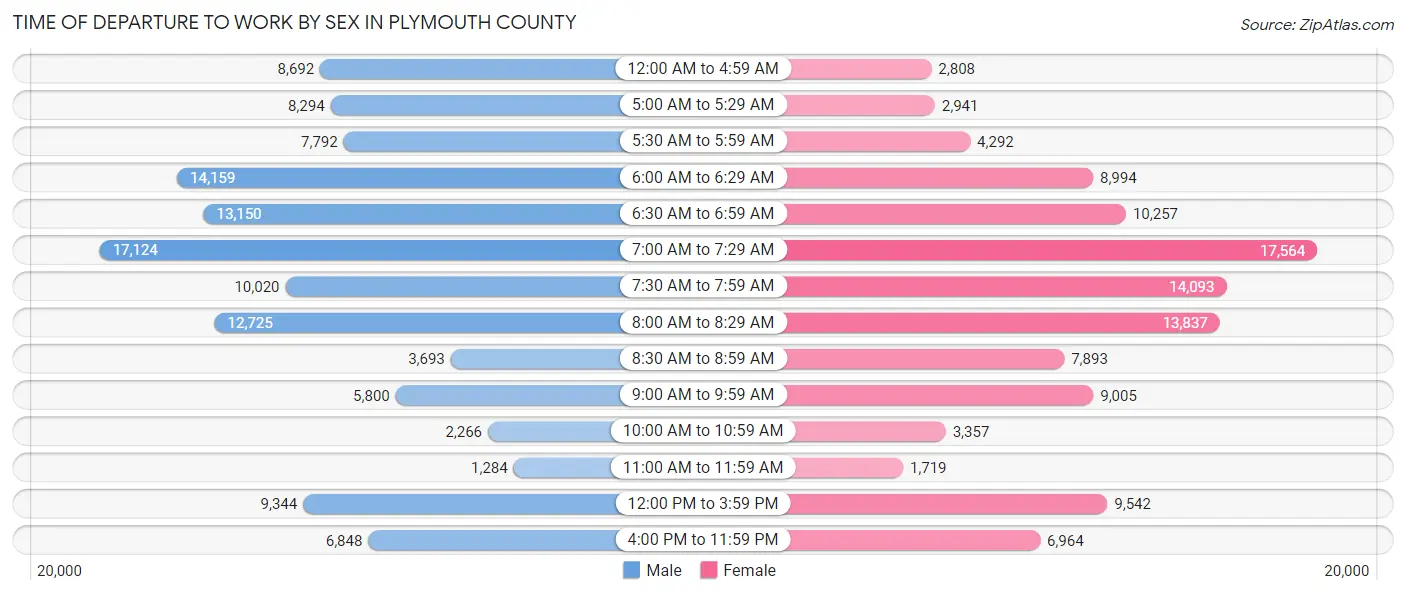
| Time of Departure | Male | Female |
| 12:00 AM to 4:59 AM | 8,692 (7.2%) | 2,808 (2.5%) |
| 5:00 AM to 5:29 AM | 8,294 (6.8%) | 2,941 (2.6%) |
| 5:30 AM to 5:59 AM | 7,792 (6.4%) | 4,292 (3.8%) |
| 6:00 AM to 6:29 AM | 14,159 (11.7%) | 8,994 (7.9%) |
| 6:30 AM to 6:59 AM | 13,150 (10.8%) | 10,257 (9.1%) |
| 7:00 AM to 7:29 AM | 17,124 (14.1%) | 17,564 (15.5%) |
| 7:30 AM to 7:59 AM | 10,020 (8.3%) | 14,093 (12.4%) |
| 8:00 AM to 8:29 AM | 12,725 (10.5%) | 13,837 (12.2%) |
| 8:30 AM to 8:59 AM | 3,693 (3.0%) | 7,893 (7.0%) |
| 9:00 AM to 9:59 AM | 5,800 (4.8%) | 9,005 (8.0%) |
| 10:00 AM to 10:59 AM | 2,266 (1.9%) | 3,357 (3.0%) |
| 11:00 AM to 11:59 AM | 1,284 (1.1%) | 1,719 (1.5%) |
| 12:00 PM to 3:59 PM | 9,344 (7.7%) | 9,542 (8.4%) |
| 4:00 PM to 11:59 PM | 6,848 (5.7%) | 6,964 (6.1%) |
| Total | 121,191 (100.0%) | 113,266 (100.0%) |
Housing Occupancy in Plymouth County
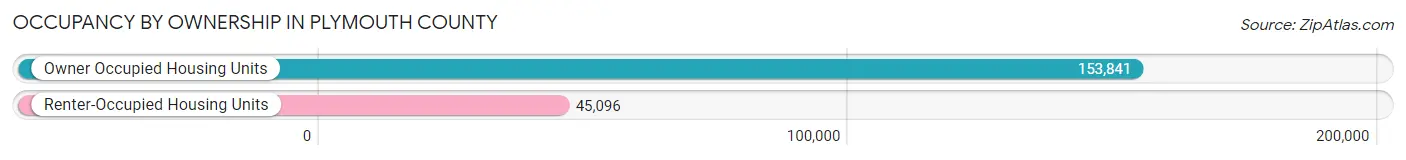
Occupancy by Ownership in Plymouth County
Of the total 198,937 dwellings in Plymouth County, owner-occupied units account for 153,841 (77.3%), while renter-occupied units make up 45,096 (22.7%).
| Occupancy | # Housing Units | % Housing Units |
| Owner Occupied Housing Units | 153,841 | 77.3% |
| Renter-Occupied Housing Units | 45,096 | 22.7% |
| Total Occupied Housing Units | 198,937 | 100.0% |
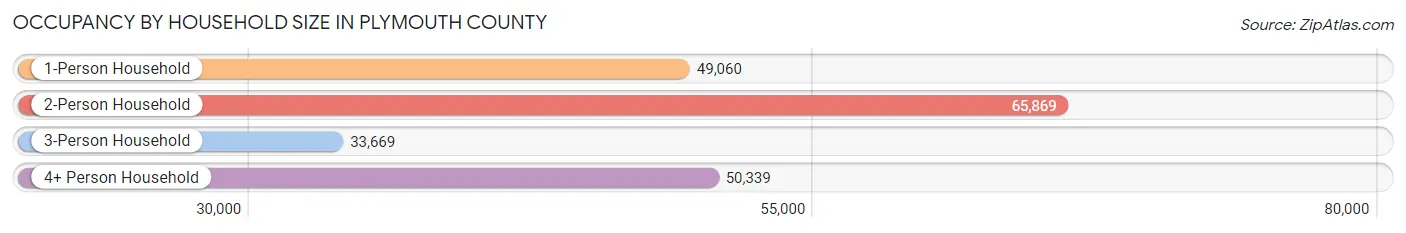
Occupancy by Household Size in Plymouth County
| Household Size | # Housing Units | % Housing Units |
| 1-Person Household | 49,060 | 24.7% |
| 2-Person Household | 65,869 | 33.1% |
| 3-Person Household | 33,669 | 16.9% |
| 4+ Person Household | 50,339 | 25.3% |
| Total Housing Units | 198,937 | 100.0% |
Occupancy by Ownership by Household Size in Plymouth County
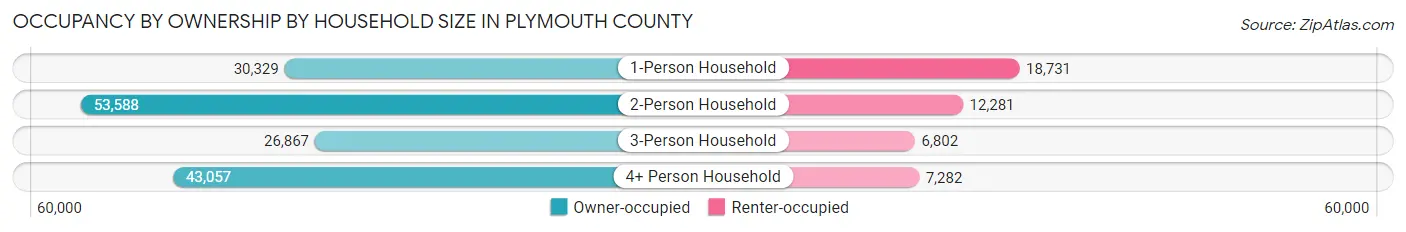
| Household Size | Owner-occupied | Renter-occupied |
| 1-Person Household | 30,329 (61.8%) | 18,731 (38.2%) |
| 2-Person Household | 53,588 (81.4%) | 12,281 (18.6%) |
| 3-Person Household | 26,867 (79.8%) | 6,802 (20.2%) |
| 4+ Person Household | 43,057 (85.5%) | 7,282 (14.5%) |
| Total Housing Units | 153,841 (77.3%) | 45,096 (22.7%) |
Occupancy by Educational Attainment in Plymouth County
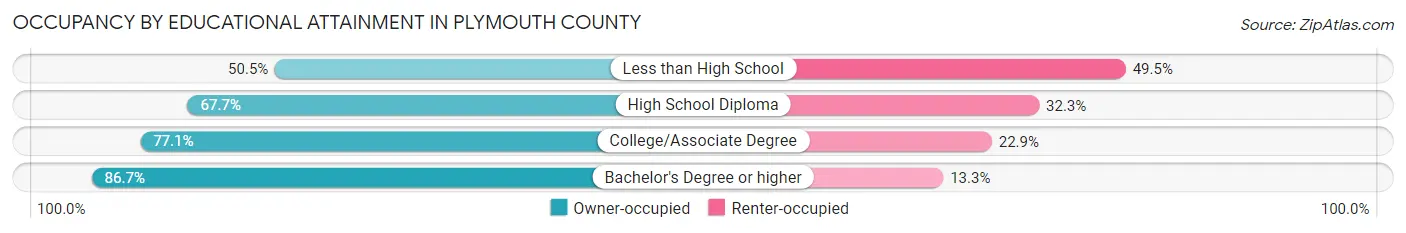
| Household Size | Owner-occupied | Renter-occupied |
| Less than High School | 6,214 (50.5%) | 6,086 (49.5%) |
| High School Diploma | 31,310 (67.7%) | 14,943 (32.3%) |
| College/Associate Degree | 43,228 (77.1%) | 12,859 (22.9%) |
| Bachelor's Degree or higher | 73,089 (86.7%) | 11,208 (13.3%) |
Occupancy by Age of Householder in Plymouth County
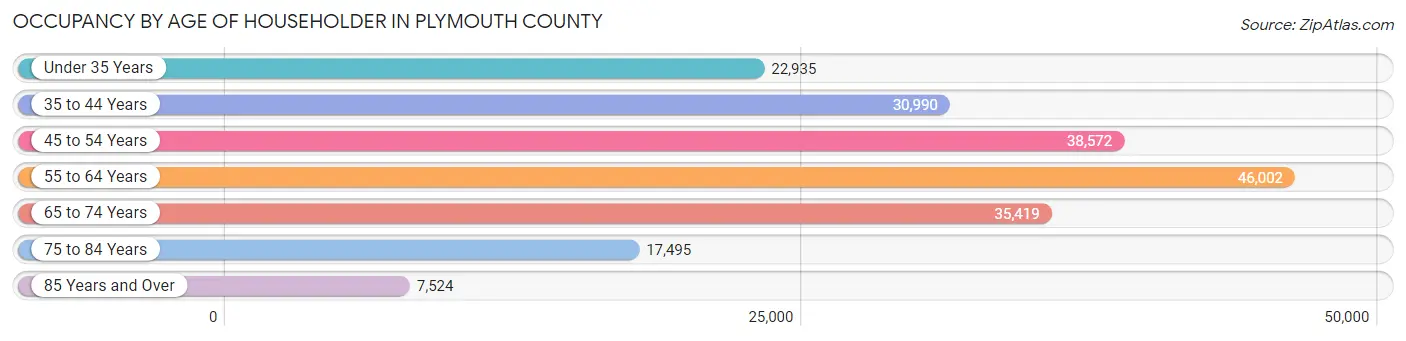
| Age Bracket | # Households | % Households |
| Under 35 Years | 22,935 | 11.5% |
| 35 to 44 Years | 30,990 | 15.6% |
| 45 to 54 Years | 38,572 | 19.4% |
| 55 to 64 Years | 46,002 | 23.1% |
| 65 to 74 Years | 35,419 | 17.8% |
| 75 to 84 Years | 17,495 | 8.8% |
| 85 Years and Over | 7,524 | 3.8% |
| Total | 198,937 | 100.0% |
Housing Finances in Plymouth County
Median Income by Occupancy in Plymouth County
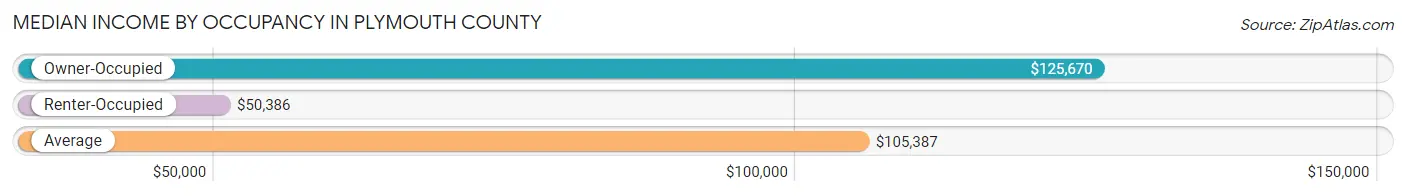
| Occupancy Type | # Households | Median Income |
| Owner-Occupied | 153,841 (77.3%) | $125,670 |
| Renter-Occupied | 45,096 (22.7%) | $50,386 |
| Average | 198,937 (100.0%) | $105,387 |
Occupancy by Householder Income Bracket in Plymouth County
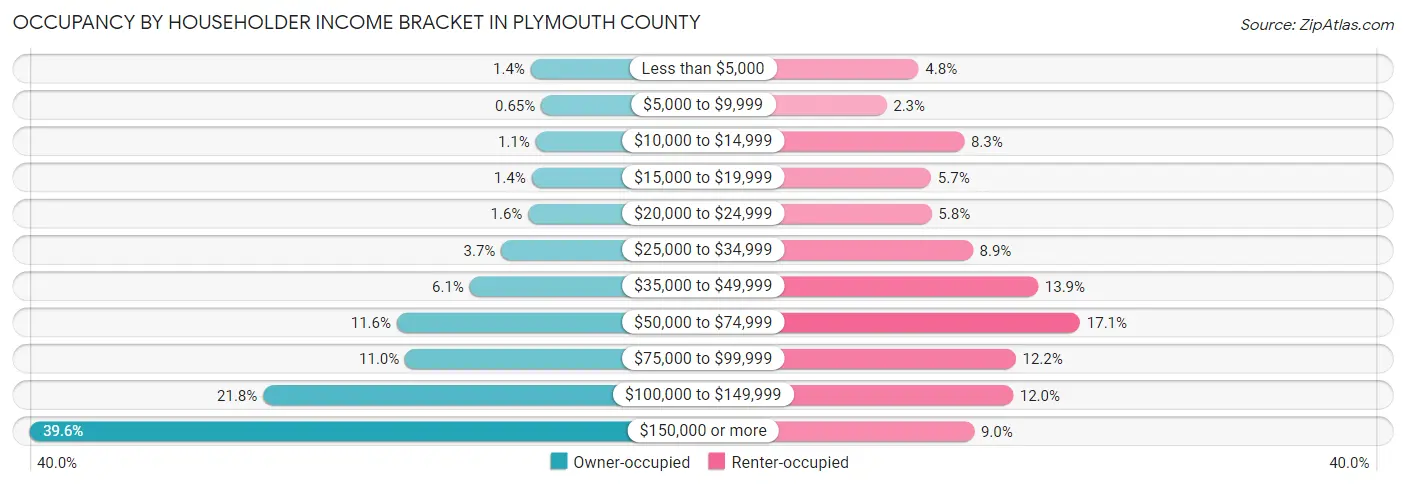
| Income Bracket | Owner-occupied | Renter-occupied |
| Less than $5,000 | 2,215 (1.4%) | 2,159 (4.8%) |
| $5,000 to $9,999 | 994 (0.6%) | 1,055 (2.3%) |
| $10,000 to $14,999 | 1,640 (1.1%) | 3,724 (8.3%) |
| $15,000 to $19,999 | 2,125 (1.4%) | 2,590 (5.7%) |
| $20,000 to $24,999 | 2,501 (1.6%) | 2,605 (5.8%) |
| $25,000 to $34,999 | 5,670 (3.7%) | 4,024 (8.9%) |
| $35,000 to $49,999 | 9,363 (6.1%) | 6,264 (13.9%) |
| $50,000 to $74,999 | 17,904 (11.6%) | 7,706 (17.1%) |
| $75,000 to $99,999 | 16,934 (11.0%) | 5,499 (12.2%) |
| $100,000 to $149,999 | 33,590 (21.8%) | 5,402 (12.0%) |
| $150,000 or more | 60,905 (39.6%) | 4,068 (9.0%) |
| Total | 153,841 (100.0%) | 45,096 (100.0%) |
Monthly Housing Cost Tiers in Plymouth County
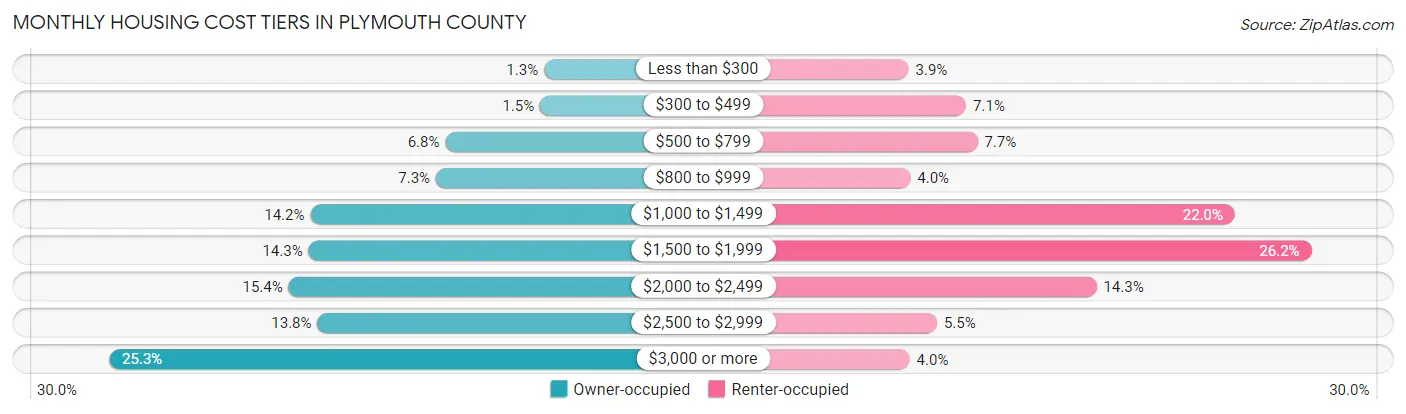
| Monthly Cost | Owner-occupied | Renter-occupied |
| Less than $300 | 2,013 (1.3%) | 1,772 (3.9%) |
| $300 to $499 | 2,352 (1.5%) | 3,207 (7.1%) |
| $500 to $799 | 10,394 (6.8%) | 3,489 (7.7%) |
| $800 to $999 | 11,203 (7.3%) | 1,816 (4.0%) |
| $1,000 to $1,499 | 21,878 (14.2%) | 9,898 (22.0%) |
| $1,500 to $1,999 | 22,026 (14.3%) | 11,806 (26.2%) |
| $2,000 to $2,499 | 23,723 (15.4%) | 6,451 (14.3%) |
| $2,500 to $2,999 | 21,273 (13.8%) | 2,482 (5.5%) |
| $3,000 or more | 38,979 (25.3%) | 1,799 (4.0%) |
| Total | 153,841 (100.0%) | 45,096 (100.0%) |
Physical Housing Characteristics in Plymouth County
Housing Structures in Plymouth County
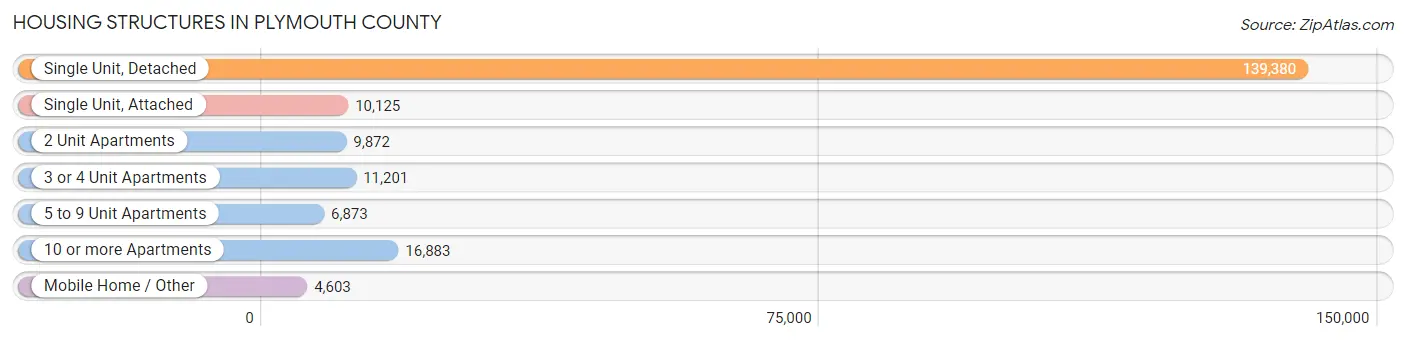
| Structure Type | # Housing Units | % Housing Units |
| Single Unit, Detached | 139,380 | 70.1% |
| Single Unit, Attached | 10,125 | 5.1% |
| 2 Unit Apartments | 9,872 | 5.0% |
| 3 or 4 Unit Apartments | 11,201 | 5.6% |
| 5 to 9 Unit Apartments | 6,873 | 3.5% |
| 10 or more Apartments | 16,883 | 8.5% |
| Mobile Home / Other | 4,603 | 2.3% |
| Total | 198,937 | 100.0% |
Housing Structures by Occupancy in Plymouth County
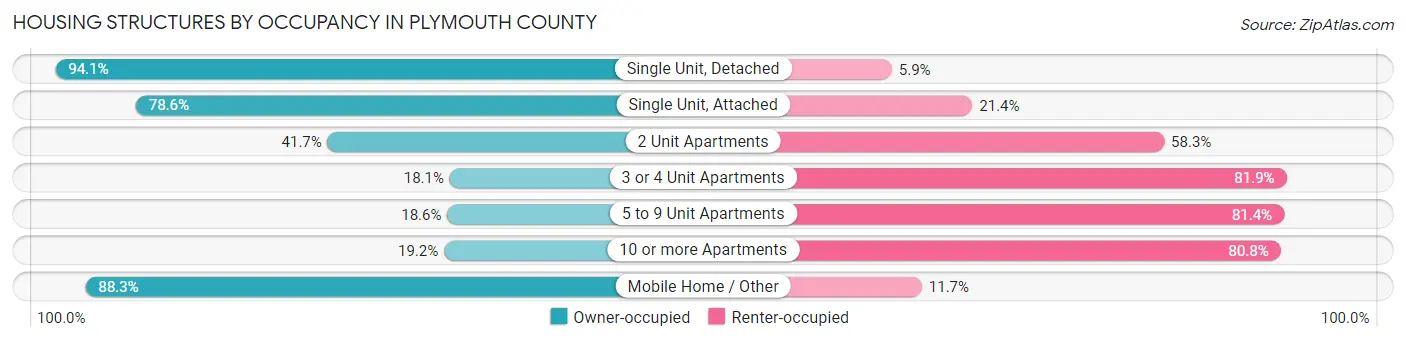
| Structure Type | Owner-occupied | Renter-occupied |
| Single Unit, Detached | 131,147 (94.1%) | 8,233 (5.9%) |
| Single Unit, Attached | 7,957 (78.6%) | 2,168 (21.4%) |
| 2 Unit Apartments | 4,113 (41.7%) | 5,759 (58.3%) |
| 3 or 4 Unit Apartments | 2,031 (18.1%) | 9,170 (81.9%) |
| 5 to 9 Unit Apartments | 1,279 (18.6%) | 5,594 (81.4%) |
| 10 or more Apartments | 3,249 (19.2%) | 13,634 (80.8%) |
| Mobile Home / Other | 4,065 (88.3%) | 538 (11.7%) |
| Total | 153,841 (77.3%) | 45,096 (22.7%) |
Housing Structures by Number of Rooms in Plymouth County
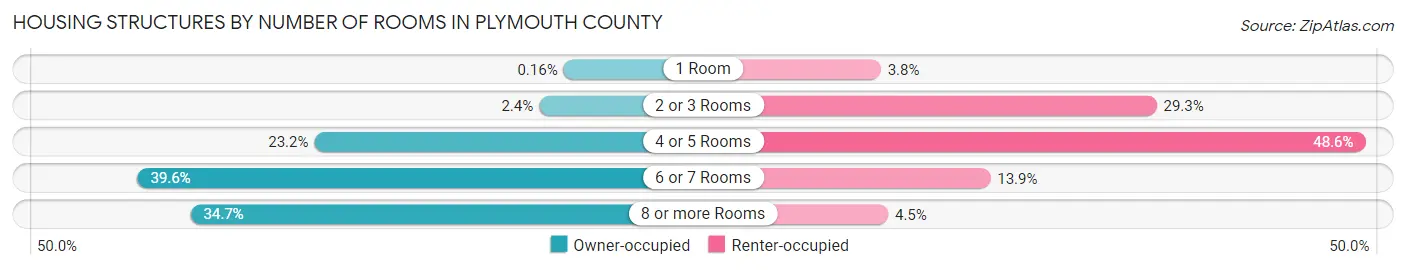
| Number of Rooms | Owner-occupied | Renter-occupied |
| 1 Room | 239 (0.2%) | 1,701 (3.8%) |
| 2 or 3 Rooms | 3,719 (2.4%) | 13,205 (29.3%) |
| 4 or 5 Rooms | 35,699 (23.2%) | 21,910 (48.6%) |
| 6 or 7 Rooms | 60,861 (39.6%) | 6,271 (13.9%) |
| 8 or more Rooms | 53,323 (34.7%) | 2,009 (4.4%) |
| Total | 153,841 (100.0%) | 45,096 (100.0%) |
Housing Structure by Heating Type in Plymouth County
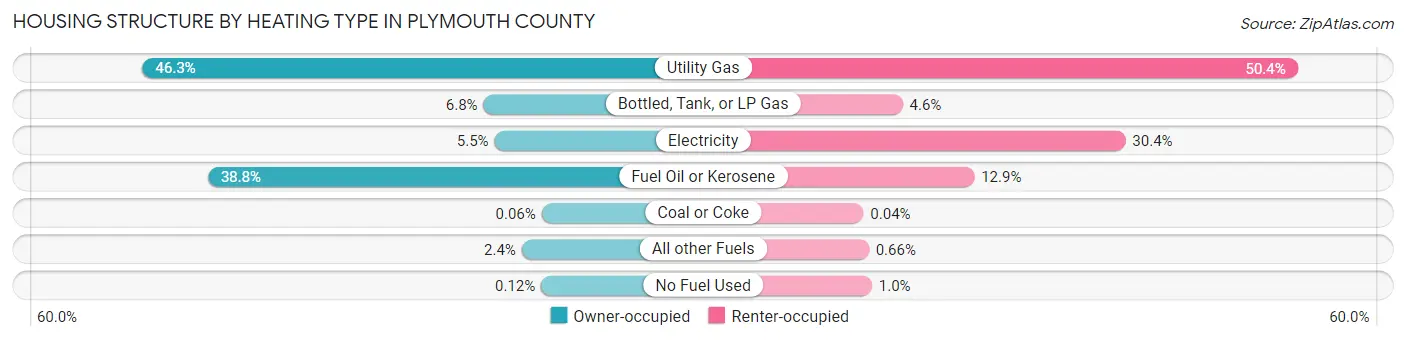
| Heating Type | Owner-occupied | Renter-occupied |
| Utility Gas | 71,295 (46.3%) | 22,716 (50.4%) |
| Bottled, Tank, or LP Gas | 10,464 (6.8%) | 2,070 (4.6%) |
| Electricity | 8,512 (5.5%) | 13,720 (30.4%) |
| Fuel Oil or Kerosene | 59,649 (38.8%) | 5,812 (12.9%) |
| Coal or Coke | 97 (0.1%) | 20 (0.0%) |
| All other Fuels | 3,642 (2.4%) | 299 (0.7%) |
| No Fuel Used | 182 (0.1%) | 459 (1.0%) |
| Total | 153,841 (100.0%) | 45,096 (100.0%) |
Household Vehicle Usage in Plymouth County
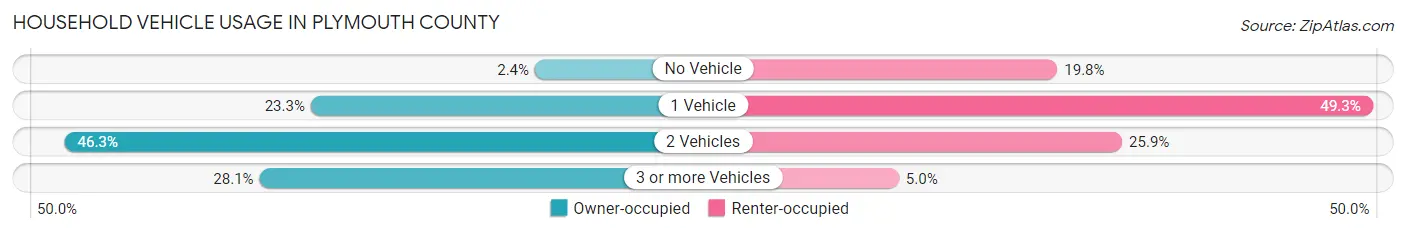
| Vehicles per Household | Owner-occupied | Renter-occupied |
| No Vehicle | 3,642 (2.4%) | 8,942 (19.8%) |
| 1 Vehicle | 35,827 (23.3%) | 22,208 (49.2%) |
| 2 Vehicles | 71,167 (46.3%) | 11,673 (25.9%) |
| 3 or more Vehicles | 43,205 (28.1%) | 2,273 (5.0%) |
| Total | 153,841 (100.0%) | 45,096 (100.0%) |
Real Estate & Mortgages in Plymouth County
Real Estate and Mortgage Overview in Plymouth County
| Characteristic | Without Mortgage | With Mortgage |
| Housing Units | 46,206 | 107,635 |
| Median Property Value | $455,400 | $483,800 |
| Median Household Income | $84,163 | $49,954 |
| Monthly Housing Costs | $990 | $38,180 |
| Real Estate Taxes | $6,176 | $1,901 |
Property Value by Mortgage Status in Plymouth County
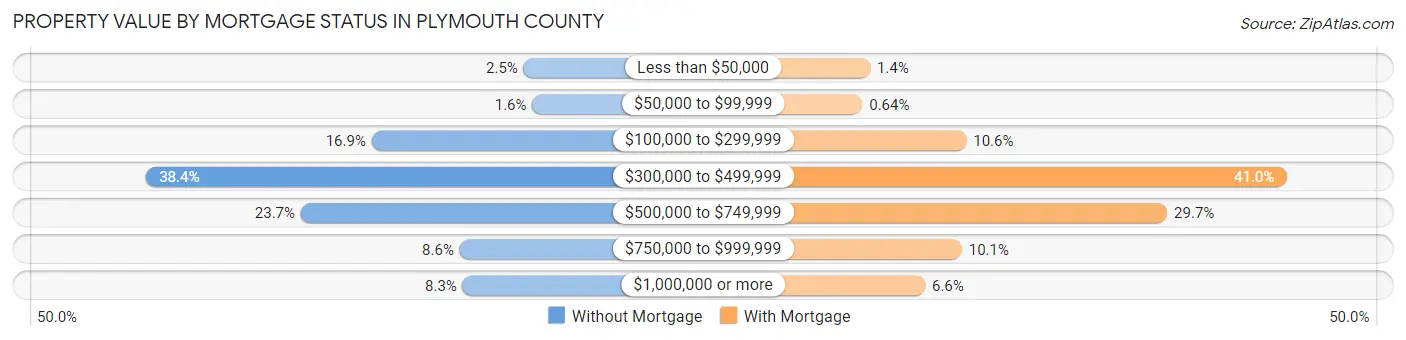
| Property Value | Without Mortgage | With Mortgage |
| Less than $50,000 | 1,143 (2.5%) | 1,480 (1.4%) |
| $50,000 to $99,999 | 756 (1.6%) | 694 (0.6%) |
| $100,000 to $299,999 | 7,829 (16.9%) | 11,354 (10.5%) |
| $300,000 to $499,999 | 17,748 (38.4%) | 44,150 (41.0%) |
| $500,000 to $749,999 | 10,948 (23.7%) | 31,943 (29.7%) |
| $750,000 to $999,999 | 3,954 (8.6%) | 10,890 (10.1%) |
| $1,000,000 or more | 3,828 (8.3%) | 7,124 (6.6%) |
| Total | 46,206 (100.0%) | 107,635 (100.0%) |
Household Income by Mortgage Status in Plymouth County
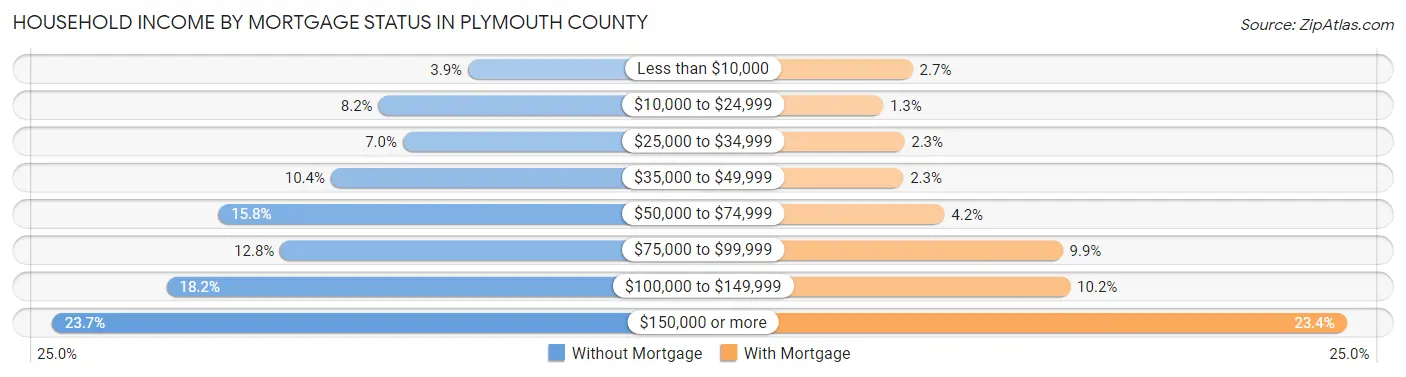
| Household Income | Without Mortgage | With Mortgage |
| Less than $10,000 | 1,797 (3.9%) | 2,928 (2.7%) |
| $10,000 to $24,999 | 3,766 (8.2%) | 1,412 (1.3%) |
| $25,000 to $34,999 | 3,229 (7.0%) | 2,500 (2.3%) |
| $35,000 to $49,999 | 4,814 (10.4%) | 2,441 (2.3%) |
| $50,000 to $74,999 | 7,290 (15.8%) | 4,549 (4.2%) |
| $75,000 to $99,999 | 5,929 (12.8%) | 10,614 (9.9%) |
| $100,000 to $149,999 | 8,430 (18.2%) | 11,005 (10.2%) |
| $150,000 or more | 10,951 (23.7%) | 25,160 (23.4%) |
| Total | 46,206 (100.0%) | 107,635 (100.0%) |
Property Value to Household Income Ratio in Plymouth County
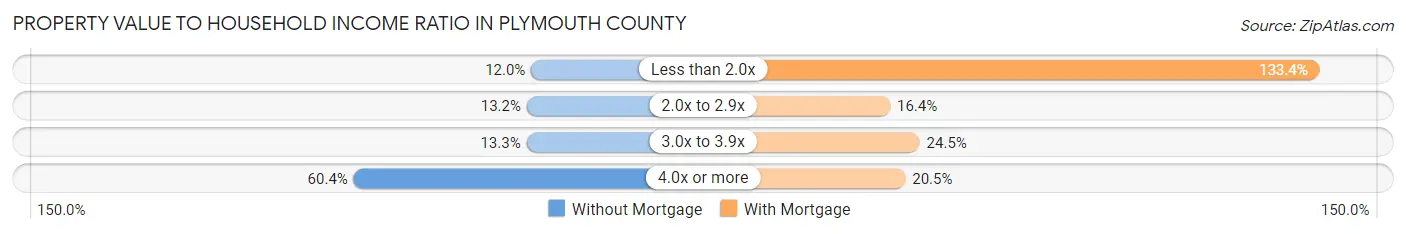
| Value-to-Income Ratio | Without Mortgage | With Mortgage |
| Less than 2.0x | 5,541 (12.0%) | 143,617 (133.4%) |
| 2.0x to 2.9x | 6,095 (13.2%) | 17,617 (16.4%) |
| 3.0x to 3.9x | 6,136 (13.3%) | 26,318 (24.4%) |
| 4.0x or more | 27,891 (60.4%) | 22,104 (20.5%) |
| Total | 46,206 (100.0%) | 107,635 (100.0%) |
Real Estate Taxes by Mortgage Status in Plymouth County
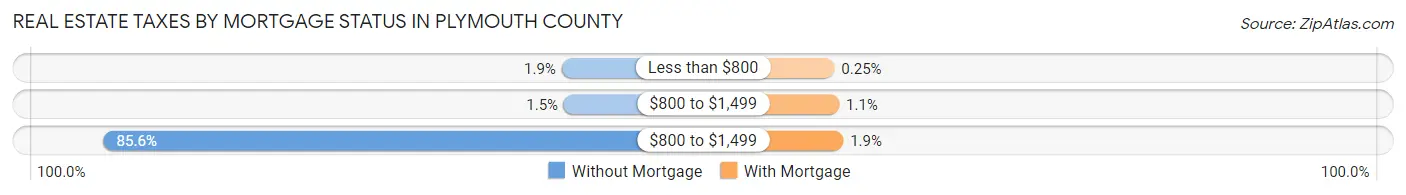
| Property Taxes | Without Mortgage | With Mortgage |
| Less than $800 | 880 (1.9%) | 265 (0.3%) |
| $800 to $1,499 | 690 (1.5%) | 1,179 (1.1%) |
| $800 to $1,499 | 39,529 (85.6%) | 2,007 (1.9%) |
| Total | 46,206 (100.0%) | 107,635 (100.0%) |
Health & Disability in Plymouth County
Health Insurance Coverage by Age in Plymouth County
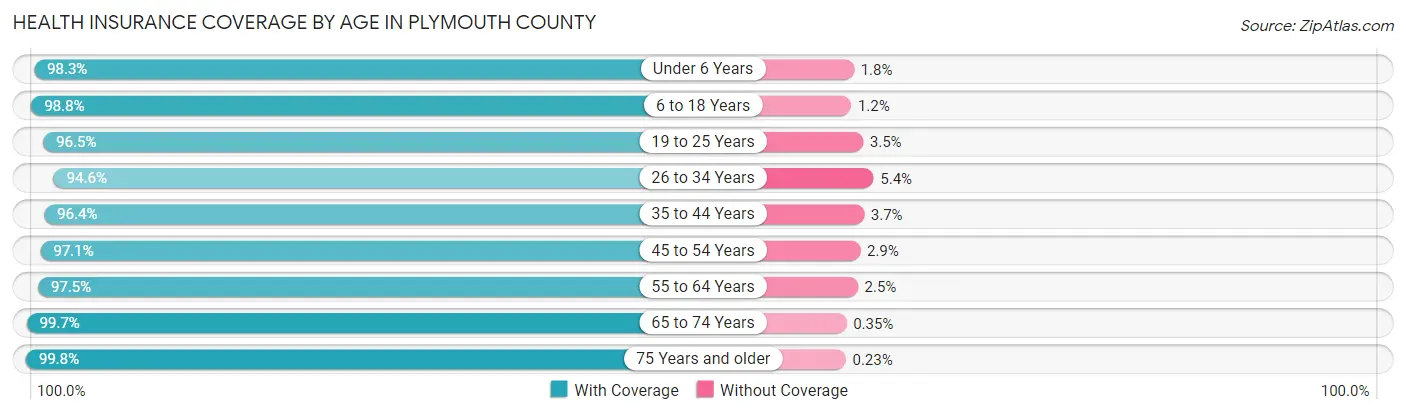
| Age Bracket | With Coverage | Without Coverage |
| Under 6 Years | 32,375 (98.3%) | 578 (1.8%) |
| 6 to 18 Years | 84,422 (98.8%) | 1,060 (1.2%) |
| 19 to 25 Years | 41,826 (96.5%) | 1,497 (3.5%) |
| 26 to 34 Years | 49,570 (94.6%) | 2,843 (5.4%) |
| 35 to 44 Years | 59,460 (96.4%) | 2,252 (3.6%) |
| 45 to 54 Years | 70,062 (97.1%) | 2,116 (2.9%) |
| 55 to 64 Years | 76,815 (97.5%) | 1,952 (2.5%) |
| 65 to 74 Years | 58,454 (99.7%) | 207 (0.4%) |
| 75 Years and older | 37,424 (99.8%) | 88 (0.2%) |
| Total | 510,408 (97.6%) | 12,593 (2.4%) |
Health Insurance Coverage by Citizenship Status in Plymouth County
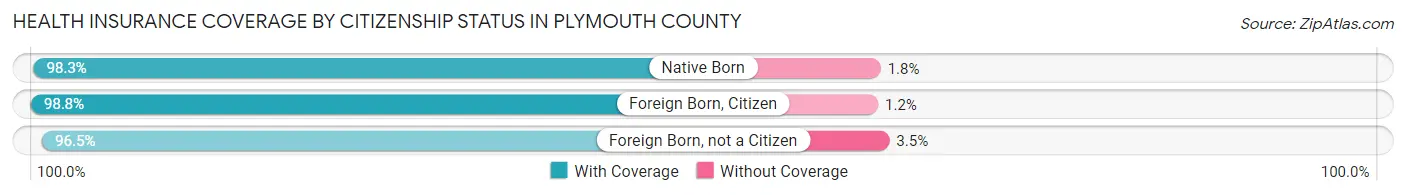
| Citizenship Status | With Coverage | Without Coverage |
| Native Born | 32,375 (98.3%) | 578 (1.8%) |
| Foreign Born, Citizen | 84,422 (98.8%) | 1,060 (1.2%) |
| Foreign Born, not a Citizen | 41,826 (96.5%) | 1,497 (3.5%) |
Health Insurance Coverage by Household Income in Plymouth County
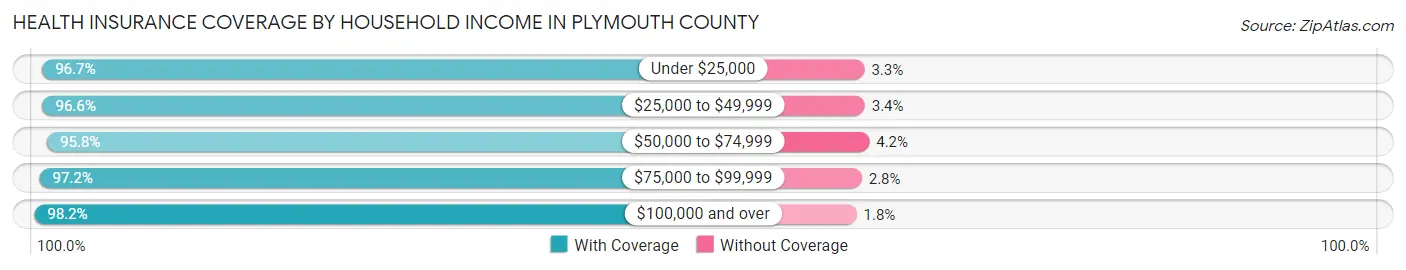
| Household Income | With Coverage | Without Coverage |
| Under $25,000 | 32,330 (96.7%) | 1,106 (3.3%) |
| $25,000 to $49,999 | 45,066 (96.6%) | 1,571 (3.4%) |
| $50,000 to $74,999 | 53,151 (95.8%) | 2,334 (4.2%) |
| $75,000 to $99,999 | 53,771 (97.2%) | 1,552 (2.8%) |
| $100,000 and over | 321,324 (98.2%) | 5,995 (1.8%) |
Public vs Private Health Insurance Coverage by Age in Plymouth County
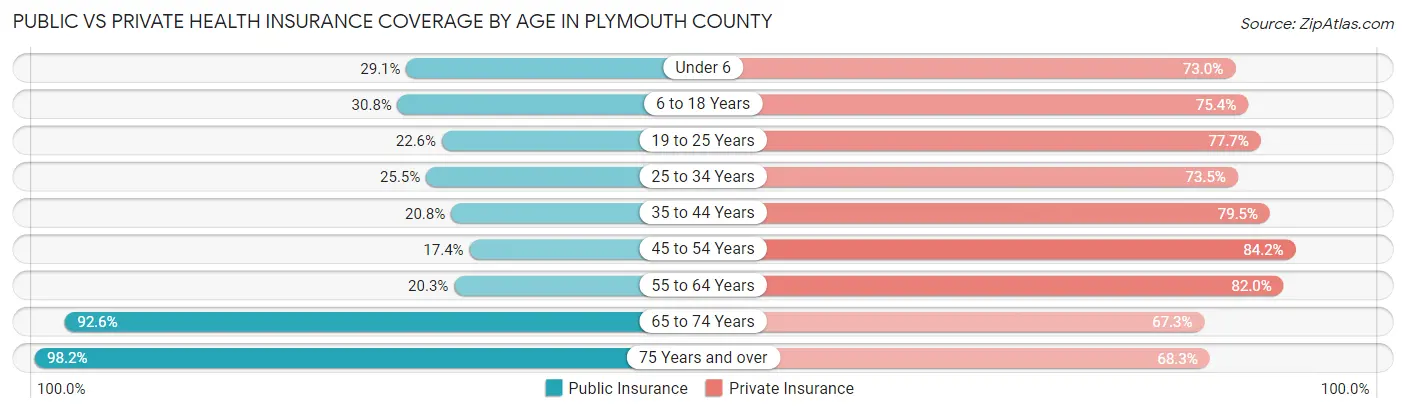
| Age Bracket | Public Insurance | Private Insurance |
| Under 6 | 9,601 (29.1%) | 24,052 (73.0%) |
| 6 to 18 Years | 26,283 (30.7%) | 64,450 (75.4%) |
| 19 to 25 Years | 9,771 (22.6%) | 33,676 (77.7%) |
| 25 to 34 Years | 13,351 (25.5%) | 38,509 (73.5%) |
| 35 to 44 Years | 12,858 (20.8%) | 49,032 (79.4%) |
| 45 to 54 Years | 12,586 (17.4%) | 60,777 (84.2%) |
| 55 to 64 Years | 15,966 (20.3%) | 64,591 (82.0%) |
| 65 to 74 Years | 54,331 (92.6%) | 39,468 (67.3%) |
| 75 Years and over | 36,845 (98.2%) | 25,601 (68.2%) |
| Total | 191,592 (36.6%) | 400,156 (76.5%) |
Disability Status by Sex by Age in Plymouth County
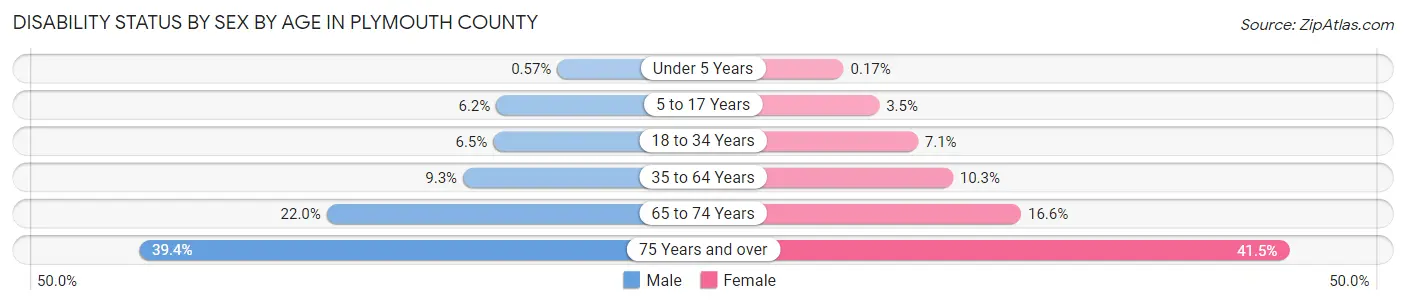
| Age Bracket | Male | Female |
| Under 5 Years | 79 (0.6%) | 23 (0.2%) |
| 5 to 17 Years | 2,696 (6.2%) | 1,407 (3.5%) |
| 18 to 34 Years | 3,360 (6.5%) | 3,653 (7.1%) |
| 35 to 64 Years | 9,672 (9.3%) | 11,219 (10.3%) |
| 65 to 74 Years | 5,970 (22.0%) | 5,239 (16.6%) |
| 75 Years and over | 6,086 (39.4%) | 9,156 (41.5%) |
Disability Class by Sex by Age in Plymouth County
Disability Class: Hearing Difficulty
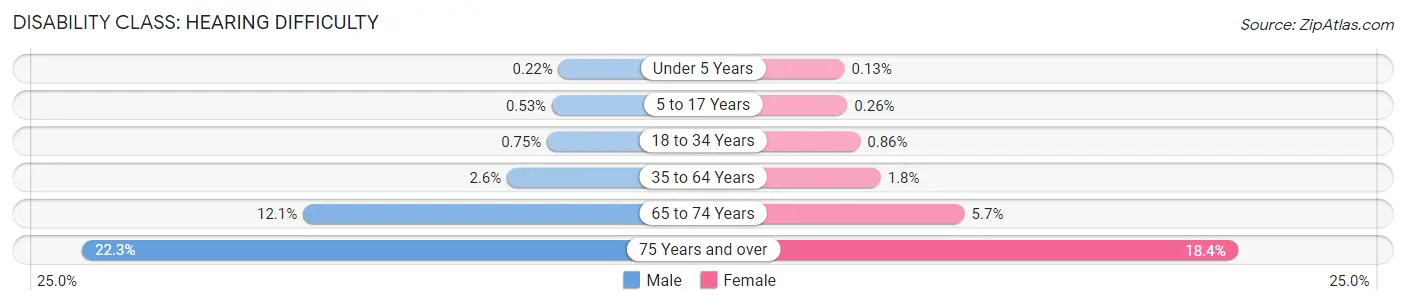
| Age Bracket | Male | Female |
| Under 5 Years | 31 (0.2%) | 17 (0.1%) |
| 5 to 17 Years | 227 (0.5%) | 105 (0.3%) |
| 18 to 34 Years | 388 (0.7%) | 446 (0.9%) |
| 35 to 64 Years | 2,711 (2.6%) | 1,969 (1.8%) |
| 65 to 74 Years | 3,282 (12.1%) | 1,796 (5.7%) |
| 75 Years and over | 3,452 (22.3%) | 4,050 (18.4%) |
Disability Class: Vision Difficulty
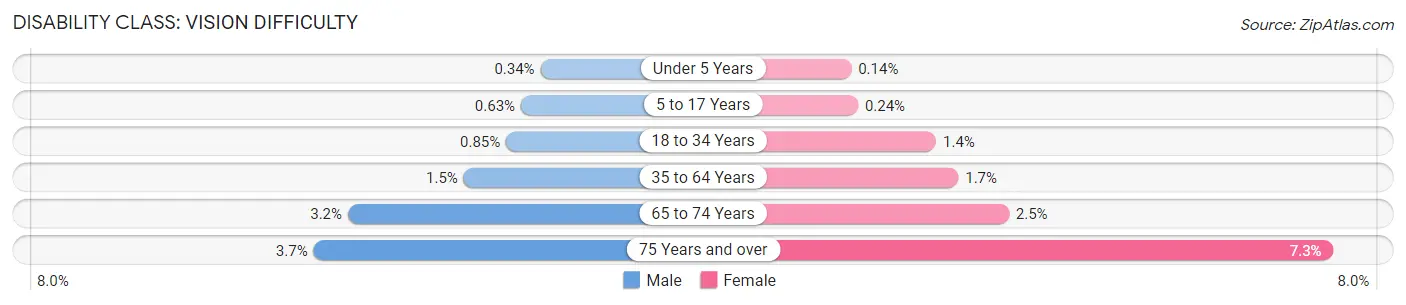
| Age Bracket | Male | Female |
| Under 5 Years | 48 (0.3%) | 18 (0.1%) |
| 5 to 17 Years | 270 (0.6%) | 99 (0.2%) |
| 18 to 34 Years | 439 (0.9%) | 724 (1.4%) |
| 35 to 64 Years | 1,531 (1.5%) | 1,888 (1.7%) |
| 65 to 74 Years | 870 (3.2%) | 780 (2.5%) |
| 75 Years and over | 574 (3.7%) | 1,609 (7.3%) |
Disability Class: Cognitive Difficulty
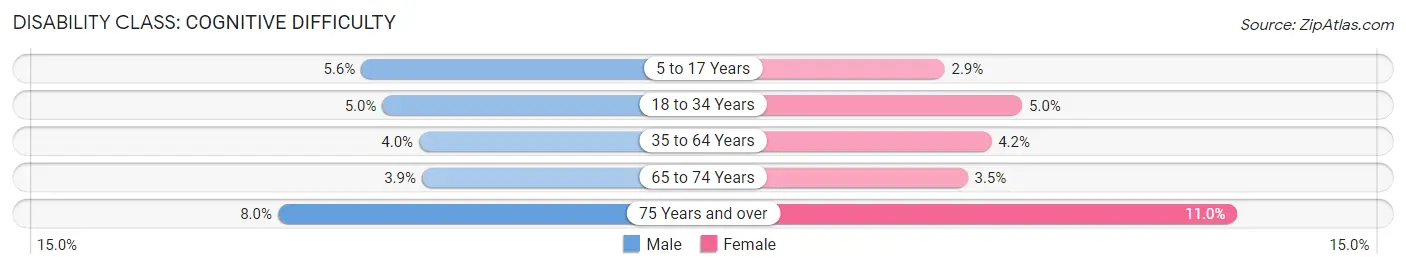
| Age Bracket | Male | Female |
| 5 to 17 Years | 2,431 (5.6%) | 1,161 (2.9%) |
| 18 to 34 Years | 2,598 (5.0%) | 2,596 (5.0%) |
| 35 to 64 Years | 4,172 (4.0%) | 4,527 (4.2%) |
| 65 to 74 Years | 1,072 (3.9%) | 1,103 (3.5%) |
| 75 Years and over | 1,229 (8.0%) | 2,429 (11.0%) |
Disability Class: Ambulatory Difficulty
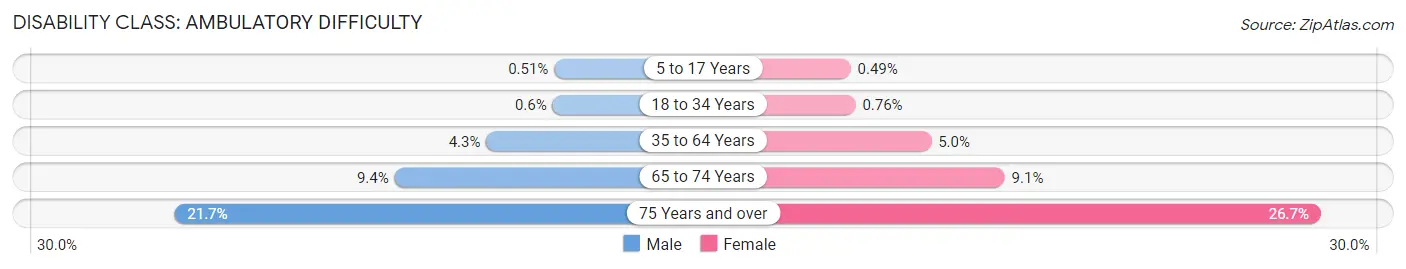
| Age Bracket | Male | Female |
| 5 to 17 Years | 221 (0.5%) | 199 (0.5%) |
| 18 to 34 Years | 307 (0.6%) | 394 (0.8%) |
| 35 to 64 Years | 4,450 (4.3%) | 5,426 (5.0%) |
| 65 to 74 Years | 2,554 (9.4%) | 2,855 (9.1%) |
| 75 Years and over | 3,348 (21.7%) | 5,881 (26.7%) |
Disability Class: Self-Care Difficulty
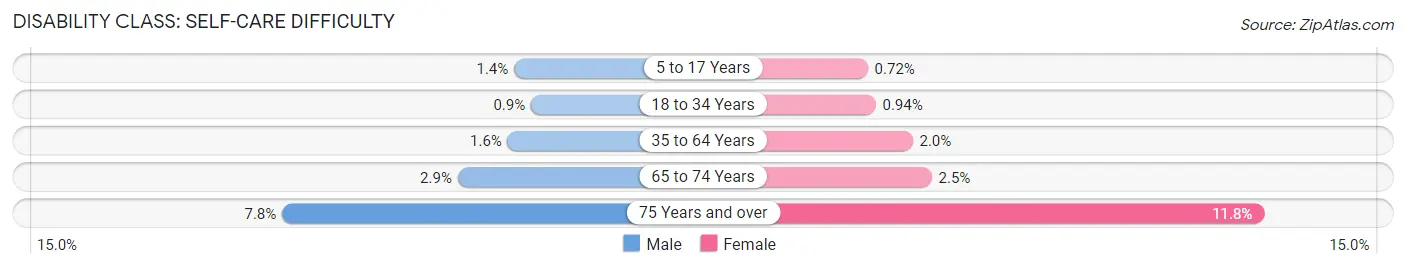
| Age Bracket | Male | Female |
| 5 to 17 Years | 591 (1.4%) | 290 (0.7%) |
| 18 to 34 Years | 462 (0.9%) | 488 (0.9%) |
| 35 to 64 Years | 1,612 (1.5%) | 2,145 (2.0%) |
| 65 to 74 Years | 799 (2.9%) | 787 (2.5%) |
| 75 Years and over | 1,210 (7.8%) | 2,593 (11.8%) |
Technology Access in Plymouth County
Computing Device Access in Plymouth County
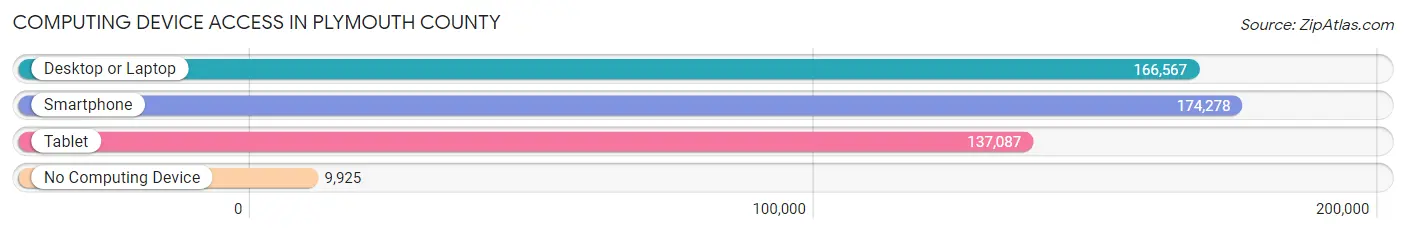
| Device Type | # Households | % Households |
| Desktop or Laptop | 166,567 | 83.7% |
| Smartphone | 174,278 | 87.6% |
| Tablet | 137,087 | 68.9% |
| No Computing Device | 9,925 | 5.0% |
| Total | 198,937 | 100.0% |
Internet Access in Plymouth County
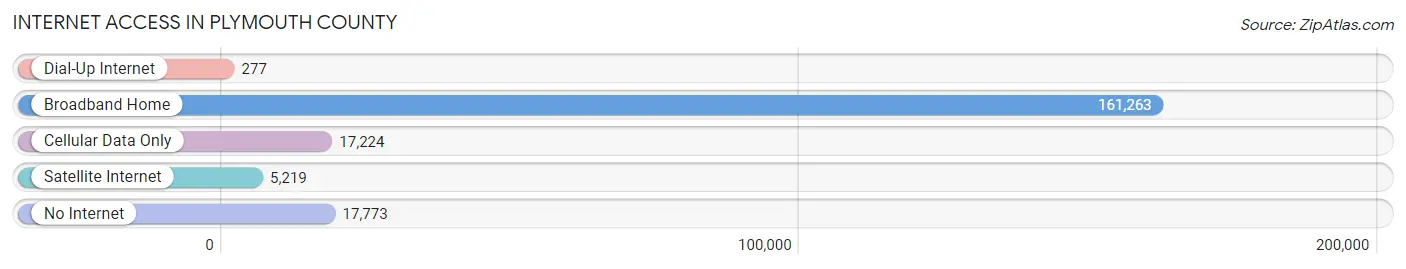
| Internet Type | # Households | % Households |
| Dial-Up Internet | 277 | 0.1% |
| Broadband Home | 161,263 | 81.1% |
| Cellular Data Only | 17,224 | 8.7% |
| Satellite Internet | 5,219 | 2.6% |
| No Internet | 17,773 | 8.9% |
| Total | 198,937 | 100.0% |
Plymouth County Summary
Plymouth County is a county located in the U.S. state of Massachusetts. It is part of the Greater Boston metropolitan area and is located in the southeastern corner of the state. As of the 2010 census, the population was 494,919, making it the third-most populous county in Massachusetts. The county seat is Plymouth.
History
Plymouth County was one of the original counties of Massachusetts, created in 1685. It was named after Plymouth, England, the port from which the Mayflower set sail in 1620. The county was originally part of Plymouth Colony, which was founded in 1620 by the Pilgrims. The county was part of the original Plymouth Colony, which was founded in 1620 by the Pilgrims. The county was originally part of Plymouth Colony, which was founded in 1620 by the Pilgrims.
The county was originally part of Plymouth Colony, which was founded in 1620 by the Pilgrims. The county was originally part of Plymouth Colony, which was founded in 1620 by the Pilgrims. The county was originally part of Plymouth Colony, which was founded in 1620 by the Pilgrims.
The county was originally part of Plymouth Colony, which was founded in 1620 by the Pilgrims. The county was originally part of Plymouth Colony, which was founded in 1620 by the Pilgrims. The county was originally part of Plymouth Colony, which was founded in 1620 by the Pilgrims.
The county was originally part of Plymouth Colony, which was founded in 1620 by the Pilgrims. The county was originally part of Plymouth Colony, which was founded in 1620 by the Pilgrims. The county was originally part of Plymouth Colony, which was founded in 1620 by the Pilgrims.
The county was originally part of Plymouth Colony, which was founded in 1620 by the Pilgrims. The county was originally part of Plymouth Colony, which was founded in 1620 by the Pilgrims. The county was originally part of Plymouth Colony, which was founded in 1620 by the Pilgrims.
The county was originally part of Plymouth Colony, which was founded in 1620 by the Pilgrims. The county was originally part of Plymouth Colony, which was founded in 1620 by the Pilgrims. The county was originally part of Plymouth Colony, which was founded in 1620 by the Pilgrims.
The county was originally part of Plymouth Colony, which was founded in 1620 by the Pilgrims. The county was originally part of Plymouth Colony, which was founded in 1620 by the Pilgrims. The county was originally part of Plymouth Colony, which was founded in 1620 by the Pilgrims.
Geography
Plymouth County is located in the southeastern corner of Massachusetts. It is bordered by Norfolk County to the north, Bristol County to the west, Barnstable County to the east, and the Atlantic Ocean to the south. The county is approximately 545 square miles in size and is made up of mostly rural and suburban areas. The county is home to several towns, including Plymouth, Brockton, Carver, Duxbury, Hanover, Hanson, Kingston, Marshfield, Pembroke, Plympton, and Wareham.
Economy
Plymouth County has a diverse economy, with a mix of manufacturing, retail, and service industries. The county is home to several large employers, including the Pilgrim Nuclear Power Station, the South Shore Hospital, and the Brockton VA Medical Center. The county is also home to several universities, including Bridgewater State University, Massasoit Community College, and the University of Massachusetts Dartmouth.
The county is also home to several large employers, including the Pilgrim Nuclear Power Station, the South Shore Hospital, and the Brockton VA Medical Center. The county is also home to several universities, including Bridgewater State University, Massasoit Community College, and the University of Massachusetts Dartmouth.
Demographics
As of the 2010 census, the population of Plymouth County was 494,919. The population is made up of a diverse mix of ethnicities, with the largest groups being White (83.3%), Hispanic or Latino (7.7%), and Black or African American (4.7%). The median household income in the county is $68,945, and the median age is 41.7 years. The county has a higher-than-average rate of poverty, with 11.7% of the population living below the poverty line.
Common Questions
What is the Total Population of Plymouth County?
Total Population of Plymouth County is 529,548.
What is the Total Male Population of Plymouth County?
Total Male Population of Plymouth County is 259,441.
What is the Total Female Population of Plymouth County?
Total Female Population of Plymouth County is 270,107.
What is the Ratio of Males per 100 Females in Plymouth County?
There are 96.05 Males per 100 Females in Plymouth County.
What is the Ratio of Females per 100 Males in Plymouth County?
There are 104.11 Females per 100 Males in Plymouth County.
What is the Median Population Age in Plymouth County?
Median Population Age in Plymouth County is 42.7 Years.
What is the Average Family Size in Plymouth County
Average Family Size in Plymouth County is 3.1 People.
What is the Average Household Size in Plymouth County
Average Household Size in Plymouth County is 2.6 People.
What is Per Capita Income in Plymouth County?
Per Capita income in Plymouth County is $53,423.
What is the Median Family Income in Plymouth County?
Median Family Income in Plymouth County is $128,726.
What is the Median Household income in Plymouth County?
Median Household Income in Plymouth County is $105,387.
What is Income or Wage Gap in Plymouth County?
Income or Wage Gap in Plymouth County is 31.8%.
Women in Plymouth County earn 68.2 cents for every dollar earned by a man.
What is Family Income Deficit in Plymouth County?
Family Income Deficit in Plymouth County is $10,913.
Families that are below poverty line in Plymouth County earn $10,913 less on average than the poverty threshold level.
What is Inequality or Gini Index in Plymouth County?
Inequality or Gini Index in Plymouth County is 0.46.
How Large is the Labor Force in Plymouth County?
There are 290,106 People in the Labor Forcein in Plymouth County.
What is the Percentage of People in the Labor Force in Plymouth County?
67.0% of People are in the Labor Force in Plymouth County.
What is the Unemployment Rate in Plymouth County?
Unemployment Rate in Plymouth County is 5.2%.