Nantucket County, MA
Nantucket County Map
Nantucket County Overview
14,065
TOTAL POPULATION
7,722
MALE POPULATION
6,343
FEMALE POPULATION
121.74
MALES / 100 FEMALES
82.14
FEMALES / 100 MALES
40.5
MEDIAN AGE
3.3
AVG FAMILY SIZE
3.0
AVG HOUSEHOLD SIZE
$62,153
PER CAPITA INCOME
$144,198
AVG FAMILY INCOME
$135,590
AVG HOUSEHOLD INCOME
11.9%
WAGE / INCOME GAP [ % ]
88.1¢/ $1
WAGE / INCOME GAP [ $ ]
0.46
INEQUALITY / GINI INDEX
7,979
LABOR FORCE [ PEOPLE ]
70.4%
PERCENT IN LABOR FORCE
5.5%
UNEMPLOYMENT RATE
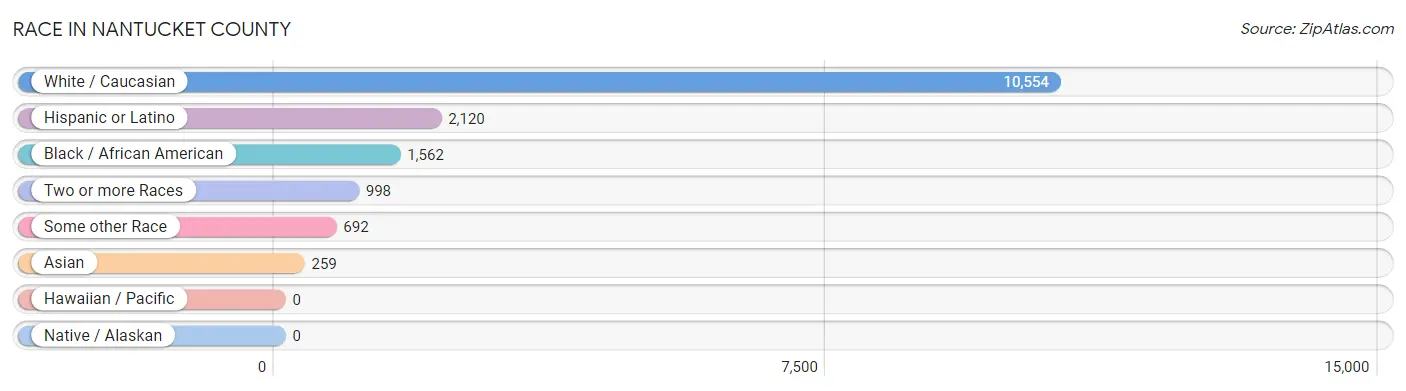
Race in Nantucket County
The most populous races in Nantucket County are White / Caucasian (10,554 | 75.0%), Hispanic or Latino (2,120 | 15.1%), and Black / African American (1,562 | 11.1%).
| Race | # Population | % Population |
| Asian | 259 | 1.8% |
| Black / African American | 1,562 | 11.1% |
| Hawaiian / Pacific | 0 | 0.0% |
| Hispanic or Latino | 2,120 | 15.1% |
| Native / Alaskan | 0 | 0.0% |
| White / Caucasian | 10,554 | 75.0% |
| Two or more Races | 998 | 7.1% |
| Some other Race | 692 | 4.9% |
| Total | 14,065 | 100.0% |
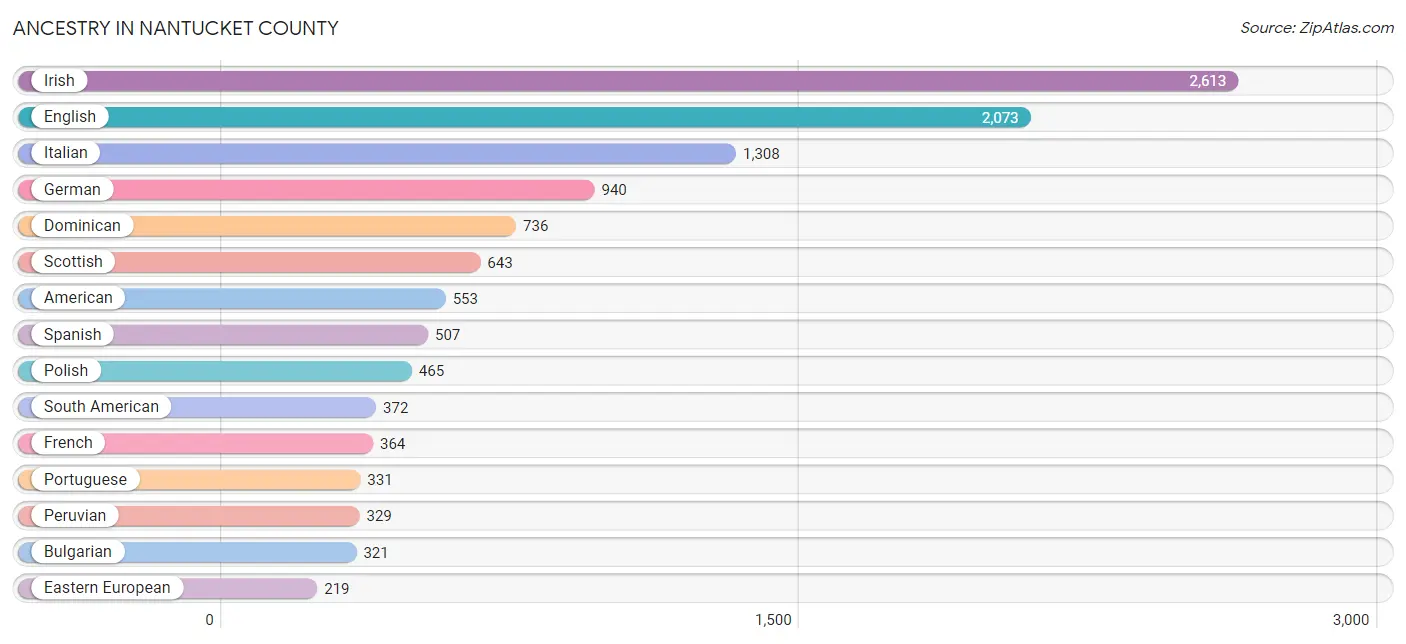
Ancestry in Nantucket County
The most populous ancestries reported in Nantucket County are Irish (2,613 | 18.6%), English (2,073 | 14.7%), Italian (1,308 | 9.3%), German (940 | 6.7%), and Dominican (736 | 5.2%), together accounting for 54.5% of all Nantucket County residents.
| Ancestry | # Population | % Population |
| African | 8 | 0.1% |
| American | 553 | 3.9% |
| Arab | 35 | 0.3% |
| Armenian | 6 | 0.0% |
| Austrian | 33 | 0.2% |
| Barbadian | 24 | 0.2% |
| Bhutanese | 18 | 0.1% |
| Brazilian | 5 | 0.0% |
| British | 67 | 0.5% |
| Bulgarian | 321 | 2.3% |
| Burmese | 158 | 1.1% |
| Canadian | 61 | 0.4% |
| Celtic | 8 | 0.1% |
| Central American | 66 | 0.5% |
| Croatian | 17 | 0.1% |
| Cuban | 90 | 0.6% |
| Czechoslovakian | 6 | 0.0% |
| Danish | 28 | 0.2% |
| Dominican | 736 | 5.2% |
| Dutch | 122 | 0.9% |
| Eastern European | 219 | 1.6% |
| English | 2,073 | 14.7% |
| European | 110 | 0.8% |
| Finnish | 35 | 0.3% |
| French | 364 | 2.6% |
| French Canadian | 157 | 1.1% |
| German | 940 | 6.7% |
| Greek | 1 | 0.0% |
| Honduran | 1 | 0.0% |
| Hungarian | 36 | 0.3% |
| Indian (Asian) | 22 | 0.2% |
| Iranian | 6 | 0.0% |
| Irish | 2,613 | 18.6% |
| Italian | 1,308 | 9.3% |
| Jamaican | 95 | 0.7% |
| Korean | 16 | 0.1% |
| Latvian | 32 | 0.2% |
| Lebanese | 35 | 0.3% |
| Lithuanian | 160 | 1.1% |
| Mexican | 216 | 1.5% |
| New Zealander | 27 | 0.2% |
| Northern European | 7 | 0.1% |
| Norwegian | 140 | 1.0% |
| Peruvian | 329 | 2.3% |
| Polish | 465 | 3.3% |
| Portuguese | 331 | 2.4% |
| Puerto Rican | 29 | 0.2% |
| Russian | 141 | 1.0% |
| Salvadoran | 65 | 0.5% |
| Scandinavian | 7 | 0.1% |
| Scotch-Irish | 106 | 0.7% |
| Scottish | 643 | 4.6% |
| Serbian | 211 | 1.5% |
| Slovak | 18 | 0.1% |
| South American | 372 | 2.6% |
| Spaniard | 93 | 0.7% |
| Spanish | 507 | 3.6% |
| Subsaharan African | 8 | 0.1% |
| Swedish | 174 | 1.2% |
| Swiss | 42 | 0.3% |
| Thai | 49 | 0.4% |
| U.S. Virgin Islander | 9 | 0.1% |
| Ukrainian | 17 | 0.1% |
| Venezuelan | 43 | 0.3% |
| Welsh | 194 | 1.4% | View All 65 Rows |
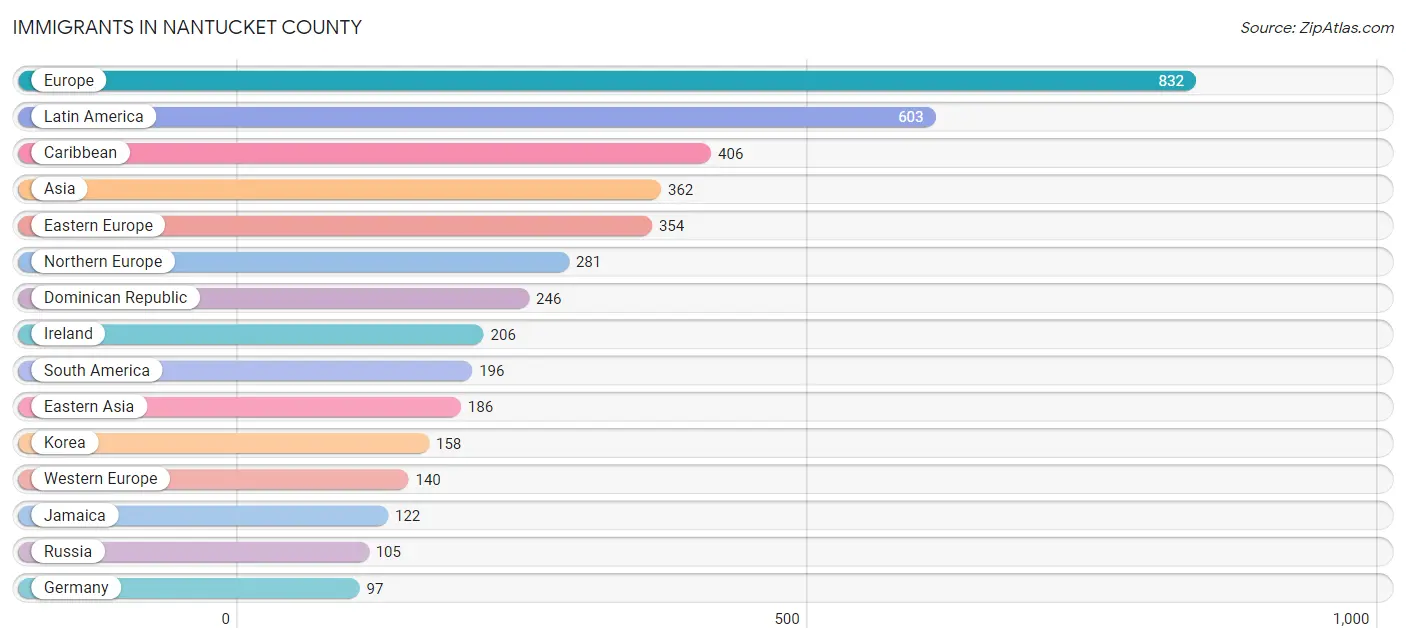
Immigrants in Nantucket County
The most numerous immigrant groups reported in Nantucket County came from Europe (832 | 5.9%), Latin America (603 | 4.3%), Caribbean (406 | 2.9%), Asia (362 | 2.6%), and Eastern Europe (354 | 2.5%), together accounting for 18.2% of all Nantucket County residents.
| Immigration Origin | # Population | % Population |
| Asia | 362 | 2.6% |
| Austria | 22 | 0.2% |
| Barbados | 24 | 0.2% |
| Belarus | 20 | 0.1% |
| Brazil | 64 | 0.5% |
| Bulgaria | 77 | 0.5% |
| Canada | 29 | 0.2% |
| Caribbean | 406 | 2.9% |
| Central America | 1 | 0.0% |
| China | 22 | 0.2% |
| Croatia | 11 | 0.1% |
| Denmark | 5 | 0.0% |
| Dominican Republic | 246 | 1.8% |
| Eastern Asia | 186 | 1.3% |
| Eastern Europe | 354 | 2.5% |
| England | 34 | 0.2% |
| Europe | 832 | 5.9% |
| France | 12 | 0.1% |
| Germany | 97 | 0.7% |
| Haiti | 14 | 0.1% |
| Honduras | 1 | 0.0% |
| Hong Kong | 12 | 0.1% |
| India | 86 | 0.6% |
| Ireland | 206 | 1.5% |
| Jamaica | 122 | 0.9% |
| Japan | 6 | 0.0% |
| Korea | 158 | 1.1% |
| Latin America | 603 | 4.3% |
| Latvia | 27 | 0.2% |
| Lithuania | 17 | 0.1% |
| Netherlands | 9 | 0.1% |
| Northern Europe | 281 | 2.0% |
| Oceania | 10 | 0.1% |
| Peru | 89 | 0.6% |
| Philippines | 58 | 0.4% |
| Poland | 62 | 0.4% |
| Portugal | 54 | 0.4% |
| Russia | 105 | 0.7% |
| Scotland | 17 | 0.1% |
| Serbia | 35 | 0.3% |
| Singapore | 1 | 0.0% |
| South America | 196 | 1.4% |
| South Central Asia | 86 | 0.6% |
| South Eastern Asia | 90 | 0.6% |
| Southern Europe | 57 | 0.4% |
| Spain | 3 | 0.0% |
| Venezuela | 43 | 0.3% |
| Vietnam | 31 | 0.2% |
| Western Europe | 140 | 1.0% | View All 49 Rows |
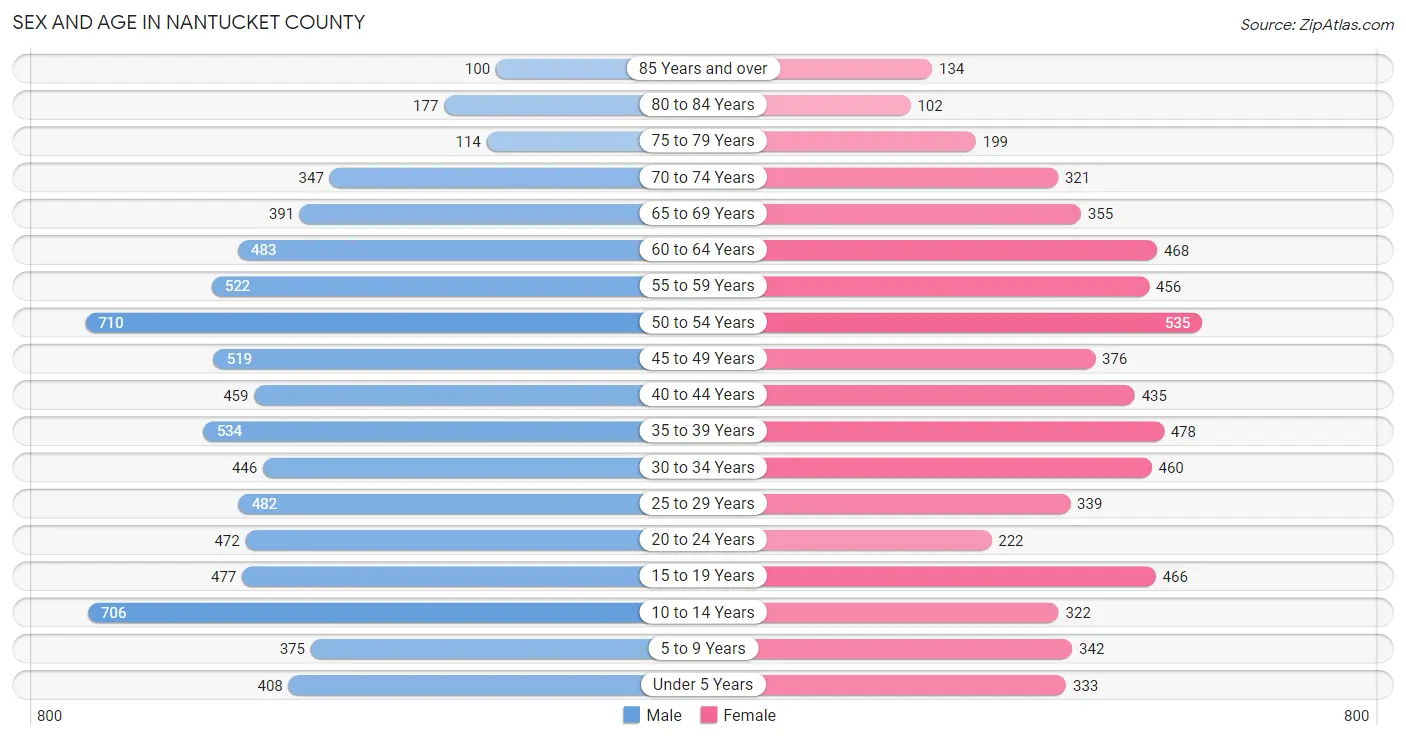
Sex and Age in Nantucket County
Sex and Age in Nantucket County
The most populous age groups in Nantucket County are 50 to 54 Years (710 | 9.2%) for men and 50 to 54 Years (535 | 8.4%) for women.
| Age Bracket | Male | Female |
| Under 5 Years | 408 (5.3%) | 333 (5.2%) |
| 5 to 9 Years | 375 (4.9%) | 342 (5.4%) |
| 10 to 14 Years | 706 (9.1%) | 322 (5.1%) |
| 15 to 19 Years | 477 (6.2%) | 466 (7.3%) |
| 20 to 24 Years | 472 (6.1%) | 222 (3.5%) |
| 25 to 29 Years | 482 (6.2%) | 339 (5.3%) |
| 30 to 34 Years | 446 (5.8%) | 460 (7.2%) |
| 35 to 39 Years | 534 (6.9%) | 478 (7.5%) |
| 40 to 44 Years | 459 (5.9%) | 435 (6.9%) |
| 45 to 49 Years | 519 (6.7%) | 376 (5.9%) |
| 50 to 54 Years | 710 (9.2%) | 535 (8.4%) |
| 55 to 59 Years | 522 (6.8%) | 456 (7.2%) |
| 60 to 64 Years | 483 (6.2%) | 468 (7.4%) |
| 65 to 69 Years | 391 (5.1%) | 355 (5.6%) |
| 70 to 74 Years | 347 (4.5%) | 321 (5.1%) |
| 75 to 79 Years | 114 (1.5%) | 199 (3.1%) |
| 80 to 84 Years | 177 (2.3%) | 102 (1.6%) |
| 85 Years and over | 100 (1.3%) | 134 (2.1%) |
| Total | 7,722 (100.0%) | 6,343 (100.0%) |
Families and Households in Nantucket County
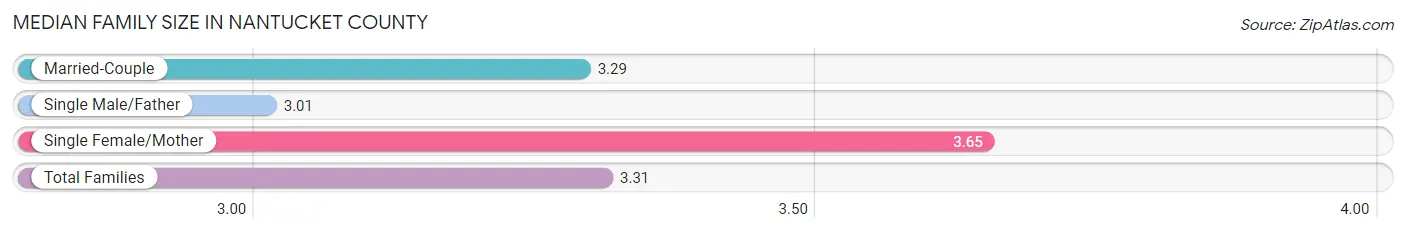
Median Family Size in Nantucket County
The median family size in Nantucket County is 3.31 persons per family, with single female/mother families (351 | 10.8%) accounting for the largest median family size of 3.65 persons per family. On the other hand, single male/father families (187 | 5.8%) represent the smallest median family size with 3.01 persons per family.
| Family Type | # Families | Family Size |
| Married-Couple | 2,700 (83.4%) | 3.29 |
| Single Male/Father | 187 (5.8%) | 3.01 |
| Single Female/Mother | 351 (10.8%) | 3.65 |
| Total Families | 3,238 (100.0%) | 3.31 |
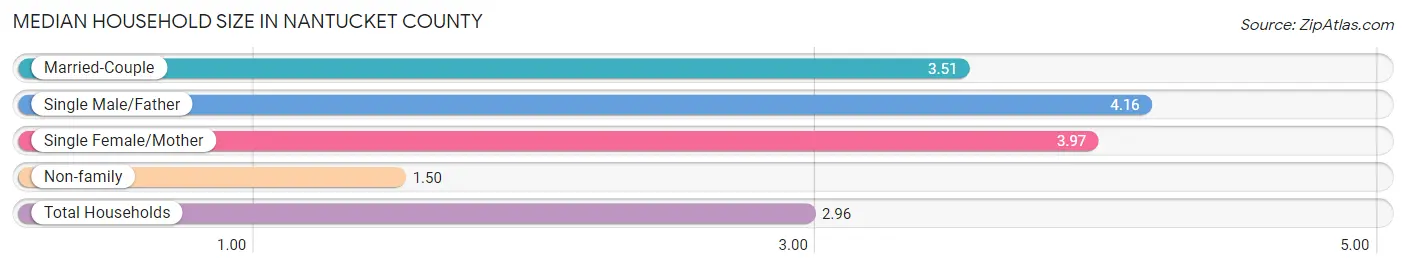
Median Household Size in Nantucket County
The median household size in Nantucket County is 2.96 persons per household, with single male/father households (187 | 4.0%) accounting for the largest median household size of 4.16 persons per household. non-family households (1,421 | 30.5%) represent the smallest median household size with 1.50 persons per household.
| Household Type | # Households | Household Size |
| Married-Couple | 2,700 (58.0%) | 3.51 |
| Single Male/Father | 187 (4.0%) | 4.16 |
| Single Female/Mother | 351 (7.5%) | 3.97 |
| Non-family | 1,421 (30.5%) | 1.50 |
| Total Households | 4,659 (100.0%) | 2.96 |
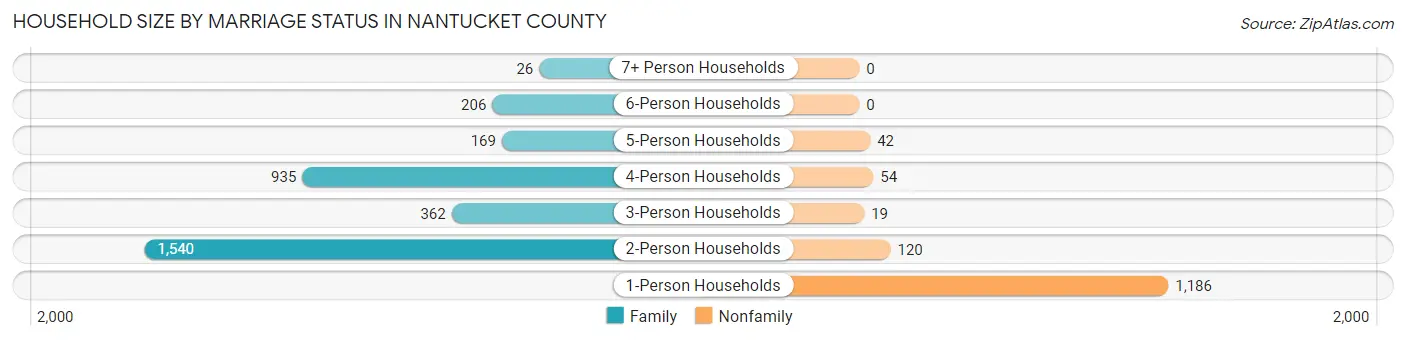
Household Size by Marriage Status in Nantucket County
Out of a total of 4,659 households in Nantucket County, 3,238 (69.5%) are family households, while 1,421 (30.5%) are nonfamily households. The most numerous type of family households are 2-person households, comprising 1,540, and the most common type of nonfamily households are 1-person households, comprising 1,186.
| Household Size | Family Households | Nonfamily Households |
| 1-Person Households | - | 1,186 (25.5%) |
| 2-Person Households | 1,540 (33.1%) | 120 (2.6%) |
| 3-Person Households | 362 (7.8%) | 19 (0.4%) |
| 4-Person Households | 935 (20.1%) | 54 (1.2%) |
| 5-Person Households | 169 (3.6%) | 42 (0.9%) |
| 6-Person Households | 206 (4.4%) | 0 (0.0%) |
| 7+ Person Households | 26 (0.6%) | 0 (0.0%) |
| Total | 3,238 (69.5%) | 1,421 (30.5%) |
Female Fertility in Nantucket County
Fertility by Age in Nantucket County
Average fertility rate in Nantucket County is 38.0 births per 1,000 women. Women in the age bracket of 35 to 50 years have the highest fertility rate with 47.0 births per 1,000 women. Women in the age bracket of 35 to 50 years acount for 60.4% of all women with births.
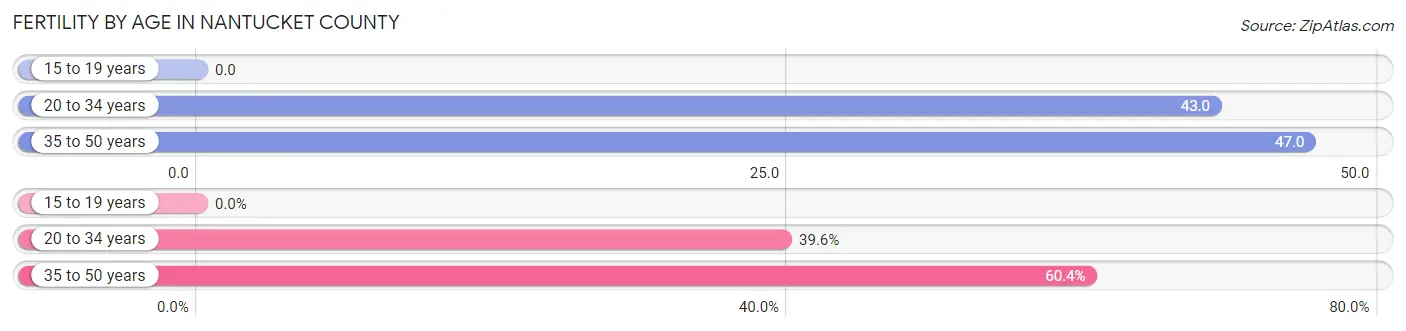
| Age Bracket | Women with Births | Births / 1,000 Women |
| 15 to 19 years | 0 (0.0%) | 0.0 |
| 20 to 34 years | 44 (39.6%) | 43.0 |
| 35 to 50 years | 67 (60.4%) | 47.0 |
| Total | 111 (100.0%) | 38.0 |
Fertility by Age by Marriage Status in Nantucket County
54.1% of women with births (111) in Nantucket County are married. The highest percentage of unmarried women with births falls into 35 to 50 years age bracket with 50.7% of them unmarried at the time of birth, while the lowest percentage of unmarried women with births belong to 20 to 34 years age bracket with 38.6% of them unmarried.
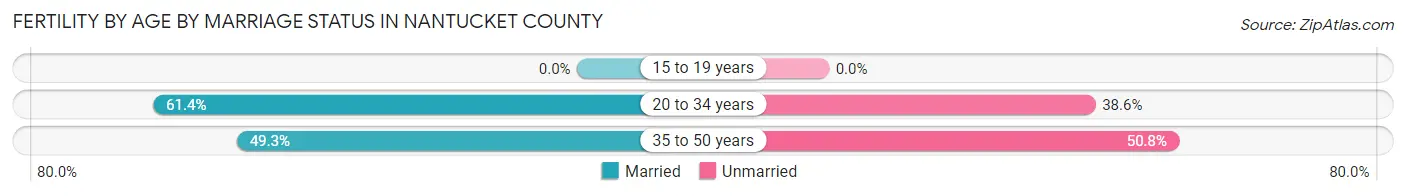
| Age Bracket | Married | Unmarried |
| 15 to 19 years | 0 (0.0%) | 0 (0.0%) |
| 20 to 34 years | 27 (61.4%) | 17 (38.6%) |
| 35 to 50 years | 33 (49.2%) | 34 (50.7%) |
| Total | 60 (54.0%) | 51 (46.0%) |
Fertility by Education in Nantucket County
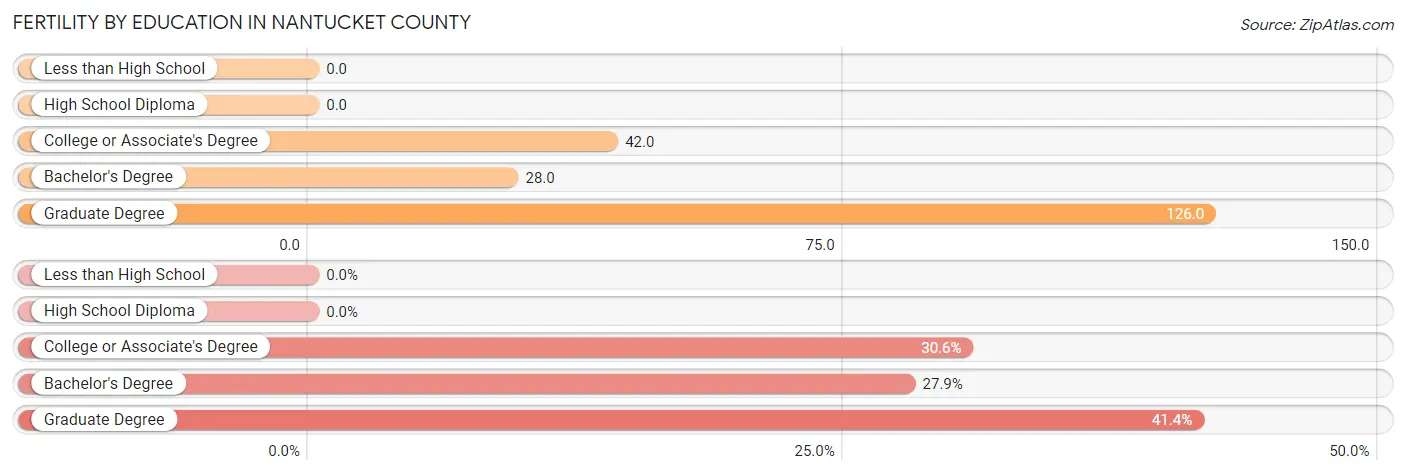
| Educational Attainment | Women with Births | Births / 1,000 Women |
| Less than High School | 0 (0.0%) | 0.0 |
| High School Diploma | 0 (0.0%) | 0.0 |
| College or Associate's Degree | 34 (30.6%) | 42.0 |
| Bachelor's Degree | 31 (27.9%) | 28.0 |
| Graduate Degree | 46 (41.4%) | 126.0 |
| Total | 111 (100.0%) | 38.0 |
Fertility by Education by Marriage Status in Nantucket County
46.0% of women with births in Nantucket County are unmarried. Women with the educational attainment of graduate degree are most likely to be married with 100.0% of them married at childbirth, while women with the educational attainment of college or associate's degree are least likely to be married with 100.0% of them unmarried at childbirth.
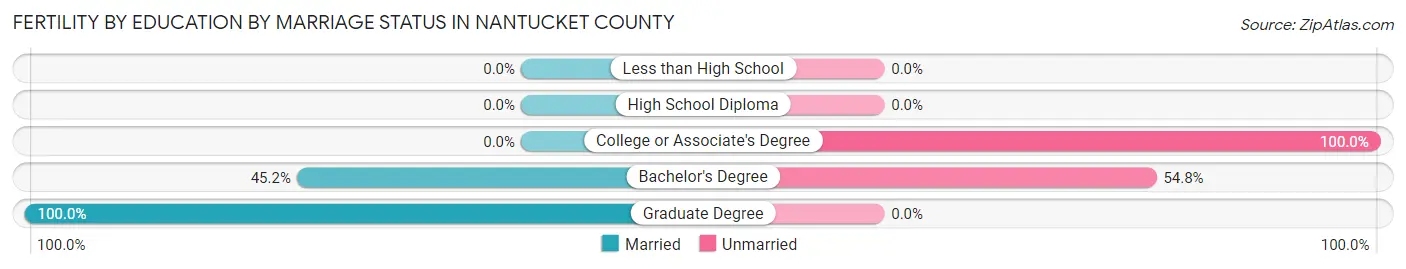
| Educational Attainment | Married | Unmarried |
| Less than High School | 0 (0.0%) | 0 (0.0%) |
| High School Diploma | 0 (0.0%) | 0 (0.0%) |
| College or Associate's Degree | 0 (0.0%) | 34 (100.0%) |
| Bachelor's Degree | 14 (45.2%) | 17 (54.8%) |
| Graduate Degree | 46 (100.0%) | 0 (0.0%) |
| Total | 60 (54.0%) | 51 (46.0%) |
Income in Nantucket County
Income Overview in Nantucket County
Per Capita Income in Nantucket County is $62,153, while median incomes of families and households are $144,198 and $135,590 respectively.
| Characteristic | Number | Measure |
| Per Capita Income | 14,065 | $62,153 |
| Median Family Income | 3,238 | $144,198 |
| Mean Family Income | 3,238 | $189,430 |
| Median Household Income | 4,659 | $135,590 |
| Mean Household Income | 4,659 | $176,197 |
| Income Deficit | 3,238 | $0 |
| Wage / Income Gap (%) | 14,065 | 11.86% |
| Wage / Income Gap ($) | 14,065 | 88.14¢ per $1 |
| Gini / Inequality Index | 14,065 | 0.46 |
Earnings by Sex in Nantucket County
Average Earnings in Nantucket County are $56,374, $61,203 for men and $53,946 for women, a difference of 11.9%.
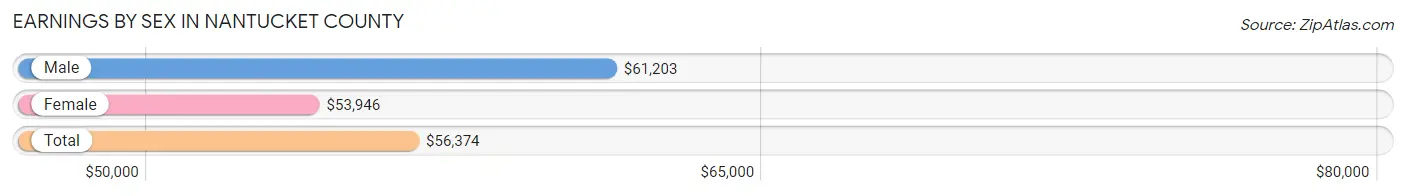
| Sex | Number | Average Earnings |
| Male | 4,782 (56.2%) | $61,203 |
| Female | 3,721 (43.8%) | $53,946 |
| Total | 8,503 (100.0%) | $56,374 |
Earnings by Sex by Income Bracket in Nantucket County
The most common earnings brackets in Nantucket County are $100,000+ for men (981 | 20.5%) and $100,000+ for women (658 | 17.7%).
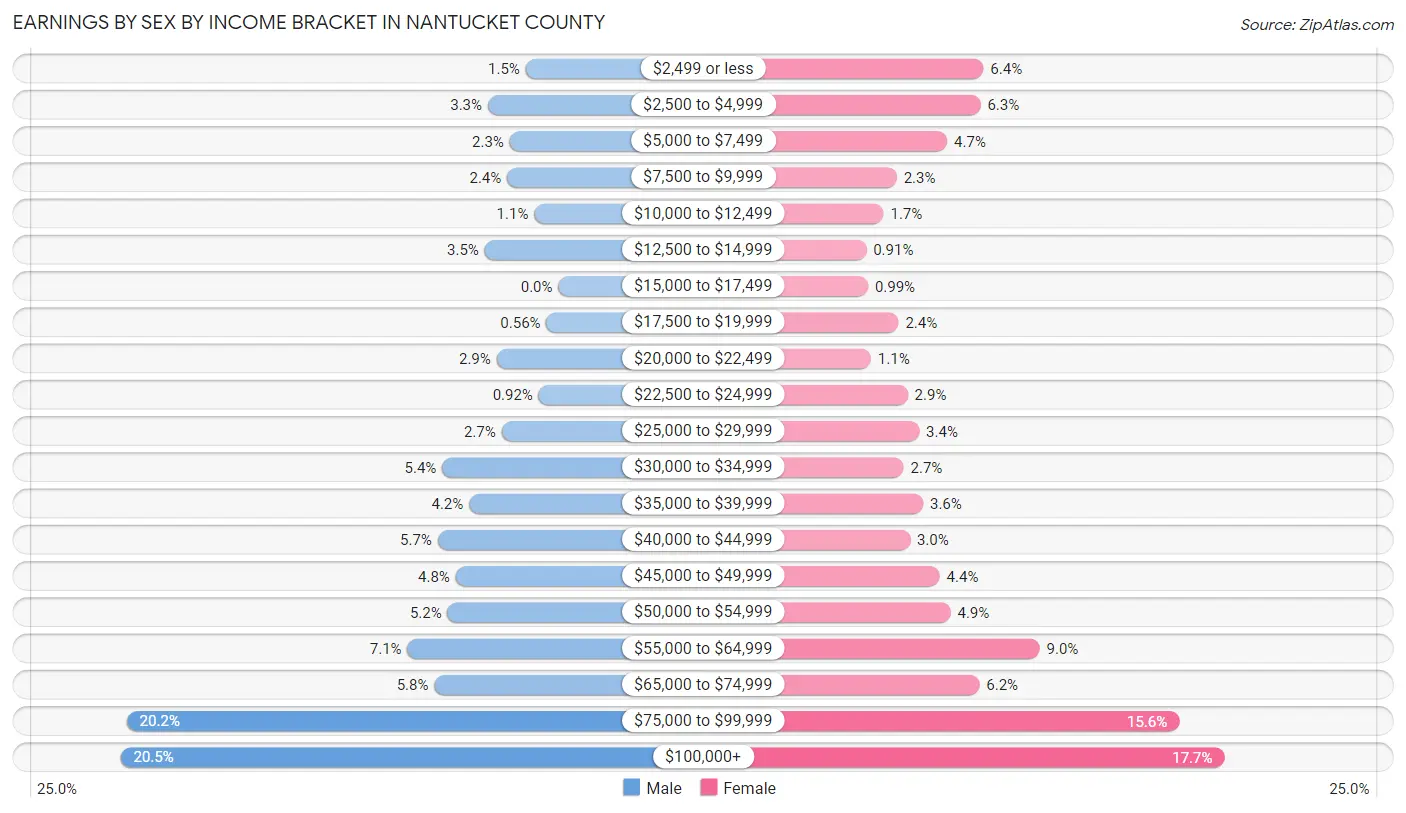
| Income | Male | Female |
| $2,499 or less | 73 (1.5%) | 238 (6.4%) |
| $2,500 to $4,999 | 158 (3.3%) | 233 (6.3%) |
| $5,000 to $7,499 | 109 (2.3%) | 175 (4.7%) |
| $7,500 to $9,999 | 115 (2.4%) | 87 (2.3%) |
| $10,000 to $12,499 | 54 (1.1%) | 64 (1.7%) |
| $12,500 to $14,999 | 165 (3.5%) | 34 (0.9%) |
| $15,000 to $17,499 | 0 (0.0%) | 37 (1.0%) |
| $17,500 to $19,999 | 27 (0.6%) | 90 (2.4%) |
| $20,000 to $22,499 | 138 (2.9%) | 42 (1.1%) |
| $22,500 to $24,999 | 44 (0.9%) | 106 (2.9%) |
| $25,000 to $29,999 | 127 (2.7%) | 126 (3.4%) |
| $30,000 to $34,999 | 260 (5.4%) | 99 (2.7%) |
| $35,000 to $39,999 | 200 (4.2%) | 133 (3.6%) |
| $40,000 to $44,999 | 270 (5.7%) | 110 (3.0%) |
| $45,000 to $49,999 | 230 (4.8%) | 162 (4.3%) |
| $50,000 to $54,999 | 248 (5.2%) | 181 (4.9%) |
| $55,000 to $64,999 | 338 (7.1%) | 336 (9.0%) |
| $65,000 to $74,999 | 278 (5.8%) | 231 (6.2%) |
| $75,000 to $99,999 | 967 (20.2%) | 579 (15.6%) |
| $100,000+ | 981 (20.5%) | 658 (17.7%) |
| Total | 4,782 (100.0%) | 3,721 (100.0%) |
Earnings by Sex by Educational Attainment in Nantucket County
Average earnings in Nantucket County are $68,450 for men and $59,760 for women, a difference of 12.7%. Men with an educational attainment of graduate degree enjoy the highest average annual earnings of $96,343, while those with high school diploma education earn the least with $51,916. Women with an educational attainment of graduate degree earn the most with the average annual earnings of $76,528, while those with high school diploma education have the smallest earnings of $35,341.
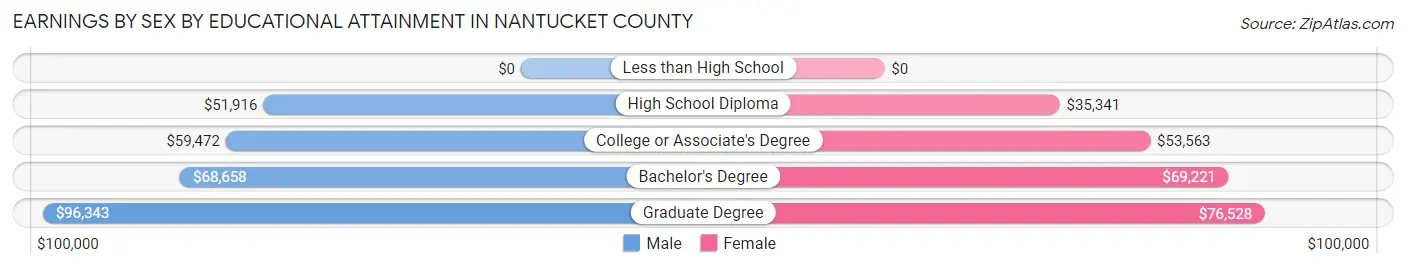
| Educational Attainment | Male Income | Female Income |
| Less than High School | - | - |
| High School Diploma | $51,916 | $35,341 |
| College or Associate's Degree | $59,472 | $53,563 |
| Bachelor's Degree | $68,658 | $69,221 |
| Graduate Degree | $96,343 | $76,528 |
| Total | $68,450 | $59,760 |
Family Income in Nantucket County
Family Income Brackets in Nantucket County
According to the Nantucket County family income data, there are 1,166 families falling into the $200,000+ income range, which is the most common income bracket and makes up 36.0% of all families.
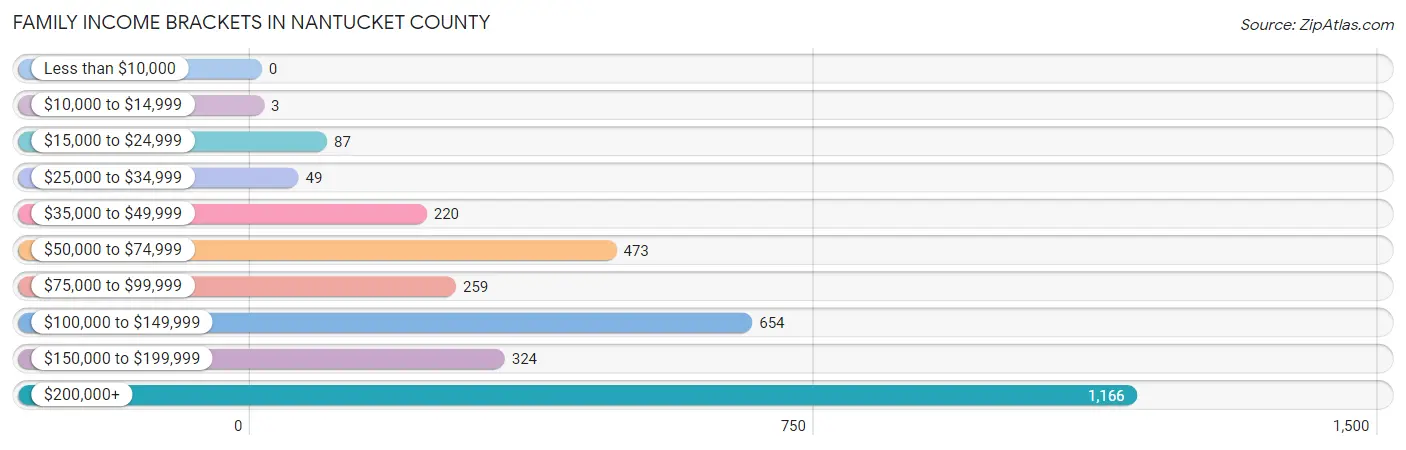
| Income Bracket | # Families | % Families |
| Less than $10,000 | 0 | 0.0% |
| $10,000 to $14,999 | 3 | 0.1% |
| $15,000 to $24,999 | 87 | 2.7% |
| $25,000 to $34,999 | 49 | 1.5% |
| $35,000 to $49,999 | 220 | 6.8% |
| $50,000 to $74,999 | 473 | 14.6% |
| $75,000 to $99,999 | 259 | 8.0% |
| $100,000 to $149,999 | 654 | 20.2% |
| $150,000 to $199,999 | 324 | 10.0% |
| $200,000+ | 1,166 | 36.0% |
Family Income by Famaliy Size in Nantucket County
5-person families (93 | 2.9%) account for the highest median family income in Nantucket County with $207,404 per family, while 2-person families (1,740 | 53.7%) have the highest median income of $69,062 per family member.
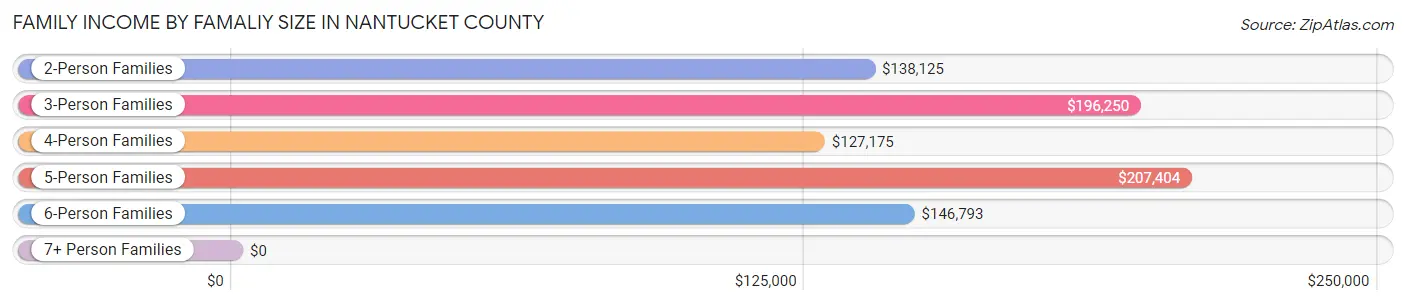
| Income Bracket | # Families | Median Income |
| 2-Person Families | 1,740 (53.7%) | $138,125 |
| 3-Person Families | 292 (9.0%) | $196,250 |
| 4-Person Families | 1,021 (31.5%) | $127,175 |
| 5-Person Families | 93 (2.9%) | $207,404 |
| 6-Person Families | 66 (2.0%) | $146,793 |
| 7+ Person Families | 26 (0.8%) | $0 |
| Total | 3,238 (100.0%) | $144,198 |
Family Income by Number of Earners in Nantucket County
The median family income in Nantucket County is $144,198, with families comprising 2 earners (1,449) having the highest median family income of $200,625, while families with 1 earner (946) have the lowest median family income of $90,100, accounting for 44.8% and 29.2% of families, respectively.
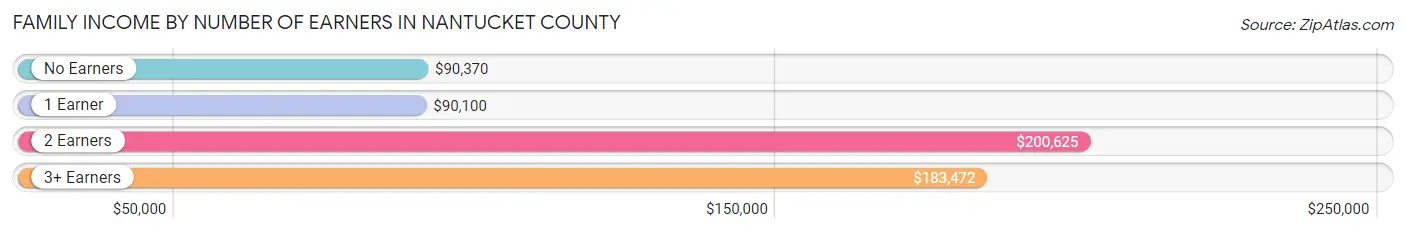
| Number of Earners | # Families | Median Income |
| No Earners | 424 (13.1%) | $90,370 |
| 1 Earner | 946 (29.2%) | $90,100 |
| 2 Earners | 1,449 (44.8%) | $200,625 |
| 3+ Earners | 419 (12.9%) | $183,472 |
| Total | 3,238 (100.0%) | $144,198 |
Household Income in Nantucket County
Household Income Brackets in Nantucket County
With 1,486 households falling in the category, the $200,000+ income range is the most frequent in Nantucket County, accounting for 31.9% of all households. In contrast, only 61 households (1.3%) fall into the less than $10,000 income bracket, making it the least populous group.
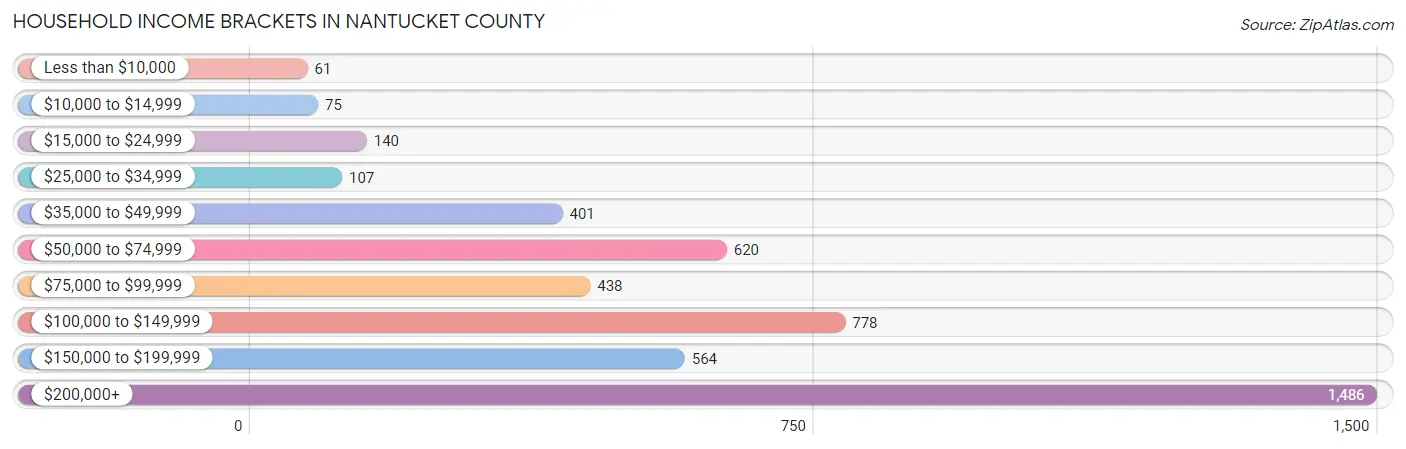
| Income Bracket | # Households | % Households |
| Less than $10,000 | 61 | 1.3% |
| $10,000 to $14,999 | 75 | 1.6% |
| $15,000 to $24,999 | 140 | 3.0% |
| $25,000 to $34,999 | 107 | 2.3% |
| $35,000 to $49,999 | 401 | 8.6% |
| $50,000 to $74,999 | 620 | 13.3% |
| $75,000 to $99,999 | 438 | 9.4% |
| $100,000 to $149,999 | 778 | 16.7% |
| $150,000 to $199,999 | 564 | 12.1% |
| $200,000+ | 1,486 | 31.9% |
Household Income by Householder Age in Nantucket County
The median household income in Nantucket County is $135,590, with the highest median household income of $167,115 found in the 45 to 64 years age bracket for the primary householder. A total of 2,064 households (44.3%) fall into this category. Meanwhile, the 15 to 24 years age bracket for the primary householder has the lowest median household income of $0, with 42 households (0.9%) in this group.
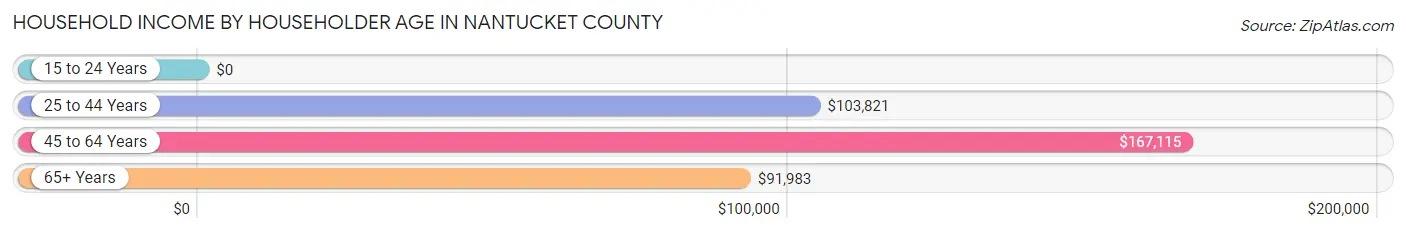
| Income Bracket | # Households | Median Income |
| 15 to 24 Years | 42 (0.9%) | $0 |
| 25 to 44 Years | 1,221 (26.2%) | $103,821 |
| 45 to 64 Years | 2,064 (44.3%) | $167,115 |
| 65+ Years | 1,332 (28.6%) | $91,983 |
| Total | 4,659 (100.0%) | $135,590 |
Poverty in Nantucket County
Income Below Poverty by Sex and Age in Nantucket County
With 4.1% poverty level for males and 6.0% for females among the residents of Nantucket County, 18 to 24 year old males and 18 to 24 year old females are the most vulnerable to poverty, with 96 males (19.1%) and 52 females (15.1%) in their respective age groups living below the poverty level.
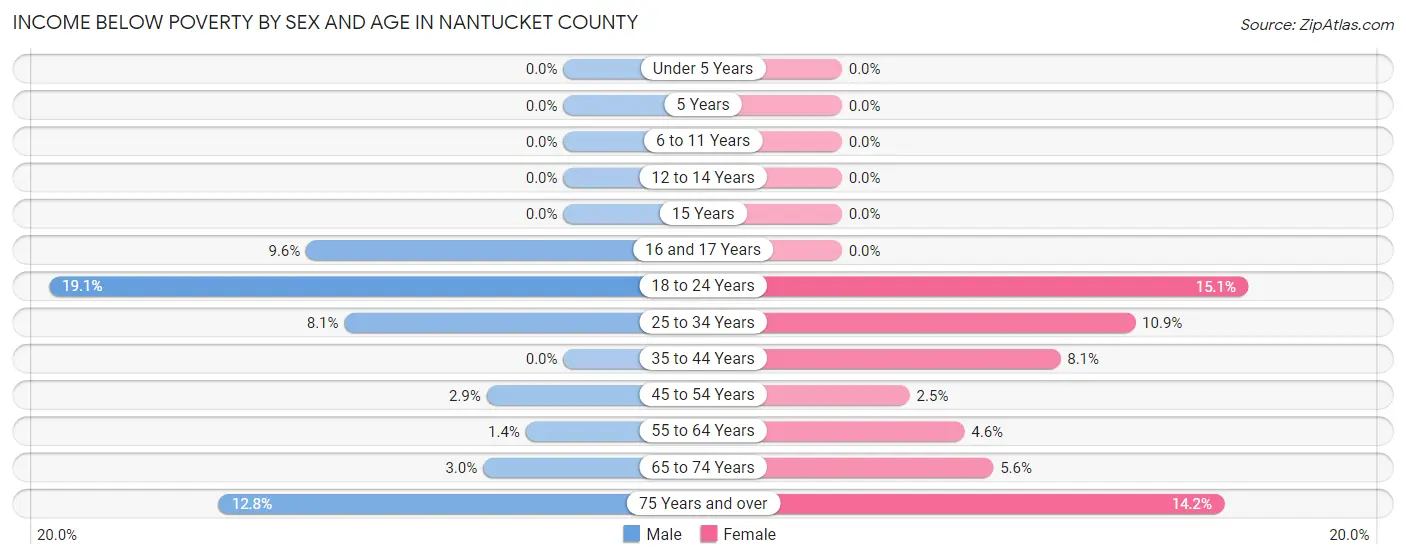
| Age Bracket | Male | Female |
| Under 5 Years | 0 (0.0%) | 0 (0.0%) |
| 5 Years | 0 (0.0%) | 0 (0.0%) |
| 6 to 11 Years | 0 (0.0%) | 0 (0.0%) |
| 12 to 14 Years | 0 (0.0%) | 0 (0.0%) |
| 15 Years | 0 (0.0%) | 0 (0.0%) |
| 16 and 17 Years | 21 (9.6%) | 0 (0.0%) |
| 18 to 24 Years | 96 (19.1%) | 52 (15.1%) |
| 25 to 34 Years | 75 (8.1%) | 87 (10.9%) |
| 35 to 44 Years | 0 (0.0%) | 74 (8.1%) |
| 45 to 54 Years | 35 (2.9%) | 23 (2.5%) |
| 55 to 64 Years | 14 (1.4%) | 42 (4.5%) |
| 65 to 74 Years | 22 (3.0%) | 38 (5.6%) |
| 75 Years and over | 50 (12.8%) | 58 (14.2%) |
| Total | 313 (4.1%) | 374 (6.0%) |
Income Above Poverty by Sex and Age in Nantucket County
According to the poverty statistics in Nantucket County, males aged under 5 years and females aged under 5 years are the age groups that are most secure financially, with 100.0% of males and 100.0% of females in these age groups living above the poverty line.
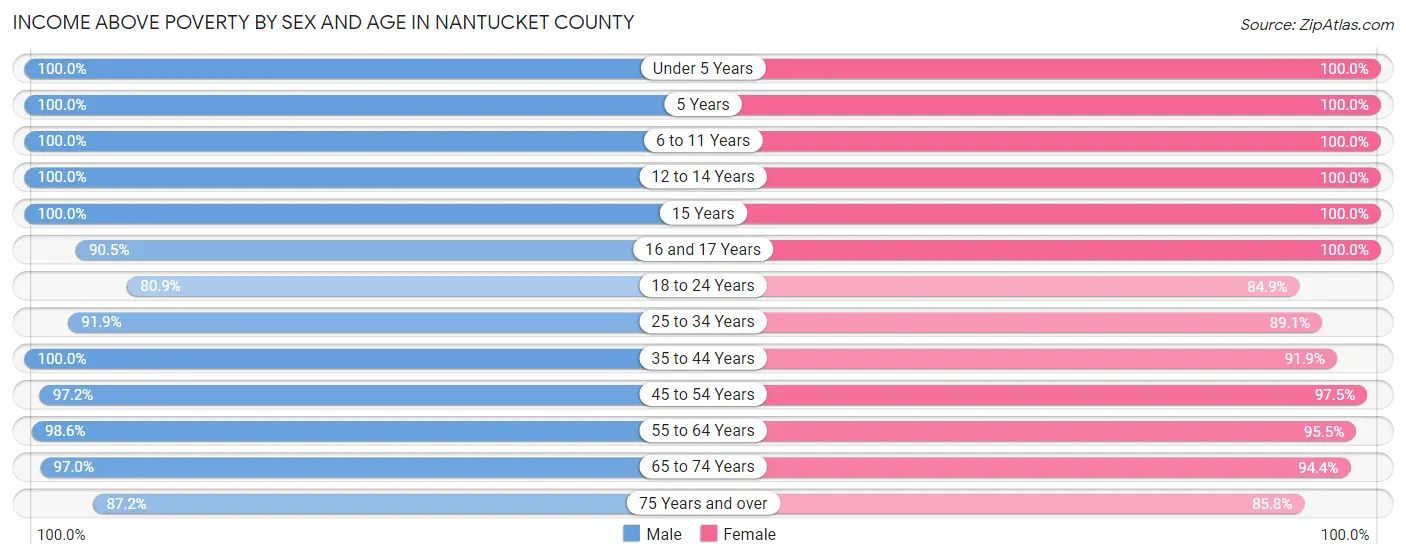
| Age Bracket | Male | Female |
| Under 5 Years | 373 (100.0%) | 322 (100.0%) |
| 5 Years | 23 (100.0%) | 163 (100.0%) |
| 6 to 11 Years | 554 (100.0%) | 274 (100.0%) |
| 12 to 14 Years | 504 (100.0%) | 203 (100.0%) |
| 15 Years | 213 (100.0%) | 32 (100.0%) |
| 16 and 17 Years | 199 (90.4%) | 260 (100.0%) |
| 18 to 24 Years | 407 (80.9%) | 293 (84.9%) |
| 25 to 34 Years | 848 (91.9%) | 712 (89.1%) |
| 35 to 44 Years | 993 (100.0%) | 839 (91.9%) |
| 45 to 54 Years | 1,194 (97.2%) | 888 (97.5%) |
| 55 to 64 Years | 984 (98.6%) | 882 (95.5%) |
| 65 to 74 Years | 716 (97.0%) | 638 (94.4%) |
| 75 Years and over | 341 (87.2%) | 351 (85.8%) |
| Total | 7,349 (95.9%) | 5,857 (94.0%) |
Income Below Poverty Among Married-Couple Families in Nantucket County
The poverty statistics for married-couple families in Nantucket County show that 1.2% or 32 of the total 2,700 families live below the poverty line. Families with no children have the highest poverty rate of 2.0%, comprising of 32 families. On the other hand, families with 1 or 2 children have the lowest poverty rate of 0.0%, which includes 0 families.
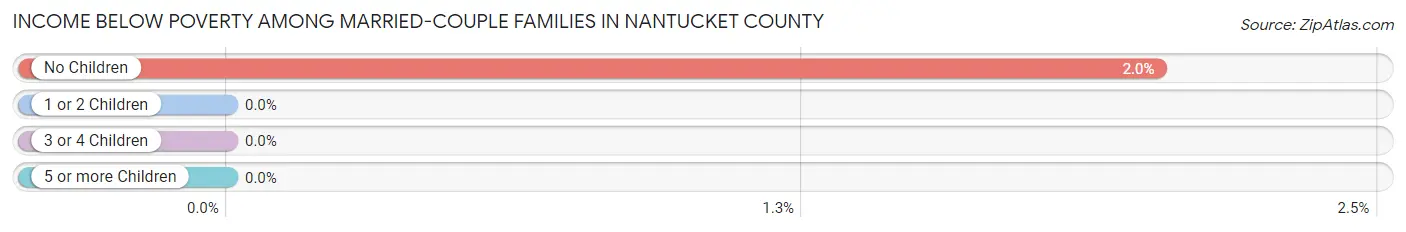
| Children | Above Poverty | Below Poverty |
| No Children | 1,553 (98.0%) | 32 (2.0%) |
| 1 or 2 Children | 980 (100.0%) | 0 (0.0%) |
| 3 or 4 Children | 126 (100.0%) | 0 (0.0%) |
| 5 or more Children | 9 (100.0%) | 0 (0.0%) |
| Total | 2,668 (98.8%) | 32 (1.2%) |
Income Below Poverty Among Single-Parent Households in Nantucket County

| Children | Single Father | Single Mother |
| No Children | 0 (0.0%) | 0 (0.0%) |
| 1 or 2 Children | 0 (0.0%) | 0 (0.0%) |
| 3 or 4 Children | 0 (0.0%) | 0 (0.0%) |
| 5 or more Children | 0 (0.0%) | 0 (0.0%) |
| Total | 0 (0.0%) | 0 (0.0%) |
Income Below Poverty Among Married-Couple vs Single-Parent Households in Nantucket County
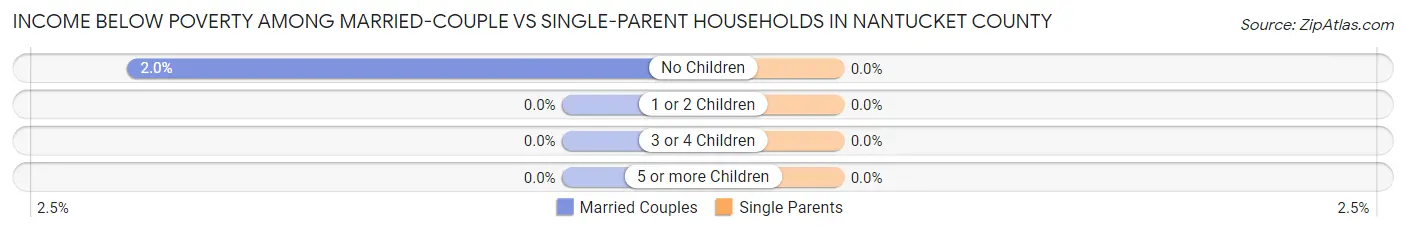
| Children | Married-Couple Families | Single-Parent Households |
| No Children | 32 (2.0%) | 0 (0.0%) |
| 1 or 2 Children | 0 (0.0%) | 0 (0.0%) |
| 3 or 4 Children | 0 (0.0%) | 0 (0.0%) |
| 5 or more Children | 0 (0.0%) | 0 (0.0%) |
| Total | 32 (1.2%) | 0 (0.0%) |
Employment Characteristics in Nantucket County
Employment by Class of Employer in Nantucket County
Among the 7,418 employed individuals in Nantucket County, private company employees (3,686 | 49.7%), self-employed (not incorporated) (1,213 | 16.4%), and not-for-profit organizations (774 | 10.4%) make up the most common classes of employment.
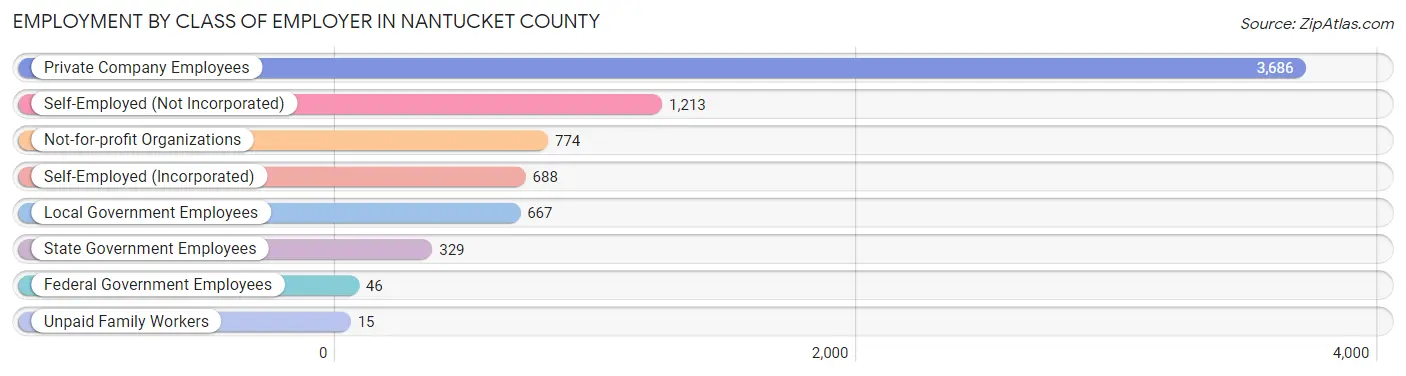
| Employer Class | # Employees | % Employees |
| Private Company Employees | 3,686 | 49.7% |
| Self-Employed (Incorporated) | 688 | 9.3% |
| Self-Employed (Not Incorporated) | 1,213 | 16.4% |
| Not-for-profit Organizations | 774 | 10.4% |
| Local Government Employees | 667 | 9.0% |
| State Government Employees | 329 | 4.4% |
| Federal Government Employees | 46 | 0.6% |
| Unpaid Family Workers | 15 | 0.2% |
| Total | 7,418 | 100.0% |
Employment Status by Age in Nantucket County
According to the labor force statistics for Nantucket County, out of the total population over 16 years of age (11,334), 70.4% or 7,979 individuals are in the labor force, with 5.5% or 439 of them unemployed. The age group with the highest labor force participation rate is 45 to 54 years, with 92.2% or 1,973 individuals in the labor force. Within the labor force, the 20 to 24 years age range has the highest percentage of unemployed individuals, with 26.9% or 159 of them being unemployed.
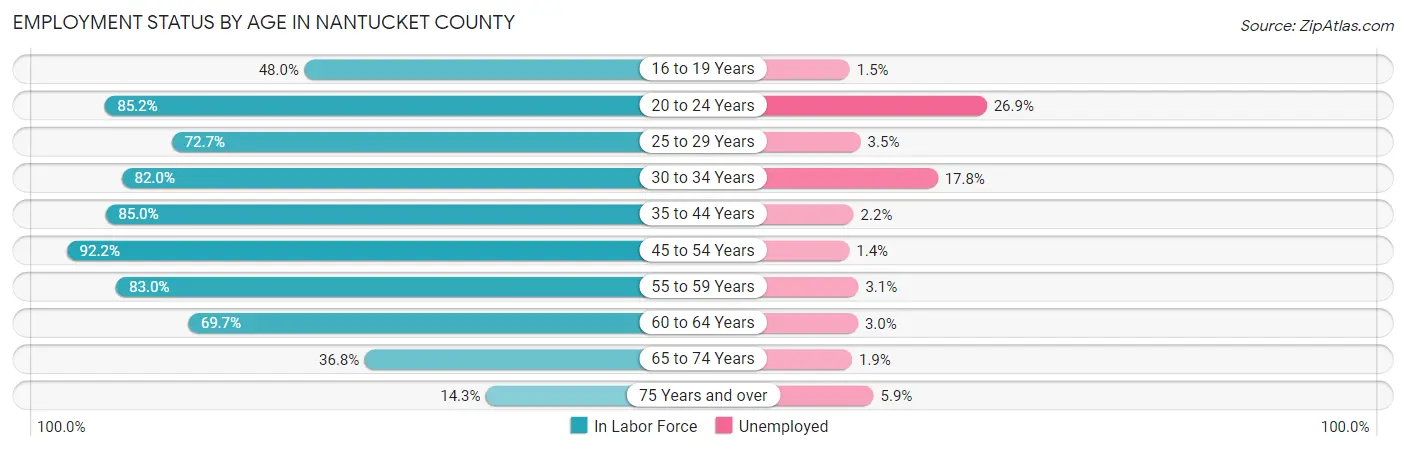
| Age Bracket | In Labor Force | Unemployed |
| 16 to 19 Years | 335 (48.0%) | 5 (1.5%) |
| 20 to 24 Years | 591 (85.2%) | 159 (26.9%) |
| 25 to 29 Years | 597 (72.7%) | 21 (3.5%) |
| 30 to 34 Years | 743 (82.0%) | 132 (17.8%) |
| 35 to 44 Years | 1,620 (85.0%) | 36 (2.2%) |
| 45 to 54 Years | 1,973 (92.2%) | 28 (1.4%) |
| 55 to 59 Years | 812 (83.0%) | 25 (3.1%) |
| 60 to 64 Years | 663 (69.7%) | 20 (3.0%) |
| 65 to 74 Years | 520 (36.8%) | 10 (1.9%) |
| 75 Years and over | 118 (14.3%) | 7 (5.9%) |
| Total | 7,979 (70.4%) | 439 (5.5%) |
Employment Status by Educational Attainment in Nantucket County
According to labor force statistics for Nantucket County, 83.2% of individuals (6,408) out of the total population between 25 and 64 years of age (7,702) are in the labor force, with 4.1% or 263 of them being unemployed. The group with the highest labor force participation rate are those with the educational attainment of college / associate degree, with 89.9% or 1,665 individuals in the labor force. Within the labor force, individuals with high school diploma education have the highest percentage of unemployment, with 6.6% or 62 of them being unemployed.
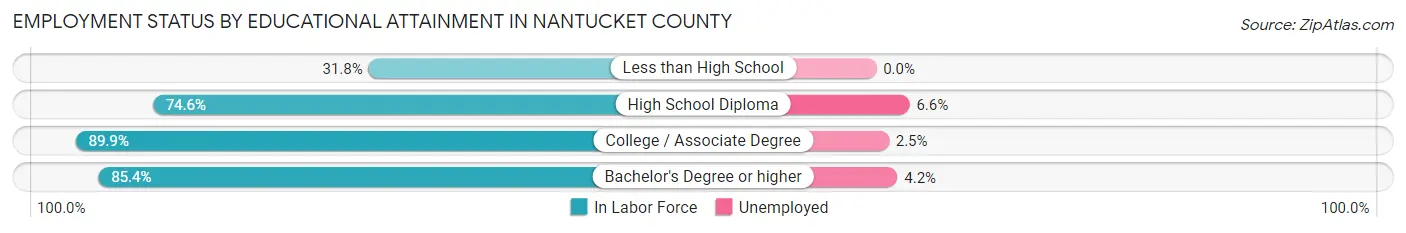
| Educational Attainment | In Labor Force | Unemployed |
| Less than High School | 67 (31.8%) | 0 (0.0%) |
| High School Diploma | 942 (74.6%) | 83 (6.6%) |
| College / Associate Degree | 1,665 (89.9%) | 46 (2.5%) |
| Bachelor's Degree or higher | 3,737 (85.4%) | 184 (4.2%) |
| Total | 6,408 (83.2%) | 316 (4.1%) |
Employment Occupations by Sex in Nantucket County
Management, Business, Science and Arts Occupations
The most common Management, Business, Science and Arts occupations in Nantucket County are Management (1,348 | 17.9%), Community & Social Service (1,148 | 15.2%), Education Instruction & Library (602 | 8.0%), Arts, Media & Entertainment (325 | 4.3%), and Health Diagnosing & Treating (306 | 4.1%).
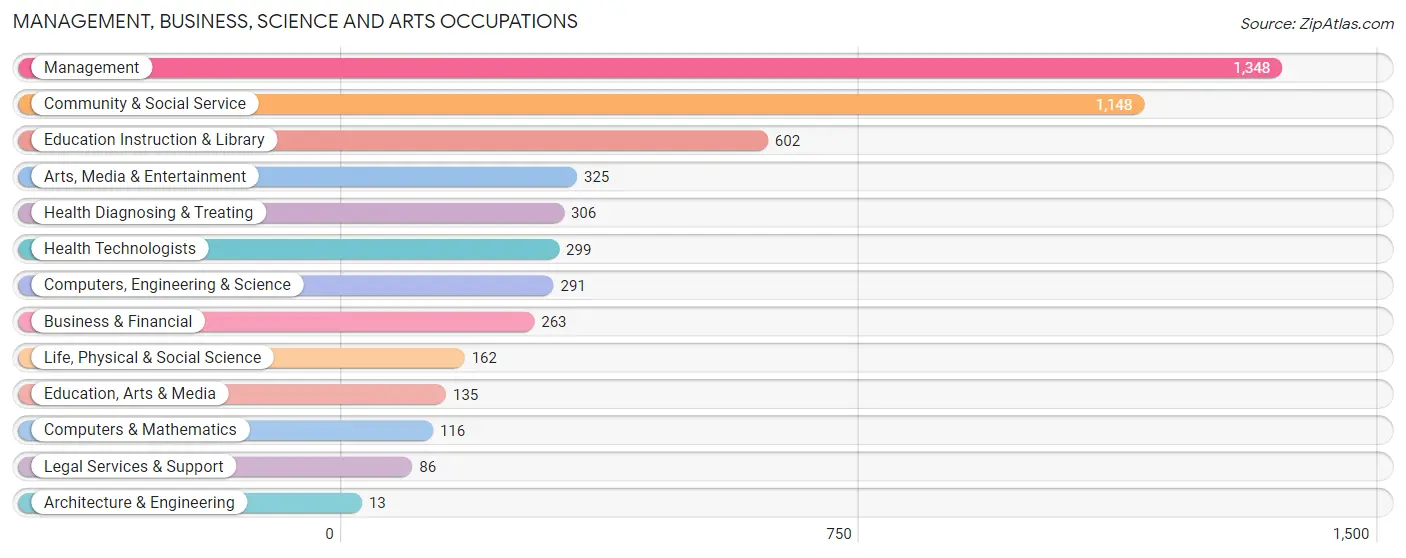
Management, Business, Science and Arts Occupations by Sex
Within the Management, Business, Science and Arts occupations in Nantucket County, the most male-oriented occupations are Computers & Mathematics (100.0%), Architecture & Engineering (100.0%), and Legal Services & Support (63.9%), while the most female-oriented occupations are Health Technologists (90.6%), Health Diagnosing & Treating (88.6%), and Education, Arts & Media (86.7%).
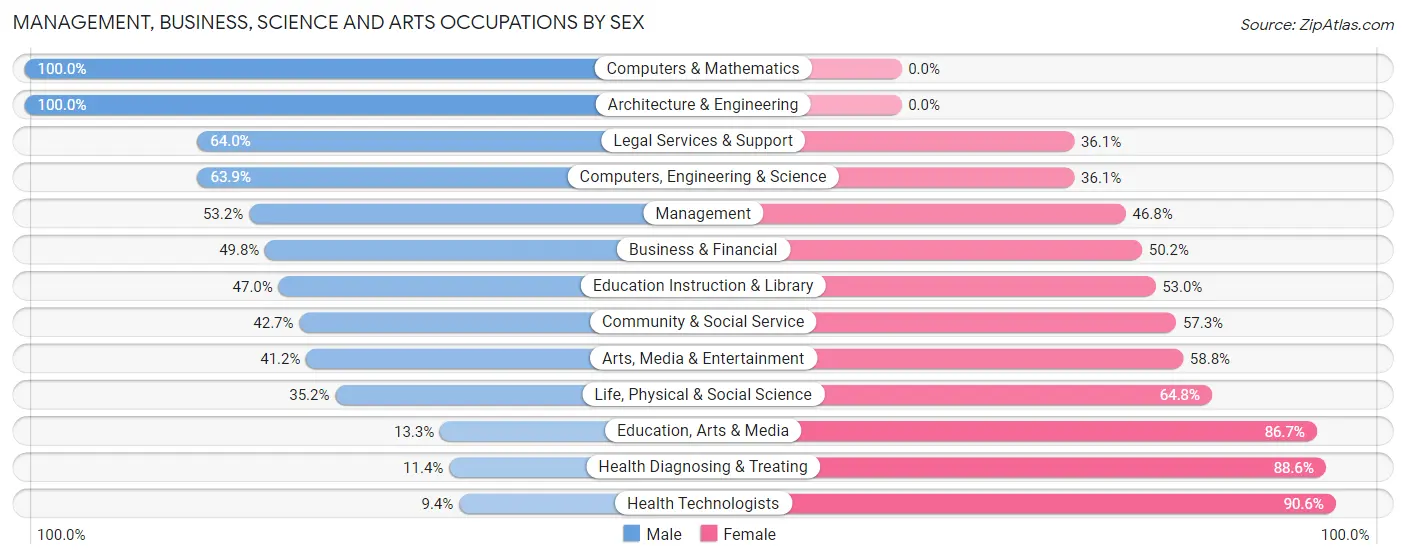
| Occupation | Male | Female |
| Management | 717 (53.2%) | 631 (46.8%) |
| Business & Financial | 131 (49.8%) | 132 (50.2%) |
| Computers, Engineering & Science | 186 (63.9%) | 105 (36.1%) |
| Computers & Mathematics | 116 (100.0%) | 0 (0.0%) |
| Architecture & Engineering | 13 (100.0%) | 0 (0.0%) |
| Life, Physical & Social Science | 57 (35.2%) | 105 (64.8%) |
| Community & Social Service | 490 (42.7%) | 658 (57.3%) |
| Education, Arts & Media | 18 (13.3%) | 117 (86.7%) |
| Legal Services & Support | 55 (63.9%) | 31 (36.0%) |
| Education Instruction & Library | 283 (47.0%) | 319 (53.0%) |
| Arts, Media & Entertainment | 134 (41.2%) | 191 (58.8%) |
| Health Diagnosing & Treating | 35 (11.4%) | 271 (88.6%) |
| Health Technologists | 28 (9.4%) | 271 (90.6%) |
| Total (Category) | 1,559 (46.5%) | 1,797 (53.5%) |
| Total (Overall) | 4,170 (55.4%) | 3,360 (44.6%) |
Services Occupations
The most common Services occupations in Nantucket County are Cleaning & Maintenance (468 | 6.2%), Food Preparation & Serving (318 | 4.2%), Healthcare Support (237 | 3.2%), Personal Care & Service (208 | 2.8%), and Security & Protection (63 | 0.8%).
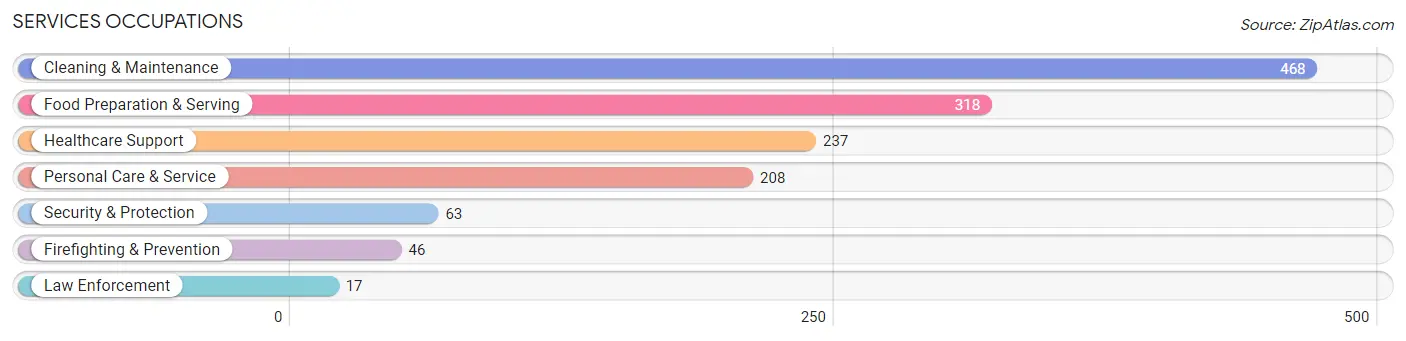
Services Occupations by Sex
Within the Services occupations in Nantucket County, the most male-oriented occupations are Security & Protection (100.0%), Firefighting & Prevention (100.0%), and Law Enforcement (100.0%), while the most female-oriented occupations are Healthcare Support (82.7%), Cleaning & Maintenance (42.7%), and Personal Care & Service (35.1%).
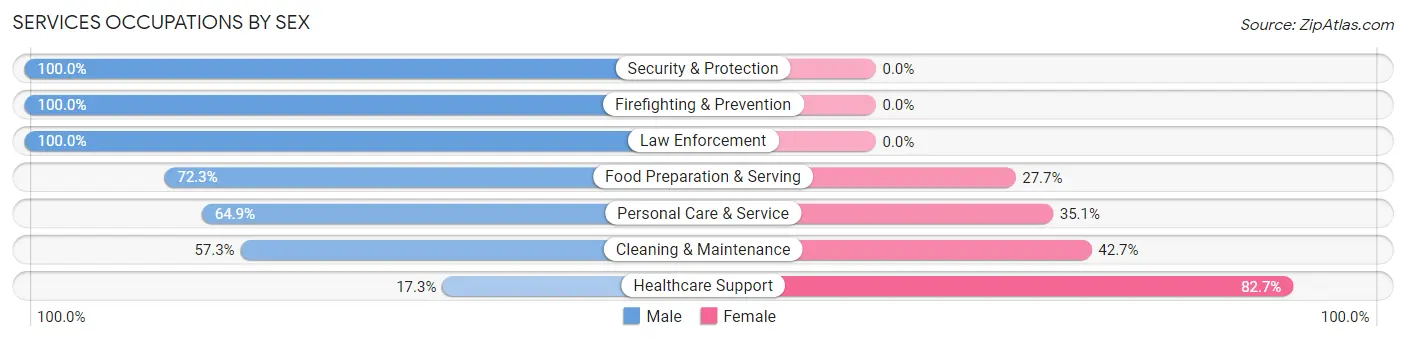
| Occupation | Male | Female |
| Healthcare Support | 41 (17.3%) | 196 (82.7%) |
| Security & Protection | 63 (100.0%) | 0 (0.0%) |
| Firefighting & Prevention | 46 (100.0%) | 0 (0.0%) |
| Law Enforcement | 17 (100.0%) | 0 (0.0%) |
| Food Preparation & Serving | 230 (72.3%) | 88 (27.7%) |
| Cleaning & Maintenance | 268 (57.3%) | 200 (42.7%) |
| Personal Care & Service | 135 (64.9%) | 73 (35.1%) |
| Total (Category) | 737 (57.0%) | 557 (43.0%) |
| Total (Overall) | 4,170 (55.4%) | 3,360 (44.6%) |
Sales and Office Occupations
The most common Sales and Office occupations in Nantucket County are Sales & Related (623 | 8.3%), and Office & Administration (440 | 5.8%).

Sales and Office Occupations by Sex

| Occupation | Male | Female |
| Sales & Related | 158 (25.4%) | 465 (74.6%) |
| Office & Administration | 71 (16.1%) | 369 (83.9%) |
| Total (Category) | 229 (21.5%) | 834 (78.5%) |
| Total (Overall) | 4,170 (55.4%) | 3,360 (44.6%) |
Natural Resources, Construction and Maintenance Occupations
The most common Natural Resources, Construction and Maintenance occupations in Nantucket County are Construction & Extraction (984 | 13.1%), Installation, Maintenance & Repair (146 | 1.9%), and Farming, Fishing & Forestry (56 | 0.7%).
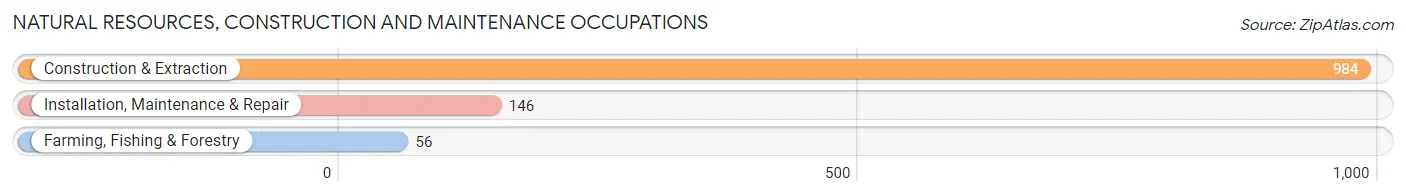
Natural Resources, Construction and Maintenance Occupations by Sex
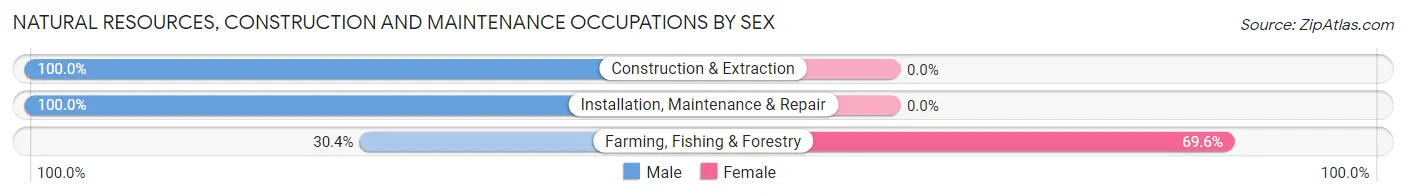
| Occupation | Male | Female |
| Farming, Fishing & Forestry | 17 (30.4%) | 39 (69.6%) |
| Construction & Extraction | 984 (100.0%) | 0 (0.0%) |
| Installation, Maintenance & Repair | 146 (100.0%) | 0 (0.0%) |
| Total (Category) | 1,147 (96.7%) | 39 (3.3%) |
| Total (Overall) | 4,170 (55.4%) | 3,360 (44.6%) |
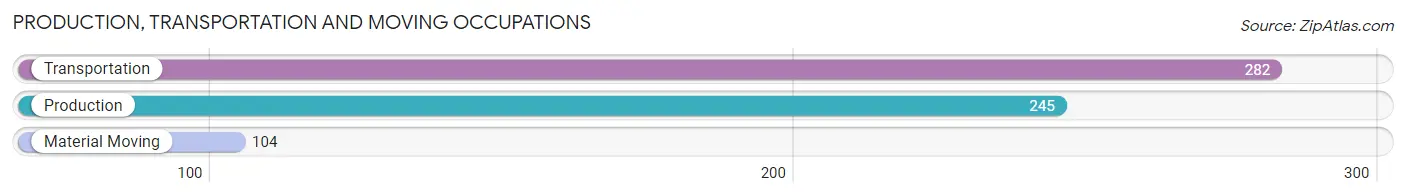
Production, Transportation and Moving Occupations
The most common Production, Transportation and Moving occupations in Nantucket County are Transportation (282 | 3.7%), Production (245 | 3.3%), and Material Moving (104 | 1.4%).
Production, Transportation and Moving Occupations by Sex
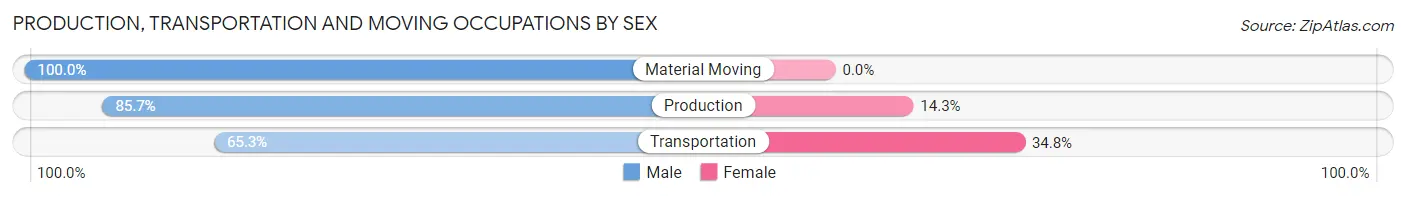
| Occupation | Male | Female |
| Production | 210 (85.7%) | 35 (14.3%) |
| Transportation | 184 (65.2%) | 98 (34.7%) |
| Material Moving | 104 (100.0%) | 0 (0.0%) |
| Total (Category) | 498 (78.9%) | 133 (21.1%) |
| Total (Overall) | 4,170 (55.4%) | 3,360 (44.6%) |
Employment Industries by Sex in Nantucket County
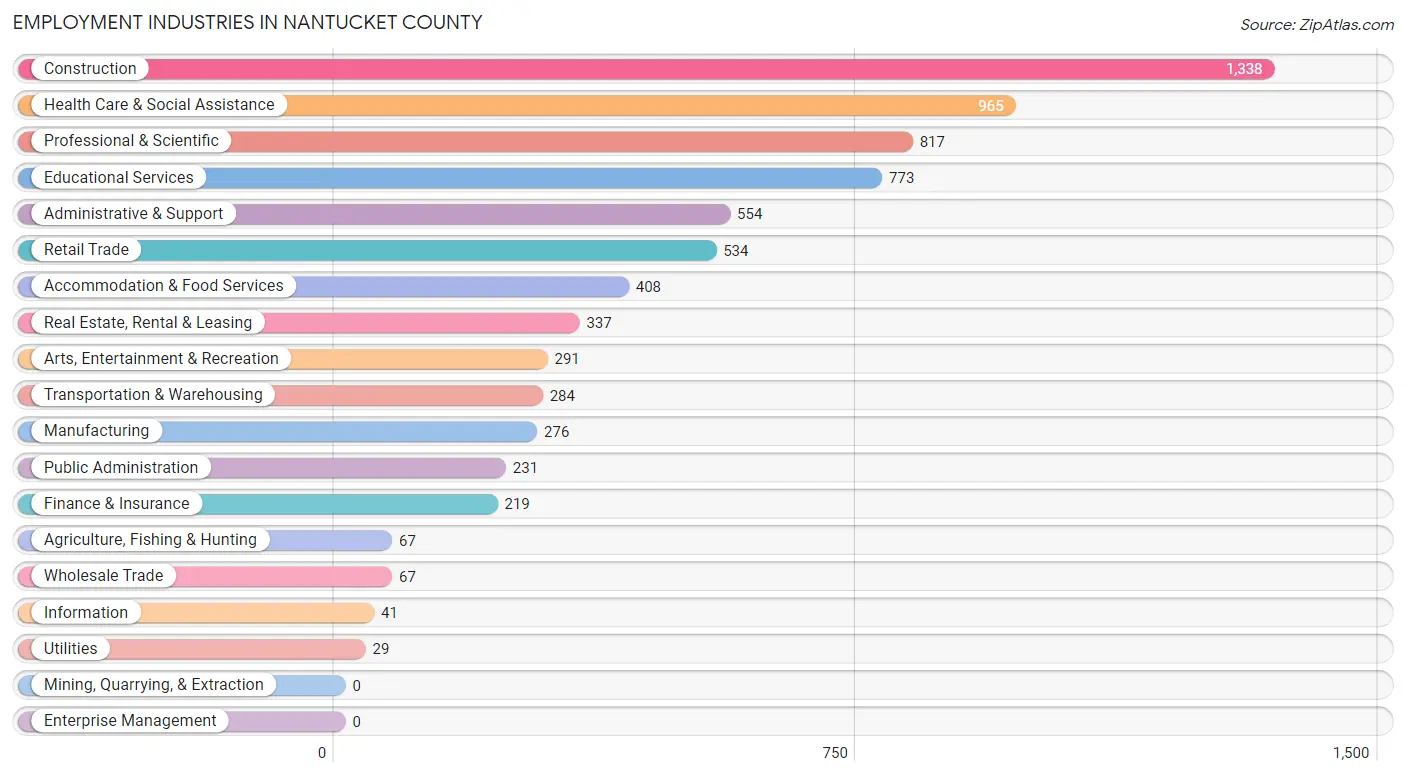
Employment Industries in Nantucket County
The major employment industries in Nantucket County include Construction (1,338 | 17.8%), Health Care & Social Assistance (965 | 12.8%), Professional & Scientific (817 | 10.8%), Educational Services (773 | 10.3%), and Administrative & Support (554 | 7.4%).
Employment Industries by Sex in Nantucket County
The Nantucket County industries that see more men than women are Utilities (100.0%), Manufacturing (94.6%), and Construction (92.7%), whereas the industries that tend to have a higher number of women are Retail Trade (72.3%), Real Estate, Rental & Leasing (65.3%), and Agriculture, Fishing & Hunting (62.7%).
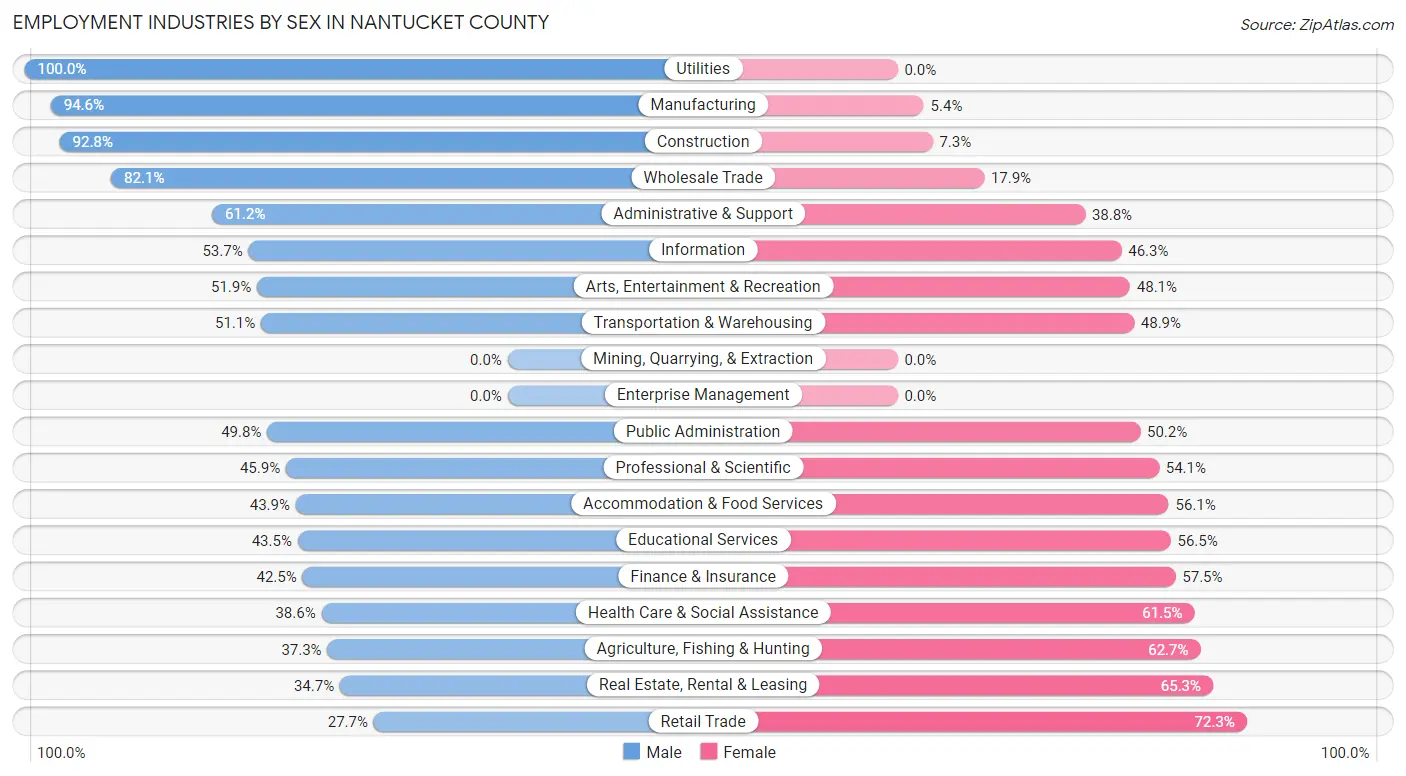
| Industry | Male | Female |
| Agriculture, Fishing & Hunting | 25 (37.3%) | 42 (62.7%) |
| Mining, Quarrying, & Extraction | 0 (0.0%) | 0 (0.0%) |
| Construction | 1,241 (92.7%) | 97 (7.2%) |
| Manufacturing | 261 (94.6%) | 15 (5.4%) |
| Wholesale Trade | 55 (82.1%) | 12 (17.9%) |
| Retail Trade | 148 (27.7%) | 386 (72.3%) |
| Transportation & Warehousing | 145 (51.1%) | 139 (48.9%) |
| Utilities | 29 (100.0%) | 0 (0.0%) |
| Information | 22 (53.7%) | 19 (46.3%) |
| Finance & Insurance | 93 (42.5%) | 126 (57.5%) |
| Real Estate, Rental & Leasing | 117 (34.7%) | 220 (65.3%) |
| Professional & Scientific | 375 (45.9%) | 442 (54.1%) |
| Enterprise Management | 0 (0.0%) | 0 (0.0%) |
| Administrative & Support | 339 (61.2%) | 215 (38.8%) |
| Educational Services | 336 (43.5%) | 437 (56.5%) |
| Health Care & Social Assistance | 372 (38.6%) | 593 (61.5%) |
| Arts, Entertainment & Recreation | 151 (51.9%) | 140 (48.1%) |
| Accommodation & Food Services | 179 (43.9%) | 229 (56.1%) |
| Public Administration | 115 (49.8%) | 116 (50.2%) |
| Total | 4,170 (55.4%) | 3,360 (44.6%) |
Education in Nantucket County
School Enrollment in Nantucket County
The most common levels of schooling among the 3,377 students in Nantucket County are high school (897 | 26.6%), middle school (752 | 22.3%), and elementary school (513 | 15.2%).
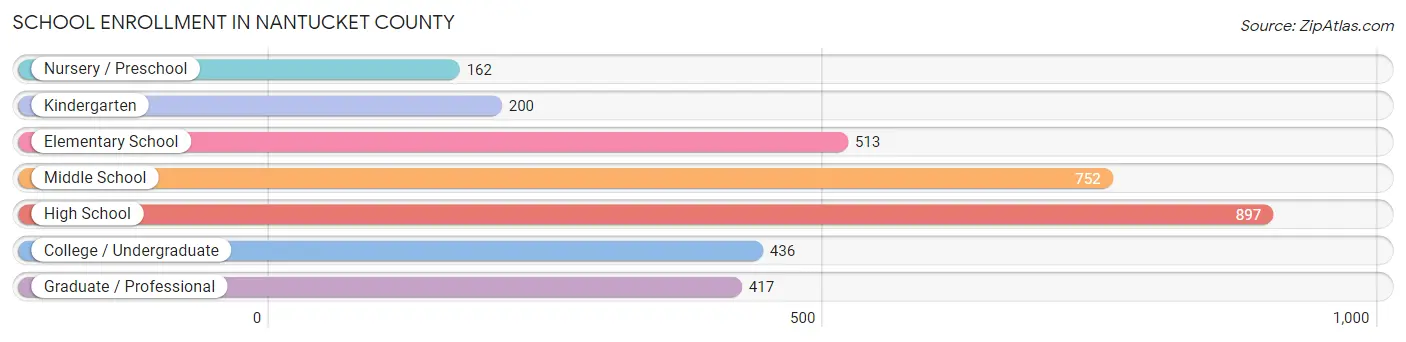
| School Level | # Students | % Students |
| Nursery / Preschool | 162 | 4.8% |
| Kindergarten | 200 | 5.9% |
| Elementary School | 513 | 15.2% |
| Middle School | 752 | 22.3% |
| High School | 897 | 26.6% |
| College / Undergraduate | 436 | 12.9% |
| Graduate / Professional | 417 | 12.3% |
| Total | 3,377 | 100.0% |
School Enrollment by Age by Funding Source in Nantucket County
Out of a total of 3,377 students who are enrolled in schools in Nantucket County, 817 (24.2%) attend a private institution, while the remaining 2,560 (75.8%) are enrolled in public schools. The age group of 25 to 34 year olds has the highest likelihood of being enrolled in private schools, with 77 (70.6% in the age bracket) enrolled. Conversely, the age group of 15 to 17 year olds has the lowest likelihood of being enrolled in a private school, with 708 (99.0% in the age bracket) attending a public institution.
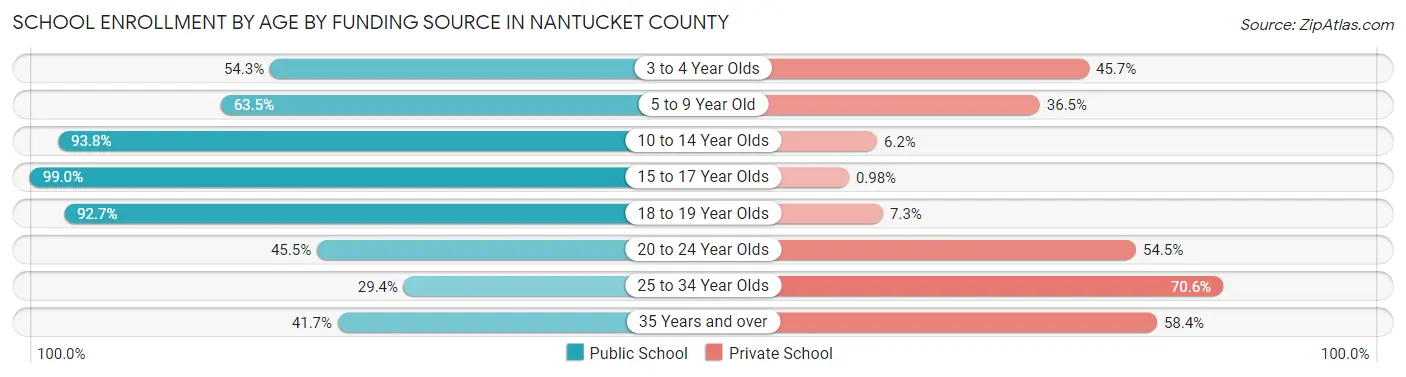
| Age Bracket | Public School | Private School |
| 3 to 4 Year Olds | 57 (54.3%) | 48 (45.7%) |
| 5 to 9 Year Old | 455 (63.5%) | 262 (36.5%) |
| 10 to 14 Year Olds | 843 (93.8%) | 56 (6.2%) |
| 15 to 17 Year Olds | 708 (99.0%) | 7 (1.0%) |
| 18 to 19 Year Olds | 202 (92.7%) | 16 (7.3%) |
| 20 to 24 Year Olds | 97 (45.5%) | 116 (54.5%) |
| 25 to 34 Year Olds | 32 (29.4%) | 77 (70.6%) |
| 35 Years and over | 167 (41.6%) | 234 (58.4%) |
| Total | 2,560 (75.8%) | 817 (24.2%) |
Educational Attainment by Field of Study in Nantucket County
Business (1,002 | 15.8%), social sciences (939 | 14.8%), visual & performing arts (733 | 11.5%), literature & languages (465 | 7.3%), and education (425 | 6.7%) are the most common fields of study among 6,363 individuals in Nantucket County who have obtained a bachelor's degree or higher.
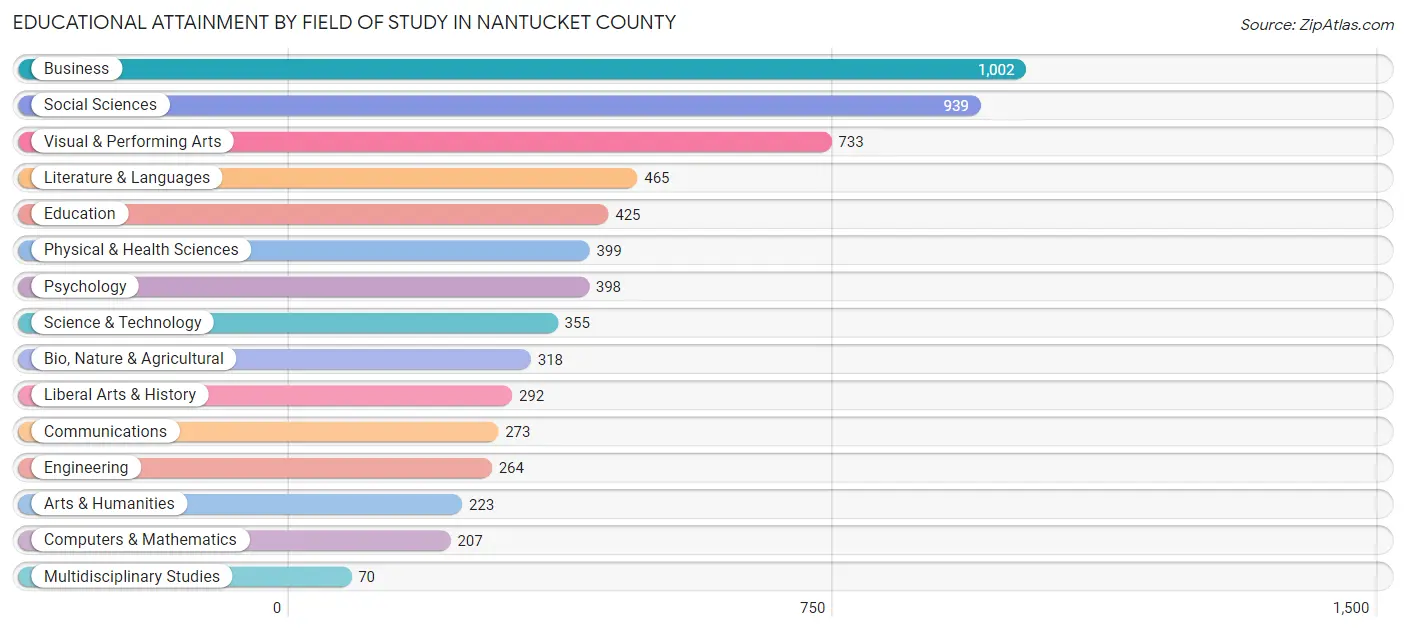
| Field of Study | # Graduates | % Graduates |
| Computers & Mathematics | 207 | 3.3% |
| Bio, Nature & Agricultural | 318 | 5.0% |
| Physical & Health Sciences | 399 | 6.3% |
| Psychology | 398 | 6.2% |
| Social Sciences | 939 | 14.8% |
| Engineering | 264 | 4.2% |
| Multidisciplinary Studies | 70 | 1.1% |
| Science & Technology | 355 | 5.6% |
| Business | 1,002 | 15.8% |
| Education | 425 | 6.7% |
| Literature & Languages | 465 | 7.3% |
| Liberal Arts & History | 292 | 4.6% |
| Visual & Performing Arts | 733 | 11.5% |
| Communications | 273 | 4.3% |
| Arts & Humanities | 223 | 3.5% |
| Total | 6,363 | 100.0% |
Transportation & Commute in Nantucket County
Vehicle Availability by Sex in Nantucket County
The most prevalent vehicle ownership categories in Nantucket County are males with 2 vehicles (1,509, accounting for 37.2%) and females with 2 vehicles (1,456, making up 46.9%).
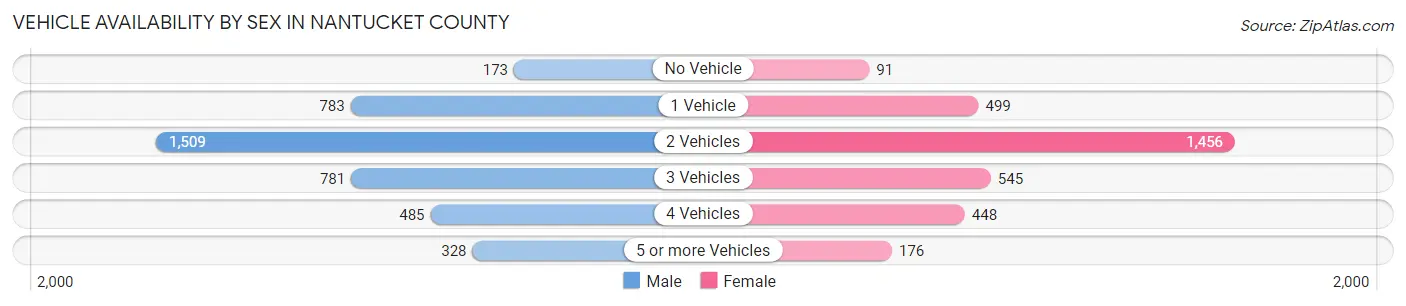
| Vehicles Available | Male | Female |
| No Vehicle | 173 (4.3%) | 91 (2.8%) |
| 1 Vehicle | 783 (19.3%) | 499 (15.5%) |
| 2 Vehicles | 1,509 (37.2%) | 1,456 (45.3%) |
| 3 Vehicles | 781 (19.2%) | 545 (17.0%) |
| 4 Vehicles | 485 (11.9%) | 448 (13.9%) |
| 5 or more Vehicles | 328 (8.1%) | 176 (5.5%) |
| Total | 4,059 (100.0%) | 3,215 (100.0%) |
Commute Time in Nantucket County
The most frequently occuring commute durations in Nantucket County are 10 to 14 minutes (1,757 commuters, 26.4%), 5 to 9 minutes (1,699 commuters, 25.6%), and 15 to 19 minutes (1,508 commuters, 22.7%).
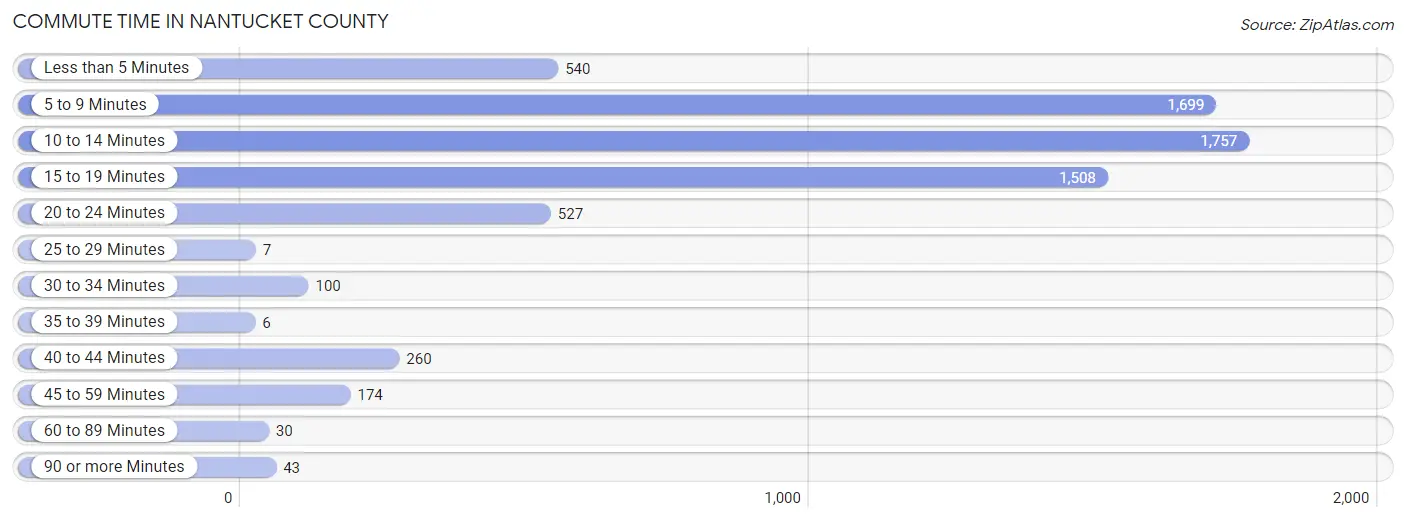
| Commute Time | # Commuters | % Commuters |
| Less than 5 Minutes | 540 | 8.1% |
| 5 to 9 Minutes | 1,699 | 25.6% |
| 10 to 14 Minutes | 1,757 | 26.4% |
| 15 to 19 Minutes | 1,508 | 22.7% |
| 20 to 24 Minutes | 527 | 7.9% |
| 25 to 29 Minutes | 7 | 0.1% |
| 30 to 34 Minutes | 100 | 1.5% |
| 35 to 39 Minutes | 6 | 0.1% |
| 40 to 44 Minutes | 260 | 3.9% |
| 45 to 59 Minutes | 174 | 2.6% |
| 60 to 89 Minutes | 30 | 0.4% |
| 90 or more Minutes | 43 | 0.6% |
Commute Time by Sex in Nantucket County
The most common commute times in Nantucket County are 5 to 9 minutes (961 commuters, 26.1%) for males and 10 to 14 minutes (868 commuters, 29.2%) for females.
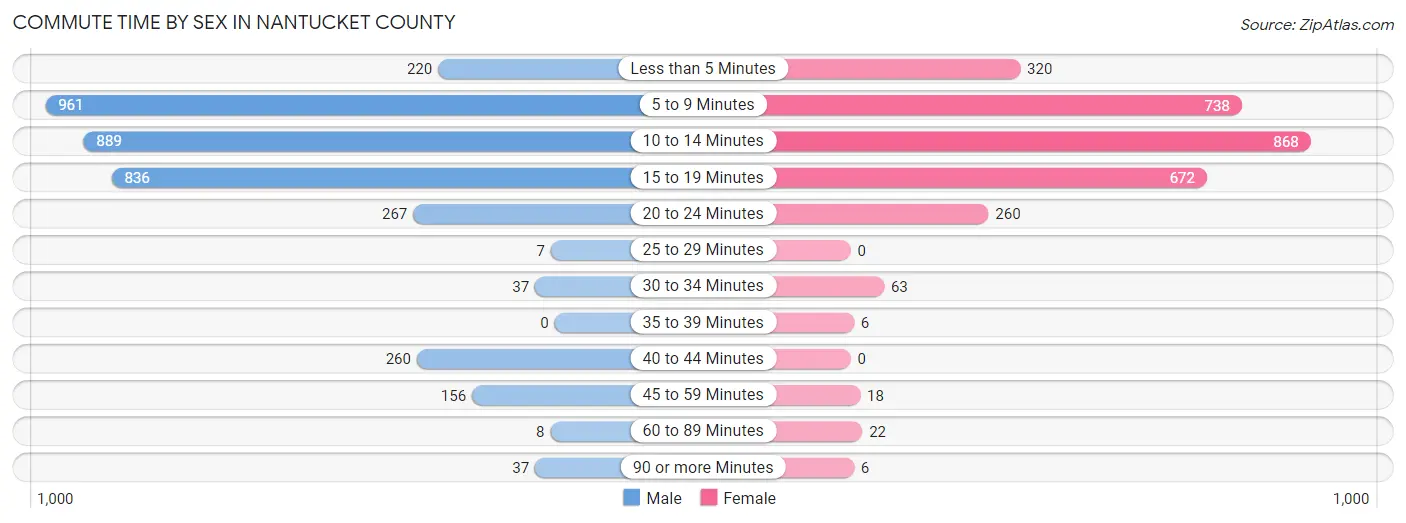
| Commute Time | Male | Female |
| Less than 5 Minutes | 220 (6.0%) | 320 (10.8%) |
| 5 to 9 Minutes | 961 (26.1%) | 738 (24.8%) |
| 10 to 14 Minutes | 889 (24.2%) | 868 (29.2%) |
| 15 to 19 Minutes | 836 (22.7%) | 672 (22.6%) |
| 20 to 24 Minutes | 267 (7.3%) | 260 (8.7%) |
| 25 to 29 Minutes | 7 (0.2%) | 0 (0.0%) |
| 30 to 34 Minutes | 37 (1.0%) | 63 (2.1%) |
| 35 to 39 Minutes | 0 (0.0%) | 6 (0.2%) |
| 40 to 44 Minutes | 260 (7.1%) | 0 (0.0%) |
| 45 to 59 Minutes | 156 (4.2%) | 18 (0.6%) |
| 60 to 89 Minutes | 8 (0.2%) | 22 (0.7%) |
| 90 or more Minutes | 37 (1.0%) | 6 (0.2%) |
Time of Departure to Work by Sex in Nantucket County
The most frequent times of departure to work in Nantucket County are 7:30 AM to 7:59 AM (987, 26.8%) for males and 8:30 AM to 8:59 AM (550, 18.5%) for females.
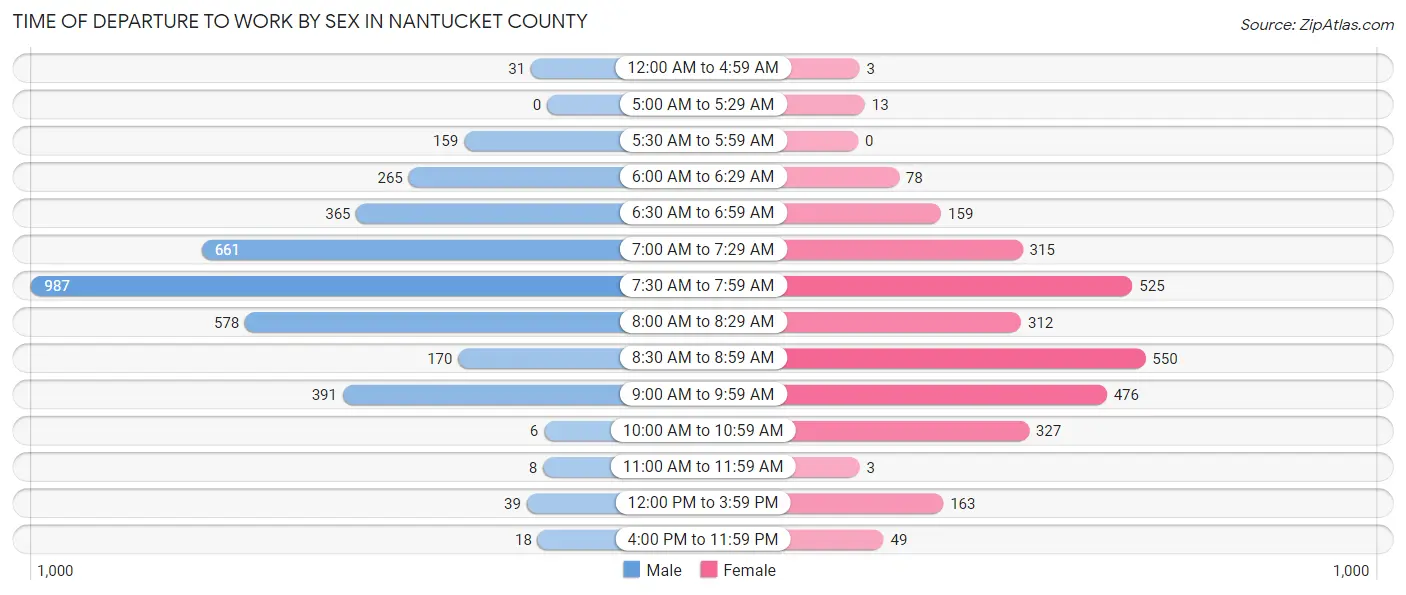
| Time of Departure | Male | Female |
| 12:00 AM to 4:59 AM | 31 (0.8%) | 3 (0.1%) |
| 5:00 AM to 5:29 AM | 0 (0.0%) | 13 (0.4%) |
| 5:30 AM to 5:59 AM | 159 (4.3%) | 0 (0.0%) |
| 6:00 AM to 6:29 AM | 265 (7.2%) | 78 (2.6%) |
| 6:30 AM to 6:59 AM | 365 (9.9%) | 159 (5.3%) |
| 7:00 AM to 7:29 AM | 661 (18.0%) | 315 (10.6%) |
| 7:30 AM to 7:59 AM | 987 (26.8%) | 525 (17.7%) |
| 8:00 AM to 8:29 AM | 578 (15.7%) | 312 (10.5%) |
| 8:30 AM to 8:59 AM | 170 (4.6%) | 550 (18.5%) |
| 9:00 AM to 9:59 AM | 391 (10.6%) | 476 (16.0%) |
| 10:00 AM to 10:59 AM | 6 (0.2%) | 327 (11.0%) |
| 11:00 AM to 11:59 AM | 8 (0.2%) | 3 (0.1%) |
| 12:00 PM to 3:59 PM | 39 (1.1%) | 163 (5.5%) |
| 4:00 PM to 11:59 PM | 18 (0.5%) | 49 (1.7%) |
| Total | 3,678 (100.0%) | 2,973 (100.0%) |
Housing Occupancy in Nantucket County
Occupancy by Ownership in Nantucket County
Of the total 4,659 dwellings in Nantucket County, owner-occupied units account for 3,313 (71.1%), while renter-occupied units make up 1,346 (28.9%).
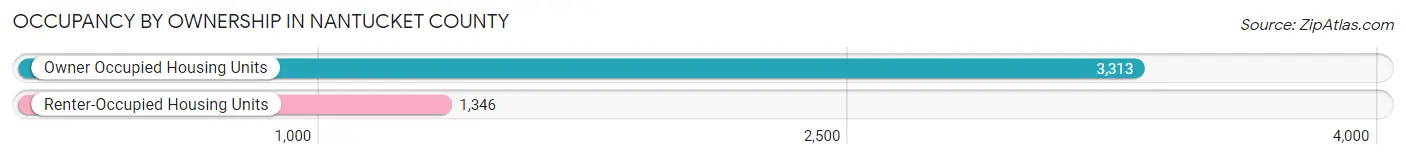
| Occupancy | # Housing Units | % Housing Units |
| Owner Occupied Housing Units | 3,313 | 71.1% |
| Renter-Occupied Housing Units | 1,346 | 28.9% |
| Total Occupied Housing Units | 4,659 | 100.0% |
Occupancy by Household Size in Nantucket County
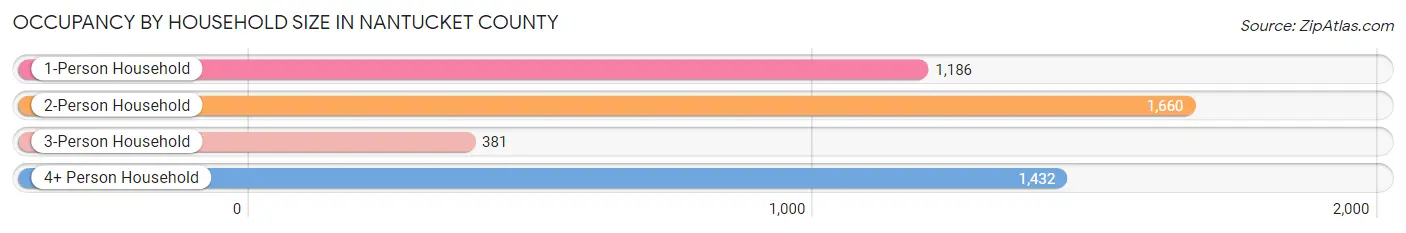
| Household Size | # Housing Units | % Housing Units |
| 1-Person Household | 1,186 | 25.5% |
| 2-Person Household | 1,660 | 35.6% |
| 3-Person Household | 381 | 8.2% |
| 4+ Person Household | 1,432 | 30.7% |
| Total Housing Units | 4,659 | 100.0% |
Occupancy by Ownership by Household Size in Nantucket County
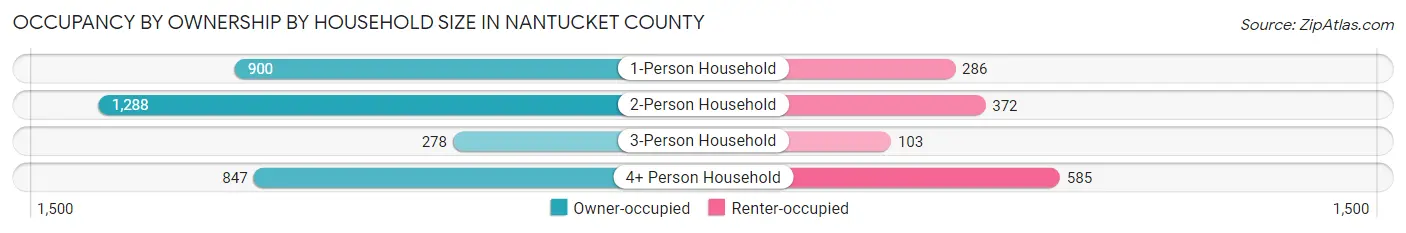
| Household Size | Owner-occupied | Renter-occupied |
| 1-Person Household | 900 (75.9%) | 286 (24.1%) |
| 2-Person Household | 1,288 (77.6%) | 372 (22.4%) |
| 3-Person Household | 278 (73.0%) | 103 (27.0%) |
| 4+ Person Household | 847 (59.2%) | 585 (40.8%) |
| Total Housing Units | 3,313 (71.1%) | 1,346 (28.9%) |
Occupancy by Educational Attainment in Nantucket County
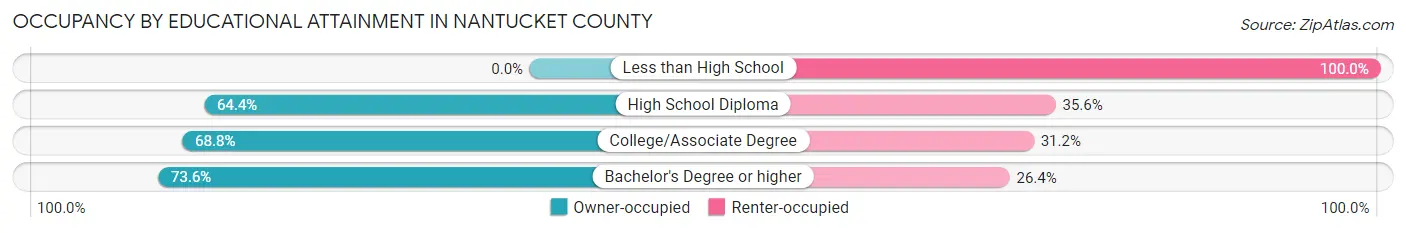
| Household Size | Owner-occupied | Renter-occupied |
| Less than High School | 0 (0.0%) | 7 (100.0%) |
| High School Diploma | 462 (64.4%) | 255 (35.6%) |
| College/Associate Degree | 625 (68.8%) | 284 (31.2%) |
| Bachelor's Degree or higher | 2,226 (73.6%) | 800 (26.4%) |
Occupancy by Age of Householder in Nantucket County
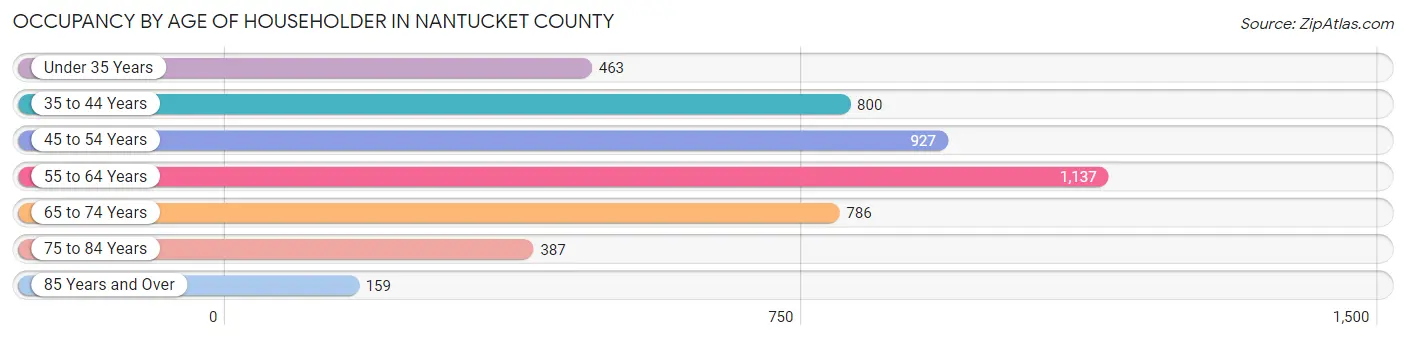
| Age Bracket | # Households | % Households |
| Under 35 Years | 463 | 9.9% |
| 35 to 44 Years | 800 | 17.2% |
| 45 to 54 Years | 927 | 19.9% |
| 55 to 64 Years | 1,137 | 24.4% |
| 65 to 74 Years | 786 | 16.9% |
| 75 to 84 Years | 387 | 8.3% |
| 85 Years and Over | 159 | 3.4% |
| Total | 4,659 | 100.0% |
Housing Finances in Nantucket County
Median Income by Occupancy in Nantucket County
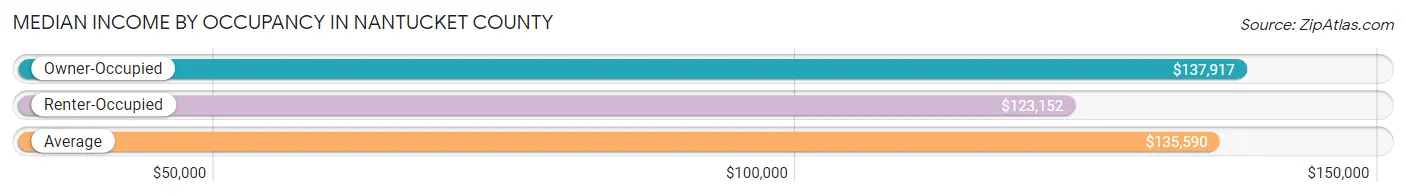
| Occupancy Type | # Households | Median Income |
| Owner-Occupied | 3,313 (71.1%) | $137,917 |
| Renter-Occupied | 1,346 (28.9%) | $123,152 |
| Average | 4,659 (100.0%) | $135,590 |
Occupancy by Householder Income Bracket in Nantucket County
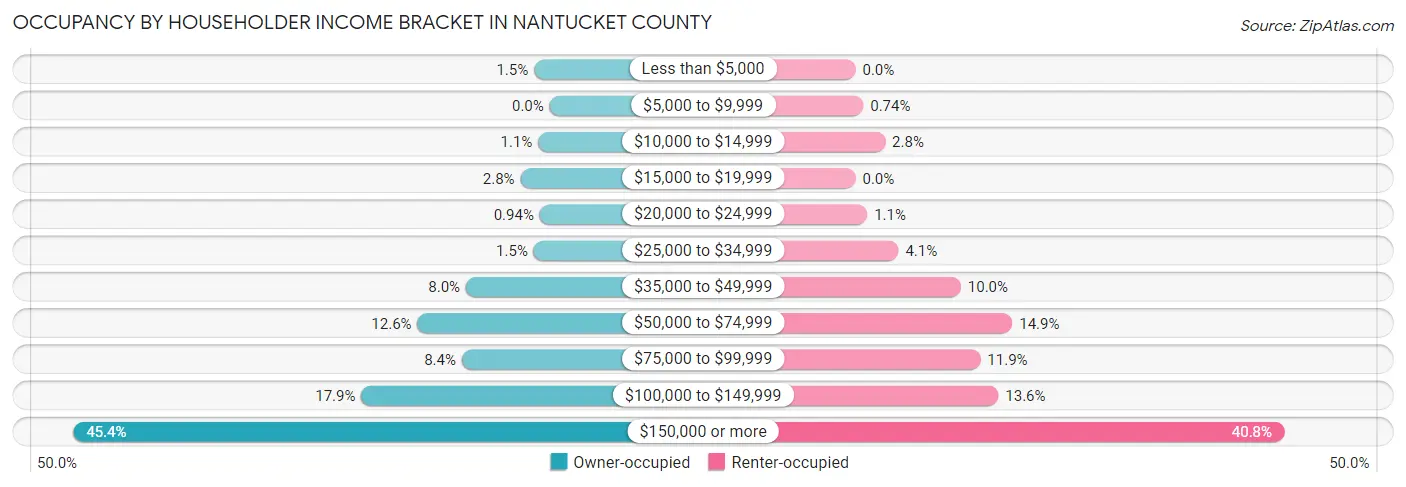
| Income Bracket | Owner-occupied | Renter-occupied |
| Less than $5,000 | 49 (1.5%) | 0 (0.0%) |
| $5,000 to $9,999 | 0 (0.0%) | 10 (0.7%) |
| $10,000 to $14,999 | 36 (1.1%) | 38 (2.8%) |
| $15,000 to $19,999 | 92 (2.8%) | 0 (0.0%) |
| $20,000 to $24,999 | 31 (0.9%) | 15 (1.1%) |
| $25,000 to $34,999 | 50 (1.5%) | 55 (4.1%) |
| $35,000 to $49,999 | 264 (8.0%) | 135 (10.0%) |
| $50,000 to $74,999 | 417 (12.6%) | 201 (14.9%) |
| $75,000 to $99,999 | 277 (8.4%) | 160 (11.9%) |
| $100,000 to $149,999 | 594 (17.9%) | 183 (13.6%) |
| $150,000 or more | 1,503 (45.4%) | 549 (40.8%) |
| Total | 3,313 (100.0%) | 1,346 (100.0%) |
Monthly Housing Cost Tiers in Nantucket County
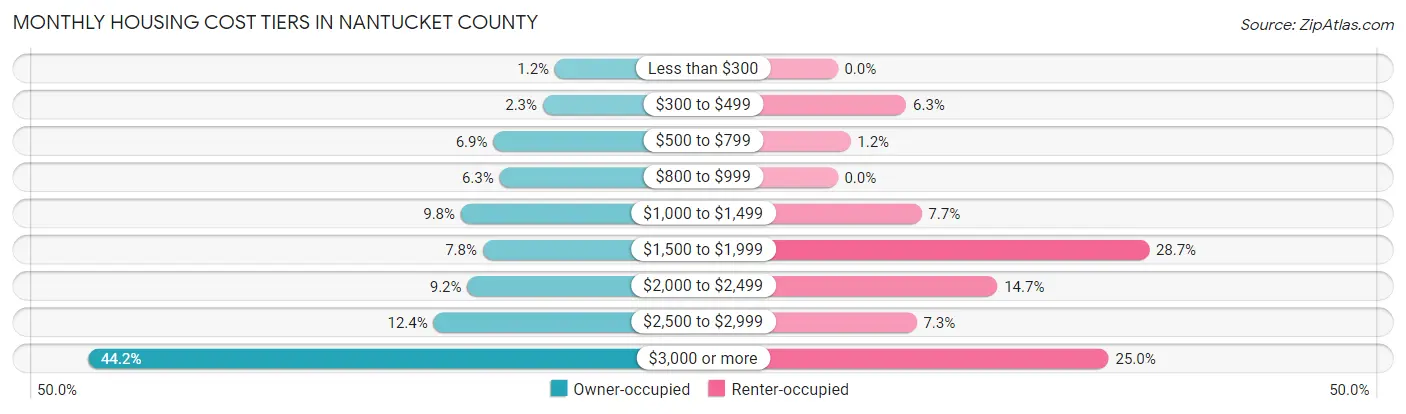
| Monthly Cost | Owner-occupied | Renter-occupied |
| Less than $300 | 39 (1.2%) | 0 (0.0%) |
| $300 to $499 | 76 (2.3%) | 85 (6.3%) |
| $500 to $799 | 227 (6.9%) | 16 (1.2%) |
| $800 to $999 | 208 (6.3%) | 0 (0.0%) |
| $1,000 to $1,499 | 326 (9.8%) | 104 (7.7%) |
| $1,500 to $1,999 | 259 (7.8%) | 386 (28.7%) |
| $2,000 to $2,499 | 306 (9.2%) | 198 (14.7%) |
| $2,500 to $2,999 | 409 (12.3%) | 98 (7.3%) |
| $3,000 or more | 1,463 (44.2%) | 336 (25.0%) |
| Total | 3,313 (100.0%) | 1,346 (100.0%) |
Physical Housing Characteristics in Nantucket County
Housing Structures in Nantucket County
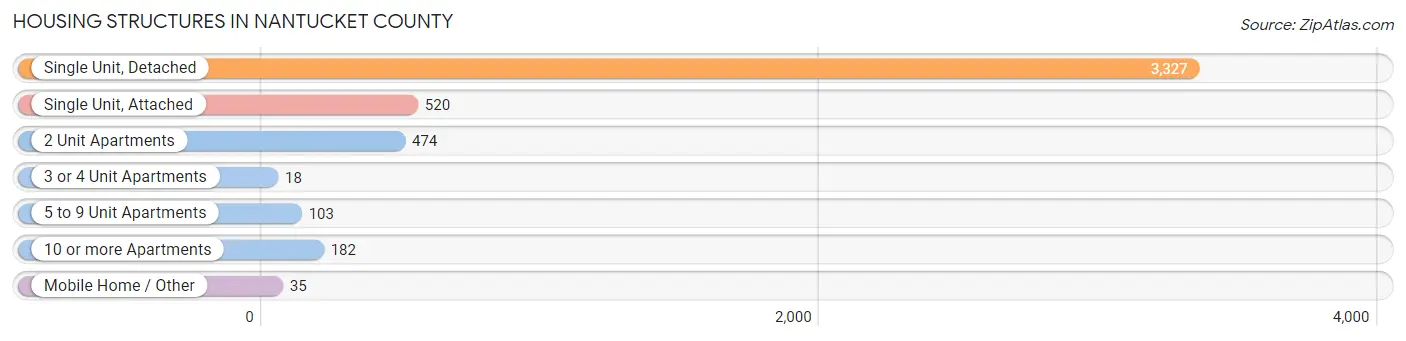
| Structure Type | # Housing Units | % Housing Units |
| Single Unit, Detached | 3,327 | 71.4% |
| Single Unit, Attached | 520 | 11.2% |
| 2 Unit Apartments | 474 | 10.2% |
| 3 or 4 Unit Apartments | 18 | 0.4% |
| 5 to 9 Unit Apartments | 103 | 2.2% |
| 10 or more Apartments | 182 | 3.9% |
| Mobile Home / Other | 35 | 0.7% |
| Total | 4,659 | 100.0% |
Housing Structures by Occupancy in Nantucket County
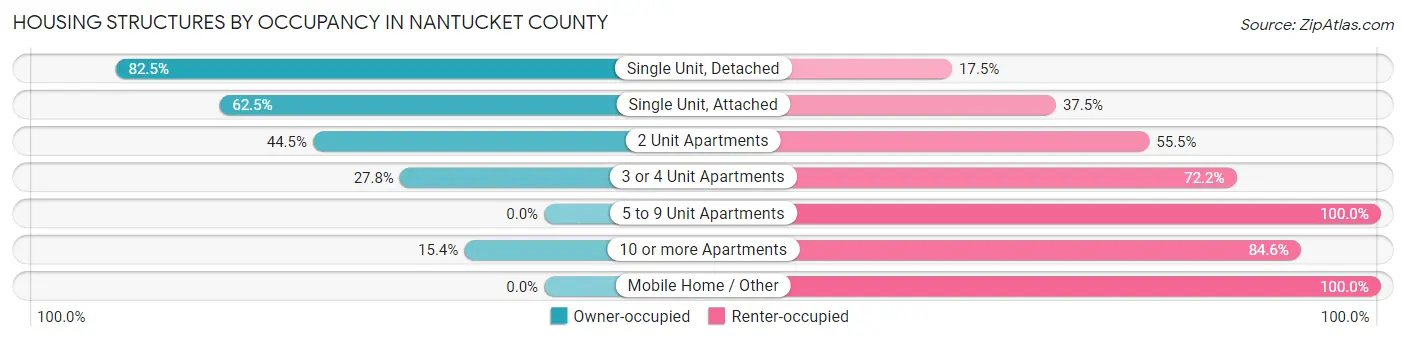
| Structure Type | Owner-occupied | Renter-occupied |
| Single Unit, Detached | 2,744 (82.5%) | 583 (17.5%) |
| Single Unit, Attached | 325 (62.5%) | 195 (37.5%) |
| 2 Unit Apartments | 211 (44.5%) | 263 (55.5%) |
| 3 or 4 Unit Apartments | 5 (27.8%) | 13 (72.2%) |
| 5 to 9 Unit Apartments | 0 (0.0%) | 103 (100.0%) |
| 10 or more Apartments | 28 (15.4%) | 154 (84.6%) |
| Mobile Home / Other | 0 (0.0%) | 35 (100.0%) |
| Total | 3,313 (71.1%) | 1,346 (28.9%) |
Housing Structures by Number of Rooms in Nantucket County
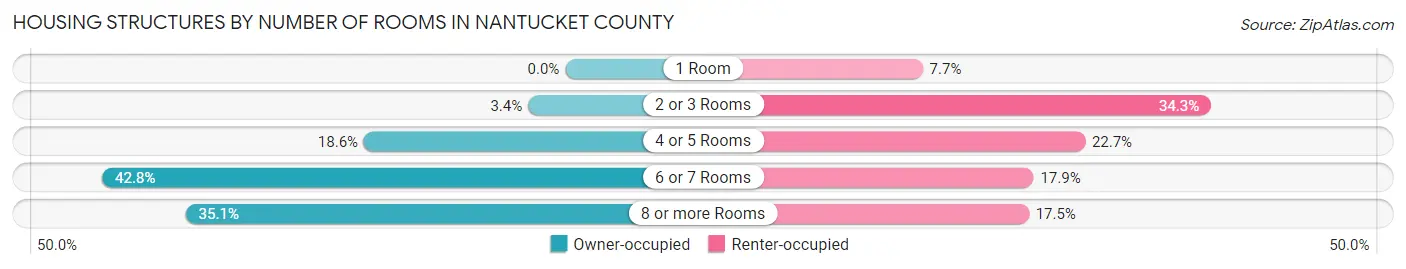
| Number of Rooms | Owner-occupied | Renter-occupied |
| 1 Room | 0 (0.0%) | 103 (7.6%) |
| 2 or 3 Rooms | 114 (3.4%) | 462 (34.3%) |
| 4 or 5 Rooms | 617 (18.6%) | 305 (22.7%) |
| 6 or 7 Rooms | 1,419 (42.8%) | 241 (17.9%) |
| 8 or more Rooms | 1,163 (35.1%) | 235 (17.5%) |
| Total | 3,313 (100.0%) | 1,346 (100.0%) |
Housing Structure by Heating Type in Nantucket County
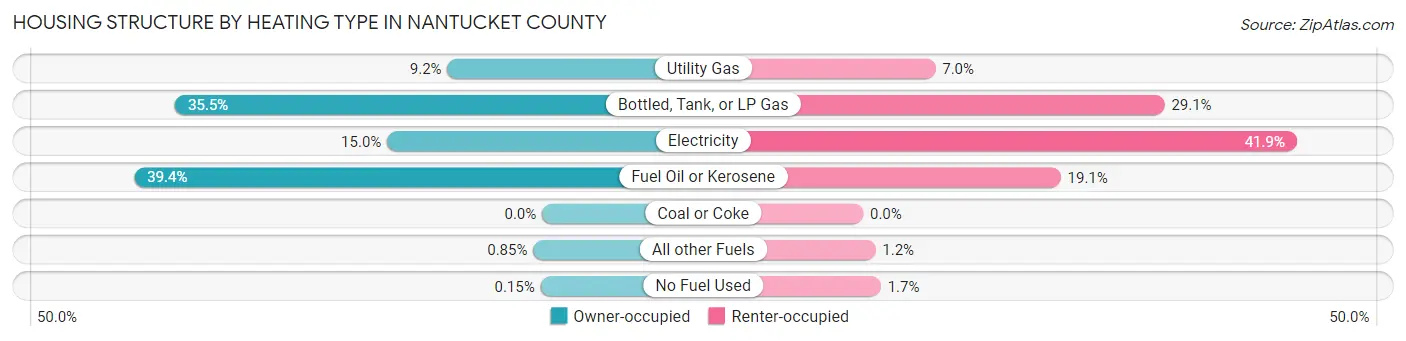
| Heating Type | Owner-occupied | Renter-occupied |
| Utility Gas | 303 (9.1%) | 94 (7.0%) |
| Bottled, Tank, or LP Gas | 1,175 (35.5%) | 392 (29.1%) |
| Electricity | 496 (15.0%) | 564 (41.9%) |
| Fuel Oil or Kerosene | 1,306 (39.4%) | 257 (19.1%) |
| Coal or Coke | 0 (0.0%) | 0 (0.0%) |
| All other Fuels | 28 (0.9%) | 16 (1.2%) |
| No Fuel Used | 5 (0.2%) | 23 (1.7%) |
| Total | 3,313 (100.0%) | 1,346 (100.0%) |
Household Vehicle Usage in Nantucket County
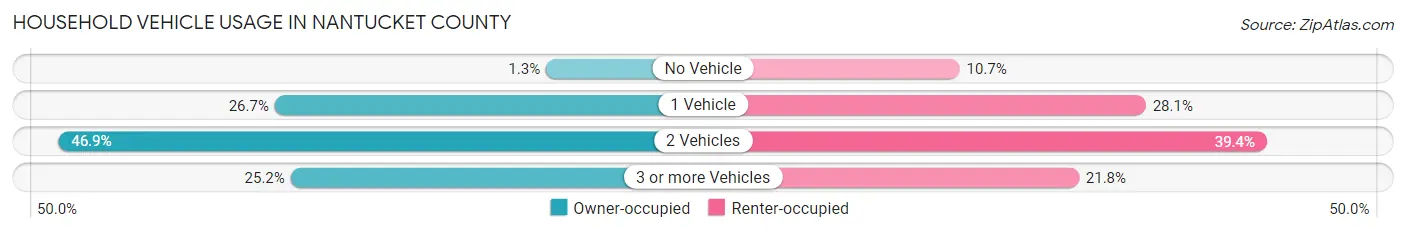
| Vehicles per Household | Owner-occupied | Renter-occupied |
| No Vehicle | 44 (1.3%) | 144 (10.7%) |
| 1 Vehicle | 883 (26.7%) | 378 (28.1%) |
| 2 Vehicles | 1,552 (46.9%) | 530 (39.4%) |
| 3 or more Vehicles | 834 (25.2%) | 294 (21.8%) |
| Total | 3,313 (100.0%) | 1,346 (100.0%) |
Real Estate & Mortgages in Nantucket County
Real Estate and Mortgage Overview in Nantucket County
| Characteristic | Without Mortgage | With Mortgage |
| Housing Units | 1,123 | 2,190 |
| Median Property Value | $1,425,700 | $1,230,200 |
| Median Household Income | $110,250 | $1,079 |
| Monthly Housing Costs | $1,078 | $1,449 |
| Real Estate Taxes | $3,766 | $0 |
Property Value by Mortgage Status in Nantucket County
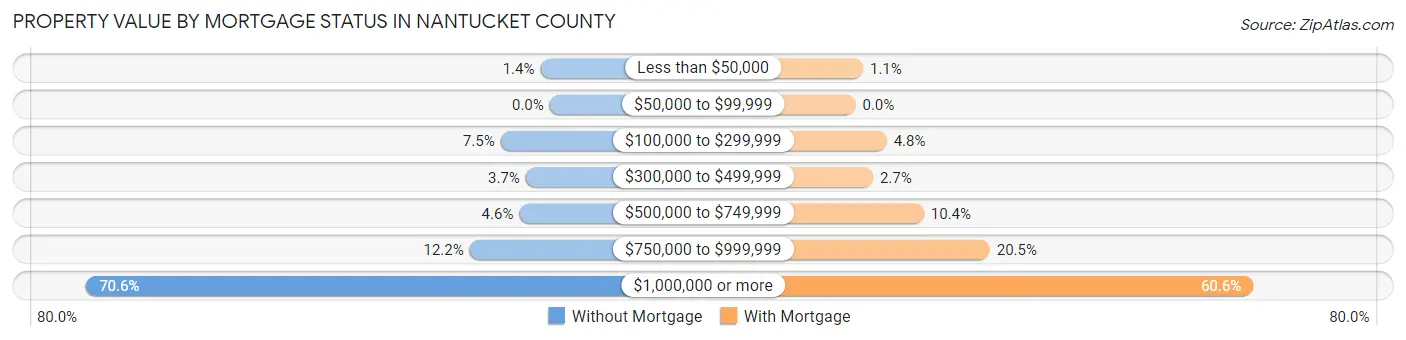
| Property Value | Without Mortgage | With Mortgage |
| Less than $50,000 | 16 (1.4%) | 25 (1.1%) |
| $50,000 to $99,999 | 0 (0.0%) | 0 (0.0%) |
| $100,000 to $299,999 | 84 (7.5%) | 104 (4.8%) |
| $300,000 to $499,999 | 41 (3.6%) | 58 (2.6%) |
| $500,000 to $749,999 | 52 (4.6%) | 228 (10.4%) |
| $750,000 to $999,999 | 137 (12.2%) | 448 (20.5%) |
| $1,000,000 or more | 793 (70.6%) | 1,327 (60.6%) |
| Total | 1,123 (100.0%) | 2,190 (100.0%) |
Household Income by Mortgage Status in Nantucket County
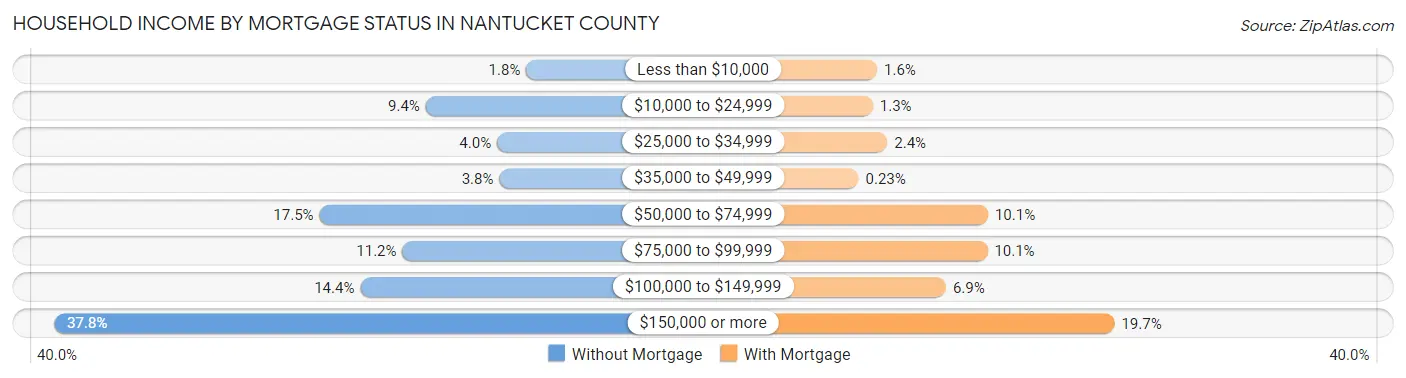
| Household Income | Without Mortgage | With Mortgage |
| Less than $10,000 | 20 (1.8%) | 36 (1.6%) |
| $10,000 to $24,999 | 106 (9.4%) | 29 (1.3%) |
| $25,000 to $34,999 | 45 (4.0%) | 53 (2.4%) |
| $35,000 to $49,999 | 43 (3.8%) | 5 (0.2%) |
| $50,000 to $74,999 | 197 (17.5%) | 221 (10.1%) |
| $75,000 to $99,999 | 126 (11.2%) | 220 (10.1%) |
| $100,000 to $149,999 | 162 (14.4%) | 151 (6.9%) |
| $150,000 or more | 424 (37.8%) | 432 (19.7%) |
| Total | 1,123 (100.0%) | 2,190 (100.0%) |
Property Value to Household Income Ratio in Nantucket County
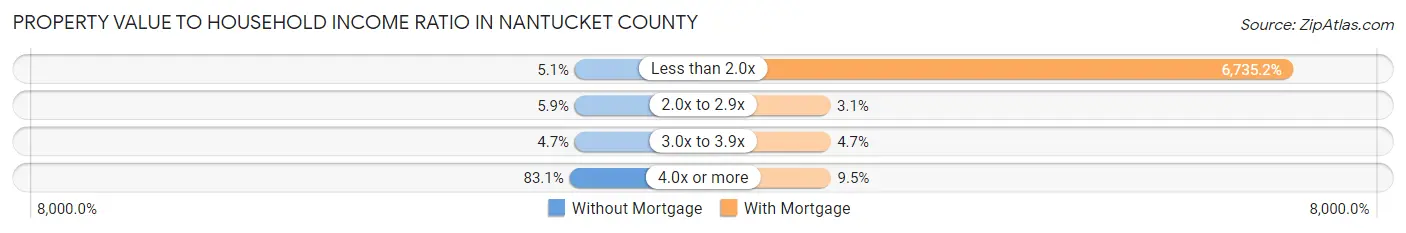
| Value-to-Income Ratio | Without Mortgage | With Mortgage |
| Less than 2.0x | 57 (5.1%) | 147,500 (6,735.2%) |
| 2.0x to 2.9x | 66 (5.9%) | 68 (3.1%) |
| 3.0x to 3.9x | 53 (4.7%) | 103 (4.7%) |
| 4.0x or more | 933 (83.1%) | 209 (9.5%) |
| Total | 1,123 (100.0%) | 2,190 (100.0%) |
Real Estate Taxes by Mortgage Status in Nantucket County
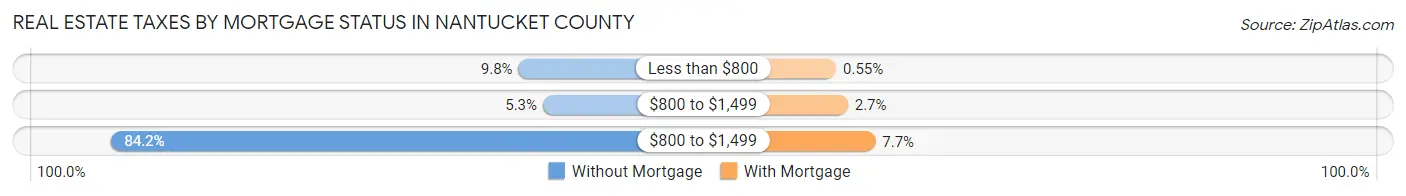
| Property Taxes | Without Mortgage | With Mortgage |
| Less than $800 | 110 (9.8%) | 12 (0.5%) |
| $800 to $1,499 | 60 (5.3%) | 59 (2.7%) |
| $800 to $1,499 | 945 (84.2%) | 169 (7.7%) |
| Total | 1,123 (100.0%) | 2,190 (100.0%) |
Health & Disability in Nantucket County
Health Insurance Coverage by Age in Nantucket County
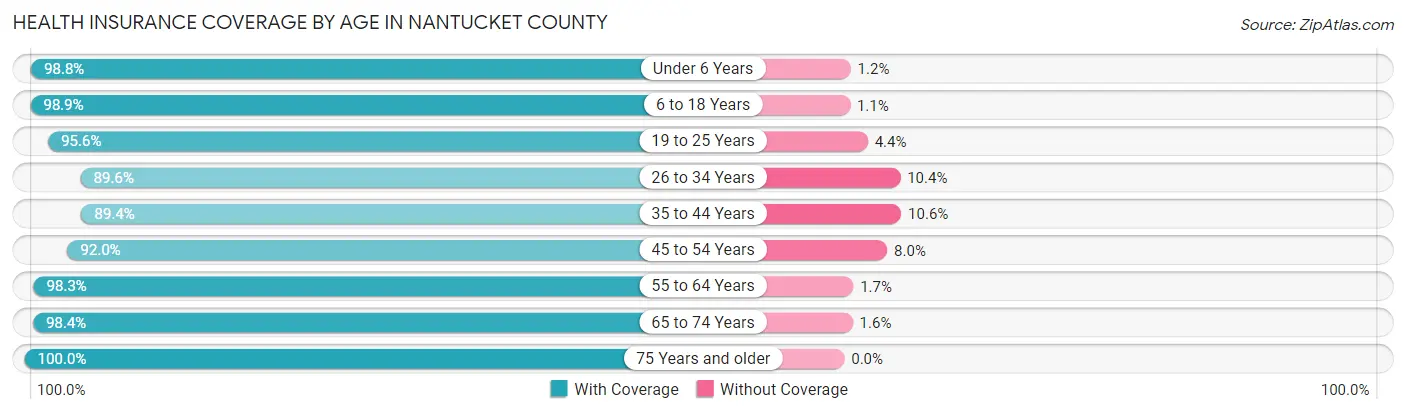
| Age Bracket | With Coverage | Without Coverage |
| Under 6 Years | 916 (98.8%) | 11 (1.2%) |
| 6 to 18 Years | 2,437 (98.9%) | 26 (1.1%) |
| 19 to 25 Years | 985 (95.6%) | 45 (4.4%) |
| 26 to 34 Years | 1,279 (89.6%) | 149 (10.4%) |
| 35 to 44 Years | 1,704 (89.4%) | 202 (10.6%) |
| 45 to 54 Years | 1,969 (92.0%) | 171 (8.0%) |
| 55 to 64 Years | 1,890 (98.3%) | 32 (1.7%) |
| 65 to 74 Years | 1,392 (98.4%) | 22 (1.6%) |
| 75 Years and older | 800 (100.0%) | 0 (0.0%) |
| Total | 13,372 (95.3%) | 658 (4.7%) |
Health Insurance Coverage by Citizenship Status in Nantucket County
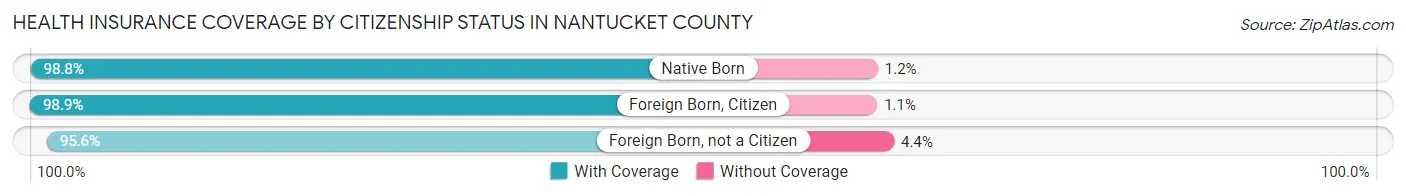
| Citizenship Status | With Coverage | Without Coverage |
| Native Born | 916 (98.8%) | 11 (1.2%) |
| Foreign Born, Citizen | 2,437 (98.9%) | 26 (1.1%) |
| Foreign Born, not a Citizen | 985 (95.6%) | 45 (4.4%) |
Health Insurance Coverage by Household Income in Nantucket County
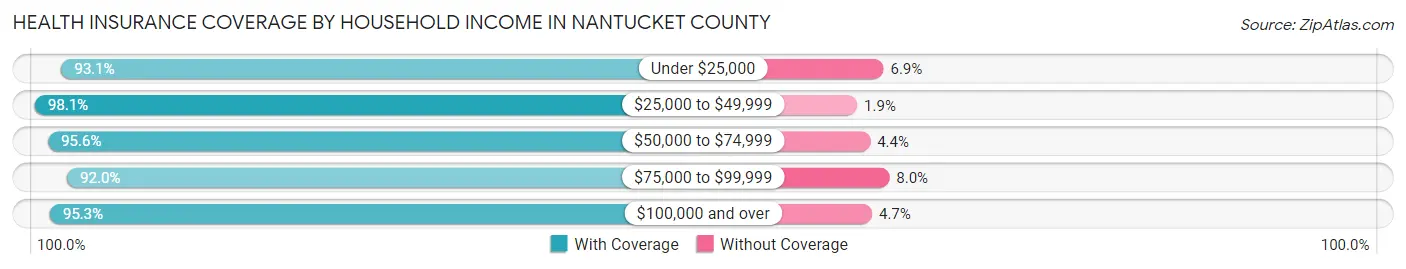
| Household Income | With Coverage | Without Coverage |
| Under $25,000 | 352 (93.1%) | 26 (6.9%) |
| $25,000 to $49,999 | 1,012 (98.1%) | 20 (1.9%) |
| $50,000 to $74,999 | 1,481 (95.6%) | 68 (4.4%) |
| $75,000 to $99,999 | 899 (92.0%) | 78 (8.0%) |
| $100,000 and over | 9,381 (95.3%) | 466 (4.7%) |
Public vs Private Health Insurance Coverage by Age in Nantucket County
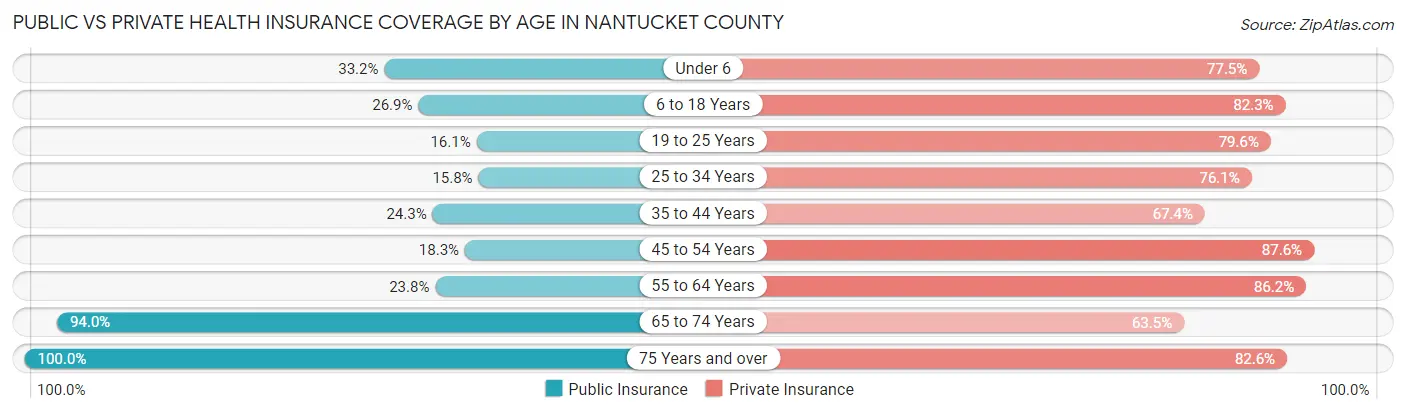
| Age Bracket | Public Insurance | Private Insurance |
| Under 6 | 308 (33.2%) | 718 (77.4%) |
| 6 to 18 Years | 663 (26.9%) | 2,028 (82.3%) |
| 19 to 25 Years | 166 (16.1%) | 820 (79.6%) |
| 25 to 34 Years | 225 (15.8%) | 1,086 (76.0%) |
| 35 to 44 Years | 463 (24.3%) | 1,284 (67.4%) |
| 45 to 54 Years | 391 (18.3%) | 1,875 (87.6%) |
| 55 to 64 Years | 457 (23.8%) | 1,656 (86.2%) |
| 65 to 74 Years | 1,329 (94.0%) | 898 (63.5%) |
| 75 Years and over | 800 (100.0%) | 661 (82.6%) |
| Total | 4,802 (34.2%) | 11,026 (78.6%) |
Disability Status by Sex by Age in Nantucket County
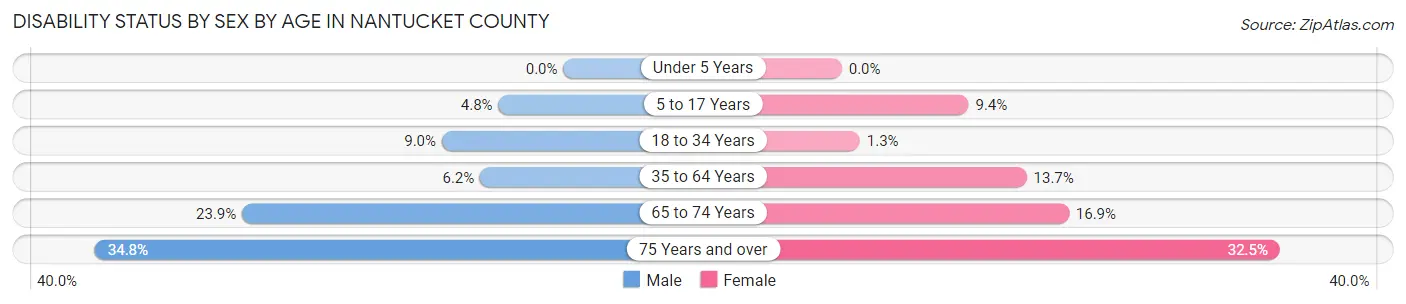
| Age Bracket | Male | Female |
| Under 5 Years | 0 (0.0%) | 0 (0.0%) |
| 5 to 17 Years | 73 (4.8%) | 90 (9.4%) |
| 18 to 34 Years | 130 (9.0%) | 16 (1.3%) |
| 35 to 64 Years | 199 (6.2%) | 377 (13.7%) |
| 65 to 74 Years | 176 (23.8%) | 114 (16.9%) |
| 75 Years and over | 136 (34.8%) | 133 (32.5%) |
Disability Class by Sex by Age in Nantucket County
Disability Class: Hearing Difficulty
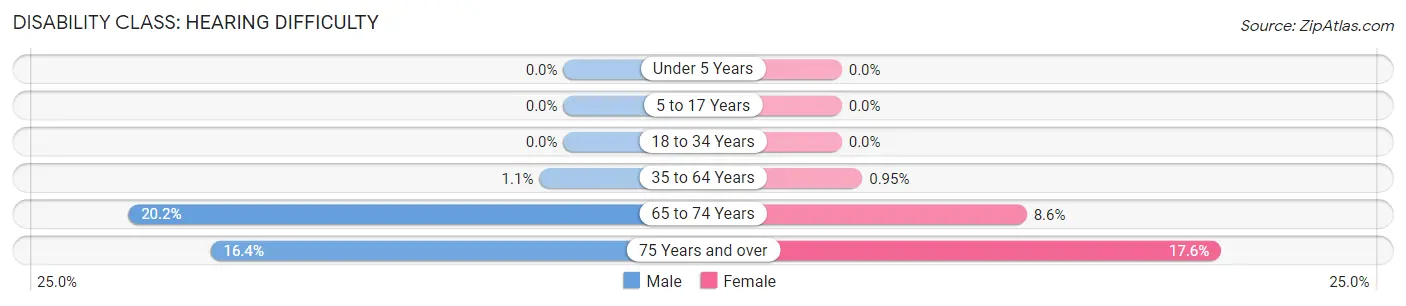
| Age Bracket | Male | Female |
| Under 5 Years | 0 (0.0%) | 0 (0.0%) |
| 5 to 17 Years | 0 (0.0%) | 0 (0.0%) |
| 18 to 34 Years | 0 (0.0%) | 0 (0.0%) |
| 35 to 64 Years | 36 (1.1%) | 26 (0.9%) |
| 65 to 74 Years | 149 (20.2%) | 58 (8.6%) |
| 75 Years and over | 64 (16.4%) | 72 (17.6%) |
Disability Class: Vision Difficulty
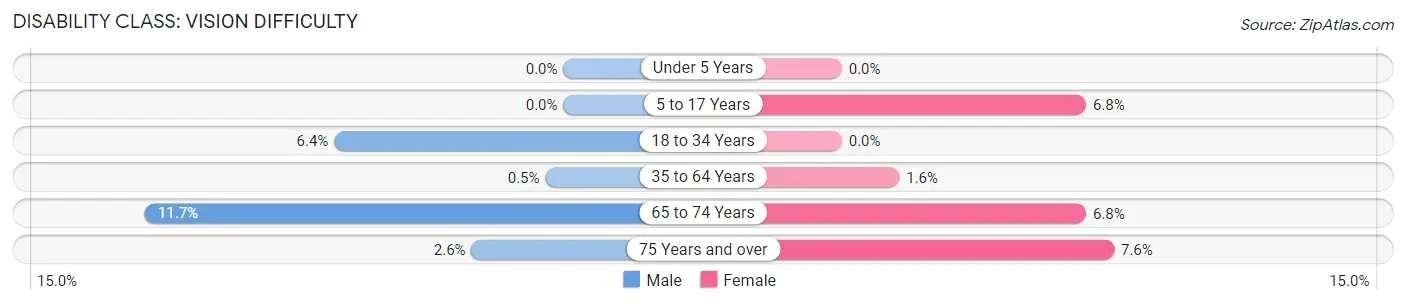
| Age Bracket | Male | Female |
| Under 5 Years | 0 (0.0%) | 0 (0.0%) |
| 5 to 17 Years | 0 (0.0%) | 65 (6.8%) |
| 18 to 34 Years | 92 (6.4%) | 0 (0.0%) |
| 35 to 64 Years | 16 (0.5%) | 44 (1.6%) |
| 65 to 74 Years | 86 (11.7%) | 46 (6.8%) |
| 75 Years and over | 10 (2.6%) | 31 (7.6%) |
Disability Class: Cognitive Difficulty
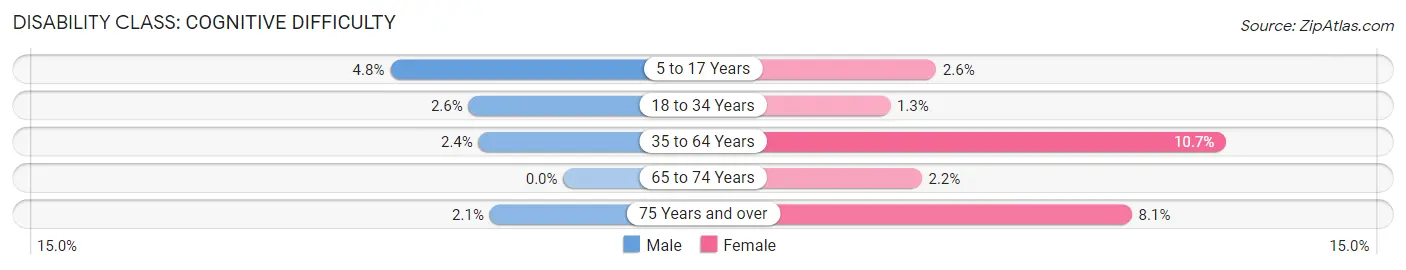
| Age Bracket | Male | Female |
| 5 to 17 Years | 73 (4.8%) | 25 (2.6%) |
| 18 to 34 Years | 38 (2.6%) | 16 (1.3%) |
| 35 to 64 Years | 76 (2.4%) | 294 (10.7%) |
| 65 to 74 Years | 0 (0.0%) | 15 (2.2%) |
| 75 Years and over | 8 (2.1%) | 33 (8.1%) |
Disability Class: Ambulatory Difficulty
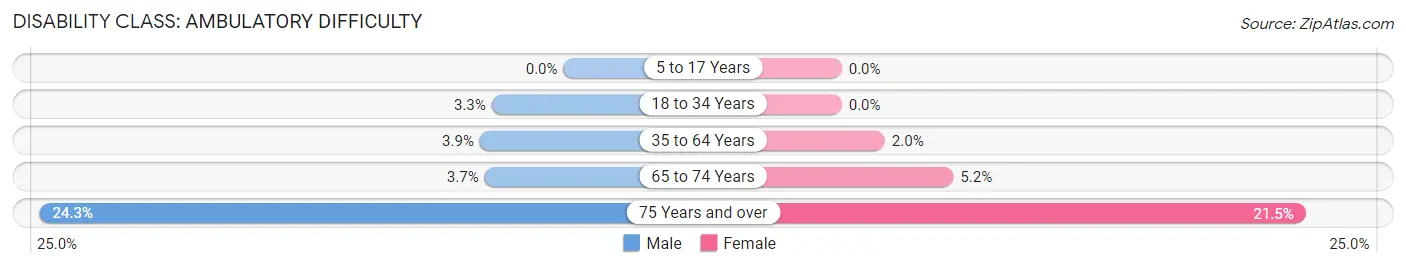
| Age Bracket | Male | Female |
| 5 to 17 Years | 0 (0.0%) | 0 (0.0%) |
| 18 to 34 Years | 48 (3.3%) | 0 (0.0%) |
| 35 to 64 Years | 125 (3.9%) | 55 (2.0%) |
| 65 to 74 Years | 27 (3.7%) | 35 (5.2%) |
| 75 Years and over | 95 (24.3%) | 88 (21.5%) |
Disability Class: Self-Care Difficulty
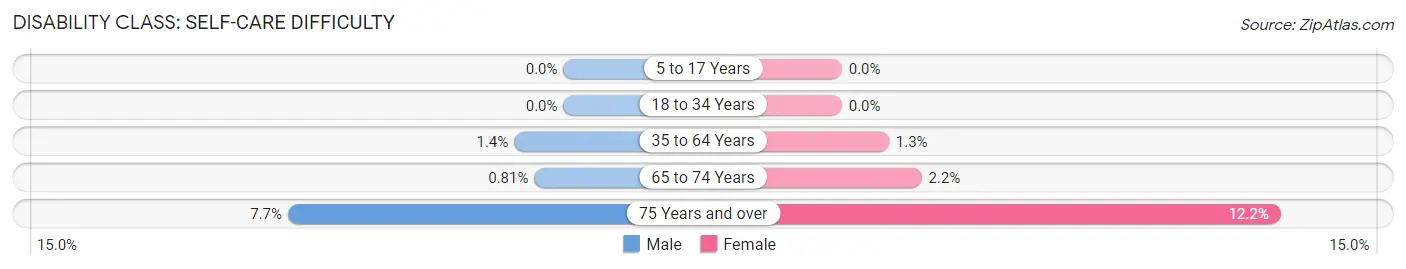
| Age Bracket | Male | Female |
| 5 to 17 Years | 0 (0.0%) | 0 (0.0%) |
| 18 to 34 Years | 0 (0.0%) | 0 (0.0%) |
| 35 to 64 Years | 44 (1.4%) | 36 (1.3%) |
| 65 to 74 Years | 6 (0.8%) | 15 (2.2%) |
| 75 Years and over | 30 (7.7%) | 50 (12.2%) |
Technology Access in Nantucket County
Computing Device Access in Nantucket County
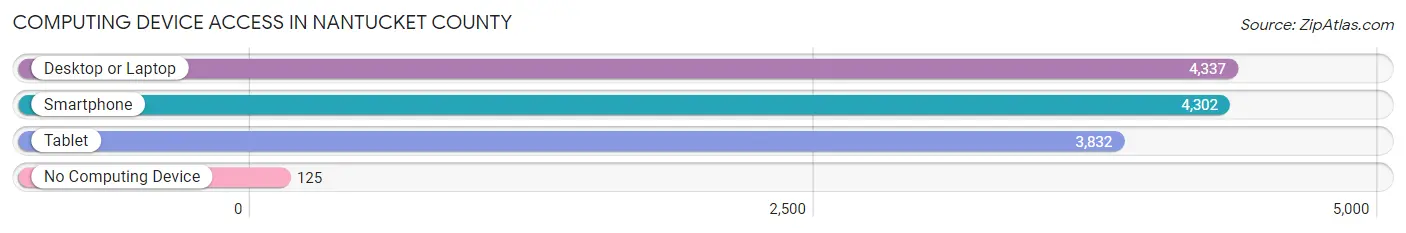
| Device Type | # Households | % Households |
| Desktop or Laptop | 4,337 | 93.1% |
| Smartphone | 4,302 | 92.3% |
| Tablet | 3,832 | 82.3% |
| No Computing Device | 125 | 2.7% |
| Total | 4,659 | 100.0% |
Internet Access in Nantucket County
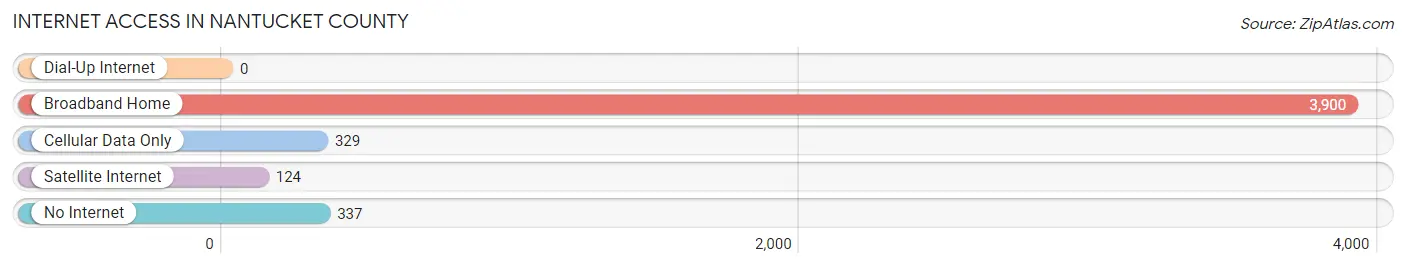
| Internet Type | # Households | % Households |
| Dial-Up Internet | 0 | 0.0% |
| Broadband Home | 3,900 | 83.7% |
| Cellular Data Only | 329 | 7.1% |
| Satellite Internet | 124 | 2.7% |
| No Internet | 337 | 7.2% |
| Total | 4,659 | 100.0% |
Nantucket County Summary
Nantucket County, Massachusetts is a county located in the southeastern part of the state. It is comprised of the island of Nantucket, which is located approximately 30 miles south of Cape Cod. The county is part of the Cape Cod and Islands region of Massachusetts and is the only county in the state that is not part of a metropolitan statistical area. The county seat is Nantucket Town, which is located on the island of Nantucket.
History
The island of Nantucket was first inhabited by the Wampanoag people, who were part of the Algonquian-speaking tribes of the region. The island was first sighted by Europeans in 1602, when an English explorer named Bartholomew Gosnold arrived. The island was then settled by English colonists in 1659, and it was incorporated as a town in 1671.
In 1795, Nantucket County was established as a county within the Commonwealth of Massachusetts. The county was named after the island of Nantucket, which was the primary settlement in the county. The county was initially part of Barnstable County, but it was later separated and established as its own county.
Geography
Nantucket County is located in the southeastern part of Massachusetts. It is comprised of the island of Nantucket, which is located approximately 30 miles south of Cape Cod. The island is approximately 14 miles long and 3 miles wide, and it has a total area of 48.4 square miles. The island is surrounded by the Atlantic Ocean and is separated from the mainland by Nantucket Sound.
The island is mostly flat, with the highest point being Wauwinet Hill, which is located at an elevation of 112 feet. The island is mostly composed of sand and gravel, and it is home to several freshwater ponds. The island is also home to several species of wildlife, including deer, foxes, and rabbits.
Economy
The economy of Nantucket County is largely based on tourism. The island is a popular destination for vacationers, and it is home to several resorts and hotels. The island is also home to several restaurants, shops, and galleries.
The island is also home to several fishing and shellfishing operations. The island is home to several commercial fishing vessels, and it is also home to several recreational fishing charters. The island is also home to several boatyards and marinas.
The island is also home to several industries, including boatbuilding, woodworking, and metalworking. The island is also home to several wineries and distilleries.
Demographics
As of the 2010 census, the population of Nantucket County was 10,172. The population is comprised of a variety of ethnic and racial backgrounds, including White (87.2%), African American (3.2%), Native American (0.4%), Asian (2.2%), and Hispanic or Latino (2.7%).
The median household income in the county is $77,845, and the median family income is $90,917. The per capita income in the county is $45,945. The unemployment rate in the county is 4.2%.
The largest employers in the county are the Nantucket Cottage Hospital, the Nantucket Public Schools, and the Nantucket Yacht Club. The county is also home to several small businesses, including restaurants, shops, and galleries.
Common Questions
What is the Total Population of Nantucket County?
Total Population of Nantucket County is 14,065.
What is the Total Male Population of Nantucket County?
Total Male Population of Nantucket County is 7,722.
What is the Total Female Population of Nantucket County?
Total Female Population of Nantucket County is 6,343.
What is the Ratio of Males per 100 Females in Nantucket County?
There are 121.74 Males per 100 Females in Nantucket County.
What is the Ratio of Females per 100 Males in Nantucket County?
There are 82.14 Females per 100 Males in Nantucket County.
What is the Median Population Age in Nantucket County?
Median Population Age in Nantucket County is 40.5 Years.
What is the Average Family Size in Nantucket County
Average Family Size in Nantucket County is 3.3 People.
What is the Average Household Size in Nantucket County
Average Household Size in Nantucket County is 3.0 People.
What is Per Capita Income in Nantucket County?
Per Capita income in Nantucket County is $62,153.
What is the Median Family Income in Nantucket County?
Median Family Income in Nantucket County is $144,198.
What is the Median Household income in Nantucket County?
Median Household Income in Nantucket County is $135,590.
What is Income or Wage Gap in Nantucket County?
Income or Wage Gap in Nantucket County is 11.9%.
Women in Nantucket County earn 88.1 cents for every dollar earned by a man.
What is Inequality or Gini Index in Nantucket County?
Inequality or Gini Index in Nantucket County is 0.46.
How Large is the Labor Force in Nantucket County?
There are 7,979 People in the Labor Forcein in Nantucket County.
What is the Percentage of People in the Labor Force in Nantucket County?
70.4% of People are in the Labor Force in Nantucket County.
What is the Unemployment Rate in Nantucket County?
Unemployment Rate in Nantucket County is 5.5%.