Hampshire County, MA
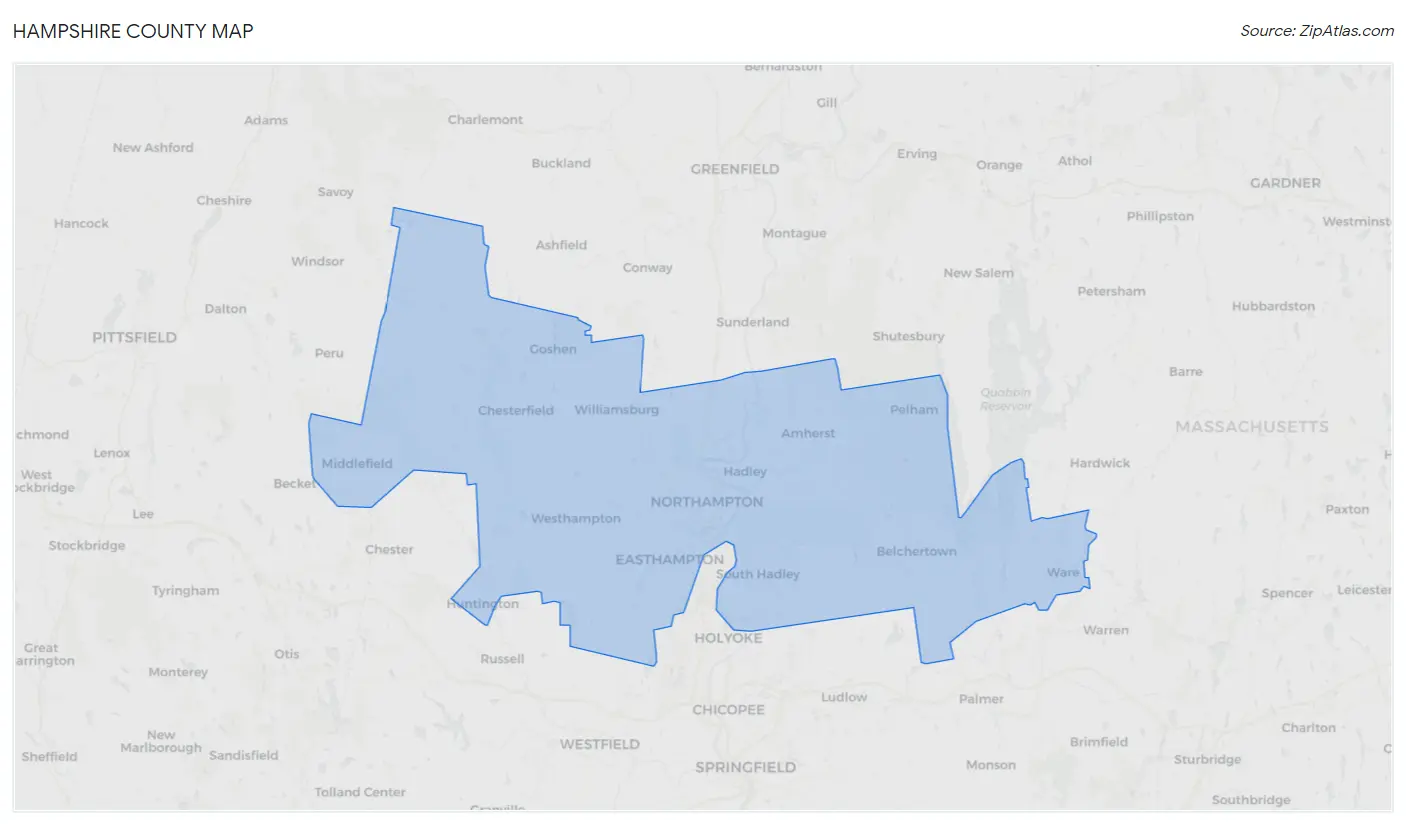
Hampshire County Map
Hampshire County Overview
153,931
TOTAL POPULATION
72,786
MALE POPULATION
81,145
FEMALE POPULATION
89.70
MALES / 100 FEMALES
111.48
FEMALES / 100 MALES
39.3
MEDIAN AGE
2.7
AVG FAMILY SIZE
2.2
AVG HOUSEHOLD SIZE
$43,639
PER CAPITA INCOME
$113,402
AVG FAMILY INCOME
$84,025
AVG HOUSEHOLD INCOME
35.7%
WAGE / INCOME GAP [ % ]
64.3¢/ $1
WAGE / INCOME GAP [ $ ]
$10,329
FAMILY INCOME DEFICIT
0.46
INEQUALITY / GINI INDEX
82,185
LABOR FORCE [ PEOPLE ]
61.4%
PERCENT IN LABOR FORCE
5.3%
UNEMPLOYMENT RATE
Hampshire County Area Codes
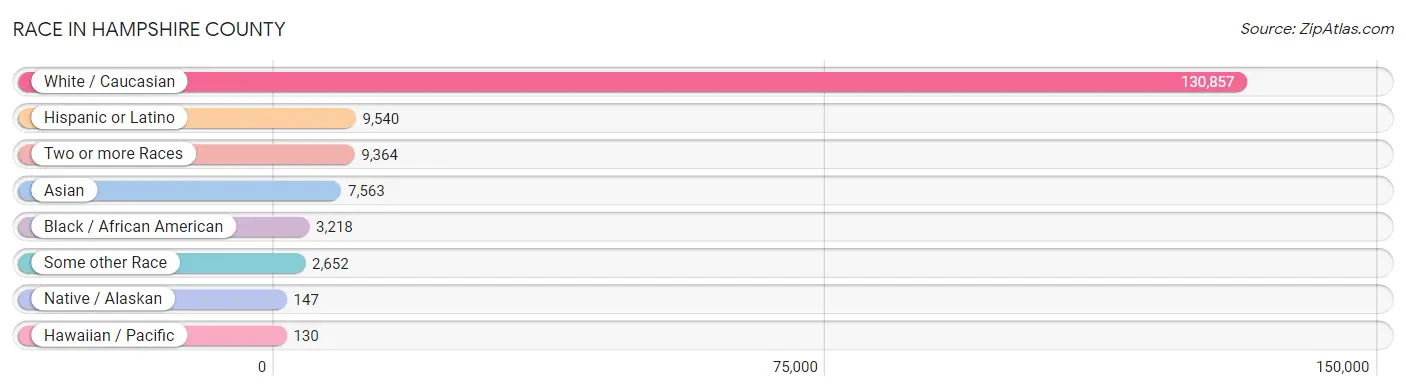
Race in Hampshire County
The most populous races in Hampshire County are White / Caucasian (130,857 | 85.0%), Hispanic or Latino (9,540 | 6.2%), and Two or more Races (9,364 | 6.1%).
| Race | # Population | % Population |
| Asian | 7,563 | 4.9% |
| Black / African American | 3,218 | 2.1% |
| Hawaiian / Pacific | 130 | 0.1% |
| Hispanic or Latino | 9,540 | 6.2% |
| Native / Alaskan | 147 | 0.1% |
| White / Caucasian | 130,857 | 85.0% |
| Two or more Races | 9,364 | 6.1% |
| Some other Race | 2,652 | 1.7% |
| Total | 153,931 | 100.0% |
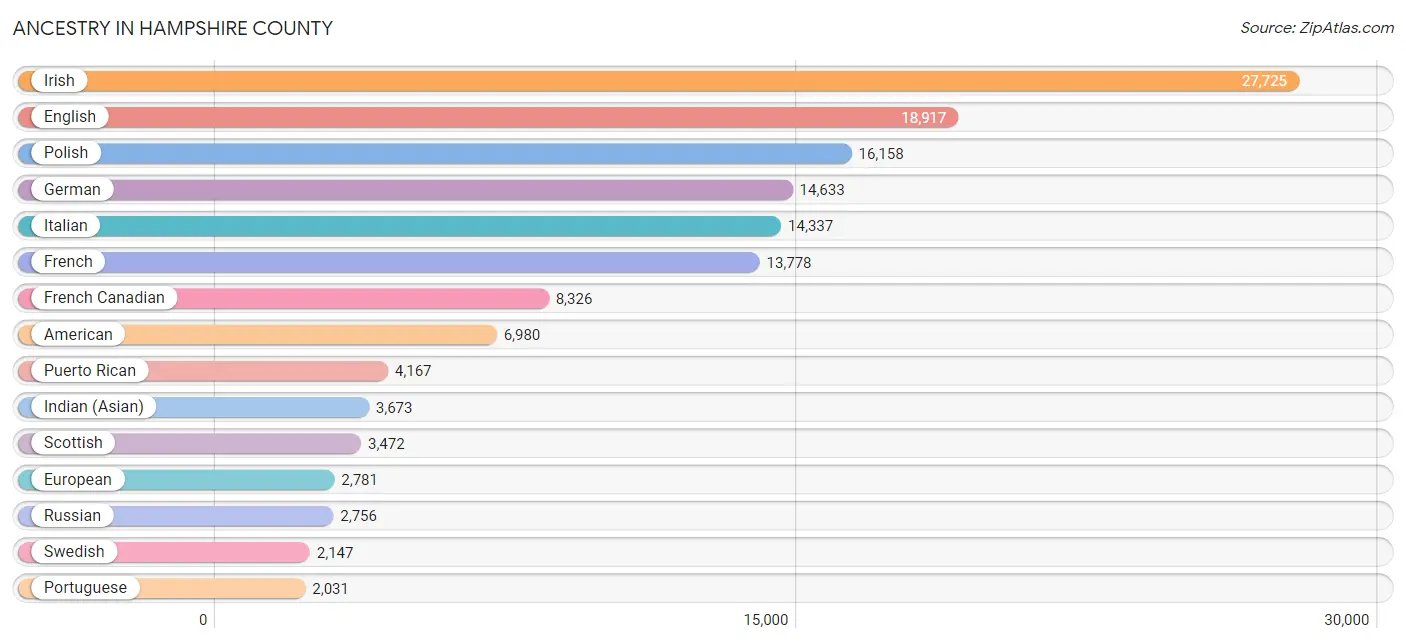
Ancestry in Hampshire County
The most populous ancestries reported in Hampshire County are Irish (27,725 | 18.0%), English (18,917 | 12.3%), Polish (16,158 | 10.5%), German (14,633 | 9.5%), and Italian (14,337 | 9.3%), together accounting for 59.6% of all Hampshire County residents.
| Ancestry | # Population | % Population |
| African | 280 | 0.2% |
| Albanian | 208 | 0.1% |
| American | 6,980 | 4.5% |
| Arab | 848 | 0.5% |
| Argentinean | 195 | 0.1% |
| Armenian | 197 | 0.1% |
| Australian | 35 | 0.0% |
| Austrian | 645 | 0.4% |
| Bahamian | 12 | 0.0% |
| Barbadian | 33 | 0.0% |
| Basque | 16 | 0.0% |
| Belgian | 221 | 0.1% |
| Bhutanese | 464 | 0.3% |
| Blackfeet | 48 | 0.0% |
| Bolivian | 30 | 0.0% |
| Brazilian | 692 | 0.4% |
| British | 1,257 | 0.8% |
| British West Indian | 21 | 0.0% |
| Bulgarian | 24 | 0.0% |
| Burmese | 712 | 0.5% |
| Cajun | 13 | 0.0% |
| Canadian | 852 | 0.5% |
| Cape Verdean | 161 | 0.1% |
| Carpatho Rusyn | 4 | 0.0% |
| Celtic | 31 | 0.0% |
| Central American | 922 | 0.6% |
| Central American Indian | 192 | 0.1% |
| Cherokee | 48 | 0.0% |
| Chickasaw | 23 | 0.0% |
| Chilean | 65 | 0.0% |
| Chippewa | 4 | 0.0% |
| Choctaw | 32 | 0.0% |
| Colombian | 508 | 0.3% |
| Costa Rican | 145 | 0.1% |
| Cree | 6 | 0.0% |
| Creek | 7 | 0.0% |
| Croatian | 66 | 0.0% |
| Cuban | 209 | 0.1% |
| Cypriot | 5 | 0.0% |
| Czech | 732 | 0.5% |
| Czechoslovakian | 84 | 0.1% |
| Danish | 475 | 0.3% |
| Dominican | 632 | 0.4% |
| Dutch | 1,058 | 0.7% |
| Eastern European | 1,523 | 1.0% |
| Ecuadorian | 560 | 0.4% |
| Egyptian | 74 | 0.1% |
| English | 18,917 | 12.3% |
| Estonian | 28 | 0.0% |
| Ethiopian | 29 | 0.0% |
| European | 2,781 | 1.8% |
| Filipino | 171 | 0.1% |
| Finnish | 445 | 0.3% |
| French | 13,778 | 8.9% |
| French American Indian | 52 | 0.0% |
| French Canadian | 8,326 | 5.4% |
| German | 14,633 | 9.5% |
| Ghanaian | 25 | 0.0% |
| Greek | 658 | 0.4% |
| Guamanian / Chamorro | 18 | 0.0% |
| Guatemalan | 131 | 0.1% |
| Guyanese | 10 | 0.0% |
| Haitian | 286 | 0.2% |
| Honduran | 175 | 0.1% |
| Hungarian | 670 | 0.4% |
| Icelander | 24 | 0.0% |
| Indian (Asian) | 3,673 | 2.4% |
| Indonesian | 10 | 0.0% |
| Iranian | 273 | 0.2% |
| Iraqi | 6 | 0.0% |
| Irish | 27,725 | 18.0% |
| Iroquois | 84 | 0.1% |
| Israeli | 39 | 0.0% |
| Italian | 14,337 | 9.3% |
| Jamaican | 257 | 0.2% |
| Japanese | 527 | 0.3% |
| Jordanian | 4 | 0.0% |
| Kenyan | 72 | 0.1% |
| Korean | 483 | 0.3% |
| Laotian | 7 | 0.0% |
| Latvian | 29 | 0.0% |
| Lebanese | 364 | 0.2% |
| Liberian | 37 | 0.0% |
| Lithuanian | 1,709 | 1.1% |
| Luxembourger | 42 | 0.0% |
| Macedonian | 35 | 0.0% |
| Malaysian | 40 | 0.0% |
| Maltese | 72 | 0.1% |
| Mexican | 1,117 | 0.7% |
| Mexican American Indian | 74 | 0.1% |
| Mongolian | 5 | 0.0% |
| Moroccan | 103 | 0.1% |
| Native Hawaiian | 27 | 0.0% |
| New Zealander | 21 | 0.0% |
| Nicaraguan | 18 | 0.0% |
| Nigerian | 191 | 0.1% |
| Northern European | 276 | 0.2% |
| Norwegian | 843 | 0.5% |
| Okinawan | 4 | 0.0% |
| Pakistani | 60 | 0.0% |
| Palestinian | 18 | 0.0% |
| Panamanian | 11 | 0.0% |
| Pennsylvania German | 45 | 0.0% |
| Peruvian | 214 | 0.1% |
| Polish | 16,158 | 10.5% |
| Portuguese | 2,031 | 1.3% |
| Potawatomi | 32 | 0.0% |
| Puerto Rican | 4,167 | 2.7% |
| Romanian | 180 | 0.1% |
| Russian | 2,756 | 1.8% |
| Salvadoran | 442 | 0.3% |
| Samoan | 7 | 0.0% |
| Scandinavian | 372 | 0.2% |
| Scotch-Irish | 1,066 | 0.7% |
| Scottish | 3,472 | 2.3% |
| Senegalese | 73 | 0.1% |
| Serbian | 88 | 0.1% |
| Sioux | 21 | 0.0% |
| Slavic | 71 | 0.1% |
| Slovak | 271 | 0.2% |
| Slovene | 52 | 0.0% |
| South African | 37 | 0.0% |
| South American | 1,715 | 1.1% |
| Soviet Union | 21 | 0.0% |
| Spaniard | 290 | 0.2% |
| Spanish | 128 | 0.1% |
| Sri Lankan | 739 | 0.5% |
| Subsaharan African | 986 | 0.6% |
| Swedish | 2,147 | 1.4% |
| Swiss | 440 | 0.3% |
| Syrian | 105 | 0.1% |
| Thai | 1,964 | 1.3% |
| Tongan | 14 | 0.0% |
| Trinidadian and Tobagonian | 123 | 0.1% |
| Turkish | 200 | 0.1% |
| Ukrainian | 943 | 0.6% |
| Venezuelan | 143 | 0.1% |
| Vietnamese | 11 | 0.0% |
| Welsh | 971 | 0.6% |
| West Indian | 104 | 0.1% |
| Yaqui | 9 | 0.0% |
| Yugoslavian | 138 | 0.1% | View All 142 Rows |
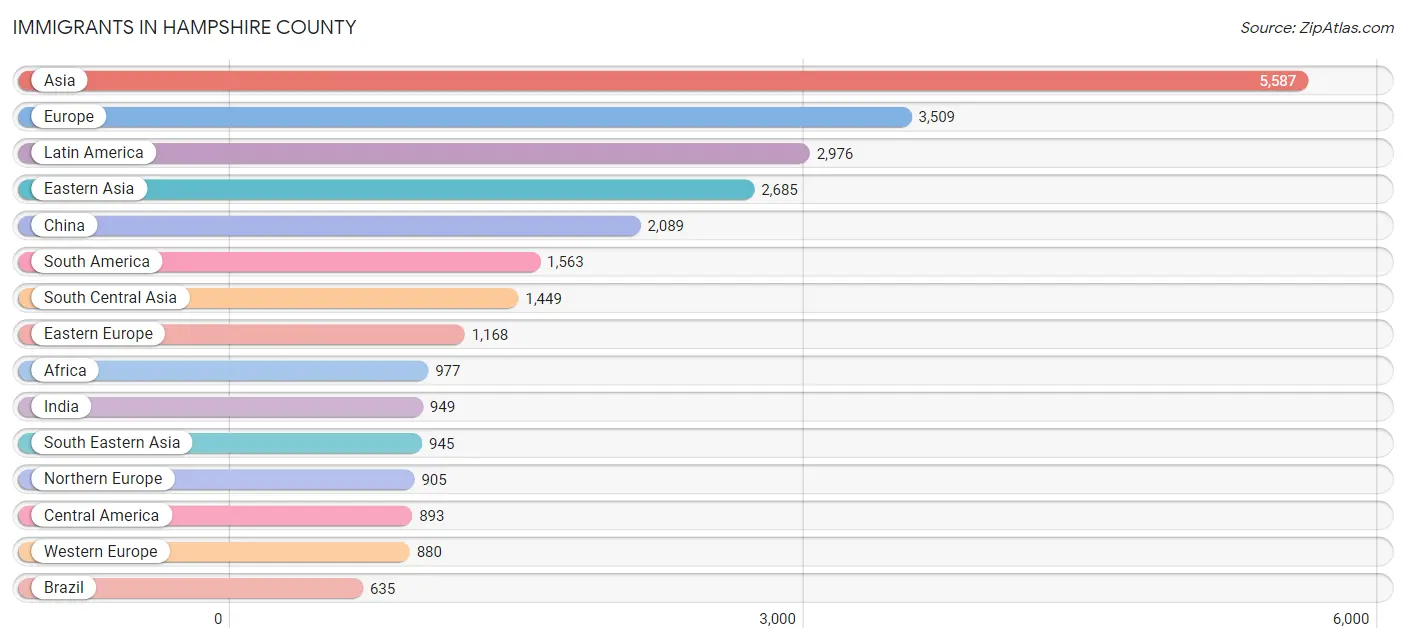
Immigrants in Hampshire County
The most numerous immigrant groups reported in Hampshire County came from Asia (5,587 | 3.6%), Europe (3,509 | 2.3%), Latin America (2,976 | 1.9%), Eastern Asia (2,685 | 1.7%), and China (2,089 | 1.4%), together accounting for 10.9% of all Hampshire County residents.
| Immigration Origin | # Population | % Population |
| Africa | 977 | 0.6% |
| Albania | 101 | 0.1% |
| Argentina | 176 | 0.1% |
| Asia | 5,587 | 3.6% |
| Australia | 45 | 0.0% |
| Austria | 15 | 0.0% |
| Bahamas | 12 | 0.0% |
| Bangladesh | 51 | 0.0% |
| Barbados | 4 | 0.0% |
| Belarus | 44 | 0.0% |
| Belgium | 62 | 0.0% |
| Bolivia | 30 | 0.0% |
| Bosnia and Herzegovina | 44 | 0.0% |
| Brazil | 635 | 0.4% |
| Bulgaria | 10 | 0.0% |
| Cabo Verde | 3 | 0.0% |
| Cambodia | 189 | 0.1% |
| Canada | 416 | 0.3% |
| Caribbean | 520 | 0.3% |
| Central America | 893 | 0.6% |
| Chile | 13 | 0.0% |
| China | 2,089 | 1.4% |
| Colombia | 303 | 0.2% |
| Congo | 48 | 0.0% |
| Costa Rica | 44 | 0.0% |
| Croatia | 2 | 0.0% |
| Cuba | 66 | 0.0% |
| Czechoslovakia | 23 | 0.0% |
| Denmark | 5 | 0.0% |
| Dominican Republic | 251 | 0.2% |
| Eastern Africa | 364 | 0.2% |
| Eastern Asia | 2,685 | 1.7% |
| Eastern Europe | 1,168 | 0.8% |
| Ecuador | 254 | 0.2% |
| El Salvador | 321 | 0.2% |
| England | 288 | 0.2% |
| Ethiopia | 32 | 0.0% |
| Europe | 3,509 | 2.3% |
| Fiji | 5 | 0.0% |
| France | 147 | 0.1% |
| Germany | 564 | 0.4% |
| Ghana | 19 | 0.0% |
| Greece | 65 | 0.0% |
| Guatemala | 105 | 0.1% |
| Guyana | 7 | 0.0% |
| Haiti | 125 | 0.1% |
| Honduras | 159 | 0.1% |
| Hong Kong | 48 | 0.0% |
| Hungary | 70 | 0.1% |
| India | 949 | 0.6% |
| Indonesia | 12 | 0.0% |
| Iran | 214 | 0.1% |
| Ireland | 81 | 0.1% |
| Israel | 40 | 0.0% |
| Italy | 129 | 0.1% |
| Jamaica | 38 | 0.0% |
| Japan | 164 | 0.1% |
| Jordan | 4 | 0.0% |
| Kazakhstan | 18 | 0.0% |
| Kenya | 57 | 0.0% |
| Korea | 432 | 0.3% |
| Latin America | 2,976 | 1.9% |
| Lebanon | 94 | 0.1% |
| Lithuania | 33 | 0.0% |
| Malaysia | 21 | 0.0% |
| Mexico | 253 | 0.2% |
| Middle Africa | 106 | 0.1% |
| Morocco | 94 | 0.1% |
| Nepal | 55 | 0.0% |
| Netherlands | 30 | 0.0% |
| Nigeria | 185 | 0.1% |
| Northern Africa | 105 | 0.1% |
| Northern Europe | 905 | 0.6% |
| Norway | 5 | 0.0% |
| Oceania | 70 | 0.1% |
| Pakistan | 39 | 0.0% |
| Panama | 11 | 0.0% |
| Peru | 29 | 0.0% |
| Philippines | 237 | 0.2% |
| Poland | 216 | 0.1% |
| Portugal | 270 | 0.2% |
| Romania | 44 | 0.0% |
| Russia | 357 | 0.2% |
| Saudi Arabia | 8 | 0.0% |
| Scotland | 40 | 0.0% |
| Senegal | 18 | 0.0% |
| Singapore | 187 | 0.1% |
| South Africa | 127 | 0.1% |
| South America | 1,563 | 1.0% |
| South Central Asia | 1,449 | 0.9% |
| South Eastern Asia | 945 | 0.6% |
| Southern Europe | 556 | 0.4% |
| Spain | 92 | 0.1% |
| Sri Lanka | 93 | 0.1% |
| Sweden | 3 | 0.0% |
| Switzerland | 57 | 0.0% |
| Syria | 144 | 0.1% |
| Taiwan | 310 | 0.2% |
| Thailand | 50 | 0.0% |
| Trinidad and Tobago | 24 | 0.0% |
| Turkey | 156 | 0.1% |
| Ukraine | 194 | 0.1% |
| Venezuela | 116 | 0.1% |
| Vietnam | 244 | 0.2% |
| Western Africa | 262 | 0.2% |
| Western Asia | 481 | 0.3% |
| Western Europe | 880 | 0.6% | View All 107 Rows |
Sex and Age in Hampshire County
Sex and Age in Hampshire County
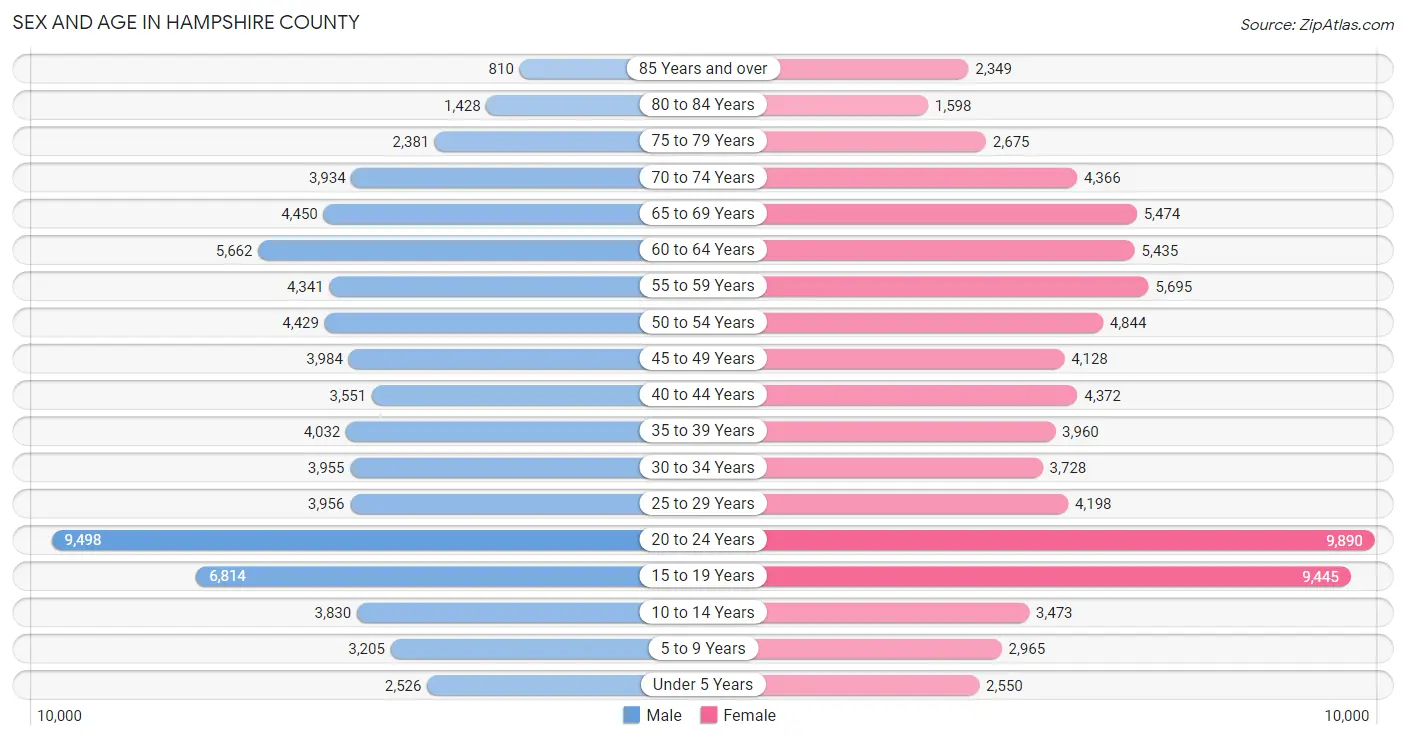
The most populous age groups in Hampshire County are 20 to 24 Years (9,498 | 13.1%) for men and 20 to 24 Years (9,890 | 12.2%) for women.
| Age Bracket | Male | Female |
| Under 5 Years | 2,526 (3.5%) | 2,550 (3.1%) |
| 5 to 9 Years | 3,205 (4.4%) | 2,965 (3.6%) |
| 10 to 14 Years | 3,830 (5.3%) | 3,473 (4.3%) |
| 15 to 19 Years | 6,814 (9.4%) | 9,445 (11.6%) |
| 20 to 24 Years | 9,498 (13.1%) | 9,890 (12.2%) |
| 25 to 29 Years | 3,956 (5.4%) | 4,198 (5.2%) |
| 30 to 34 Years | 3,955 (5.4%) | 3,728 (4.6%) |
| 35 to 39 Years | 4,032 (5.5%) | 3,960 (4.9%) |
| 40 to 44 Years | 3,551 (4.9%) | 4,372 (5.4%) |
| 45 to 49 Years | 3,984 (5.5%) | 4,128 (5.1%) |
| 50 to 54 Years | 4,429 (6.1%) | 4,844 (6.0%) |
| 55 to 59 Years | 4,341 (6.0%) | 5,695 (7.0%) |
| 60 to 64 Years | 5,662 (7.8%) | 5,435 (6.7%) |
| 65 to 69 Years | 4,450 (6.1%) | 5,474 (6.8%) |
| 70 to 74 Years | 3,934 (5.4%) | 4,366 (5.4%) |
| 75 to 79 Years | 2,381 (3.3%) | 2,675 (3.3%) |
| 80 to 84 Years | 1,428 (2.0%) | 1,598 (2.0%) |
| 85 Years and over | 810 (1.1%) | 2,349 (2.9%) |
| Total | 72,786 (100.0%) | 81,145 (100.0%) |
Families and Households in Hampshire County
Median Family Size in Hampshire County
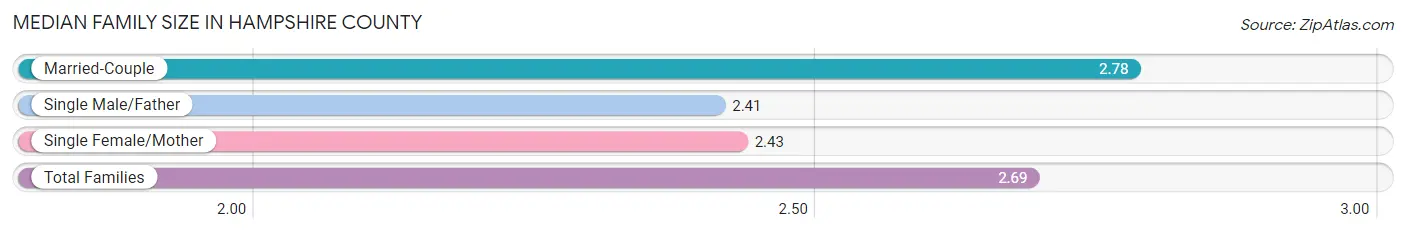
The median family size in Hampshire County is 2.69 persons per family, with married-couple families (27,532 | 76.5%) accounting for the largest median family size of 2.78 persons per family. On the other hand, single male/father families (2,384 | 6.6%) represent the smallest median family size with 2.41 persons per family.
| Family Type | # Families | Family Size |
| Married-Couple | 27,532 (76.5%) | 2.78 |
| Single Male/Father | 2,384 (6.6%) | 2.41 |
| Single Female/Mother | 6,060 (16.8%) | 2.43 |
| Total Families | 35,976 (100.0%) | 2.69 |
Median Household Size in Hampshire County
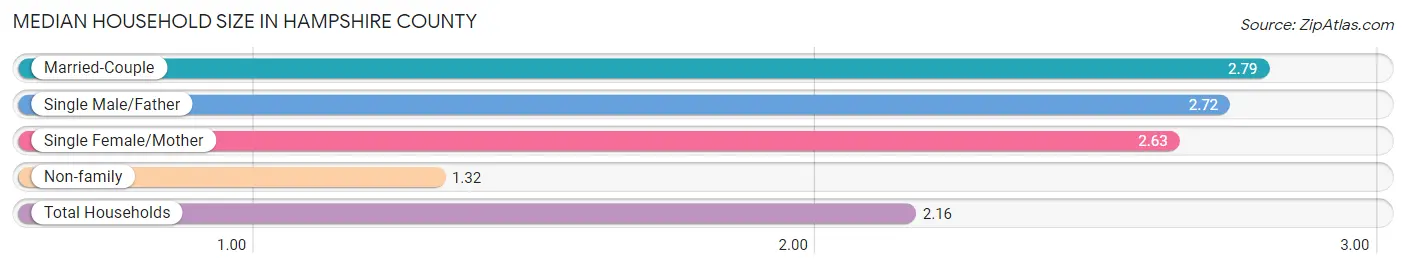
The median household size in Hampshire County is 2.16 persons per household, with married-couple households (27,532 | 44.8%) accounting for the largest median household size of 2.79 persons per household. non-family households (25,438 | 41.4%) represent the smallest median household size with 1.32 persons per household.
| Household Type | # Households | Household Size |
| Married-Couple | 27,532 (44.8%) | 2.79 |
| Single Male/Father | 2,384 (3.9%) | 2.72 |
| Single Female/Mother | 6,060 (9.9%) | 2.63 |
| Non-family | 25,438 (41.4%) | 1.32 |
| Total Households | 61,414 (100.0%) | 2.16 |
Household Size by Marriage Status in Hampshire County
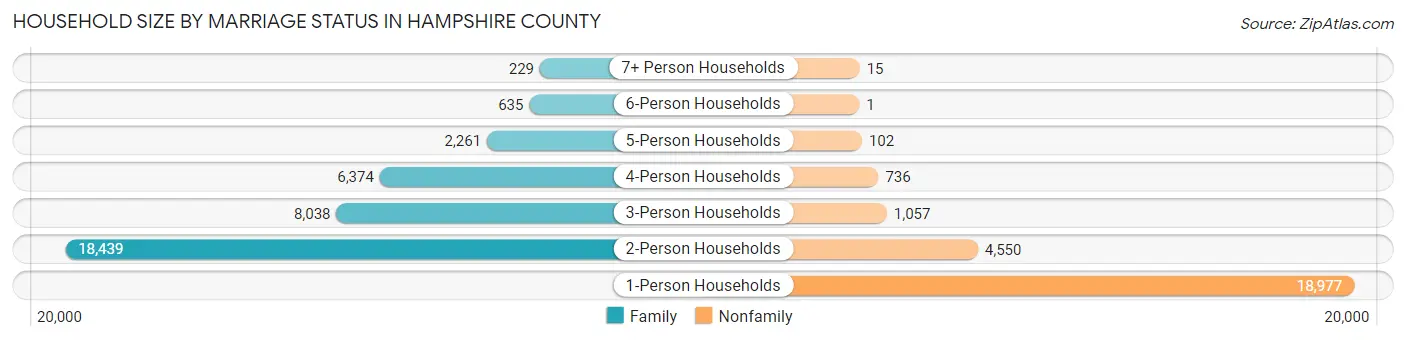
Out of a total of 61,414 households in Hampshire County, 35,976 (58.6%) are family households, while 25,438 (41.4%) are nonfamily households. The most numerous type of family households are 2-person households, comprising 18,439, and the most common type of nonfamily households are 1-person households, comprising 18,977.
| Household Size | Family Households | Nonfamily Households |
| 1-Person Households | - | 18,977 (30.9%) |
| 2-Person Households | 18,439 (30.0%) | 4,550 (7.4%) |
| 3-Person Households | 8,038 (13.1%) | 1,057 (1.7%) |
| 4-Person Households | 6,374 (10.4%) | 736 (1.2%) |
| 5-Person Households | 2,261 (3.7%) | 102 (0.2%) |
| 6-Person Households | 635 (1.0%) | 1 (0.0%) |
| 7+ Person Households | 229 (0.4%) | 15 (0.0%) |
| Total | 35,976 (58.6%) | 25,438 (41.4%) |
Female Fertility in Hampshire County
Fertility by Age in Hampshire County
Average fertility rate in Hampshire County is 23.0 births per 1,000 women. Women in the age bracket of 35 to 50 years have the highest fertility rate with 32.0 births per 1,000 women. Women in the age bracket of 20 to 34 years acount for 54.5% of all women with births.
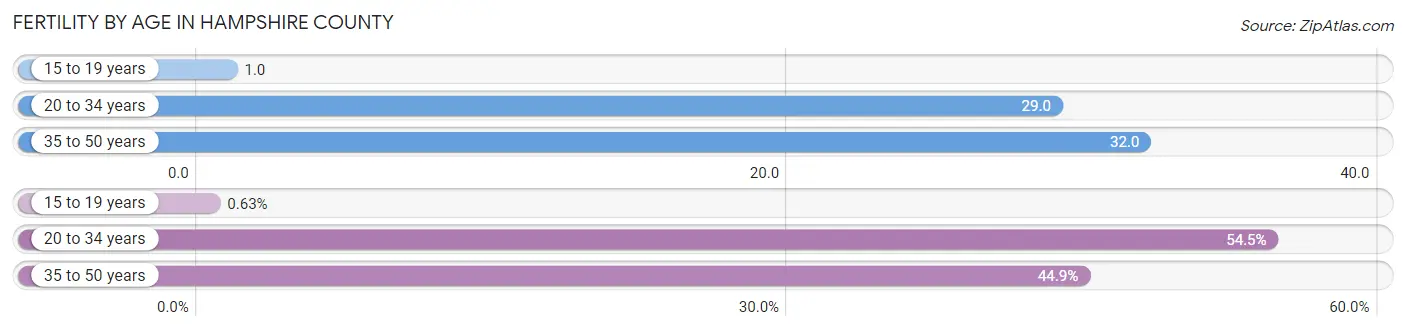
| Age Bracket | Women with Births | Births / 1,000 Women |
| 15 to 19 years | 6 (0.6%) | 1.0 |
| 20 to 34 years | 517 (54.5%) | 29.0 |
| 35 to 50 years | 426 (44.9%) | 32.0 |
| Total | 949 (100.0%) | 23.0 |
Fertility by Age by Marriage Status in Hampshire County
81.2% of women with births (949) in Hampshire County are married. The highest percentage of unmarried women with births falls into 15 to 19 years age bracket with 100.0% of them unmarried at the time of birth, while the lowest percentage of unmarried women with births belong to 35 to 50 years age bracket with 6.8% of them unmarried.
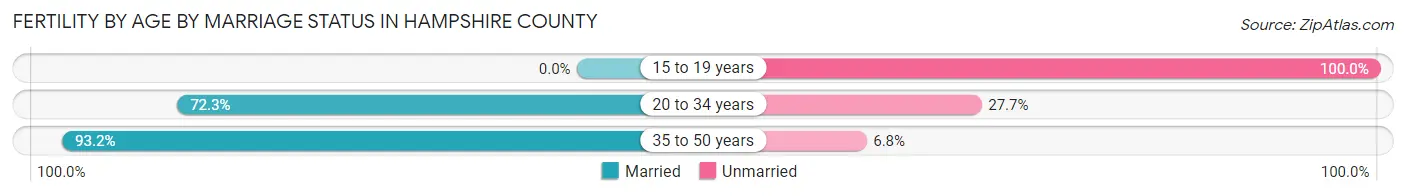
| Age Bracket | Married | Unmarried |
| 15 to 19 years | 0 (0.0%) | 6 (100.0%) |
| 20 to 34 years | 374 (72.3%) | 143 (27.7%) |
| 35 to 50 years | 397 (93.2%) | 29 (6.8%) |
| Total | 771 (81.2%) | 178 (18.8%) |
Fertility by Education in Hampshire County
Average fertility rate in Hampshire County is 23.0 births per 1,000 women. Women with the education attainment of graduate degree have the highest fertility rate of 57.0 births per 1,000 women, while women with the education attainment of less than high school have the lowest fertility at 7.0 births per 1,000 women. Women with the education attainment of graduate degree represent 45.2% of all women with births.
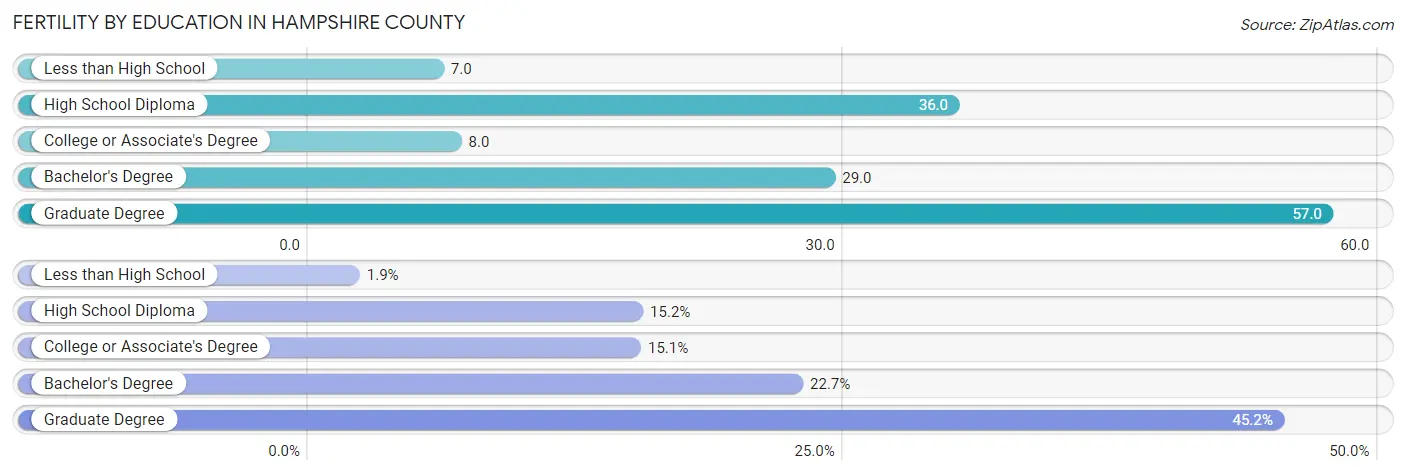
| Educational Attainment | Women with Births | Births / 1,000 Women |
| Less than High School | 18 (1.9%) | 7.0 |
| High School Diploma | 144 (15.2%) | 36.0 |
| College or Associate's Degree | 143 (15.1%) | 8.0 |
| Bachelor's Degree | 215 (22.7%) | 29.0 |
| Graduate Degree | 429 (45.2%) | 57.0 |
| Total | 949 (100.0%) | 23.0 |
Fertility by Education by Marriage Status in Hampshire County
18.8% of women with births in Hampshire County are unmarried. Women with the educational attainment of graduate degree are most likely to be married with 100.0% of them married at childbirth, while women with the educational attainment of less than high school are least likely to be married with 100.0% of them unmarried at childbirth.
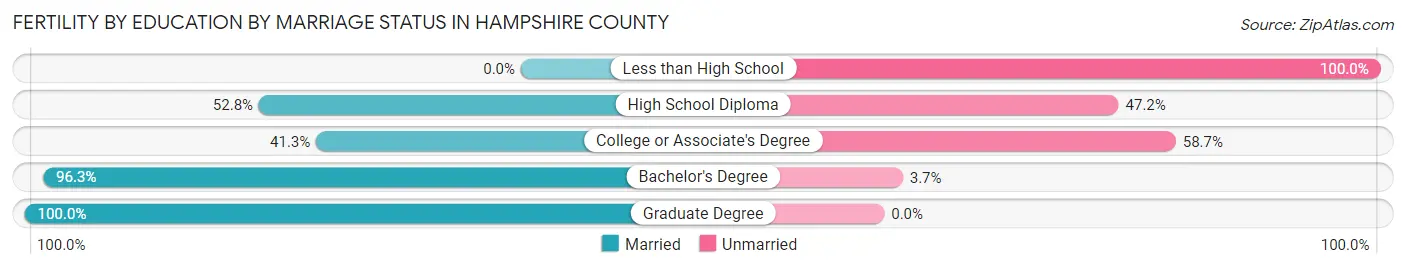
| Educational Attainment | Married | Unmarried |
| Less than High School | 0 (0.0%) | 18 (100.0%) |
| High School Diploma | 76 (52.8%) | 68 (47.2%) |
| College or Associate's Degree | 59 (41.3%) | 84 (58.7%) |
| Bachelor's Degree | 207 (96.3%) | 8 (3.7%) |
| Graduate Degree | 429 (100.0%) | 0 (0.0%) |
| Total | 771 (81.2%) | 178 (18.8%) |
Income in Hampshire County
Income Overview in Hampshire County
Per Capita Income in Hampshire County is $43,639, while median incomes of families and households are $113,402 and $84,025 respectively.
| Characteristic | Number | Measure |
| Per Capita Income | 153,931 | $43,639 |
| Median Family Income | 35,976 | $113,402 |
| Mean Family Income | 35,976 | $136,720 |
| Median Household Income | 61,414 | $84,025 |
| Mean Household Income | 61,414 | $110,040 |
| Income Deficit | 35,976 | $10,329 |
| Wage / Income Gap (%) | 153,931 | 35.69% |
| Wage / Income Gap ($) | 153,931 | 64.31¢ per $1 |
| Gini / Inequality Index | 153,931 | 0.46 |
Earnings by Sex in Hampshire County
Average Earnings in Hampshire County are $36,691, $45,340 for men and $29,157 for women, a difference of 35.7%.
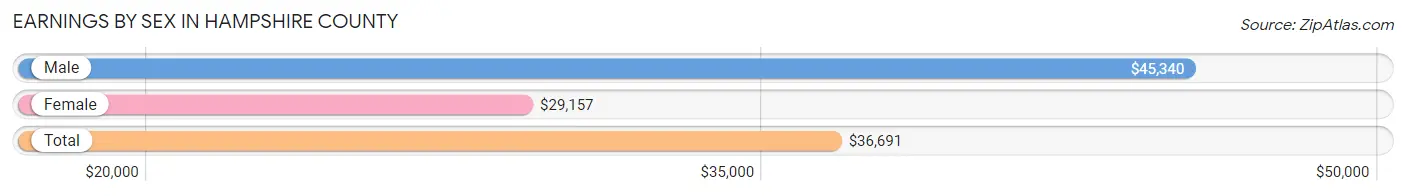
| Sex | Number | Average Earnings |
| Male | 45,575 (48.4%) | $45,340 |
| Female | 48,585 (51.6%) | $29,157 |
| Total | 94,160 (100.0%) | $36,691 |
Earnings by Sex by Income Bracket in Hampshire County
The most common earnings brackets in Hampshire County are $100,000+ for men (8,028 | 17.6%) and $100,000+ for women (5,451 | 11.2%).
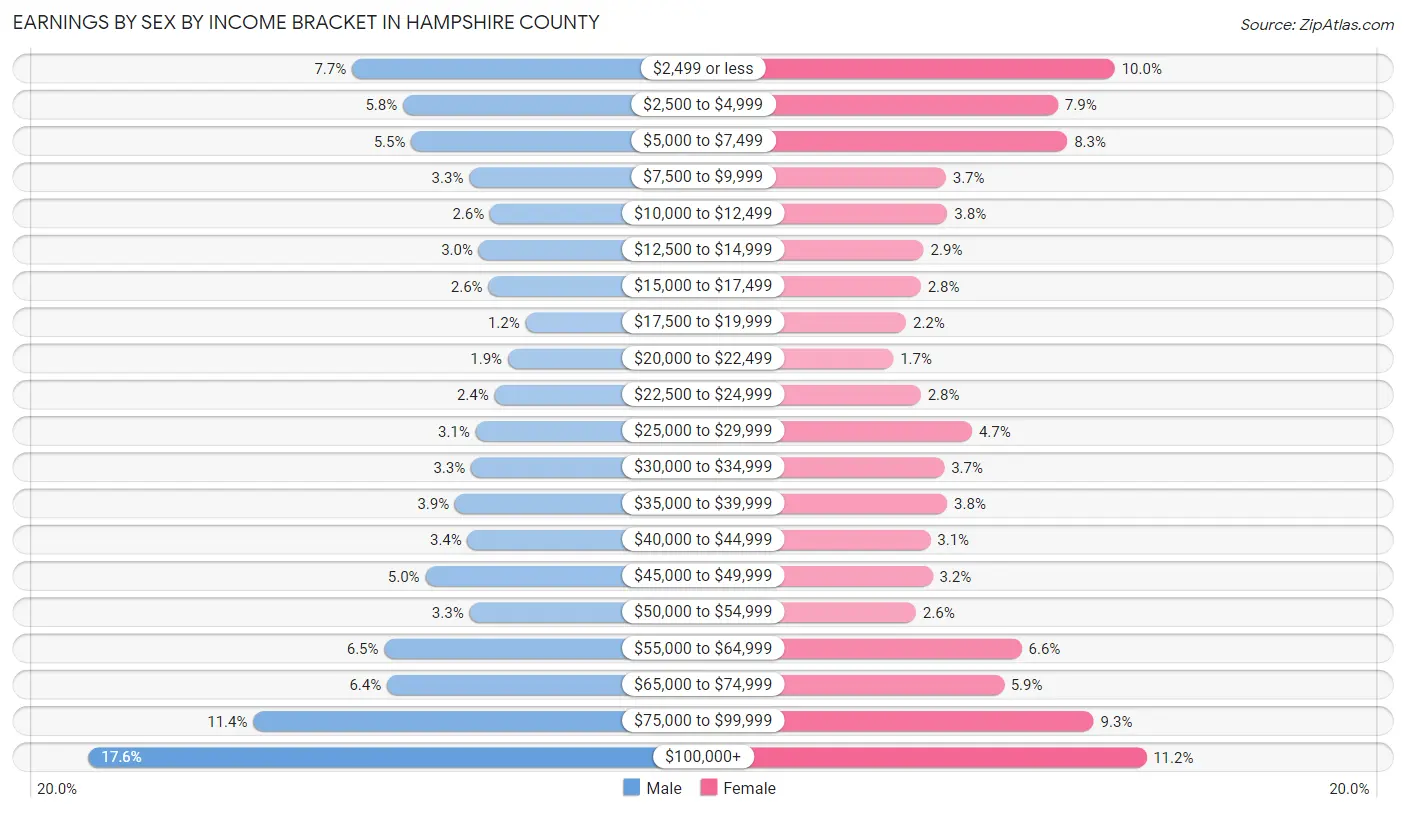
| Income | Male | Female |
| $2,499 or less | 3,523 (7.7%) | 4,876 (10.0%) |
| $2,500 to $4,999 | 2,651 (5.8%) | 3,844 (7.9%) |
| $5,000 to $7,499 | 2,509 (5.5%) | 4,015 (8.3%) |
| $7,500 to $9,999 | 1,522 (3.3%) | 1,802 (3.7%) |
| $10,000 to $12,499 | 1,167 (2.6%) | 1,834 (3.8%) |
| $12,500 to $14,999 | 1,359 (3.0%) | 1,398 (2.9%) |
| $15,000 to $17,499 | 1,194 (2.6%) | 1,348 (2.8%) |
| $17,500 to $19,999 | 560 (1.2%) | 1,077 (2.2%) |
| $20,000 to $22,499 | 862 (1.9%) | 843 (1.7%) |
| $22,500 to $24,999 | 1,087 (2.4%) | 1,344 (2.8%) |
| $25,000 to $29,999 | 1,413 (3.1%) | 2,281 (4.7%) |
| $30,000 to $34,999 | 1,490 (3.3%) | 1,775 (3.6%) |
| $35,000 to $39,999 | 1,766 (3.9%) | 1,826 (3.8%) |
| $40,000 to $44,999 | 1,550 (3.4%) | 1,522 (3.1%) |
| $45,000 to $49,999 | 2,268 (5.0%) | 1,558 (3.2%) |
| $50,000 to $54,999 | 1,518 (3.3%) | 1,260 (2.6%) |
| $55,000 to $64,999 | 2,973 (6.5%) | 3,180 (6.6%) |
| $65,000 to $74,999 | 2,928 (6.4%) | 2,856 (5.9%) |
| $75,000 to $99,999 | 5,207 (11.4%) | 4,495 (9.2%) |
| $100,000+ | 8,028 (17.6%) | 5,451 (11.2%) |
| Total | 45,575 (100.0%) | 48,585 (100.0%) |
Earnings by Sex by Educational Attainment in Hampshire County
Average earnings in Hampshire County are $61,805 for men and $50,424 for women, a difference of 18.4%. Men with an educational attainment of graduate degree enjoy the highest average annual earnings of $86,344, while those with less than high school education earn the least with $48,438. Women with an educational attainment of graduate degree earn the most with the average annual earnings of $70,779, while those with less than high school education have the smallest earnings of $23,098.
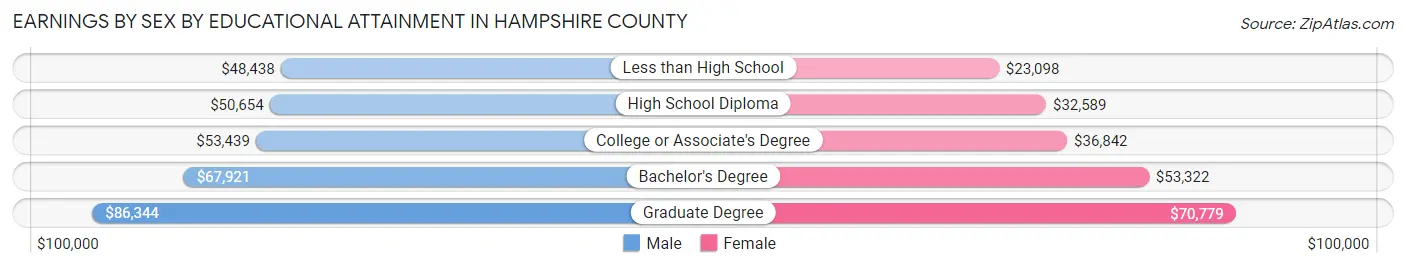
| Educational Attainment | Male Income | Female Income |
| Less than High School | $48,438 | $23,098 |
| High School Diploma | $50,654 | $32,589 |
| College or Associate's Degree | $53,439 | $36,842 |
| Bachelor's Degree | $67,921 | $53,322 |
| Graduate Degree | $86,344 | $70,779 |
| Total | $61,805 | $50,424 |
Family Income in Hampshire County
Family Income Brackets in Hampshire County
According to the Hampshire County family income data, there are 9,642 families falling into the $100,000 to $149,999 income range, which is the most common income bracket and makes up 26.8% of all families. Conversely, the $10,000 to $14,999 income bracket is the least frequent group with only 396 families (1.1%) belonging to this category.
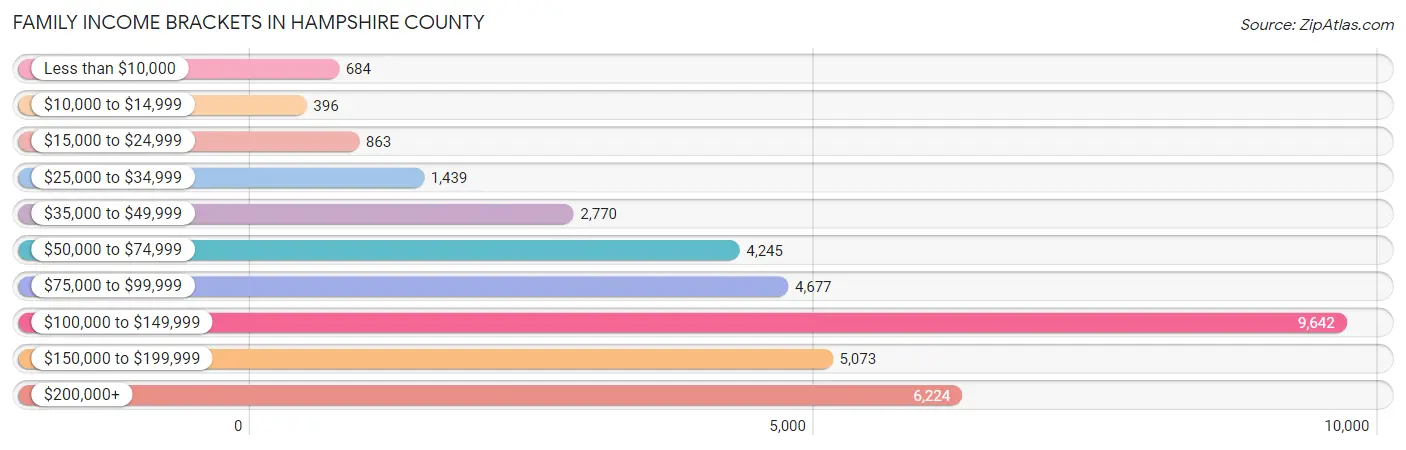
| Income Bracket | # Families | % Families |
| Less than $10,000 | 684 | 1.9% |
| $10,000 to $14,999 | 396 | 1.1% |
| $15,000 to $24,999 | 863 | 2.4% |
| $25,000 to $34,999 | 1,439 | 4.0% |
| $35,000 to $49,999 | 2,770 | 7.7% |
| $50,000 to $74,999 | 4,245 | 11.8% |
| $75,000 to $99,999 | 4,677 | 13.0% |
| $100,000 to $149,999 | 9,642 | 26.8% |
| $150,000 to $199,999 | 5,073 | 14.1% |
| $200,000+ | 6,224 | 17.3% |
Family Income by Famaliy Size in Hampshire County
6-person families (540 | 1.5%) account for the highest median family income in Hampshire County with $153,631 per family, while 2-person families (19,525 | 54.3%) have the highest median income of $49,461 per family member.
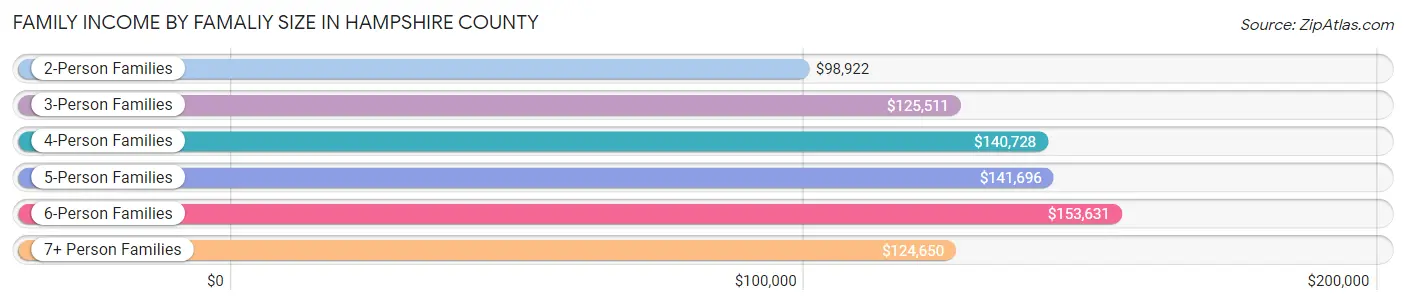
| Income Bracket | # Families | Median Income |
| 2-Person Families | 19,525 (54.3%) | $98,922 |
| 3-Person Families | 7,788 (21.6%) | $125,511 |
| 4-Person Families | 6,017 (16.7%) | $140,728 |
| 5-Person Families | 1,877 (5.2%) | $141,696 |
| 6-Person Families | 540 (1.5%) | $153,631 |
| 7+ Person Families | 229 (0.6%) | $124,650 |
| Total | 35,976 (100.0%) | $113,402 |
Family Income by Number of Earners in Hampshire County
The median family income in Hampshire County is $113,402, with families comprising 3+ earners (4,179) having the highest median family income of $163,212, while families with no earners (5,450) have the lowest median family income of $60,385, accounting for 11.6% and 15.1% of families, respectively.
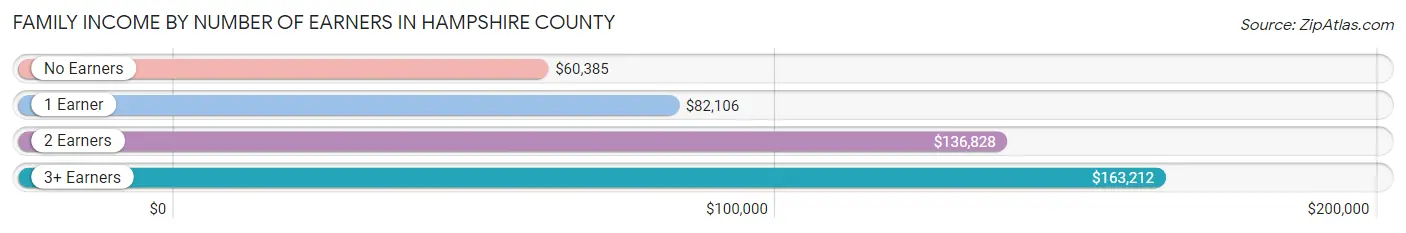
| Number of Earners | # Families | Median Income |
| No Earners | 5,450 (15.1%) | $60,385 |
| 1 Earner | 10,231 (28.4%) | $82,106 |
| 2 Earners | 16,116 (44.8%) | $136,828 |
| 3+ Earners | 4,179 (11.6%) | $163,212 |
| Total | 35,976 (100.0%) | $113,402 |
Household Income in Hampshire County
Household Income Brackets in Hampshire County
With 12,590 households falling in the category, the $100,000 to $149,999 income range is the most frequent in Hampshire County, accounting for 20.5% of all households. In contrast, only 2,457 households (4.0%) fall into the $10,000 to $14,999 income bracket, making it the least populous group.
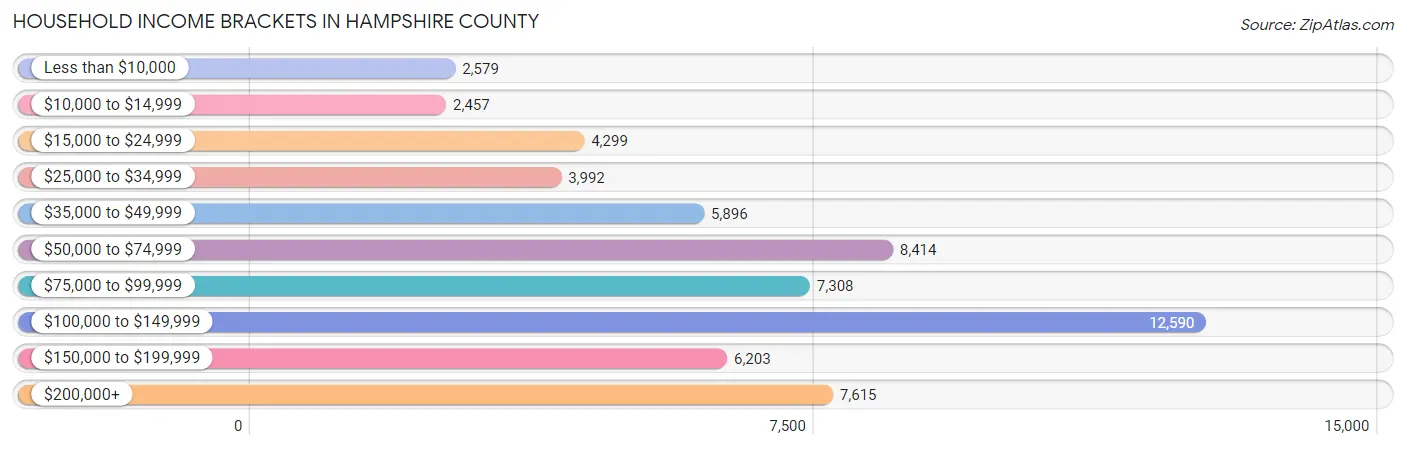
| Income Bracket | # Households | % Households |
| Less than $10,000 | 2,579 | 4.2% |
| $10,000 to $14,999 | 2,457 | 4.0% |
| $15,000 to $24,999 | 4,299 | 7.0% |
| $25,000 to $34,999 | 3,992 | 6.5% |
| $35,000 to $49,999 | 5,896 | 9.6% |
| $50,000 to $74,999 | 8,414 | 13.7% |
| $75,000 to $99,999 | 7,308 | 11.9% |
| $100,000 to $149,999 | 12,590 | 20.5% |
| $150,000 to $199,999 | 6,203 | 10.1% |
| $200,000+ | 7,615 | 12.4% |
Household Income by Householder Age in Hampshire County
The median household income in Hampshire County is $84,025, with the highest median household income of $106,380 found in the 45 to 64 years age bracket for the primary householder. A total of 22,736 households (37.0%) fall into this category. Meanwhile, the 15 to 24 years age bracket for the primary householder has the lowest median household income of $35,010, with 3,635 households (5.9%) in this group.
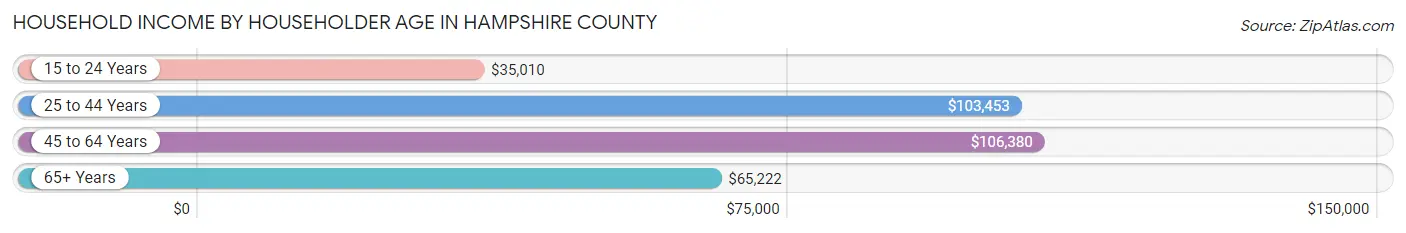
| Income Bracket | # Households | Median Income |
| 15 to 24 Years | 3,635 (5.9%) | $35,010 |
| 25 to 44 Years | 15,861 (25.8%) | $103,453 |
| 45 to 64 Years | 22,736 (37.0%) | $106,380 |
| 65+ Years | 19,182 (31.2%) | $65,222 |
| Total | 61,414 (100.0%) | $84,025 |
Poverty in Hampshire County
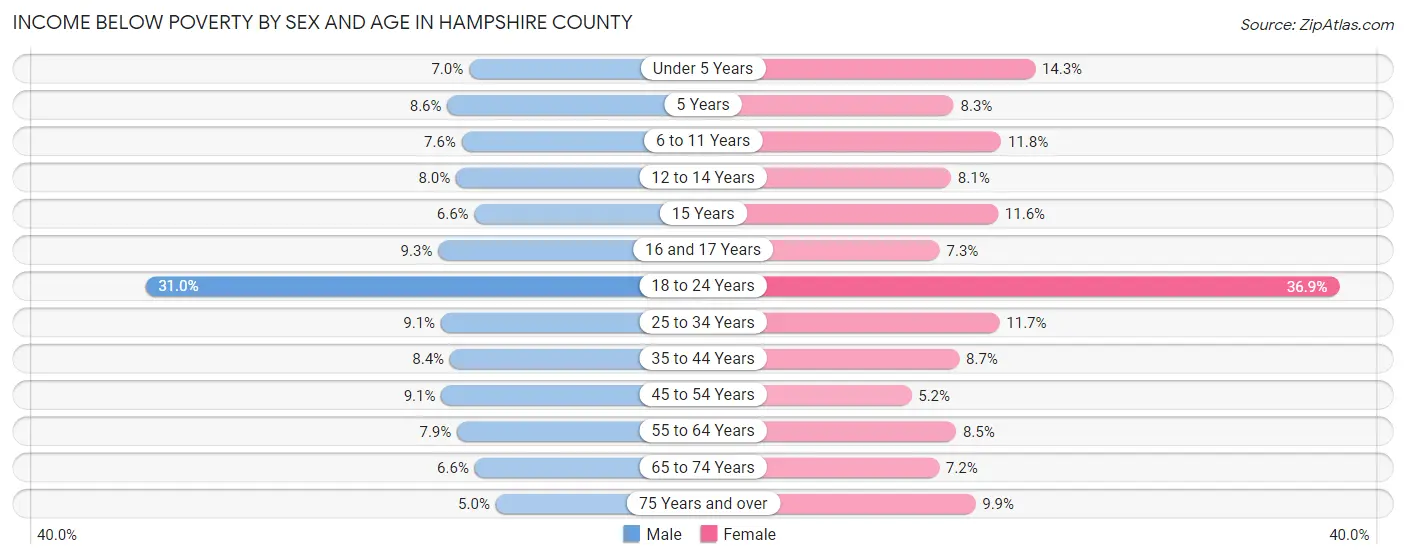
Income Below Poverty by Sex and Age in Hampshire County
With 10.3% poverty level for males and 10.9% for females among the residents of Hampshire County, 18 to 24 year old males and 18 to 24 year old females are the most vulnerable to poverty, with 2,142 males (31.0%) and 1,876 females (36.9%) in their respective age groups living below the poverty level.
| Age Bracket | Male | Female |
| Under 5 Years | 173 (7.0%) | 356 (14.3%) |
| 5 Years | 39 (8.6%) | 37 (8.3%) |
| 6 to 11 Years | 302 (7.5%) | 449 (11.8%) |
| 12 to 14 Years | 197 (8.0%) | 163 (8.1%) |
| 15 Years | 64 (6.6%) | 64 (11.6%) |
| 16 and 17 Years | 131 (9.3%) | 110 (7.3%) |
| 18 to 24 Years | 2,142 (31.0%) | 1,876 (36.9%) |
| 25 to 34 Years | 708 (9.1%) | 924 (11.7%) |
| 35 to 44 Years | 631 (8.4%) | 725 (8.7%) |
| 45 to 54 Years | 759 (9.1%) | 461 (5.2%) |
| 55 to 64 Years | 783 (7.9%) | 942 (8.5%) |
| 65 to 74 Years | 550 (6.6%) | 699 (7.2%) |
| 75 Years and over | 222 (5.0%) | 626 (9.9%) |
| Total | 6,701 (10.3%) | 7,432 (10.9%) |
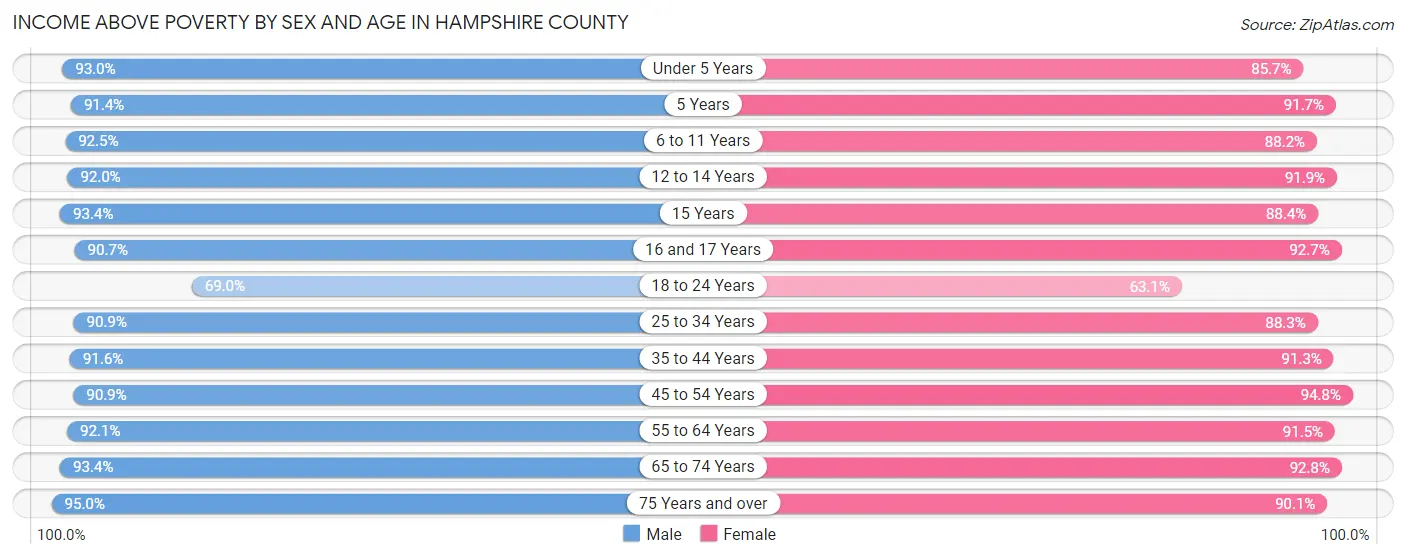
Income Above Poverty by Sex and Age in Hampshire County
According to the poverty statistics in Hampshire County, males aged 75 years and over and females aged 45 to 54 years are the age groups that are most secure financially, with 95.0% of males and 94.8% of females in these age groups living above the poverty line.
| Age Bracket | Male | Female |
| Under 5 Years | 2,297 (93.0%) | 2,126 (85.7%) |
| 5 Years | 414 (91.4%) | 409 (91.7%) |
| 6 to 11 Years | 3,698 (92.4%) | 3,349 (88.2%) |
| 12 to 14 Years | 2,279 (92.0%) | 1,850 (91.9%) |
| 15 Years | 906 (93.4%) | 488 (88.4%) |
| 16 and 17 Years | 1,279 (90.7%) | 1,405 (92.7%) |
| 18 to 24 Years | 4,758 (69.0%) | 3,207 (63.1%) |
| 25 to 34 Years | 7,080 (90.9%) | 6,972 (88.3%) |
| 35 to 44 Years | 6,860 (91.6%) | 7,597 (91.3%) |
| 45 to 54 Years | 7,621 (90.9%) | 8,472 (94.8%) |
| 55 to 64 Years | 9,144 (92.1%) | 10,173 (91.5%) |
| 65 to 74 Years | 7,806 (93.4%) | 8,990 (92.8%) |
| 75 Years and over | 4,204 (95.0%) | 5,691 (90.1%) |
| Total | 58,346 (89.7%) | 60,729 (89.1%) |
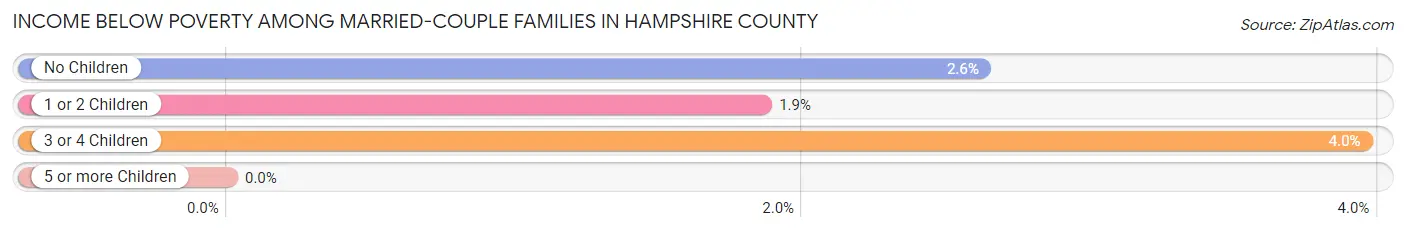
Income Below Poverty Among Married-Couple Families in Hampshire County
The poverty statistics for married-couple families in Hampshire County show that 2.5% or 679 of the total 27,532 families live below the poverty line. Families with 3 or 4 children have the highest poverty rate of 4.0%, comprising of 55 families. On the other hand, families with 5 or more children have the lowest poverty rate of 0.0%, which includes 0 families.
| Children | Above Poverty | Below Poverty |
| No Children | 17,720 (97.4%) | 477 (2.6%) |
| 1 or 2 Children | 7,758 (98.1%) | 147 (1.9%) |
| 3 or 4 Children | 1,337 (96.1%) | 55 (4.0%) |
| 5 or more Children | 38 (100.0%) | 0 (0.0%) |
| Total | 26,853 (97.5%) | 679 (2.5%) |
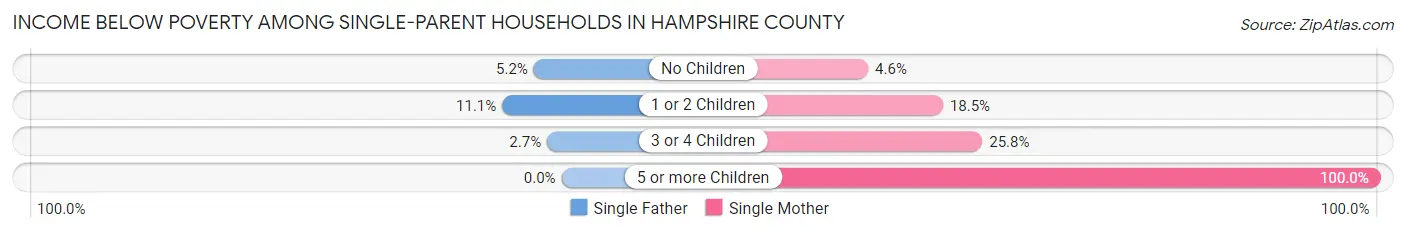
Income Below Poverty Among Single-Parent Households in Hampshire County
According to the poverty data in Hampshire County, 7.6% or 181 single-father households and 12.9% or 783 single-mother households are living below the poverty line. Among single-father households, those with 1 or 2 children have the highest poverty rate, with 112 households (11.1%) experiencing poverty. Likewise, among single-mother households, those with 5 or more children have the highest poverty rate, with 17 households (100.0%) falling below the poverty line.
| Children | Single Father | Single Mother |
| No Children | 67 (5.2%) | 124 (4.6%) |
| 1 or 2 Children | 112 (11.1%) | 547 (18.5%) |
| 3 or 4 Children | 2 (2.7%) | 95 (25.8%) |
| 5 or more Children | 0 (0.0%) | 17 (100.0%) |
| Total | 181 (7.6%) | 783 (12.9%) |
Income Below Poverty Among Married-Couple vs Single-Parent Households in Hampshire County
The poverty data for Hampshire County shows that 679 of the married-couple family households (2.5%) and 964 of the single-parent households (11.4%) are living below the poverty level. Within the married-couple family households, those with 3 or 4 children have the highest poverty rate, with 55 households (4.0%) falling below the poverty line. Among the single-parent households, those with 5 or more children have the highest poverty rate, with 17 household (100.0%) living below poverty.
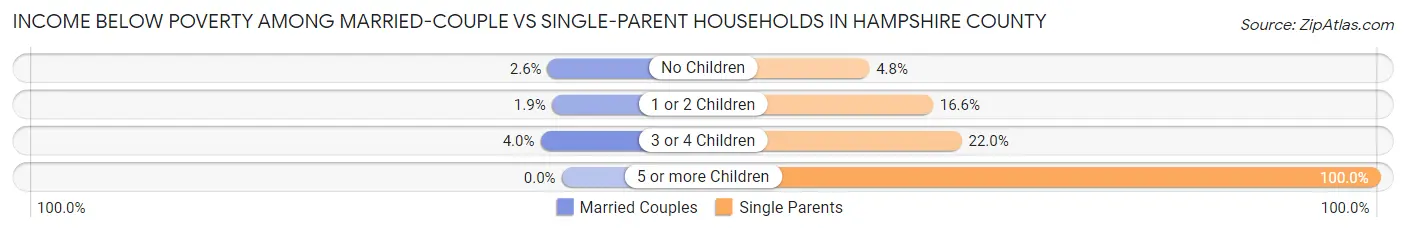
| Children | Married-Couple Families | Single-Parent Households |
| No Children | 477 (2.6%) | 191 (4.8%) |
| 1 or 2 Children | 147 (1.9%) | 659 (16.6%) |
| 3 or 4 Children | 55 (4.0%) | 97 (22.0%) |
| 5 or more Children | 0 (0.0%) | 17 (100.0%) |
| Total | 679 (2.5%) | 964 (11.4%) |
Employment Characteristics in Hampshire County
Employment by Class of Employer in Hampshire County
Among the 75,077 employed individuals in Hampshire County, private company employees (38,866 | 51.8%), not-for-profit organizations (12,286 | 16.4%), and state government employees (8,460 | 11.3%) make up the most common classes of employment.
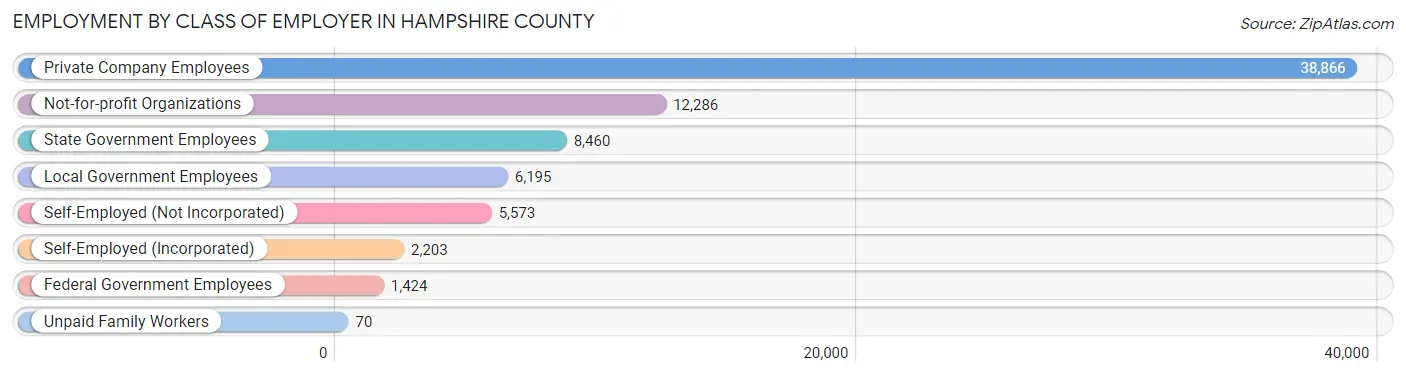
| Employer Class | # Employees | % Employees |
| Private Company Employees | 38,866 | 51.8% |
| Self-Employed (Incorporated) | 2,203 | 2.9% |
| Self-Employed (Not Incorporated) | 5,573 | 7.4% |
| Not-for-profit Organizations | 12,286 | 16.4% |
| Local Government Employees | 6,195 | 8.3% |
| State Government Employees | 8,460 | 11.3% |
| Federal Government Employees | 1,424 | 1.9% |
| Unpaid Family Workers | 70 | 0.1% |
| Total | 75,077 | 100.0% |
Employment Status by Age in Hampshire County
According to the labor force statistics for Hampshire County, out of the total population over 16 years of age (133,851), 61.4% or 82,185 individuals are in the labor force, with 5.3% or 4,356 of them unemployed. The age group with the highest labor force participation rate is 30 to 34 years, with 90.8% or 6,976 individuals in the labor force. Within the labor force, the 16 to 19 years age range has the highest percentage of unemployed individuals, with 19.6% or 1,004 of them being unemployed.
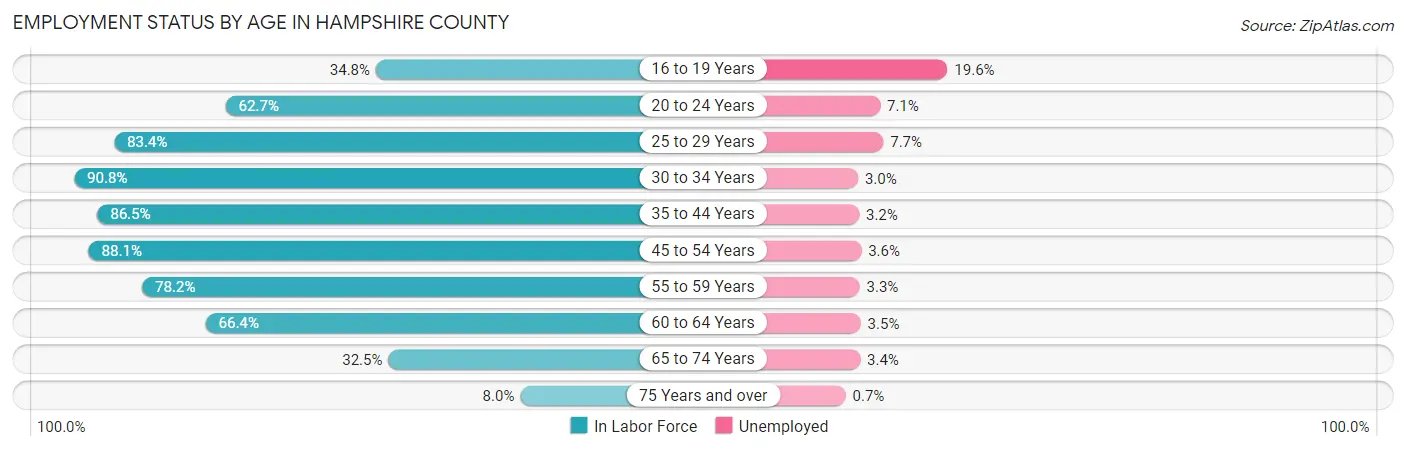
| Age Bracket | In Labor Force | Unemployed |
| 16 to 19 Years | 5,125 (34.8%) | 1,005 (19.6%) |
| 20 to 24 Years | 12,156 (62.7%) | 863 (7.1%) |
| 25 to 29 Years | 6,800 (83.4%) | 524 (7.7%) |
| 30 to 34 Years | 6,976 (90.8%) | 209 (3.0%) |
| 35 to 44 Years | 13,766 (86.5%) | 441 (3.2%) |
| 45 to 54 Years | 15,316 (88.1%) | 551 (3.6%) |
| 55 to 59 Years | 7,848 (78.2%) | 259 (3.3%) |
| 60 to 64 Years | 7,368 (66.4%) | 258 (3.5%) |
| 65 to 74 Years | 5,923 (32.5%) | 201 (3.4%) |
| 75 Years and over | 899 (8.0%) | 6 (0.7%) |
| Total | 82,185 (61.4%) | 4,356 (5.3%) |
Employment Status by Educational Attainment in Hampshire County
According to labor force statistics for Hampshire County, 82.6% of individuals (58,043) out of the total population between 25 and 64 years of age (70,270) are in the labor force, with 3.9% or 2,264 of them being unemployed. The group with the highest labor force participation rate are those with the educational attainment of bachelor's degree or higher, with 88.6% or 32,607 individuals in the labor force. Within the labor force, individuals with less than high school education have the highest percentage of unemployment, with 6.5% or 100 of them being unemployed.
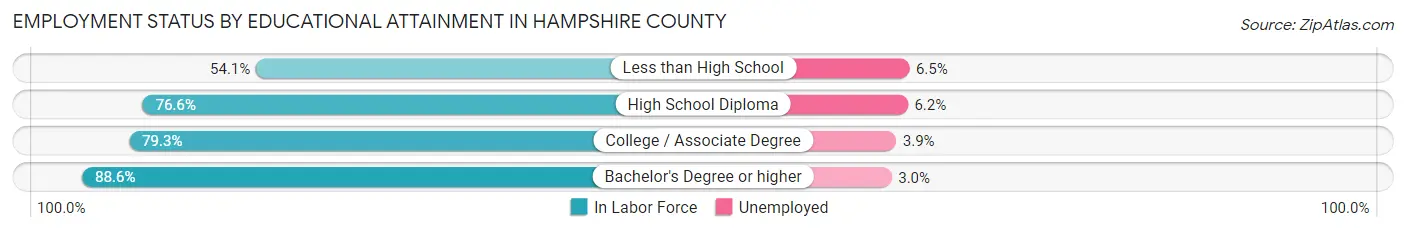
| Educational Attainment | In Labor Force | Unemployed |
| Less than High School | 1,541 (54.1%) | 185 (6.5%) |
| High School Diploma | 10,670 (76.6%) | 864 (6.2%) |
| College / Associate Degree | 13,236 (79.3%) | 651 (3.9%) |
| Bachelor's Degree or higher | 32,607 (88.6%) | 1,104 (3.0%) |
| Total | 58,043 (82.6%) | 2,741 (3.9%) |
Employment Occupations by Sex in Hampshire County
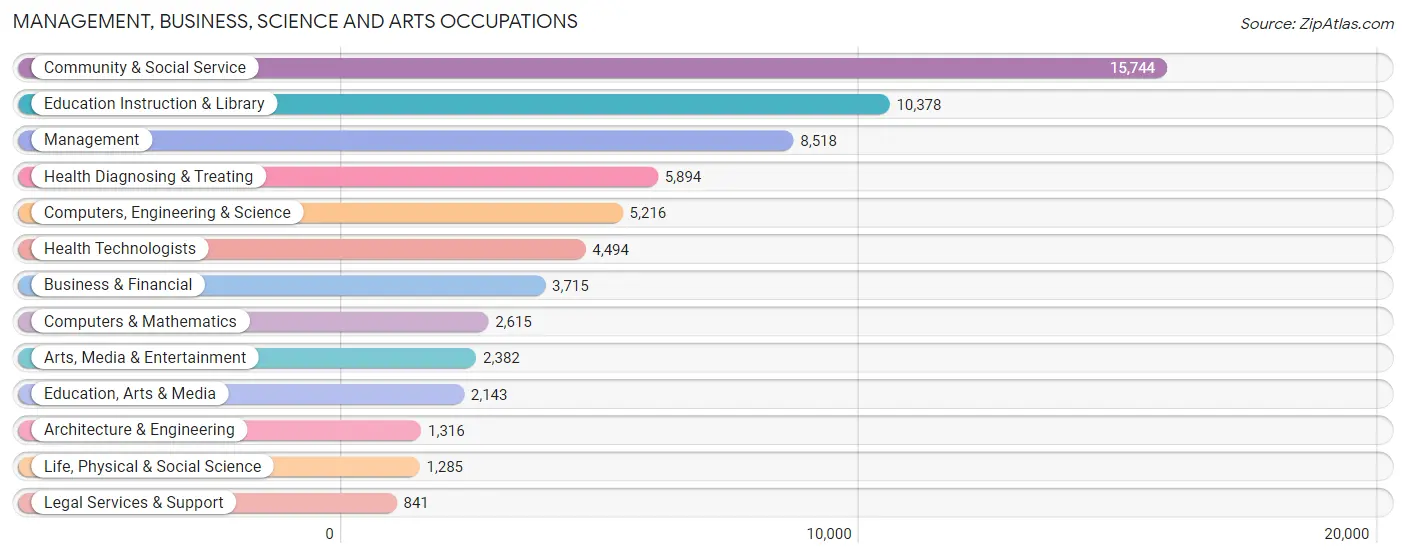
Management, Business, Science and Arts Occupations
The most common Management, Business, Science and Arts occupations in Hampshire County are Community & Social Service (15,744 | 20.2%), Education Instruction & Library (10,378 | 13.3%), Management (8,518 | 11.0%), Health Diagnosing & Treating (5,894 | 7.6%), and Computers, Engineering & Science (5,216 | 6.7%).
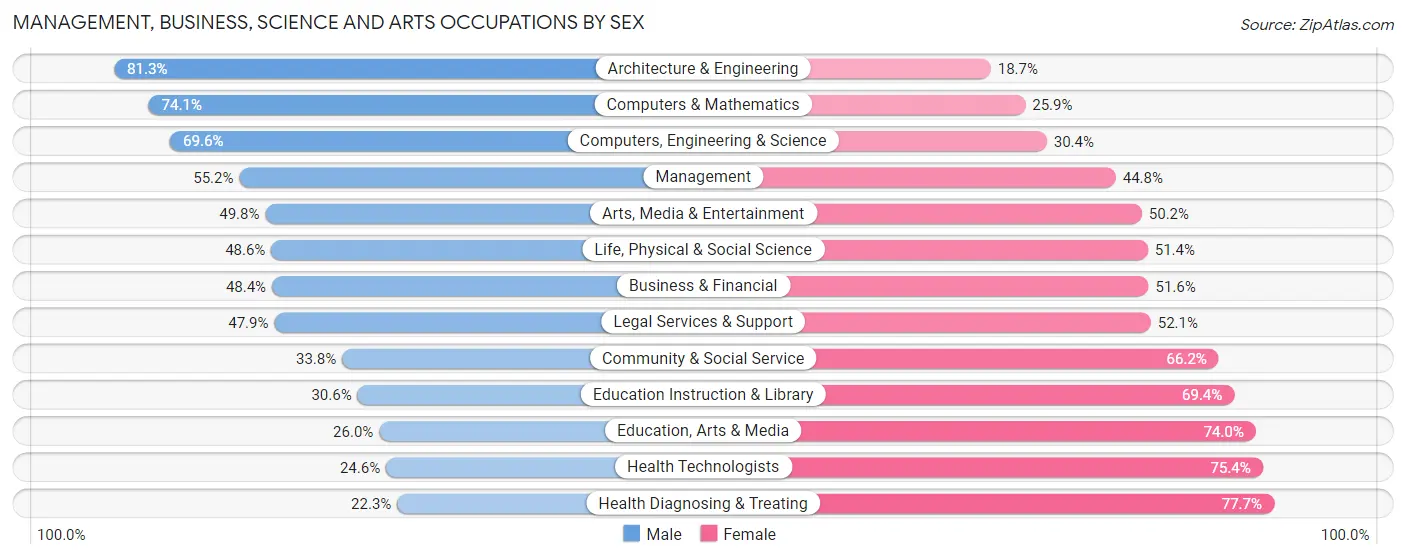
Management, Business, Science and Arts Occupations by Sex
Within the Management, Business, Science and Arts occupations in Hampshire County, the most male-oriented occupations are Architecture & Engineering (81.3%), Computers & Mathematics (74.1%), and Computers, Engineering & Science (69.6%), while the most female-oriented occupations are Health Diagnosing & Treating (77.7%), Health Technologists (75.4%), and Education, Arts & Media (74.0%).
| Occupation | Male | Female |
| Management | 4,704 (55.2%) | 3,814 (44.8%) |
| Business & Financial | 1,798 (48.4%) | 1,917 (51.6%) |
| Computers, Engineering & Science | 3,632 (69.6%) | 1,584 (30.4%) |
| Computers & Mathematics | 1,938 (74.1%) | 677 (25.9%) |
| Architecture & Engineering | 1,070 (81.3%) | 246 (18.7%) |
| Life, Physical & Social Science | 624 (48.6%) | 661 (51.4%) |
| Community & Social Service | 5,319 (33.8%) | 10,425 (66.2%) |
| Education, Arts & Media | 558 (26.0%) | 1,585 (74.0%) |
| Legal Services & Support | 403 (47.9%) | 438 (52.1%) |
| Education Instruction & Library | 3,172 (30.6%) | 7,206 (69.4%) |
| Arts, Media & Entertainment | 1,186 (49.8%) | 1,196 (50.2%) |
| Health Diagnosing & Treating | 1,313 (22.3%) | 4,581 (77.7%) |
| Health Technologists | 1,106 (24.6%) | 3,388 (75.4%) |
| Total (Category) | 16,766 (42.9%) | 22,321 (57.1%) |
| Total (Overall) | 37,736 (48.5%) | 40,070 (51.5%) |
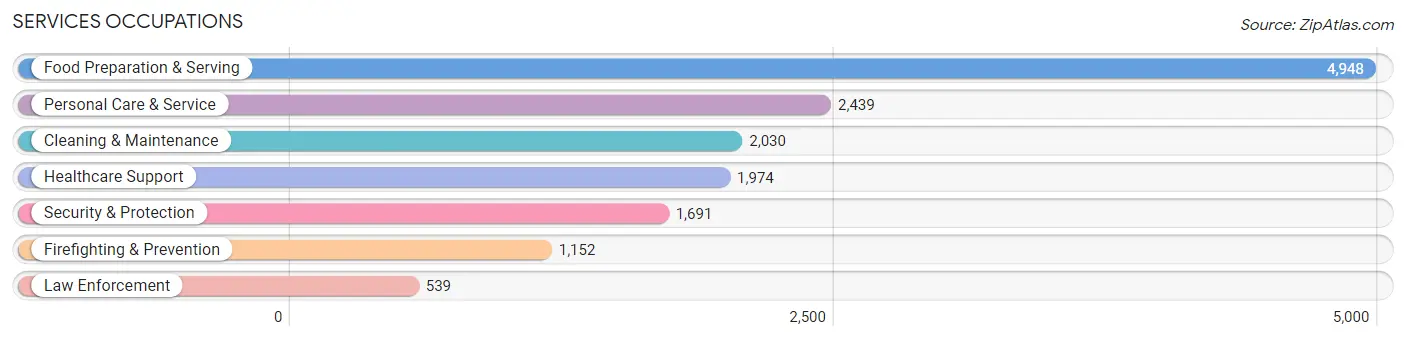
Services Occupations
The most common Services occupations in Hampshire County are Food Preparation & Serving (4,948 | 6.4%), Personal Care & Service (2,439 | 3.1%), Cleaning & Maintenance (2,030 | 2.6%), Healthcare Support (1,974 | 2.5%), and Security & Protection (1,691 | 2.2%).
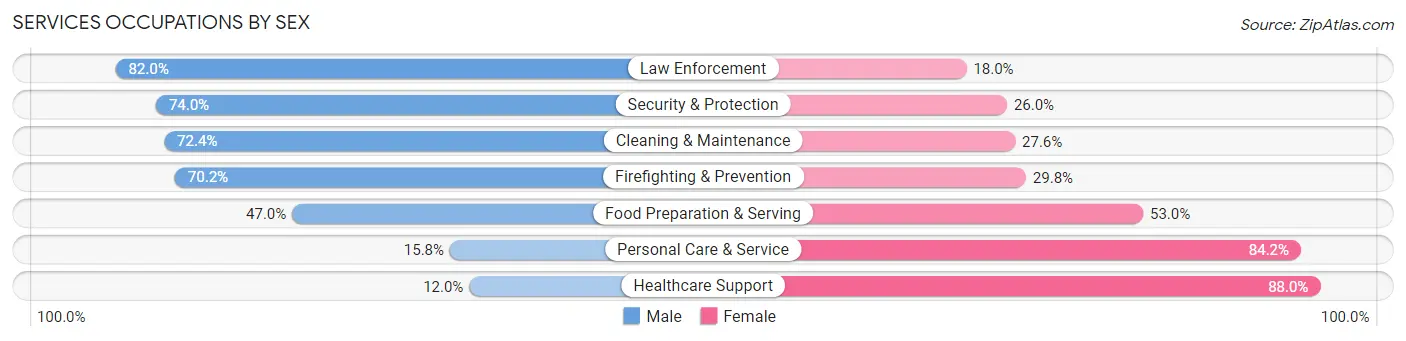
Services Occupations by Sex
Within the Services occupations in Hampshire County, the most male-oriented occupations are Law Enforcement (82.0%), Security & Protection (74.0%), and Cleaning & Maintenance (72.4%), while the most female-oriented occupations are Healthcare Support (88.0%), Personal Care & Service (84.2%), and Food Preparation & Serving (53.0%).
| Occupation | Male | Female |
| Healthcare Support | 236 (12.0%) | 1,738 (88.0%) |
| Security & Protection | 1,251 (74.0%) | 440 (26.0%) |
| Firefighting & Prevention | 809 (70.2%) | 343 (29.8%) |
| Law Enforcement | 442 (82.0%) | 97 (18.0%) |
| Food Preparation & Serving | 2,327 (47.0%) | 2,621 (53.0%) |
| Cleaning & Maintenance | 1,469 (72.4%) | 561 (27.6%) |
| Personal Care & Service | 385 (15.8%) | 2,054 (84.2%) |
| Total (Category) | 5,668 (43.3%) | 7,414 (56.7%) |
| Total (Overall) | 37,736 (48.5%) | 40,070 (51.5%) |
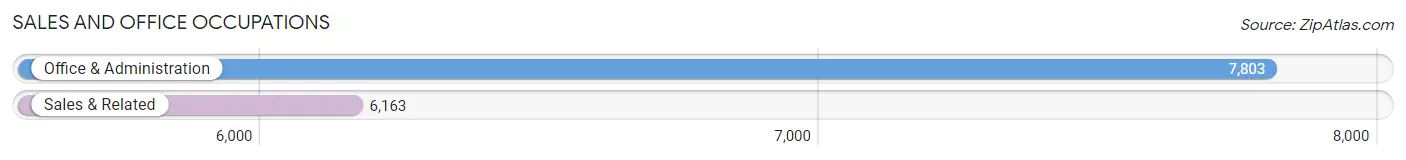
Sales and Office Occupations
The most common Sales and Office occupations in Hampshire County are Office & Administration (7,803 | 10.0%), and Sales & Related (6,163 | 7.9%).
Sales and Office Occupations by Sex
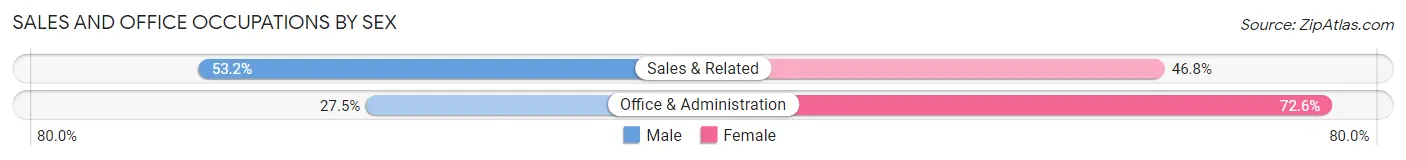
| Occupation | Male | Female |
| Sales & Related | 3,278 (53.2%) | 2,885 (46.8%) |
| Office & Administration | 2,142 (27.5%) | 5,661 (72.6%) |
| Total (Category) | 5,420 (38.8%) | 8,546 (61.2%) |
| Total (Overall) | 37,736 (48.5%) | 40,070 (51.5%) |
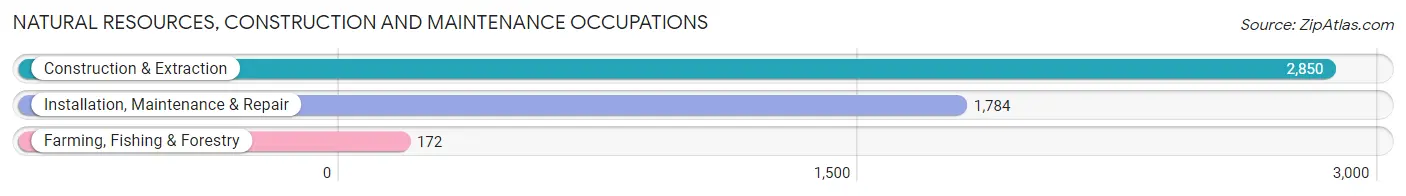
Natural Resources, Construction and Maintenance Occupations
The most common Natural Resources, Construction and Maintenance occupations in Hampshire County are Construction & Extraction (2,850 | 3.7%), Installation, Maintenance & Repair (1,784 | 2.3%), and Farming, Fishing & Forestry (172 | 0.2%).
Natural Resources, Construction and Maintenance Occupations by Sex
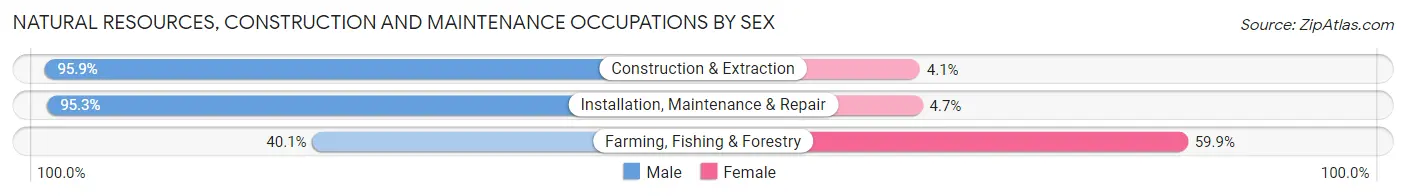
| Occupation | Male | Female |
| Farming, Fishing & Forestry | 69 (40.1%) | 103 (59.9%) |
| Construction & Extraction | 2,732 (95.9%) | 118 (4.1%) |
| Installation, Maintenance & Repair | 1,700 (95.3%) | 84 (4.7%) |
| Total (Category) | 4,501 (93.6%) | 305 (6.4%) |
| Total (Overall) | 37,736 (48.5%) | 40,070 (51.5%) |
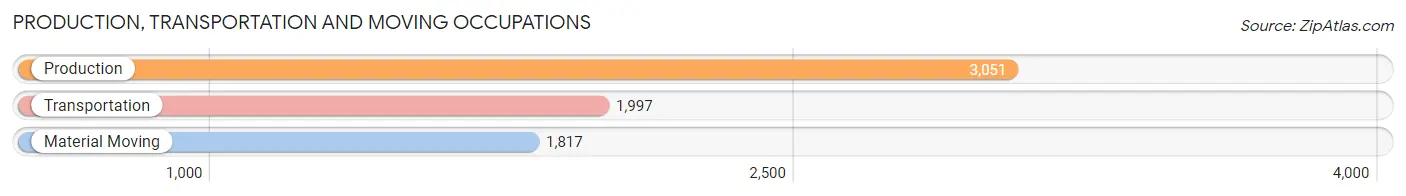
Production, Transportation and Moving Occupations
The most common Production, Transportation and Moving occupations in Hampshire County are Production (3,051 | 3.9%), Transportation (1,997 | 2.6%), and Material Moving (1,817 | 2.3%).
Production, Transportation and Moving Occupations by Sex
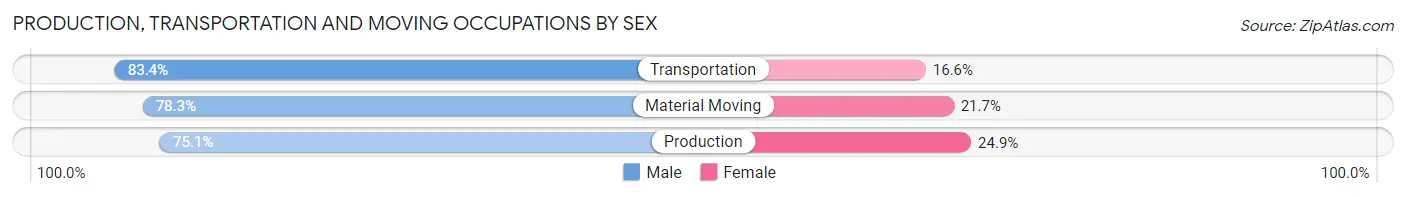
| Occupation | Male | Female |
| Production | 2,292 (75.1%) | 759 (24.9%) |
| Transportation | 1,666 (83.4%) | 331 (16.6%) |
| Material Moving | 1,423 (78.3%) | 394 (21.7%) |
| Total (Category) | 5,381 (78.4%) | 1,484 (21.6%) |
| Total (Overall) | 37,736 (48.5%) | 40,070 (51.5%) |
Employment Industries by Sex in Hampshire County
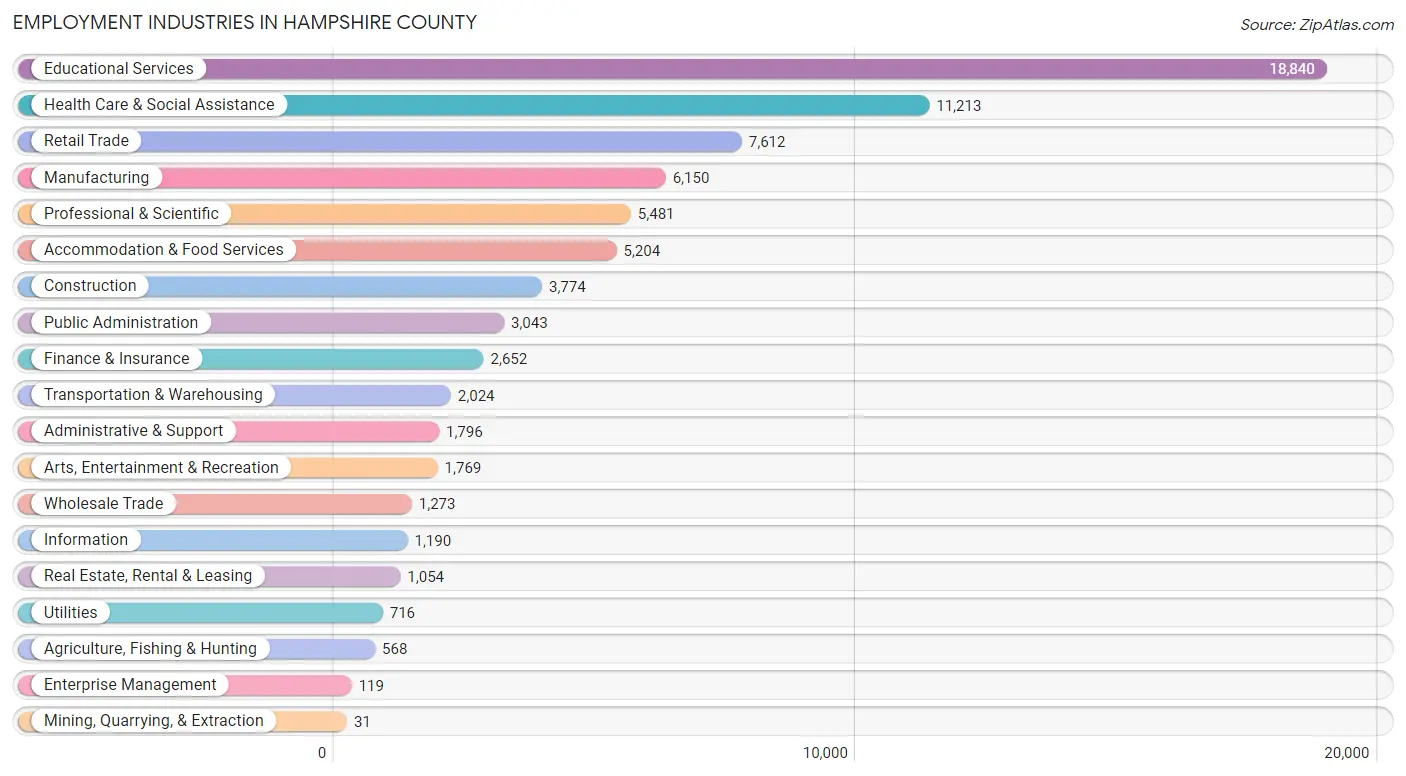
Employment Industries in Hampshire County
The major employment industries in Hampshire County include Educational Services (18,840 | 24.2%), Health Care & Social Assistance (11,213 | 14.4%), Retail Trade (7,612 | 9.8%), Manufacturing (6,150 | 7.9%), and Professional & Scientific (5,481 | 7.0%).
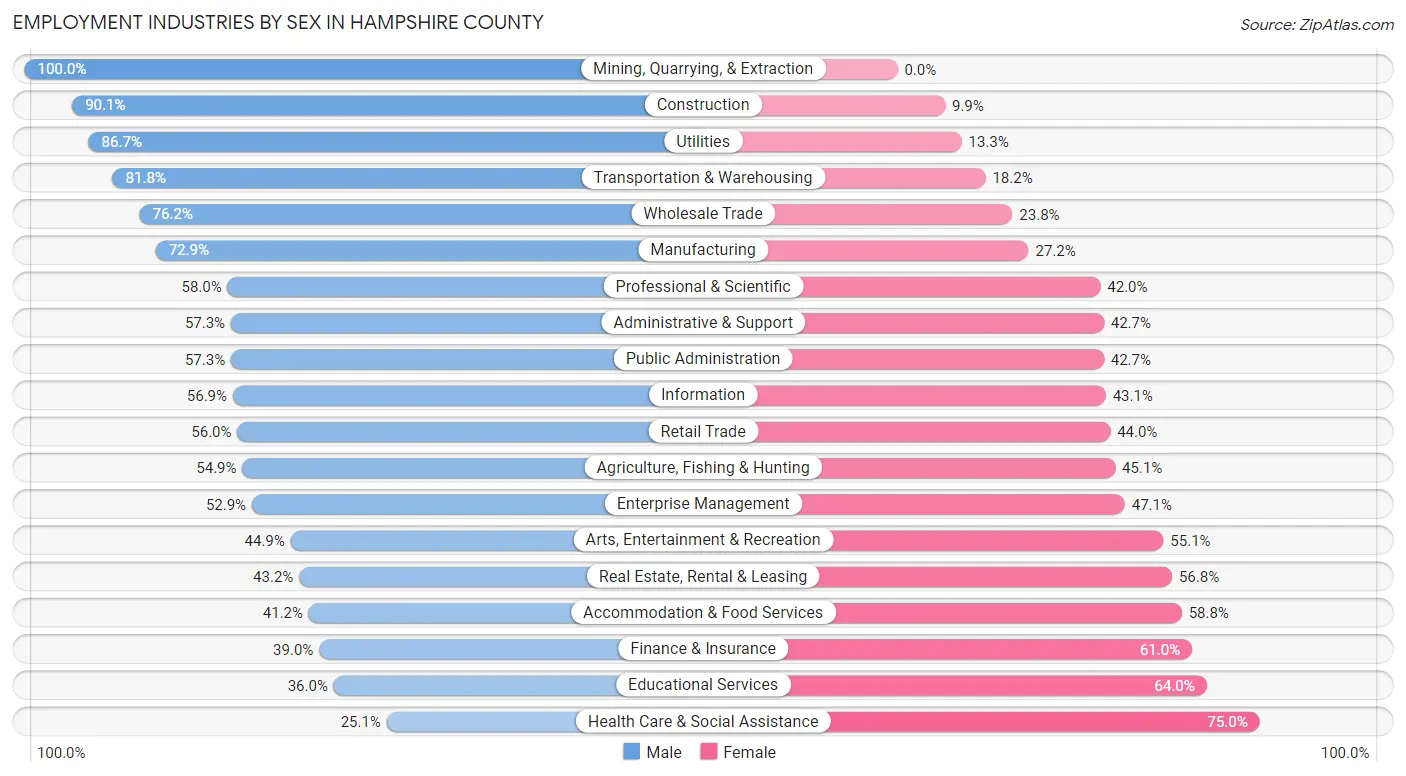
Employment Industries by Sex in Hampshire County
The Hampshire County industries that see more men than women are Mining, Quarrying, & Extraction (100.0%), Construction (90.1%), and Utilities (86.7%), whereas the industries that tend to have a higher number of women are Health Care & Social Assistance (75.0%), Educational Services (64.0%), and Finance & Insurance (61.0%).
| Industry | Male | Female |
| Agriculture, Fishing & Hunting | 312 (54.9%) | 256 (45.1%) |
| Mining, Quarrying, & Extraction | 31 (100.0%) | 0 (0.0%) |
| Construction | 3,402 (90.1%) | 372 (9.9%) |
| Manufacturing | 4,480 (72.9%) | 1,670 (27.2%) |
| Wholesale Trade | 970 (76.2%) | 303 (23.8%) |
| Retail Trade | 4,260 (56.0%) | 3,352 (44.0%) |
| Transportation & Warehousing | 1,655 (81.8%) | 369 (18.2%) |
| Utilities | 621 (86.7%) | 95 (13.3%) |
| Information | 677 (56.9%) | 513 (43.1%) |
| Finance & Insurance | 1,035 (39.0%) | 1,617 (61.0%) |
| Real Estate, Rental & Leasing | 455 (43.2%) | 599 (56.8%) |
| Professional & Scientific | 3,179 (58.0%) | 2,302 (42.0%) |
| Enterprise Management | 63 (52.9%) | 56 (47.1%) |
| Administrative & Support | 1,029 (57.3%) | 767 (42.7%) |
| Educational Services | 6,785 (36.0%) | 12,055 (64.0%) |
| Health Care & Social Assistance | 2,809 (25.1%) | 8,404 (75.0%) |
| Arts, Entertainment & Recreation | 795 (44.9%) | 974 (55.1%) |
| Accommodation & Food Services | 2,142 (41.2%) | 3,062 (58.8%) |
| Public Administration | 1,743 (57.3%) | 1,300 (42.7%) |
| Total | 37,736 (48.5%) | 40,070 (51.5%) |
Education in Hampshire County
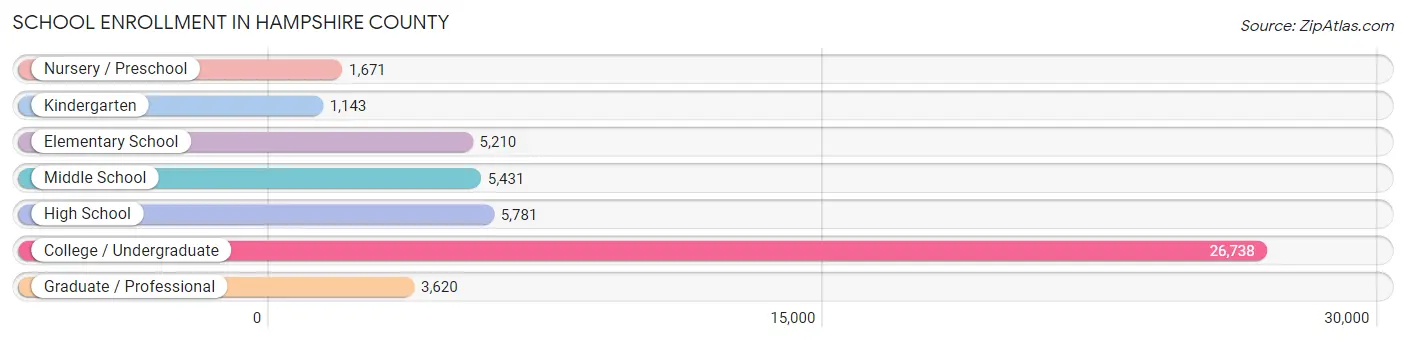
School Enrollment in Hampshire County
The most common levels of schooling among the 49,594 students in Hampshire County are college / undergraduate (26,738 | 53.9%), high school (5,781 | 11.7%), and middle school (5,431 | 11.0%).
| School Level | # Students | % Students |
| Nursery / Preschool | 1,671 | 3.4% |
| Kindergarten | 1,143 | 2.3% |
| Elementary School | 5,210 | 10.5% |
| Middle School | 5,431 | 11.0% |
| High School | 5,781 | 11.7% |
| College / Undergraduate | 26,738 | 53.9% |
| Graduate / Professional | 3,620 | 7.3% |
| Total | 49,594 | 100.0% |
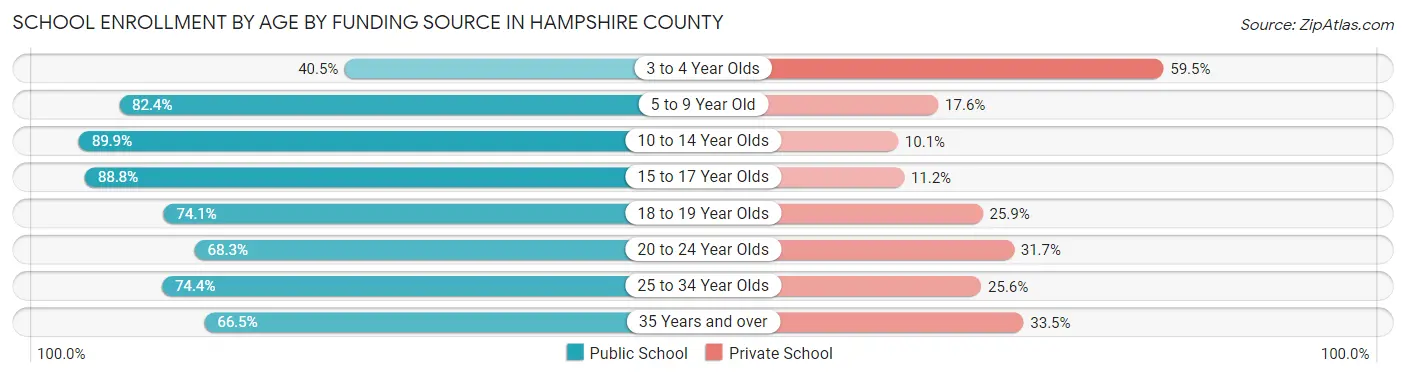
School Enrollment by Age by Funding Source in Hampshire County
Out of a total of 49,594 students who are enrolled in schools in Hampshire County, 12,002 (24.2%) attend a private institution, while the remaining 37,592 (75.8%) are enrolled in public schools. The age group of 3 to 4 year olds has the highest likelihood of being enrolled in private schools, with 815 (59.5% in the age bracket) enrolled. Conversely, the age group of 10 to 14 year olds has the lowest likelihood of being enrolled in a private school, with 6,371 (89.9% in the age bracket) attending a public institution.
| Age Bracket | Public School | Private School |
| 3 to 4 Year Olds | 554 (40.5%) | 815 (59.5%) |
| 5 to 9 Year Old | 4,799 (82.4%) | 1,025 (17.6%) |
| 10 to 14 Year Olds | 6,371 (89.9%) | 716 (10.1%) |
| 15 to 17 Year Olds | 4,095 (88.8%) | 518 (11.2%) |
| 18 to 19 Year Olds | 8,332 (74.1%) | 2,906 (25.9%) |
| 20 to 24 Year Olds | 10,117 (68.3%) | 4,692 (31.7%) |
| 25 to 34 Year Olds | 2,171 (74.4%) | 747 (25.6%) |
| 35 Years and over | 1,155 (66.5%) | 581 (33.5%) |
| Total | 37,592 (75.8%) | 12,002 (24.2%) |
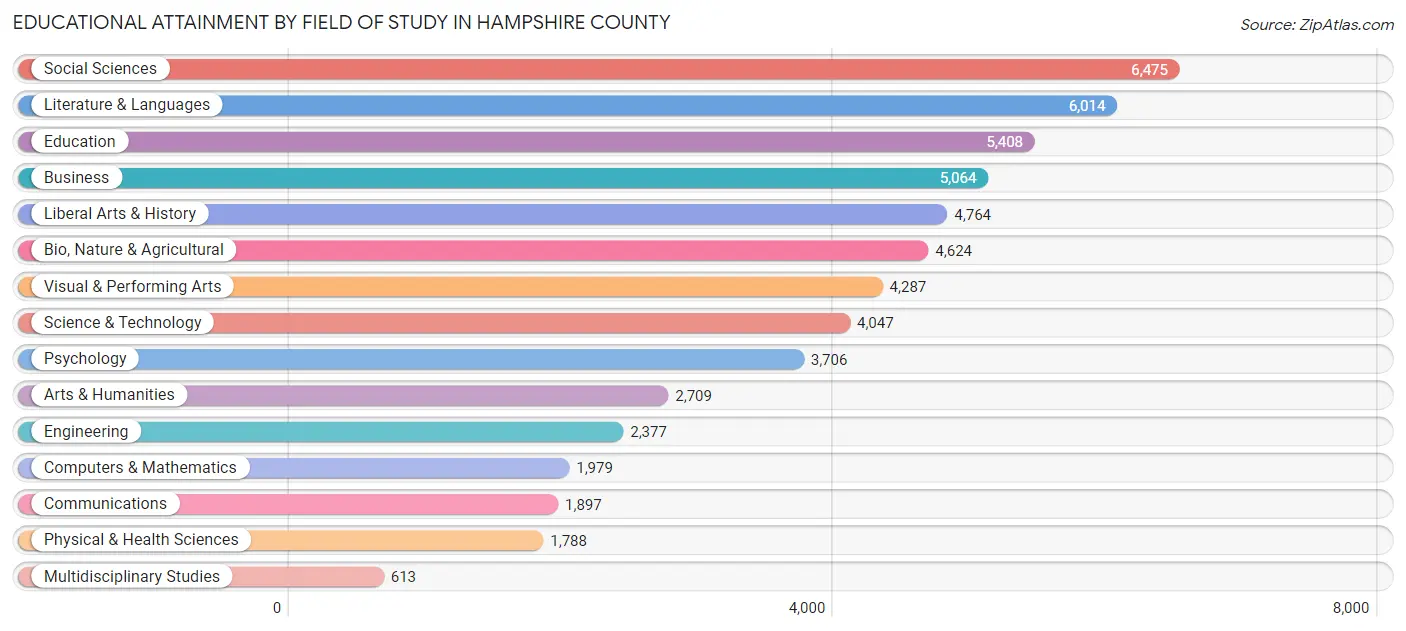
Educational Attainment by Field of Study in Hampshire County
Social sciences (6,475 | 11.6%), literature & languages (6,014 | 10.8%), education (5,408 | 9.7%), business (5,064 | 9.1%), and liberal arts & history (4,764 | 8.5%) are the most common fields of study among 55,752 individuals in Hampshire County who have obtained a bachelor's degree or higher.
| Field of Study | # Graduates | % Graduates |
| Computers & Mathematics | 1,979 | 3.5% |
| Bio, Nature & Agricultural | 4,624 | 8.3% |
| Physical & Health Sciences | 1,788 | 3.2% |
| Psychology | 3,706 | 6.7% |
| Social Sciences | 6,475 | 11.6% |
| Engineering | 2,377 | 4.3% |
| Multidisciplinary Studies | 613 | 1.1% |
| Science & Technology | 4,047 | 7.3% |
| Business | 5,064 | 9.1% |
| Education | 5,408 | 9.7% |
| Literature & Languages | 6,014 | 10.8% |
| Liberal Arts & History | 4,764 | 8.5% |
| Visual & Performing Arts | 4,287 | 7.7% |
| Communications | 1,897 | 3.4% |
| Arts & Humanities | 2,709 | 4.9% |
| Total | 55,752 | 100.0% |
Transportation & Commute in Hampshire County
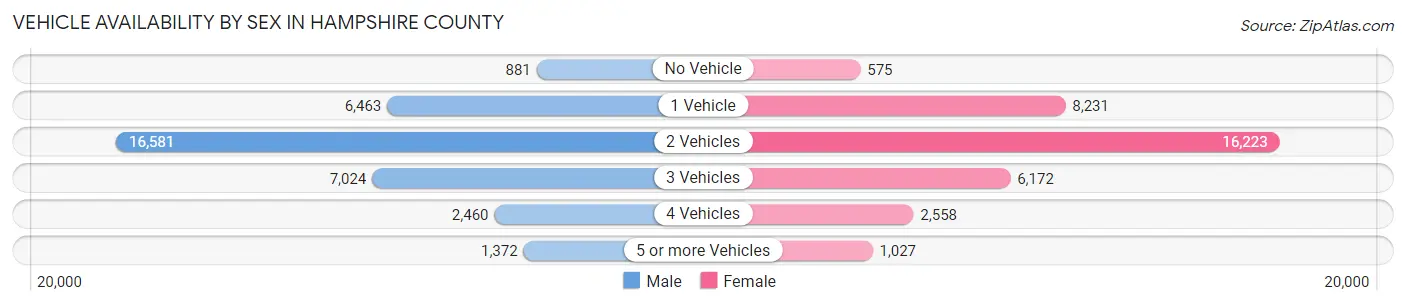
Vehicle Availability by Sex in Hampshire County
The most prevalent vehicle ownership categories in Hampshire County are males with 2 vehicles (16,581, accounting for 47.7%) and females with 2 vehicles (16,223, making up 47.7%).
| Vehicles Available | Male | Female |
| No Vehicle | 881 (2.5%) | 575 (1.7%) |
| 1 Vehicle | 6,463 (18.6%) | 8,231 (23.7%) |
| 2 Vehicles | 16,581 (47.7%) | 16,223 (46.6%) |
| 3 Vehicles | 7,024 (20.2%) | 6,172 (17.7%) |
| 4 Vehicles | 2,460 (7.1%) | 2,558 (7.3%) |
| 5 or more Vehicles | 1,372 (3.9%) | 1,027 (2.9%) |
| Total | 34,781 (100.0%) | 34,786 (100.0%) |
Commute Time in Hampshire County
The most frequently occuring commute durations in Hampshire County are 15 to 19 minutes (9,944 commuters, 15.5%), 10 to 14 minutes (8,918 commuters, 13.9%), and 20 to 24 minutes (8,712 commuters, 13.6%).
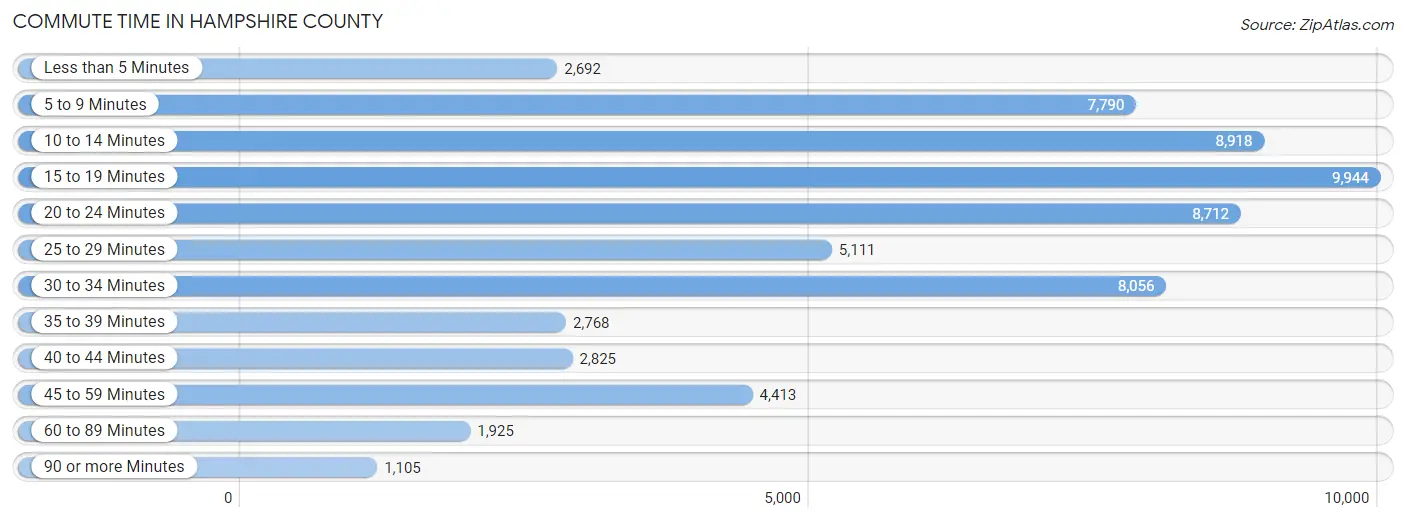
| Commute Time | # Commuters | % Commuters |
| Less than 5 Minutes | 2,692 | 4.2% |
| 5 to 9 Minutes | 7,790 | 12.1% |
| 10 to 14 Minutes | 8,918 | 13.9% |
| 15 to 19 Minutes | 9,944 | 15.5% |
| 20 to 24 Minutes | 8,712 | 13.6% |
| 25 to 29 Minutes | 5,111 | 8.0% |
| 30 to 34 Minutes | 8,056 | 12.5% |
| 35 to 39 Minutes | 2,768 | 4.3% |
| 40 to 44 Minutes | 2,825 | 4.4% |
| 45 to 59 Minutes | 4,413 | 6.9% |
| 60 to 89 Minutes | 1,925 | 3.0% |
| 90 or more Minutes | 1,105 | 1.7% |
Commute Time by Sex in Hampshire County
The most common commute times in Hampshire County are 15 to 19 minutes (4,511 commuters, 14.2%) for males and 15 to 19 minutes (5,433 commuters, 16.7%) for females.
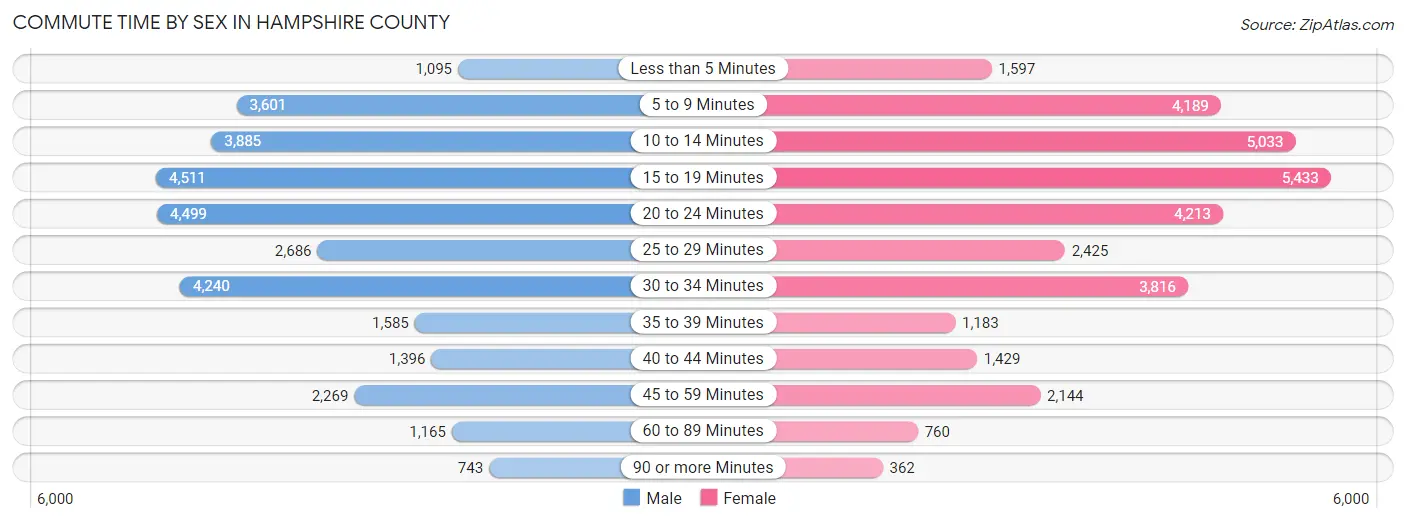
| Commute Time | Male | Female |
| Less than 5 Minutes | 1,095 (3.5%) | 1,597 (4.9%) |
| 5 to 9 Minutes | 3,601 (11.4%) | 4,189 (12.9%) |
| 10 to 14 Minutes | 3,885 (12.3%) | 5,033 (15.4%) |
| 15 to 19 Minutes | 4,511 (14.2%) | 5,433 (16.7%) |
| 20 to 24 Minutes | 4,499 (14.2%) | 4,213 (12.9%) |
| 25 to 29 Minutes | 2,686 (8.5%) | 2,425 (7.4%) |
| 30 to 34 Minutes | 4,240 (13.4%) | 3,816 (11.7%) |
| 35 to 39 Minutes | 1,585 (5.0%) | 1,183 (3.6%) |
| 40 to 44 Minutes | 1,396 (4.4%) | 1,429 (4.4%) |
| 45 to 59 Minutes | 2,269 (7.2%) | 2,144 (6.6%) |
| 60 to 89 Minutes | 1,165 (3.7%) | 760 (2.3%) |
| 90 or more Minutes | 743 (2.4%) | 362 (1.1%) |
Time of Departure to Work by Sex in Hampshire County
The most frequent times of departure to work in Hampshire County are 7:00 AM to 7:29 AM (4,736, 14.9%) for males and 8:00 AM to 8:29 AM (4,943, 15.2%) for females.
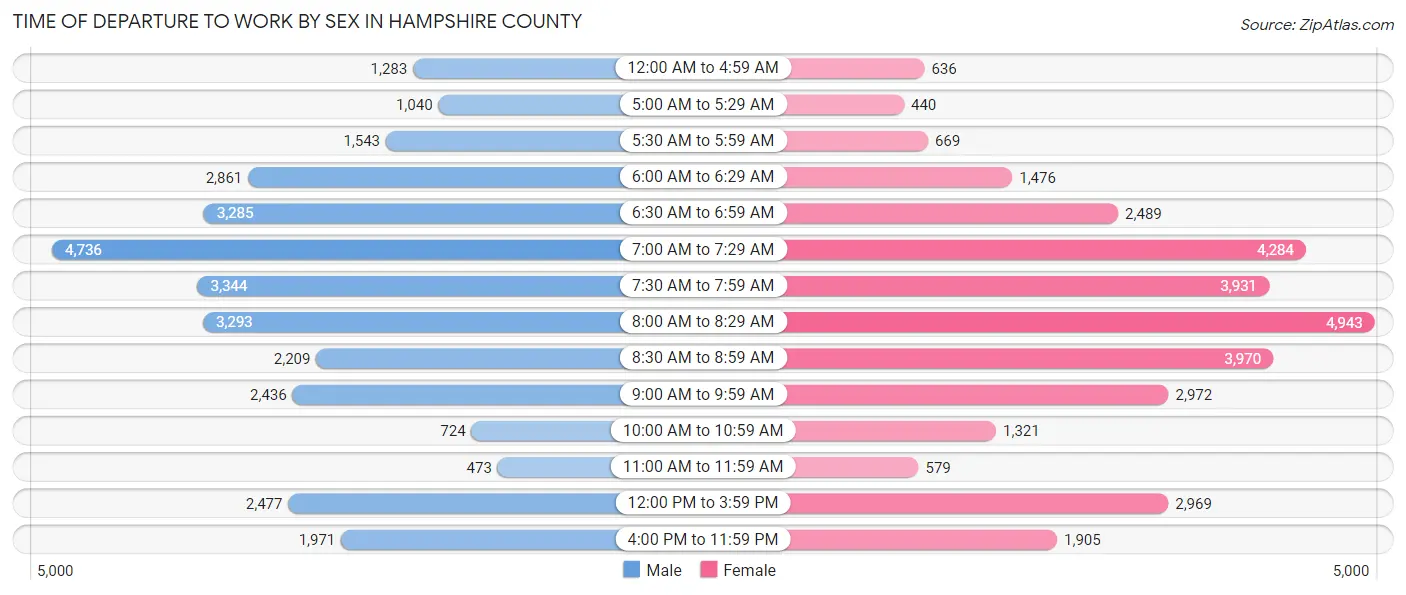
| Time of Departure | Male | Female |
| 12:00 AM to 4:59 AM | 1,283 (4.1%) | 636 (1.9%) |
| 5:00 AM to 5:29 AM | 1,040 (3.3%) | 440 (1.3%) |
| 5:30 AM to 5:59 AM | 1,543 (4.9%) | 669 (2.1%) |
| 6:00 AM to 6:29 AM | 2,861 (9.0%) | 1,476 (4.5%) |
| 6:30 AM to 6:59 AM | 3,285 (10.4%) | 2,489 (7.6%) |
| 7:00 AM to 7:29 AM | 4,736 (14.9%) | 4,284 (13.2%) |
| 7:30 AM to 7:59 AM | 3,344 (10.6%) | 3,931 (12.1%) |
| 8:00 AM to 8:29 AM | 3,293 (10.4%) | 4,943 (15.2%) |
| 8:30 AM to 8:59 AM | 2,209 (7.0%) | 3,970 (12.2%) |
| 9:00 AM to 9:59 AM | 2,436 (7.7%) | 2,972 (9.1%) |
| 10:00 AM to 10:59 AM | 724 (2.3%) | 1,321 (4.1%) |
| 11:00 AM to 11:59 AM | 473 (1.5%) | 579 (1.8%) |
| 12:00 PM to 3:59 PM | 2,477 (7.8%) | 2,969 (9.1%) |
| 4:00 PM to 11:59 PM | 1,971 (6.2%) | 1,905 (5.9%) |
| Total | 31,675 (100.0%) | 32,584 (100.0%) |
Housing Occupancy in Hampshire County
Occupancy by Ownership in Hampshire County
Of the total 61,414 dwellings in Hampshire County, owner-occupied units account for 42,301 (68.9%), while renter-occupied units make up 19,113 (31.1%).
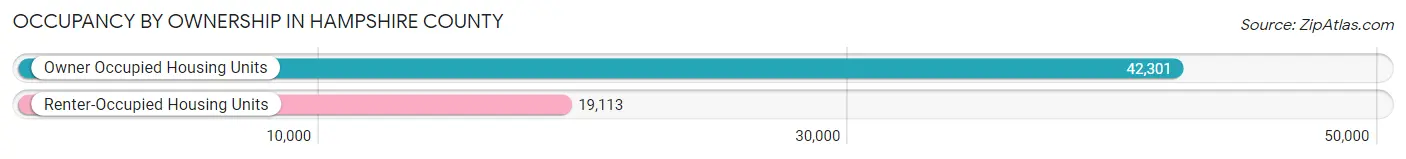
| Occupancy | # Housing Units | % Housing Units |
| Owner Occupied Housing Units | 42,301 | 68.9% |
| Renter-Occupied Housing Units | 19,113 | 31.1% |
| Total Occupied Housing Units | 61,414 | 100.0% |
Occupancy by Household Size in Hampshire County
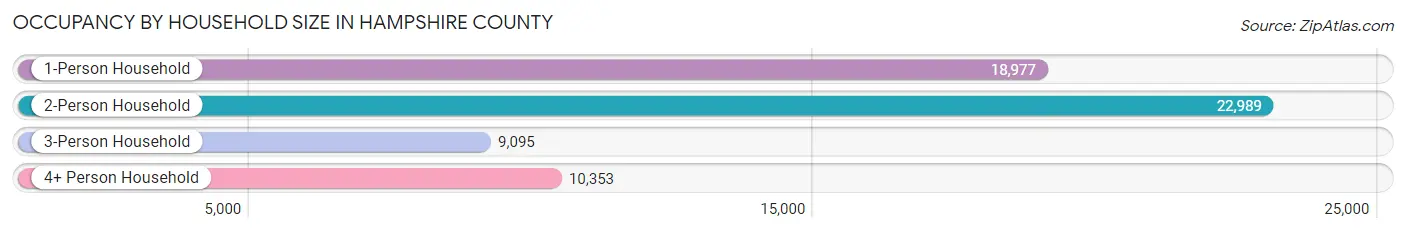
| Household Size | # Housing Units | % Housing Units |
| 1-Person Household | 18,977 | 30.9% |
| 2-Person Household | 22,989 | 37.4% |
| 3-Person Household | 9,095 | 14.8% |
| 4+ Person Household | 10,353 | 16.9% |
| Total Housing Units | 61,414 | 100.0% |
Occupancy by Ownership by Household Size in Hampshire County
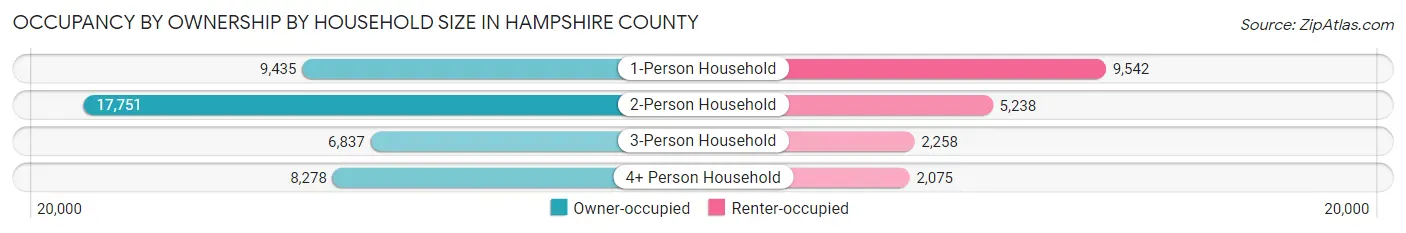
| Household Size | Owner-occupied | Renter-occupied |
| 1-Person Household | 9,435 (49.7%) | 9,542 (50.3%) |
| 2-Person Household | 17,751 (77.2%) | 5,238 (22.8%) |
| 3-Person Household | 6,837 (75.2%) | 2,258 (24.8%) |
| 4+ Person Household | 8,278 (80.0%) | 2,075 (20.0%) |
| Total Housing Units | 42,301 (68.9%) | 19,113 (31.1%) |
Occupancy by Educational Attainment in Hampshire County
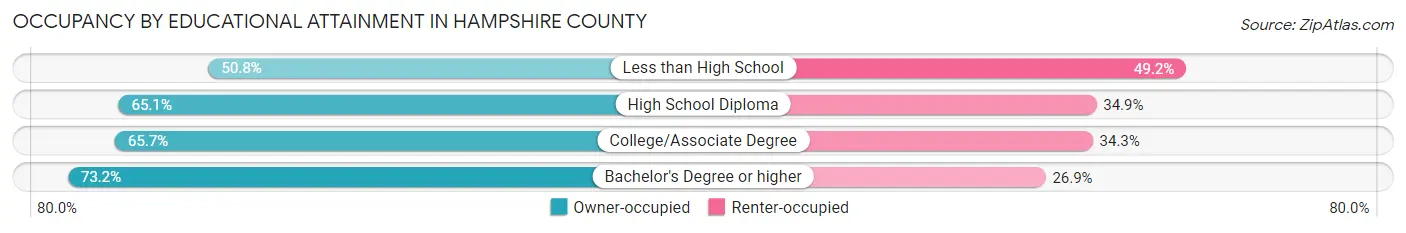
| Household Size | Owner-occupied | Renter-occupied |
| Less than High School | 1,154 (50.8%) | 1,116 (49.2%) |
| High School Diploma | 7,727 (65.1%) | 4,144 (34.9%) |
| College/Associate Degree | 10,183 (65.7%) | 5,323 (34.3%) |
| Bachelor's Degree or higher | 23,237 (73.2%) | 8,530 (26.9%) |
Occupancy by Age of Householder in Hampshire County
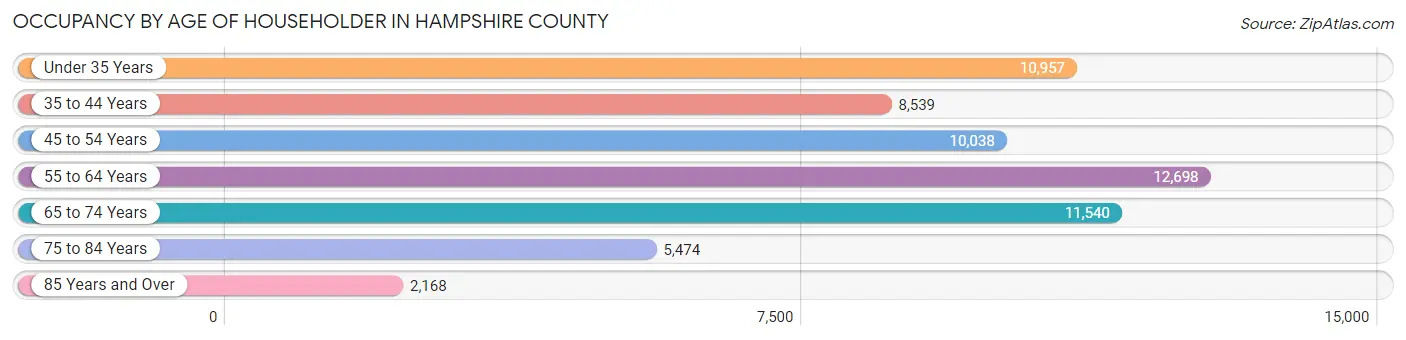
| Age Bracket | # Households | % Households |
| Under 35 Years | 10,957 | 17.8% |
| 35 to 44 Years | 8,539 | 13.9% |
| 45 to 54 Years | 10,038 | 16.3% |
| 55 to 64 Years | 12,698 | 20.7% |
| 65 to 74 Years | 11,540 | 18.8% |
| 75 to 84 Years | 5,474 | 8.9% |
| 85 Years and Over | 2,168 | 3.5% |
| Total | 61,414 | 100.0% |
Housing Finances in Hampshire County
Median Income by Occupancy in Hampshire County
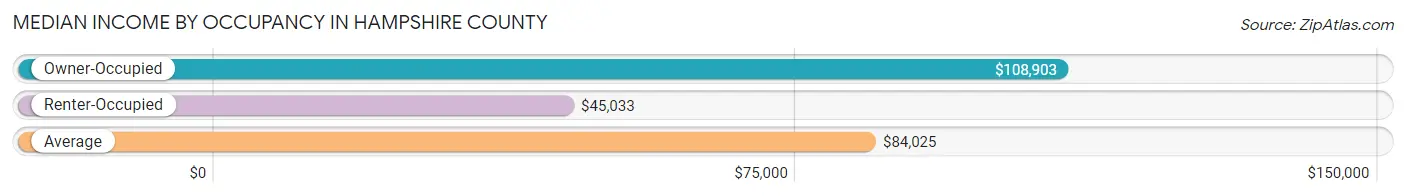
| Occupancy Type | # Households | Median Income |
| Owner-Occupied | 42,301 (68.9%) | $108,903 |
| Renter-Occupied | 19,113 (31.1%) | $45,033 |
| Average | 61,414 (100.0%) | $84,025 |
Occupancy by Householder Income Bracket in Hampshire County
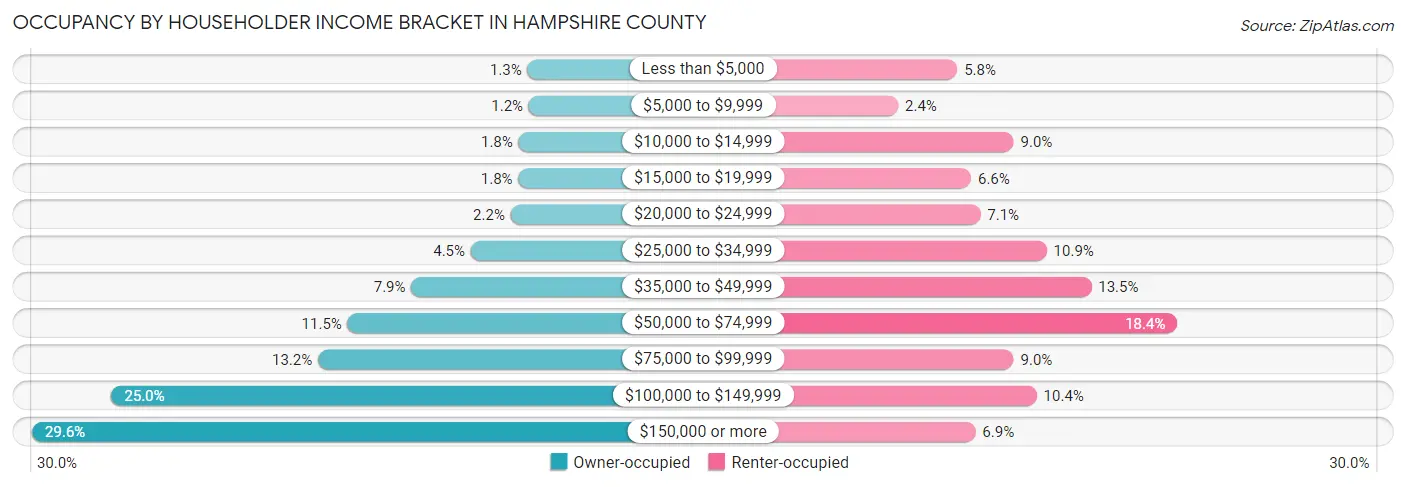
| Income Bracket | Owner-occupied | Renter-occupied |
| Less than $5,000 | 532 (1.3%) | 1,111 (5.8%) |
| $5,000 to $9,999 | 499 (1.2%) | 464 (2.4%) |
| $10,000 to $14,999 | 747 (1.8%) | 1,725 (9.0%) |
| $15,000 to $19,999 | 755 (1.8%) | 1,262 (6.6%) |
| $20,000 to $24,999 | 938 (2.2%) | 1,362 (7.1%) |
| $25,000 to $34,999 | 1,903 (4.5%) | 2,088 (10.9%) |
| $35,000 to $49,999 | 3,343 (7.9%) | 2,575 (13.5%) |
| $50,000 to $74,999 | 4,881 (11.5%) | 3,513 (18.4%) |
| $75,000 to $99,999 | 5,598 (13.2%) | 1,725 (9.0%) |
| $100,000 to $149,999 | 10,593 (25.0%) | 1,978 (10.3%) |
| $150,000 or more | 12,512 (29.6%) | 1,310 (6.9%) |
| Total | 42,301 (100.0%) | 19,113 (100.0%) |
Monthly Housing Cost Tiers in Hampshire County
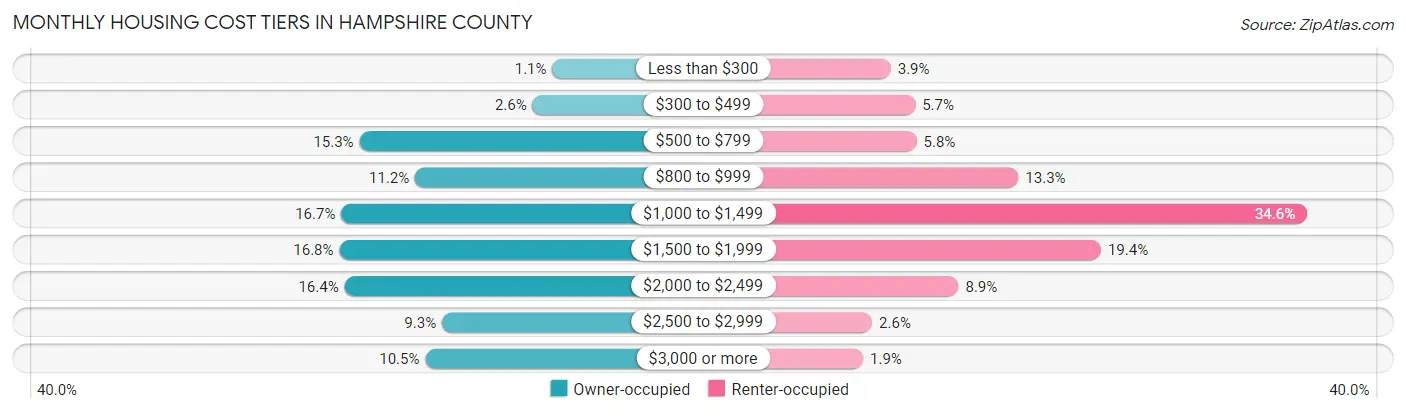
| Monthly Cost | Owner-occupied | Renter-occupied |
| Less than $300 | 477 (1.1%) | 751 (3.9%) |
| $300 to $499 | 1,097 (2.6%) | 1,096 (5.7%) |
| $500 to $799 | 6,491 (15.3%) | 1,114 (5.8%) |
| $800 to $999 | 4,753 (11.2%) | 2,548 (13.3%) |
| $1,000 to $1,499 | 7,056 (16.7%) | 6,609 (34.6%) |
| $1,500 to $1,999 | 7,115 (16.8%) | 3,710 (19.4%) |
| $2,000 to $2,499 | 6,956 (16.4%) | 1,705 (8.9%) |
| $2,500 to $2,999 | 3,919 (9.3%) | 489 (2.6%) |
| $3,000 or more | 4,437 (10.5%) | 361 (1.9%) |
| Total | 42,301 (100.0%) | 19,113 (100.0%) |
Physical Housing Characteristics in Hampshire County
Housing Structures in Hampshire County
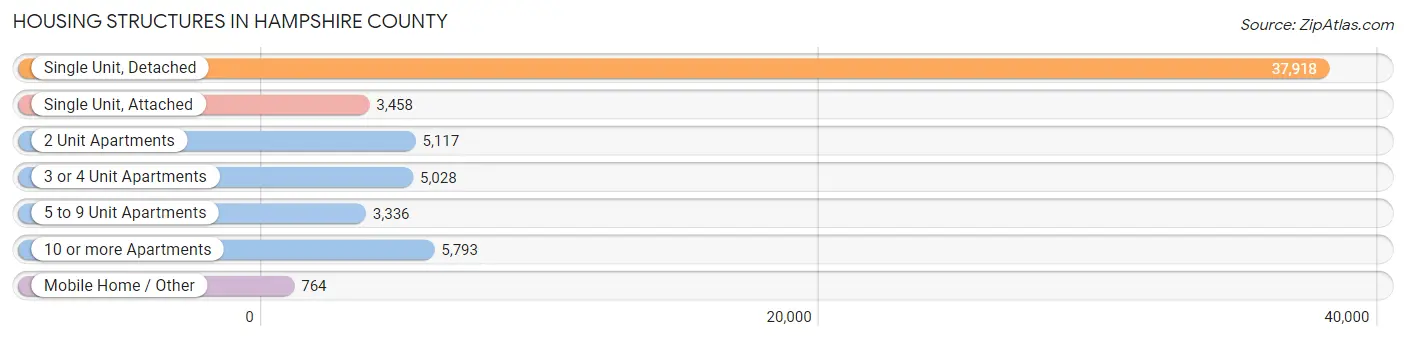
| Structure Type | # Housing Units | % Housing Units |
| Single Unit, Detached | 37,918 | 61.7% |
| Single Unit, Attached | 3,458 | 5.6% |
| 2 Unit Apartments | 5,117 | 8.3% |
| 3 or 4 Unit Apartments | 5,028 | 8.2% |
| 5 to 9 Unit Apartments | 3,336 | 5.4% |
| 10 or more Apartments | 5,793 | 9.4% |
| Mobile Home / Other | 764 | 1.2% |
| Total | 61,414 | 100.0% |
Housing Structures by Occupancy in Hampshire County
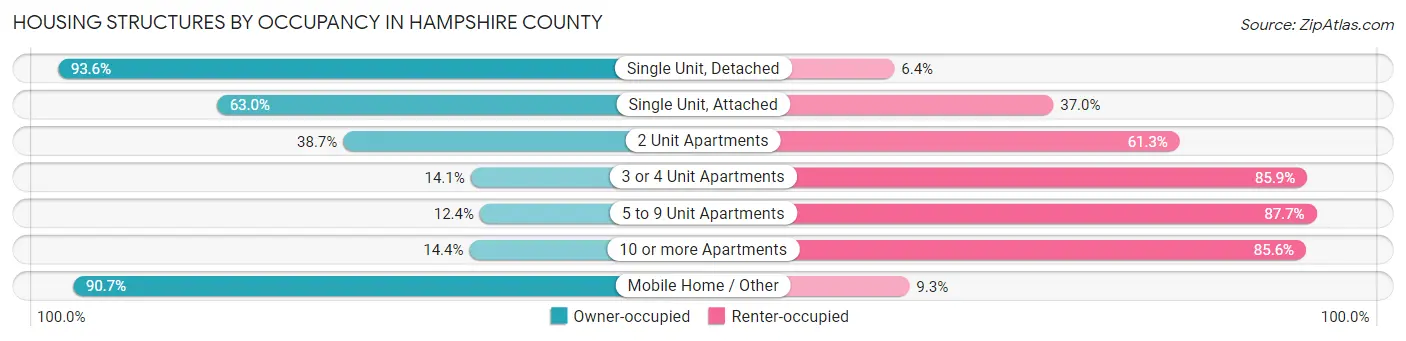
| Structure Type | Owner-occupied | Renter-occupied |
| Single Unit, Detached | 35,494 (93.6%) | 2,424 (6.4%) |
| Single Unit, Attached | 2,179 (63.0%) | 1,279 (37.0%) |
| 2 Unit Apartments | 1,979 (38.7%) | 3,138 (61.3%) |
| 3 or 4 Unit Apartments | 711 (14.1%) | 4,317 (85.9%) |
| 5 to 9 Unit Apartments | 412 (12.3%) | 2,924 (87.6%) |
| 10 or more Apartments | 833 (14.4%) | 4,960 (85.6%) |
| Mobile Home / Other | 693 (90.7%) | 71 (9.3%) |
| Total | 42,301 (68.9%) | 19,113 (31.1%) |
Housing Structures by Number of Rooms in Hampshire County
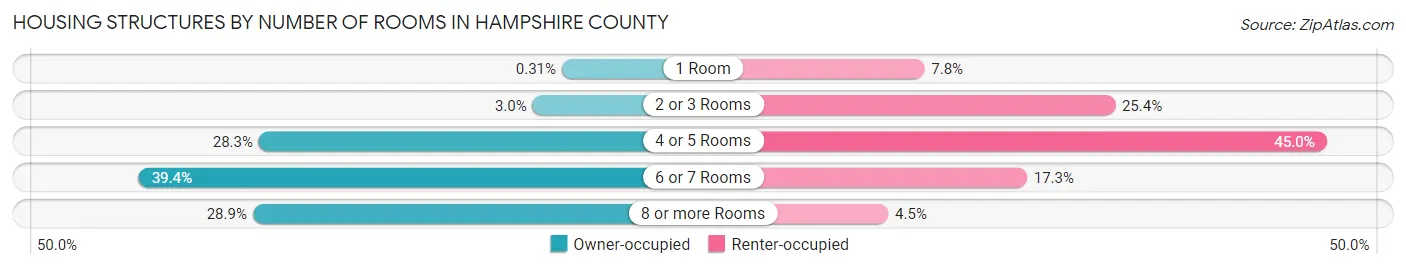
| Number of Rooms | Owner-occupied | Renter-occupied |
| 1 Room | 130 (0.3%) | 1,493 (7.8%) |
| 2 or 3 Rooms | 1,276 (3.0%) | 4,862 (25.4%) |
| 4 or 5 Rooms | 11,988 (28.3%) | 8,603 (45.0%) |
| 6 or 7 Rooms | 16,683 (39.4%) | 3,302 (17.3%) |
| 8 or more Rooms | 12,224 (28.9%) | 853 (4.5%) |
| Total | 42,301 (100.0%) | 19,113 (100.0%) |
Housing Structure by Heating Type in Hampshire County
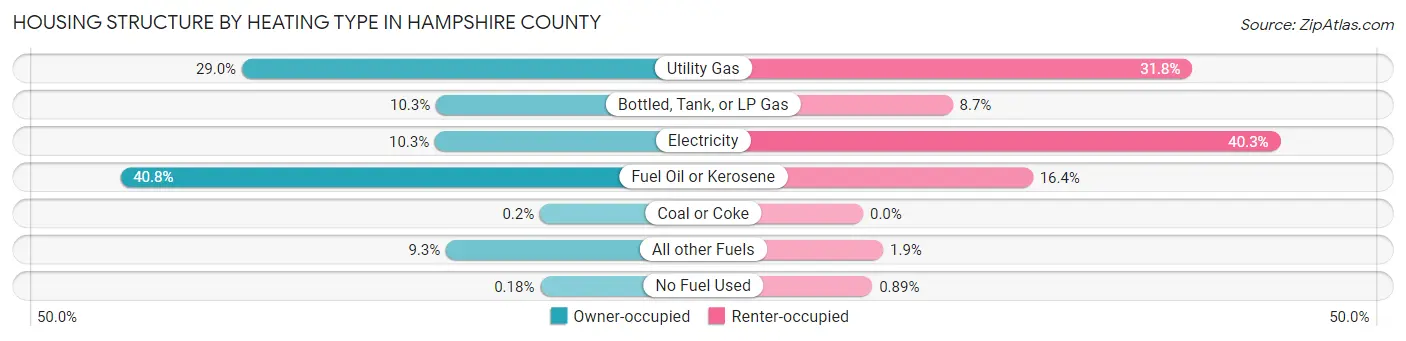
| Heating Type | Owner-occupied | Renter-occupied |
| Utility Gas | 12,267 (29.0%) | 6,079 (31.8%) |
| Bottled, Tank, or LP Gas | 4,334 (10.2%) | 1,654 (8.6%) |
| Electricity | 4,373 (10.3%) | 7,706 (40.3%) |
| Fuel Oil or Kerosene | 17,241 (40.8%) | 3,133 (16.4%) |
| Coal or Coke | 85 (0.2%) | 0 (0.0%) |
| All other Fuels | 3,925 (9.3%) | 370 (1.9%) |
| No Fuel Used | 76 (0.2%) | 171 (0.9%) |
| Total | 42,301 (100.0%) | 19,113 (100.0%) |
Household Vehicle Usage in Hampshire County
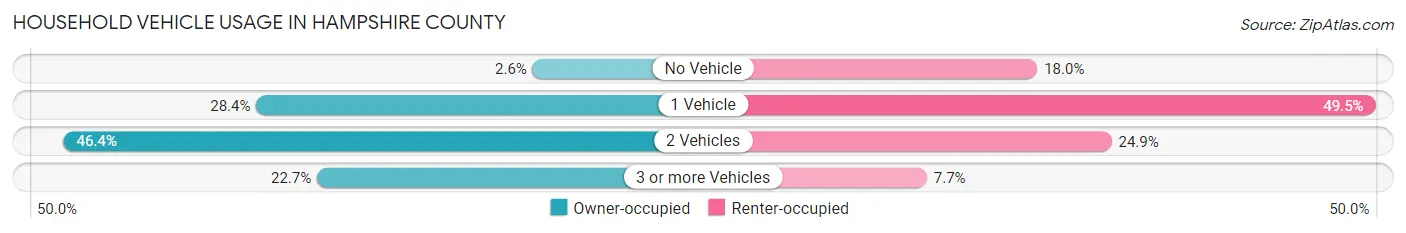
| Vehicles per Household | Owner-occupied | Renter-occupied |
| No Vehicle | 1,088 (2.6%) | 3,430 (17.9%) |
| 1 Vehicle | 12,001 (28.4%) | 9,464 (49.5%) |
| 2 Vehicles | 19,609 (46.4%) | 4,757 (24.9%) |
| 3 or more Vehicles | 9,603 (22.7%) | 1,462 (7.6%) |
| Total | 42,301 (100.0%) | 19,113 (100.0%) |
Real Estate & Mortgages in Hampshire County
Real Estate and Mortgage Overview in Hampshire County
| Characteristic | Without Mortgage | With Mortgage |
| Housing Units | 16,115 | 26,186 |
| Median Property Value | $326,700 | $354,200 |
| Median Household Income | $80,510 | $8,938 |
| Monthly Housing Costs | $821 | $4,426 |
| Real Estate Taxes | $4,937 | $197 |
Property Value by Mortgage Status in Hampshire County
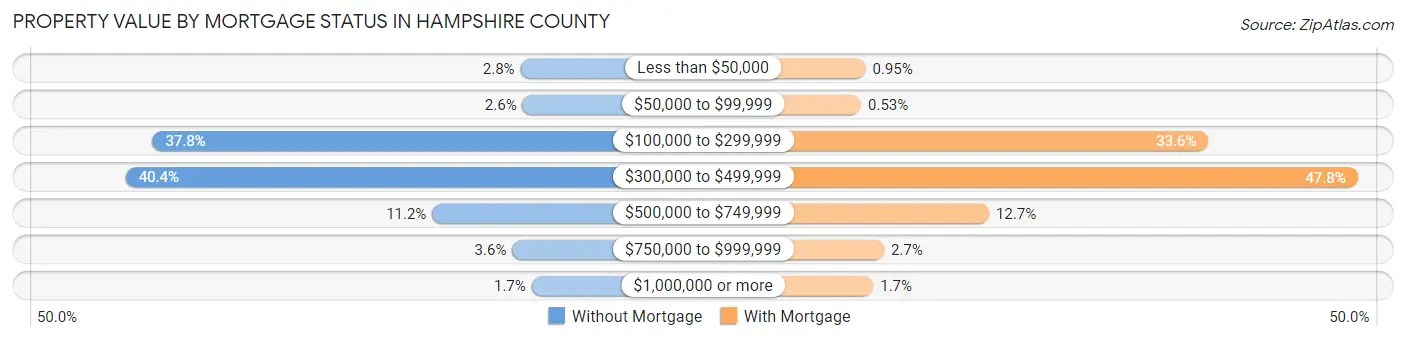
| Property Value | Without Mortgage | With Mortgage |
| Less than $50,000 | 448 (2.8%) | 249 (0.9%) |
| $50,000 to $99,999 | 416 (2.6%) | 140 (0.5%) |
| $100,000 to $299,999 | 6,094 (37.8%) | 8,798 (33.6%) |
| $300,000 to $499,999 | 6,506 (40.4%) | 12,518 (47.8%) |
| $500,000 to $749,999 | 1,801 (11.2%) | 3,328 (12.7%) |
| $750,000 to $999,999 | 574 (3.6%) | 710 (2.7%) |
| $1,000,000 or more | 276 (1.7%) | 443 (1.7%) |
| Total | 16,115 (100.0%) | 26,186 (100.0%) |
Household Income by Mortgage Status in Hampshire County
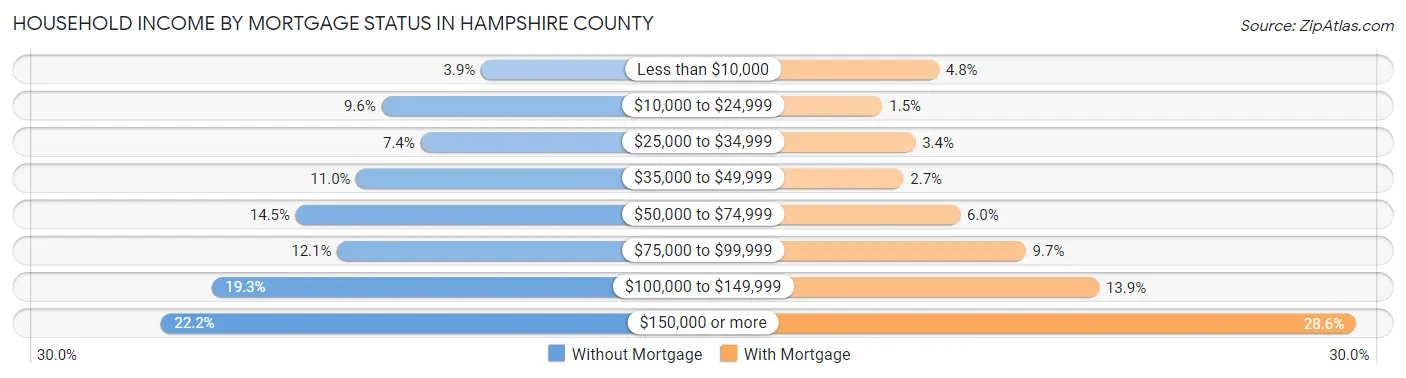
| Household Income | Without Mortgage | With Mortgage |
| Less than $10,000 | 630 (3.9%) | 1,246 (4.8%) |
| $10,000 to $24,999 | 1,547 (9.6%) | 401 (1.5%) |
| $25,000 to $34,999 | 1,188 (7.4%) | 893 (3.4%) |
| $35,000 to $49,999 | 1,779 (11.0%) | 715 (2.7%) |
| $50,000 to $74,999 | 2,337 (14.5%) | 1,564 (6.0%) |
| $75,000 to $99,999 | 1,955 (12.1%) | 2,544 (9.7%) |
| $100,000 to $149,999 | 3,105 (19.3%) | 3,643 (13.9%) |
| $150,000 or more | 3,574 (22.2%) | 7,488 (28.6%) |
| Total | 16,115 (100.0%) | 26,186 (100.0%) |
Property Value to Household Income Ratio in Hampshire County
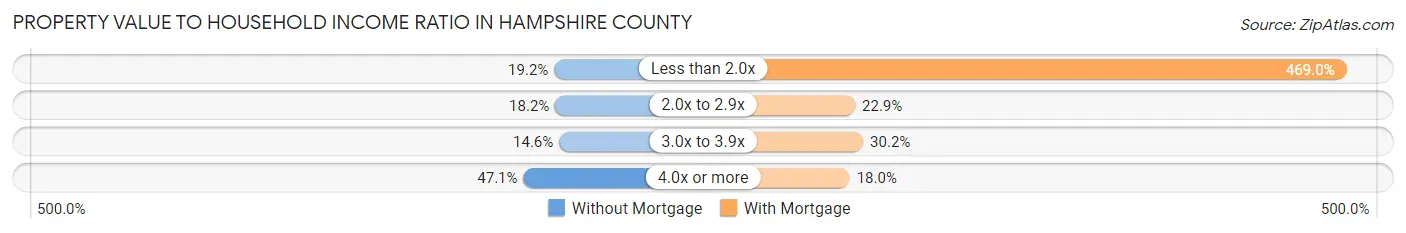
| Value-to-Income Ratio | Without Mortgage | With Mortgage |
| Less than 2.0x | 3,086 (19.2%) | 122,824 (469.0%) |
| 2.0x to 2.9x | 2,940 (18.2%) | 5,987 (22.9%) |
| 3.0x to 3.9x | 2,357 (14.6%) | 7,900 (30.2%) |
| 4.0x or more | 7,587 (47.1%) | 4,714 (18.0%) |
| Total | 16,115 (100.0%) | 26,186 (100.0%) |
Real Estate Taxes by Mortgage Status in Hampshire County
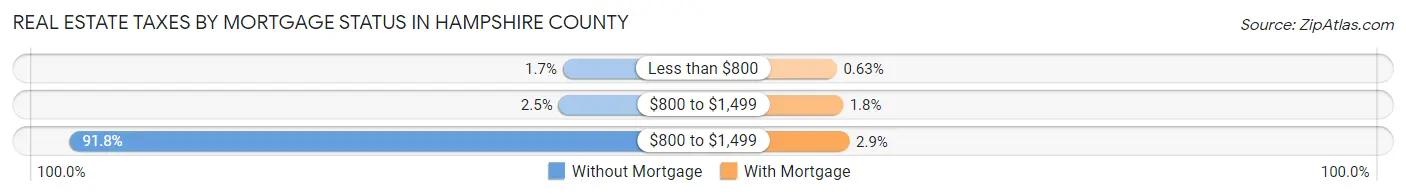
| Property Taxes | Without Mortgage | With Mortgage |
| Less than $800 | 276 (1.7%) | 164 (0.6%) |
| $800 to $1,499 | 402 (2.5%) | 461 (1.8%) |
| $800 to $1,499 | 14,794 (91.8%) | 766 (2.9%) |
| Total | 16,115 (100.0%) | 26,186 (100.0%) |
Health & Disability in Hampshire County
Health Insurance Coverage by Age in Hampshire County
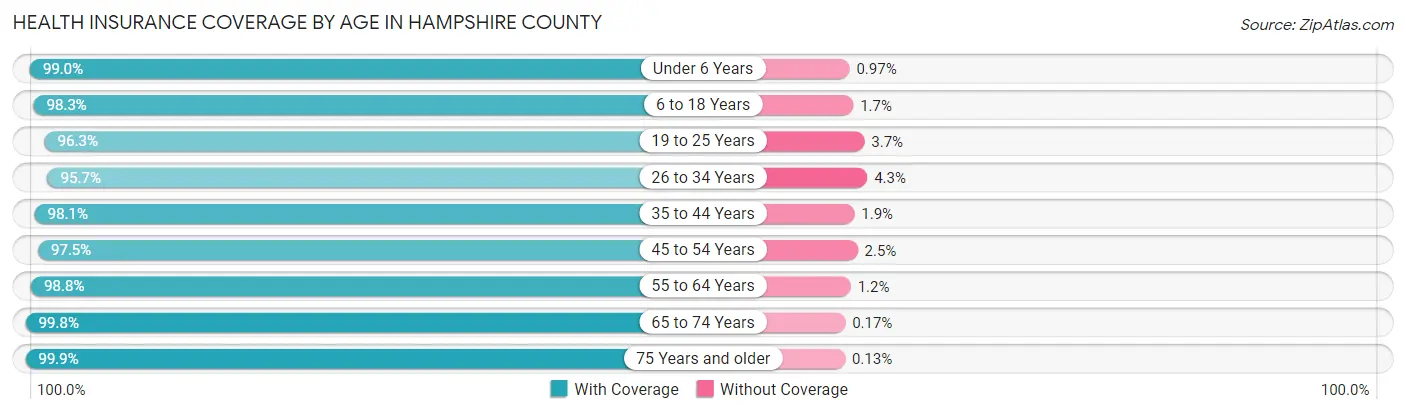
| Age Bracket | With Coverage | Without Coverage |
| Under 6 Years | 5,918 (99.0%) | 58 (1.0%) |
| 6 to 18 Years | 21,816 (98.3%) | 369 (1.7%) |
| 19 to 25 Years | 26,272 (96.3%) | 1,022 (3.7%) |
| 26 to 34 Years | 13,770 (95.7%) | 615 (4.3%) |
| 35 to 44 Years | 15,520 (98.1%) | 296 (1.9%) |
| 45 to 54 Years | 16,857 (97.5%) | 428 (2.5%) |
| 55 to 64 Years | 20,785 (98.8%) | 252 (1.2%) |
| 65 to 74 Years | 18,015 (99.8%) | 30 (0.2%) |
| 75 Years and older | 10,729 (99.9%) | 14 (0.1%) |
| Total | 149,682 (98.0%) | 3,084 (2.0%) |
Health Insurance Coverage by Citizenship Status in Hampshire County
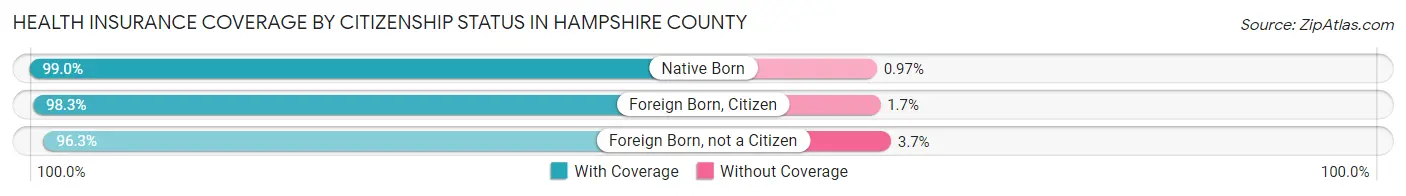
| Citizenship Status | With Coverage | Without Coverage |
| Native Born | 5,918 (99.0%) | 58 (1.0%) |
| Foreign Born, Citizen | 21,816 (98.3%) | 369 (1.7%) |
| Foreign Born, not a Citizen | 26,272 (96.3%) | 1,022 (3.7%) |
Health Insurance Coverage by Household Income in Hampshire County
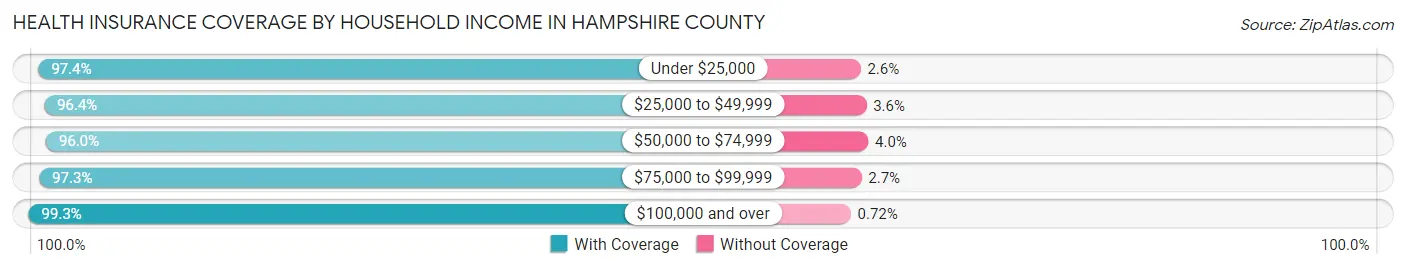
| Household Income | With Coverage | Without Coverage |
| Under $25,000 | 12,849 (97.4%) | 338 (2.6%) |
| $25,000 to $49,999 | 16,843 (96.4%) | 635 (3.6%) |
| $50,000 to $74,999 | 14,978 (96.0%) | 622 (4.0%) |
| $75,000 to $99,999 | 15,873 (97.3%) | 443 (2.7%) |
| $100,000 and over | 69,821 (99.3%) | 504 (0.7%) |
Public vs Private Health Insurance Coverage by Age in Hampshire County
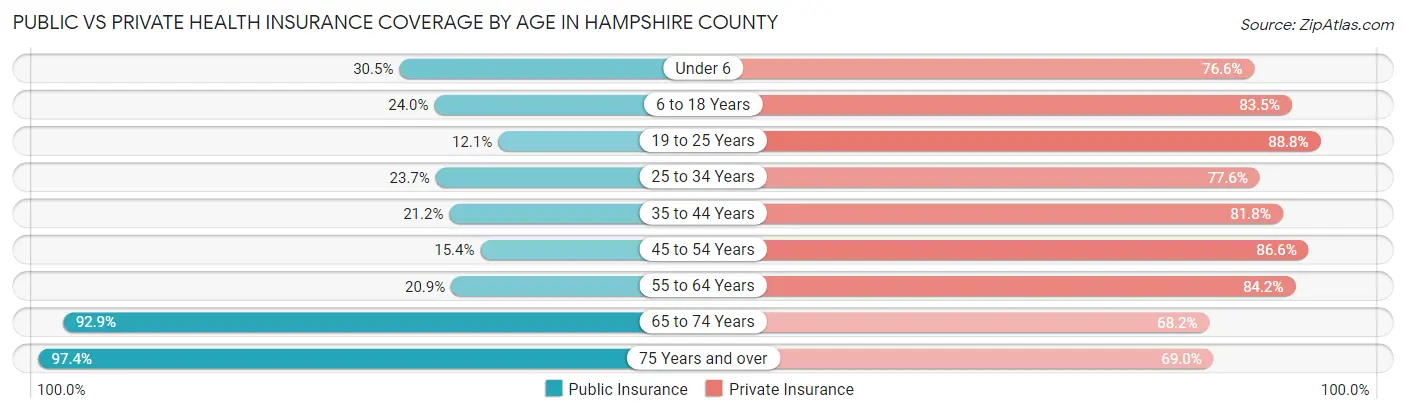
| Age Bracket | Public Insurance | Private Insurance |
| Under 6 | 1,820 (30.5%) | 4,576 (76.6%) |
| 6 to 18 Years | 5,313 (23.9%) | 18,516 (83.5%) |
| 19 to 25 Years | 3,308 (12.1%) | 24,242 (88.8%) |
| 25 to 34 Years | 3,410 (23.7%) | 11,159 (77.6%) |
| 35 to 44 Years | 3,350 (21.2%) | 12,936 (81.8%) |
| 45 to 54 Years | 2,663 (15.4%) | 14,976 (86.6%) |
| 55 to 64 Years | 4,387 (20.8%) | 17,705 (84.2%) |
| 65 to 74 Years | 16,768 (92.9%) | 12,306 (68.2%) |
| 75 Years and over | 10,461 (97.4%) | 7,414 (69.0%) |
| Total | 51,480 (33.7%) | 123,830 (81.1%) |
Disability Status by Sex by Age in Hampshire County
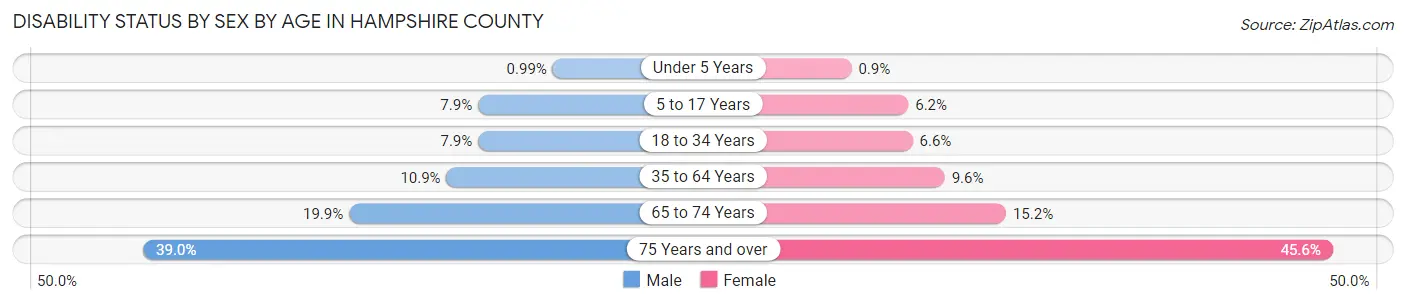
| Age Bracket | Male | Female |
| Under 5 Years | 25 (1.0%) | 23 (0.9%) |
| 5 to 17 Years | 749 (7.9%) | 539 (6.2%) |
| 18 to 34 Years | 1,710 (7.9%) | 1,638 (6.6%) |
| 35 to 64 Years | 2,796 (10.8%) | 2,710 (9.6%) |
| 65 to 74 Years | 1,662 (19.9%) | 1,477 (15.2%) |
| 75 Years and over | 1,726 (39.0%) | 2,878 (45.6%) |
Disability Class by Sex by Age in Hampshire County
Disability Class: Hearing Difficulty
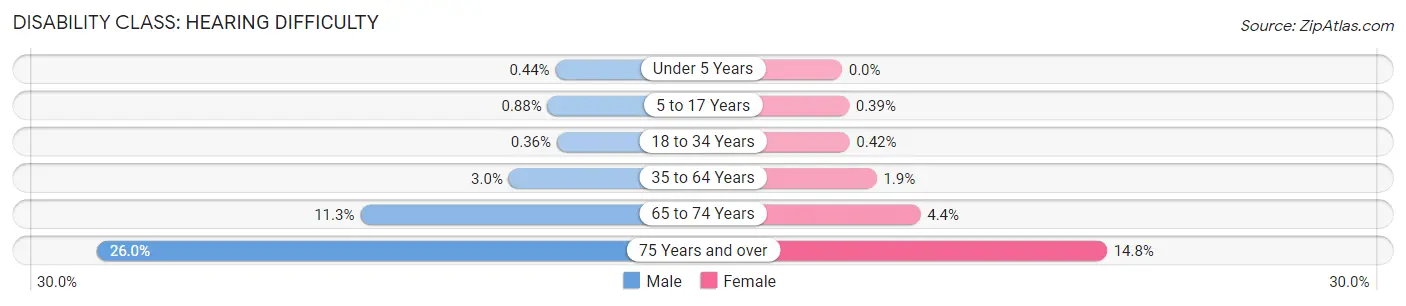
| Age Bracket | Male | Female |
| Under 5 Years | 11 (0.4%) | 0 (0.0%) |
| 5 to 17 Years | 83 (0.9%) | 34 (0.4%) |
| 18 to 34 Years | 77 (0.4%) | 104 (0.4%) |
| 35 to 64 Years | 784 (3.0%) | 549 (1.9%) |
| 65 to 74 Years | 945 (11.3%) | 423 (4.4%) |
| 75 Years and over | 1,150 (26.0%) | 932 (14.7%) |
Disability Class: Vision Difficulty
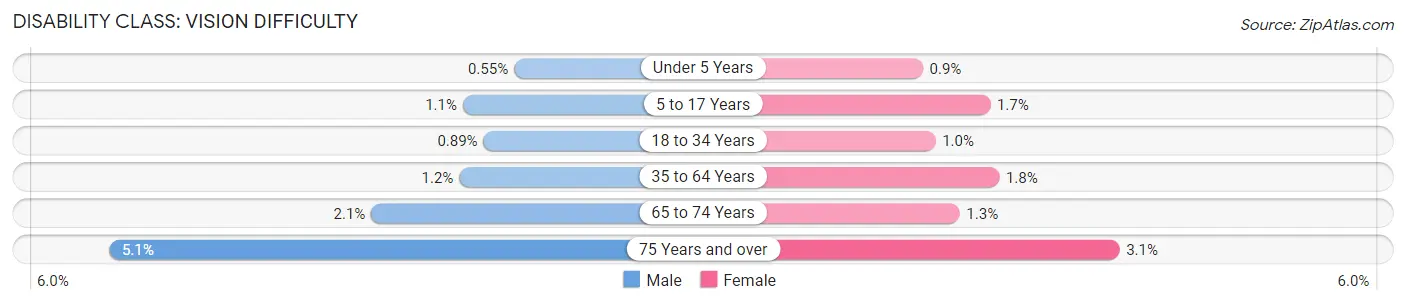
| Age Bracket | Male | Female |
| Under 5 Years | 14 (0.5%) | 23 (0.9%) |
| 5 to 17 Years | 106 (1.1%) | 144 (1.7%) |
| 18 to 34 Years | 192 (0.9%) | 260 (1.0%) |
| 35 to 64 Years | 299 (1.2%) | 498 (1.8%) |
| 65 to 74 Years | 179 (2.1%) | 127 (1.3%) |
| 75 Years and over | 224 (5.1%) | 195 (3.1%) |
Disability Class: Cognitive Difficulty
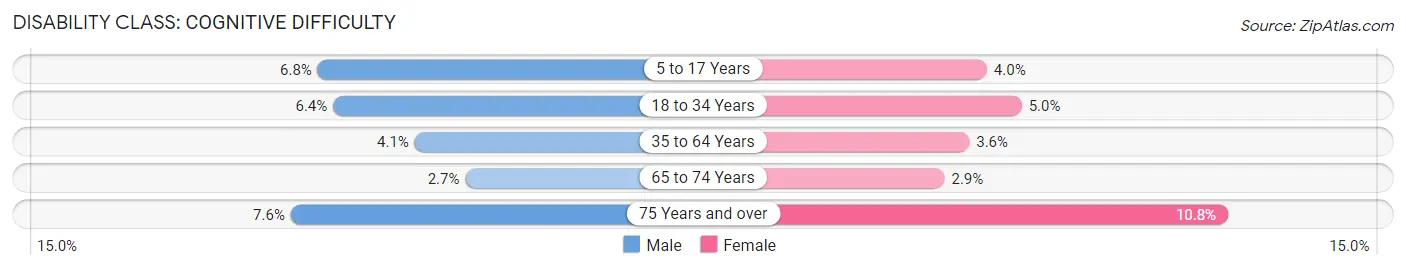
| Age Bracket | Male | Female |
| 5 to 17 Years | 647 (6.8%) | 353 (4.0%) |
| 18 to 34 Years | 1,387 (6.4%) | 1,249 (5.0%) |
| 35 to 64 Years | 1,066 (4.1%) | 1,007 (3.5%) |
| 65 to 74 Years | 228 (2.7%) | 277 (2.9%) |
| 75 Years and over | 336 (7.6%) | 679 (10.7%) |
Disability Class: Ambulatory Difficulty
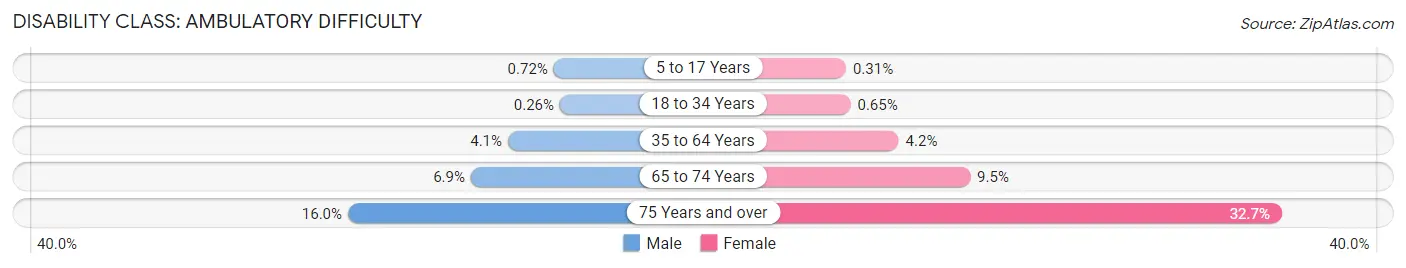
| Age Bracket | Male | Female |
| 5 to 17 Years | 68 (0.7%) | 27 (0.3%) |
| 18 to 34 Years | 57 (0.3%) | 163 (0.6%) |
| 35 to 64 Years | 1,060 (4.1%) | 1,199 (4.2%) |
| 65 to 74 Years | 574 (6.9%) | 923 (9.5%) |
| 75 Years and over | 708 (16.0%) | 2,063 (32.7%) |
Disability Class: Self-Care Difficulty
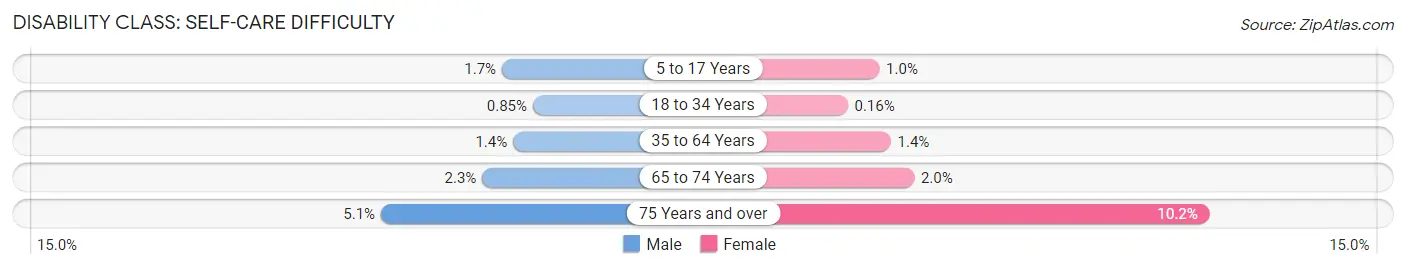
| Age Bracket | Male | Female |
| 5 to 17 Years | 162 (1.7%) | 91 (1.0%) |
| 18 to 34 Years | 184 (0.9%) | 40 (0.2%) |
| 35 to 64 Years | 360 (1.4%) | 387 (1.4%) |
| 65 to 74 Years | 189 (2.3%) | 195 (2.0%) |
| 75 Years and over | 225 (5.1%) | 647 (10.2%) |
Technology Access in Hampshire County
Computing Device Access in Hampshire County
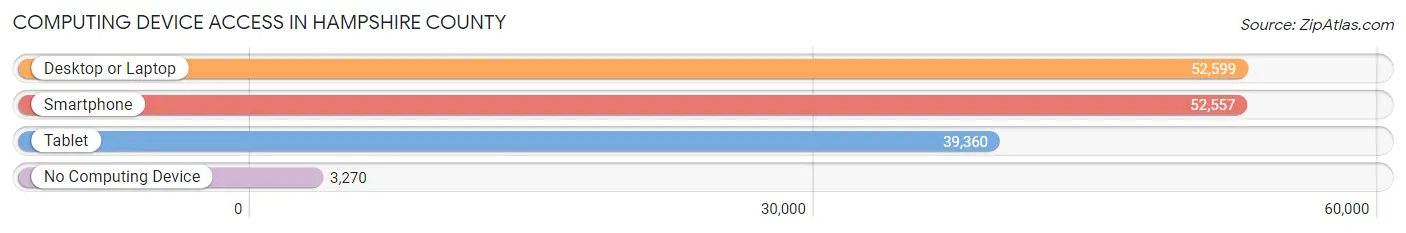
| Device Type | # Households | % Households |
| Desktop or Laptop | 52,599 | 85.7% |
| Smartphone | 52,557 | 85.6% |
| Tablet | 39,360 | 64.1% |
| No Computing Device | 3,270 | 5.3% |
| Total | 61,414 | 100.0% |
Internet Access in Hampshire County
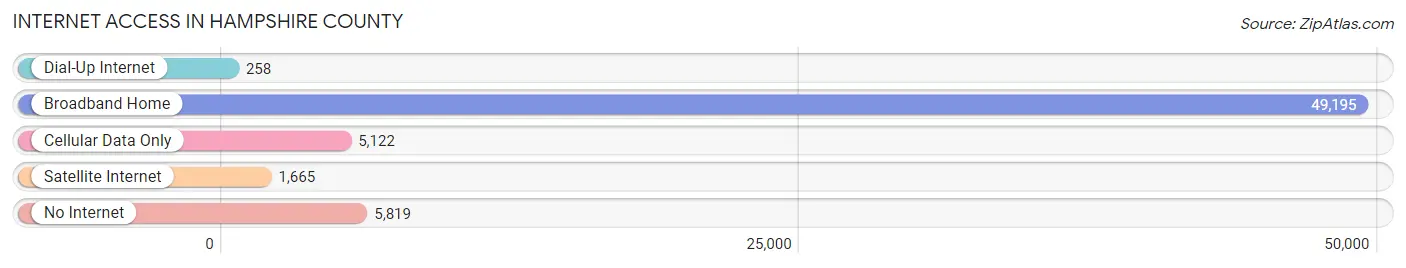
| Internet Type | # Households | % Households |
| Dial-Up Internet | 258 | 0.4% |
| Broadband Home | 49,195 | 80.1% |
| Cellular Data Only | 5,122 | 8.3% |
| Satellite Internet | 1,665 | 2.7% |
| No Internet | 5,819 | 9.5% |
| Total | 61,414 | 100.0% |
Hampshire County Summary
Hampshire County is located in the western part of Massachusetts and is the most populous county in the state. It is bordered by Franklin County to the north, Worcester County to the east, Hampden County to the south, and Berkshire County to the west. The county seat is Northampton, and the largest city is Amherst.
Geography
Hampshire County is located in the Connecticut River Valley of western Massachusetts. The county is mostly rural, with rolling hills and valleys. The highest point in the county is Mount Toby, at 1,214 feet. The Connecticut River forms the eastern border of the county, and the Westfield River forms the western border. The county is home to several state parks, including Mount Holyoke Range State Park, Quabbin Reservation, and the Oxbow National Wildlife Refuge.
Demographics
As of the 2010 census, the population of Hampshire County was 158,080. The population density was 166.3 people per square mile. The racial makeup of the county was 87.3% White, 5.2% African American, 0.5% Native American, 4.2% Asian, 0.1% Pacific Islander, 1.2% from other races, and 1.5% from two or more races. Hispanic or Latino of any race were 3.3% of the population.
The median income for a household in the county was $60,867, and the median income for a family was $76,945. The per capita income for the county was $30,845. About 5.2% of families and 11.2% of the population were below the poverty line, including 8.2% of those under age 18 and 5.2% of those age 65 or over.
Economy
Hampshire County is home to several major employers, including the University of Massachusetts Amherst, Baystate Health, and Smith College. The county is also home to several technology companies, including E Ink Corporation, LogMeIn, and Valencell. Agriculture is also an important part of the county’s economy, with dairy farming and apple orchards being the most common.
The county is home to several museums, including the Eric Carle Museum of Picture Book Art, the Emily Dickinson Museum, and the Smith College Museum of Art. The county is also home to several performing arts venues, including the Academy of Music Theatre, the Calvin Theatre, and the Iron Horse Music Hall.
Conclusion
Hampshire County is a rural county located in western Massachusetts. It is home to several major employers, including the University of Massachusetts Amherst, Baystate Health, and Smith College. Agriculture is also an important part of the county’s economy, with dairy farming and apple orchards being the most common. The county is also home to several museums and performing arts venues. The population of the county is 158,080, and the median income for a household is $60,867.
Common Questions
What is the Total Population of Hampshire County?
Total Population of Hampshire County is 153,931.
What is the Total Male Population of Hampshire County?
Total Male Population of Hampshire County is 72,786.
What is the Total Female Population of Hampshire County?
Total Female Population of Hampshire County is 81,145.
What is the Ratio of Males per 100 Females in Hampshire County?
There are 89.70 Males per 100 Females in Hampshire County.
What is the Ratio of Females per 100 Males in Hampshire County?
There are 111.48 Females per 100 Males in Hampshire County.
What is the Median Population Age in Hampshire County?
Median Population Age in Hampshire County is 39.3 Years.
What is the Average Family Size in Hampshire County
Average Family Size in Hampshire County is 2.7 People.
What is the Average Household Size in Hampshire County
Average Household Size in Hampshire County is 2.2 People.
What is Per Capita Income in Hampshire County?
Per Capita income in Hampshire County is $43,639.
What is the Median Family Income in Hampshire County?
Median Family Income in Hampshire County is $113,402.
What is the Median Household income in Hampshire County?
Median Household Income in Hampshire County is $84,025.
What is Income or Wage Gap in Hampshire County?
Income or Wage Gap in Hampshire County is 35.7%.
Women in Hampshire County earn 64.3 cents for every dollar earned by a man.
What is Family Income Deficit in Hampshire County?
Family Income Deficit in Hampshire County is $10,329.
Families that are below poverty line in Hampshire County earn $10,329 less on average than the poverty threshold level.
What is Inequality or Gini Index in Hampshire County?
Inequality or Gini Index in Hampshire County is 0.46.
How Large is the Labor Force in Hampshire County?
There are 82,185 People in the Labor Forcein in Hampshire County.
What is the Percentage of People in the Labor Force in Hampshire County?
61.4% of People are in the Labor Force in Hampshire County.
What is the Unemployment Rate in Hampshire County?
Unemployment Rate in Hampshire County is 5.3%.