Hampden County, MA
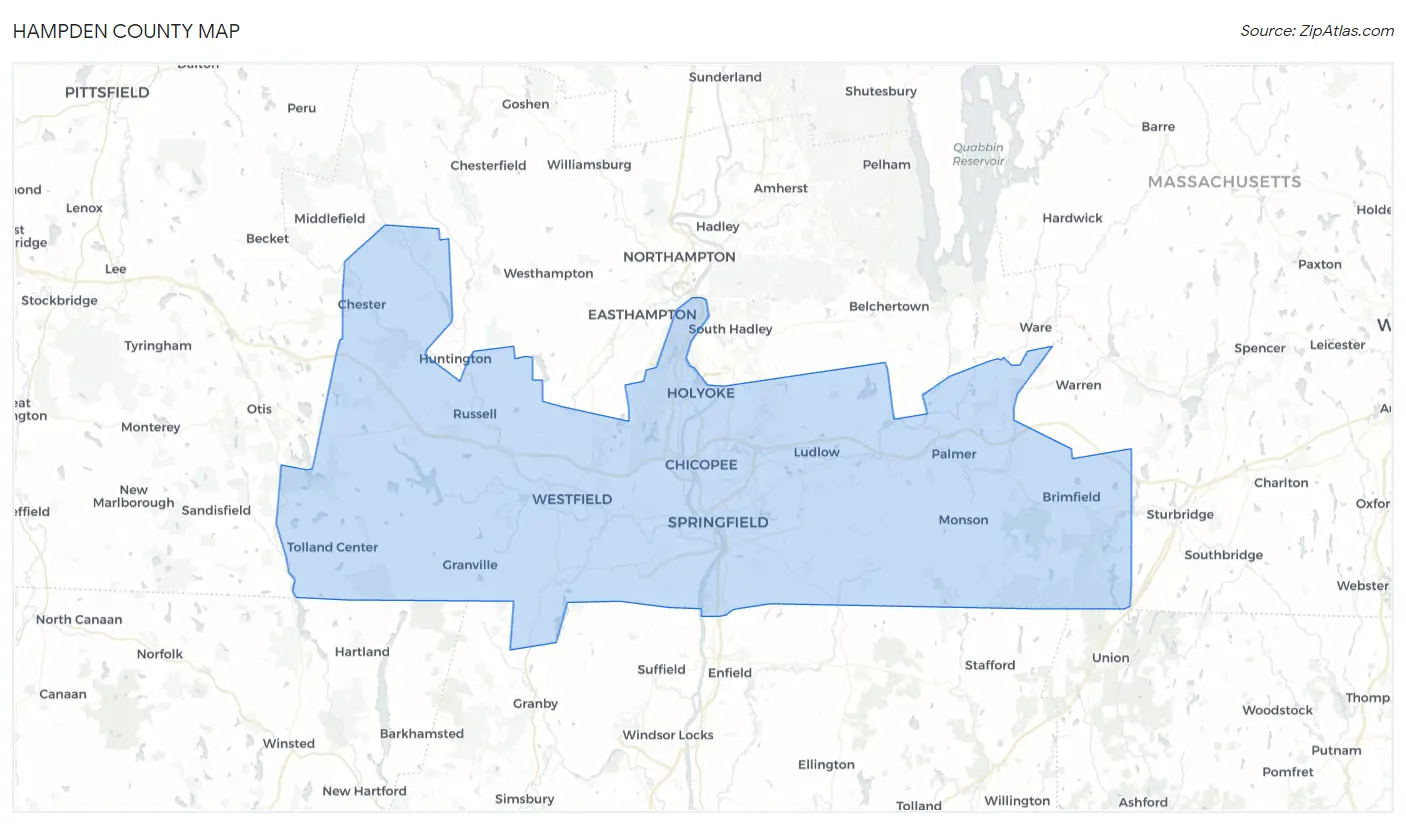
Hampden County Map
Hampden County Overview
464,575
TOTAL POPULATION
226,201
MALE POPULATION
238,374
FEMALE POPULATION
94.89
MALES / 100 FEMALES
105.38
FEMALES / 100 MALES
39.5
MEDIAN AGE
3.1
AVG FAMILY SIZE
2.5
AVG HOUSEHOLD SIZE
$35,884
PER CAPITA INCOME
$85,009
AVG FAMILY INCOME
$66,619
AVG HOUSEHOLD INCOME
24.3%
WAGE / INCOME GAP [ % ]
75.7¢/ $1
WAGE / INCOME GAP [ $ ]
$10,372
FAMILY INCOME DEFICIT
0.47
INEQUALITY / GINI INDEX
227,675
LABOR FORCE [ PEOPLE ]
60.2%
PERCENT IN LABOR FORCE
6.2%
UNEMPLOYMENT RATE
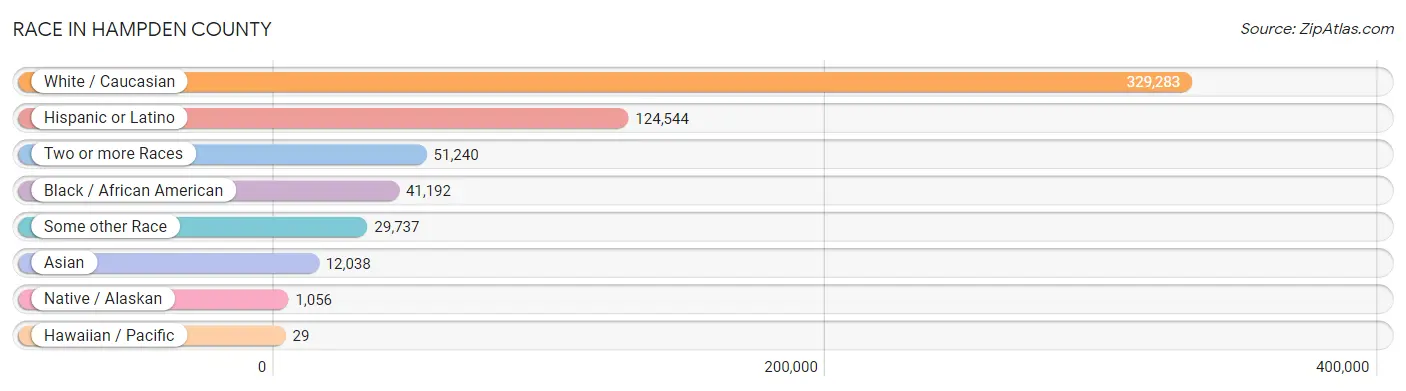
Race in Hampden County
The most populous races in Hampden County are White / Caucasian (329,283 | 70.9%), Hispanic or Latino (124,544 | 26.8%), and Two or more Races (51,240 | 11.0%).
| Race | # Population | % Population |
| Asian | 12,038 | 2.6% |
| Black / African American | 41,192 | 8.9% |
| Hawaiian / Pacific | 29 | 0.0% |
| Hispanic or Latino | 124,544 | 26.8% |
| Native / Alaskan | 1,056 | 0.2% |
| White / Caucasian | 329,283 | 70.9% |
| Two or more Races | 51,240 | 11.0% |
| Some other Race | 29,737 | 6.4% |
| Total | 464,575 | 100.0% |
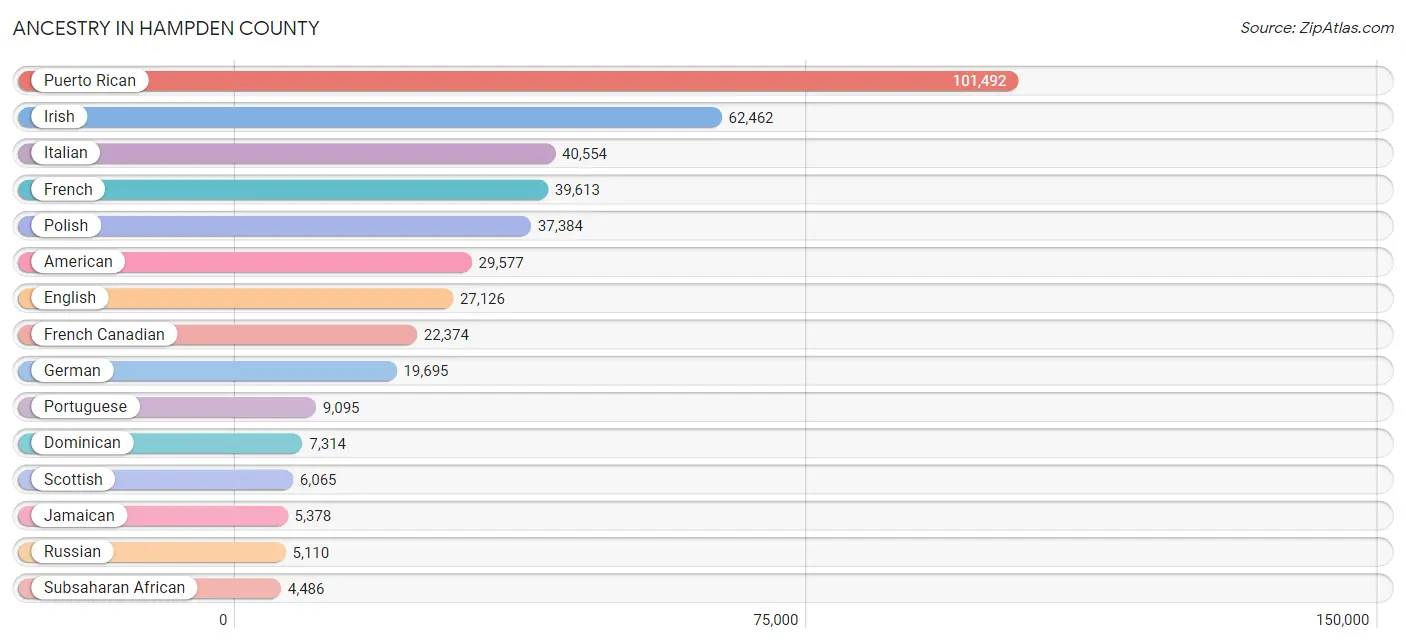
Ancestry in Hampden County
The most populous ancestries reported in Hampden County are Puerto Rican (101,492 | 21.8%), Irish (62,462 | 13.4%), Italian (40,554 | 8.7%), French (39,613 | 8.5%), and Polish (37,384 | 8.1%), together accounting for 60.6% of all Hampden County residents.
| Ancestry | # Population | % Population |
| Afghan | 84 | 0.0% |
| African | 1,480 | 0.3% |
| Alaska Native | 8 | 0.0% |
| Albanian | 180 | 0.0% |
| Alsatian | 16 | 0.0% |
| American | 29,577 | 6.4% |
| Apache | 39 | 0.0% |
| Arab | 3,350 | 0.7% |
| Argentinean | 133 | 0.0% |
| Armenian | 683 | 0.2% |
| Australian | 75 | 0.0% |
| Austrian | 583 | 0.1% |
| Barbadian | 149 | 0.0% |
| Basque | 36 | 0.0% |
| Belgian | 104 | 0.0% |
| Belizean | 14 | 0.0% |
| Bhutanese | 576 | 0.1% |
| Blackfeet | 435 | 0.1% |
| Bolivian | 43 | 0.0% |
| Brazilian | 229 | 0.1% |
| British | 1,070 | 0.2% |
| British West Indian | 198 | 0.0% |
| Bulgarian | 75 | 0.0% |
| Burmese | 637 | 0.1% |
| Cambodian | 8 | 0.0% |
| Canadian | 2,396 | 0.5% |
| Cape Verdean | 367 | 0.1% |
| Celtic | 16 | 0.0% |
| Central American | 4,418 | 0.9% |
| Central American Indian | 670 | 0.1% |
| Cherokee | 661 | 0.1% |
| Chilean | 37 | 0.0% |
| Chippewa | 48 | 0.0% |
| Choctaw | 5 | 0.0% |
| Colombian | 1,154 | 0.3% |
| Costa Rican | 120 | 0.0% |
| Croatian | 175 | 0.0% |
| Cuban | 995 | 0.2% |
| Czech | 718 | 0.2% |
| Czechoslovakian | 122 | 0.0% |
| Danish | 365 | 0.1% |
| Delaware | 20 | 0.0% |
| Dominican | 7,314 | 1.6% |
| Dutch | 1,597 | 0.3% |
| Eastern European | 849 | 0.2% |
| Ecuadorian | 696 | 0.2% |
| Egyptian | 48 | 0.0% |
| English | 27,126 | 5.8% |
| Estonian | 11 | 0.0% |
| Ethiopian | 20 | 0.0% |
| European | 2,596 | 0.6% |
| Filipino | 58 | 0.0% |
| Finnish | 581 | 0.1% |
| French | 39,613 | 8.5% |
| French American Indian | 221 | 0.1% |
| French Canadian | 22,374 | 4.8% |
| German | 19,695 | 4.2% |
| German Russian | 17 | 0.0% |
| Ghanaian | 408 | 0.1% |
| Greek | 4,269 | 0.9% |
| Guamanian / Chamorro | 15 | 0.0% |
| Guatemalan | 2,158 | 0.5% |
| Guyanese | 148 | 0.0% |
| Haitian | 470 | 0.1% |
| Honduran | 396 | 0.1% |
| Hungarian | 614 | 0.1% |
| Icelander | 57 | 0.0% |
| Indian (Asian) | 2,469 | 0.5% |
| Indonesian | 148 | 0.0% |
| Iranian | 221 | 0.1% |
| Iraqi | 991 | 0.2% |
| Irish | 62,462 | 13.4% |
| Iroquois | 65 | 0.0% |
| Israeli | 66 | 0.0% |
| Italian | 40,554 | 8.7% |
| Jamaican | 5,378 | 1.2% |
| Japanese | 1,174 | 0.3% |
| Jordanian | 62 | 0.0% |
| Kenyan | 231 | 0.1% |
| Korean | 1,034 | 0.2% |
| Laotian | 33 | 0.0% |
| Latvian | 81 | 0.0% |
| Lebanese | 1,470 | 0.3% |
| Liberian | 52 | 0.0% |
| Lithuanian | 1,790 | 0.4% |
| Macedonian | 6 | 0.0% |
| Malaysian | 276 | 0.1% |
| Mexican | 3,976 | 0.9% |
| Mexican American Indian | 49 | 0.0% |
| Mongolian | 2 | 0.0% |
| Moroccan | 177 | 0.0% |
| Native Hawaiian | 433 | 0.1% |
| Navajo | 34 | 0.0% |
| Nicaraguan | 453 | 0.1% |
| Nigerian | 771 | 0.2% |
| Northern European | 136 | 0.0% |
| Norwegian | 1,278 | 0.3% |
| Okinawan | 22 | 0.0% |
| Pakistani | 148 | 0.0% |
| Palestinian | 129 | 0.0% |
| Panamanian | 241 | 0.1% |
| Paraguayan | 22 | 0.0% |
| Pennsylvania German | 25 | 0.0% |
| Peruvian | 625 | 0.1% |
| Polish | 37,384 | 8.1% |
| Portuguese | 9,095 | 2.0% |
| Puerto Rican | 101,492 | 21.8% |
| Romanian | 761 | 0.2% |
| Russian | 5,110 | 1.1% |
| Salvadoran | 1,030 | 0.2% |
| Samoan | 110 | 0.0% |
| Scandinavian | 349 | 0.1% |
| Scotch-Irish | 1,787 | 0.4% |
| Scottish | 6,065 | 1.3% |
| Senegalese | 22 | 0.0% |
| Serbian | 30 | 0.0% |
| Sierra Leonean | 14 | 0.0% |
| Sioux | 9 | 0.0% |
| Slavic | 63 | 0.0% |
| Slovak | 537 | 0.1% |
| Slovene | 96 | 0.0% |
| Somali | 745 | 0.2% |
| South African | 15 | 0.0% |
| South American | 3,236 | 0.7% |
| South American Indian | 14 | 0.0% |
| Spaniard | 702 | 0.2% |
| Spanish | 501 | 0.1% |
| Spanish American Indian | 192 | 0.0% |
| Sri Lankan | 1,926 | 0.4% |
| Subsaharan African | 4,486 | 1.0% |
| Sudanese | 48 | 0.0% |
| Swedish | 3,584 | 0.8% |
| Swiss | 339 | 0.1% |
| Syrian | 68 | 0.0% |
| Thai | 2,004 | 0.4% |
| Trinidadian and Tobagonian | 202 | 0.0% |
| Turkish | 1,208 | 0.3% |
| U.S. Virgin Islander | 83 | 0.0% |
| Ukrainian | 3,087 | 0.7% |
| Uruguayan | 319 | 0.1% |
| Venezuelan | 152 | 0.0% |
| Vietnamese | 74 | 0.0% |
| Welsh | 1,077 | 0.2% |
| West Indian | 513 | 0.1% |
| Yugoslavian | 39 | 0.0% |
| Zimbabwean | 20 | 0.0% | View All 146 Rows |
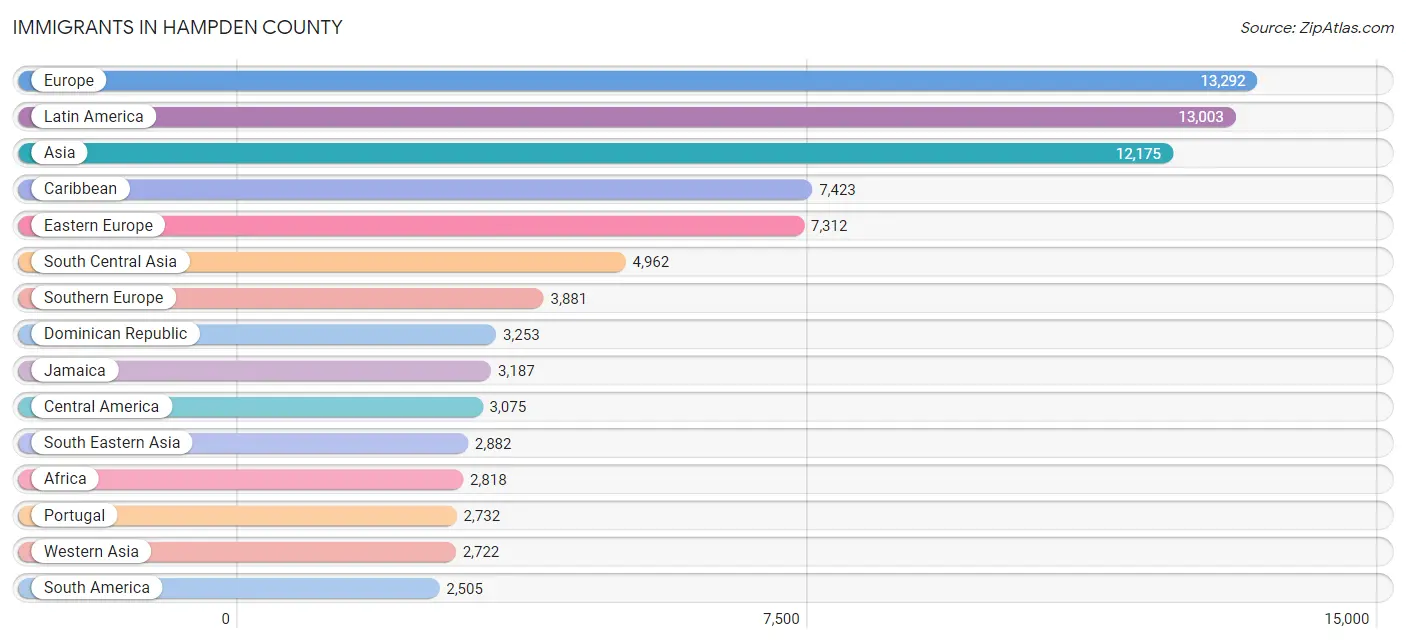
Immigrants in Hampden County
The most numerous immigrant groups reported in Hampden County came from Europe (13,292 | 2.9%), Latin America (13,003 | 2.8%), Asia (12,175 | 2.6%), Caribbean (7,423 | 1.6%), and Eastern Europe (7,312 | 1.6%), together accounting for 11.4% of all Hampden County residents.
| Immigration Origin | # Population | % Population |
| Afghanistan | 120 | 0.0% |
| Africa | 2,818 | 0.6% |
| Albania | 9 | 0.0% |
| Argentina | 120 | 0.0% |
| Armenia | 32 | 0.0% |
| Asia | 12,175 | 2.6% |
| Australia | 35 | 0.0% |
| Austria | 55 | 0.0% |
| Azores | 209 | 0.0% |
| Bangladesh | 52 | 0.0% |
| Barbados | 173 | 0.0% |
| Belarus | 502 | 0.1% |
| Belgium | 21 | 0.0% |
| Bolivia | 14 | 0.0% |
| Brazil | 301 | 0.1% |
| Bulgaria | 60 | 0.0% |
| Cabo Verde | 7 | 0.0% |
| Cambodia | 530 | 0.1% |
| Cameroon | 79 | 0.0% |
| Canada | 1,793 | 0.4% |
| Caribbean | 7,423 | 1.6% |
| Central America | 3,075 | 0.7% |
| Chile | 5 | 0.0% |
| China | 1,224 | 0.3% |
| Colombia | 827 | 0.2% |
| Congo | 16 | 0.0% |
| Costa Rica | 55 | 0.0% |
| Cuba | 91 | 0.0% |
| Czechoslovakia | 36 | 0.0% |
| Dominica | 167 | 0.0% |
| Dominican Republic | 3,253 | 0.7% |
| Eastern Africa | 1,121 | 0.2% |
| Eastern Asia | 1,609 | 0.4% |
| Eastern Europe | 7,312 | 1.6% |
| Ecuador | 314 | 0.1% |
| Egypt | 23 | 0.0% |
| El Salvador | 643 | 0.1% |
| England | 318 | 0.1% |
| Ethiopia | 29 | 0.0% |
| Europe | 13,292 | 2.9% |
| France | 144 | 0.0% |
| Germany | 567 | 0.1% |
| Ghana | 672 | 0.1% |
| Greece | 357 | 0.1% |
| Grenada | 24 | 0.0% |
| Guatemala | 1,263 | 0.3% |
| Guyana | 173 | 0.0% |
| Haiti | 143 | 0.0% |
| Honduras | 169 | 0.0% |
| Hong Kong | 46 | 0.0% |
| Hungary | 18 | 0.0% |
| India | 775 | 0.2% |
| Indonesia | 24 | 0.0% |
| Iran | 234 | 0.1% |
| Iraq | 1,367 | 0.3% |
| Ireland | 434 | 0.1% |
| Israel | 84 | 0.0% |
| Italy | 782 | 0.2% |
| Jamaica | 3,187 | 0.7% |
| Japan | 126 | 0.0% |
| Jordan | 66 | 0.0% |
| Kazakhstan | 348 | 0.1% |
| Kenya | 301 | 0.1% |
| Korea | 259 | 0.1% |
| Kuwait | 23 | 0.0% |
| Laos | 161 | 0.0% |
| Latin America | 13,003 | 2.8% |
| Latvia | 53 | 0.0% |
| Lebanon | 238 | 0.1% |
| Liberia | 23 | 0.0% |
| Lithuania | 15 | 0.0% |
| Malaysia | 48 | 0.0% |
| Mexico | 695 | 0.2% |
| Middle Africa | 133 | 0.0% |
| Moldova | 642 | 0.1% |
| Morocco | 108 | 0.0% |
| Nepal | 1,136 | 0.2% |
| Netherlands | 43 | 0.0% |
| Nicaragua | 213 | 0.1% |
| Nigeria | 311 | 0.1% |
| Northern Africa | 205 | 0.0% |
| Northern Europe | 1,258 | 0.3% |
| Oceania | 35 | 0.0% |
| Pakistan | 865 | 0.2% |
| Panama | 37 | 0.0% |
| Peru | 473 | 0.1% |
| Philippines | 504 | 0.1% |
| Poland | 2,050 | 0.4% |
| Portugal | 2,732 | 0.6% |
| Romania | 87 | 0.0% |
| Russia | 1,367 | 0.3% |
| Saudi Arabia | 9 | 0.0% |
| Scotland | 35 | 0.0% |
| Senegal | 63 | 0.0% |
| Serbia | 21 | 0.0% |
| Sierra Leone | 14 | 0.0% |
| Somalia | 280 | 0.1% |
| South Africa | 21 | 0.0% |
| South America | 2,505 | 0.5% |
| South Central Asia | 4,962 | 1.1% |
| South Eastern Asia | 2,882 | 0.6% |
| Southern Europe | 3,881 | 0.8% |
| Spain | 10 | 0.0% |
| Sri Lanka | 208 | 0.0% |
| Sudan | 33 | 0.0% |
| Sweden | 40 | 0.0% |
| Switzerland | 2 | 0.0% |
| Syria | 116 | 0.0% |
| Taiwan | 84 | 0.0% |
| Thailand | 280 | 0.1% |
| Trinidad and Tobago | 183 | 0.0% |
| Turkey | 497 | 0.1% |
| Uganda | 15 | 0.0% |
| Ukraine | 2,171 | 0.5% |
| Uruguay | 168 | 0.0% |
| Uzbekistan | 105 | 0.0% |
| Venezuela | 51 | 0.0% |
| Vietnam | 1,251 | 0.3% |
| West Indies | 143 | 0.0% |
| Western Africa | 1,146 | 0.3% |
| Western Asia | 2,722 | 0.6% |
| Western Europe | 841 | 0.2% |
| Yemen | 45 | 0.0% |
| Zimbabwe | 31 | 0.0% | View All 124 Rows |
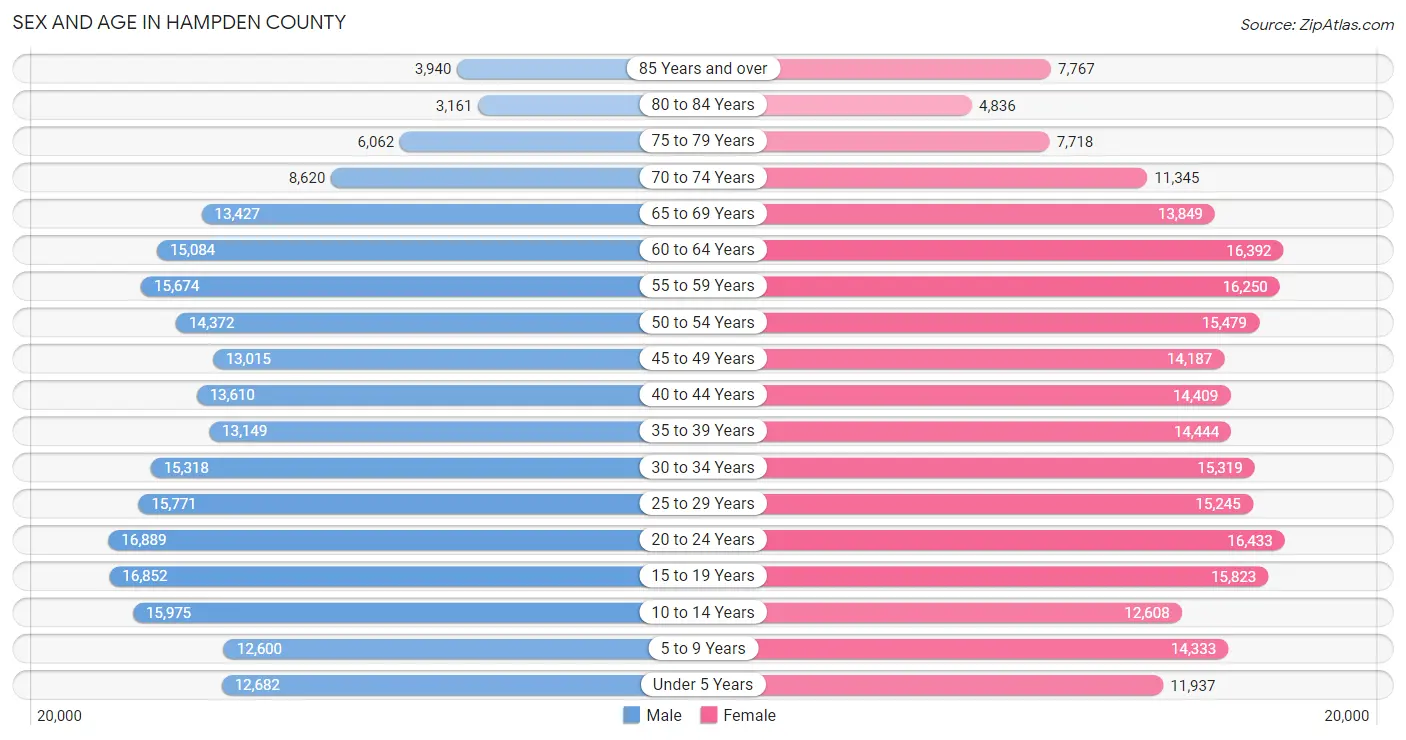
Sex and Age in Hampden County
Sex and Age in Hampden County
The most populous age groups in Hampden County are 20 to 24 Years (16,889 | 7.5%) for men and 20 to 24 Years (16,433 | 6.9%) for women.
| Age Bracket | Male | Female |
| Under 5 Years | 12,682 (5.6%) | 11,937 (5.0%) |
| 5 to 9 Years | 12,600 (5.6%) | 14,333 (6.0%) |
| 10 to 14 Years | 15,975 (7.1%) | 12,608 (5.3%) |
| 15 to 19 Years | 16,852 (7.4%) | 15,823 (6.6%) |
| 20 to 24 Years | 16,889 (7.5%) | 16,433 (6.9%) |
| 25 to 29 Years | 15,771 (7.0%) | 15,245 (6.4%) |
| 30 to 34 Years | 15,318 (6.8%) | 15,319 (6.4%) |
| 35 to 39 Years | 13,149 (5.8%) | 14,444 (6.1%) |
| 40 to 44 Years | 13,610 (6.0%) | 14,409 (6.0%) |
| 45 to 49 Years | 13,015 (5.8%) | 14,187 (5.9%) |
| 50 to 54 Years | 14,372 (6.4%) | 15,479 (6.5%) |
| 55 to 59 Years | 15,674 (6.9%) | 16,250 (6.8%) |
| 60 to 64 Years | 15,084 (6.7%) | 16,392 (6.9%) |
| 65 to 69 Years | 13,427 (5.9%) | 13,849 (5.8%) |
| 70 to 74 Years | 8,620 (3.8%) | 11,345 (4.8%) |
| 75 to 79 Years | 6,062 (2.7%) | 7,718 (3.2%) |
| 80 to 84 Years | 3,161 (1.4%) | 4,836 (2.0%) |
| 85 Years and over | 3,940 (1.7%) | 7,767 (3.3%) |
| Total | 226,201 (100.0%) | 238,374 (100.0%) |
Families and Households in Hampden County
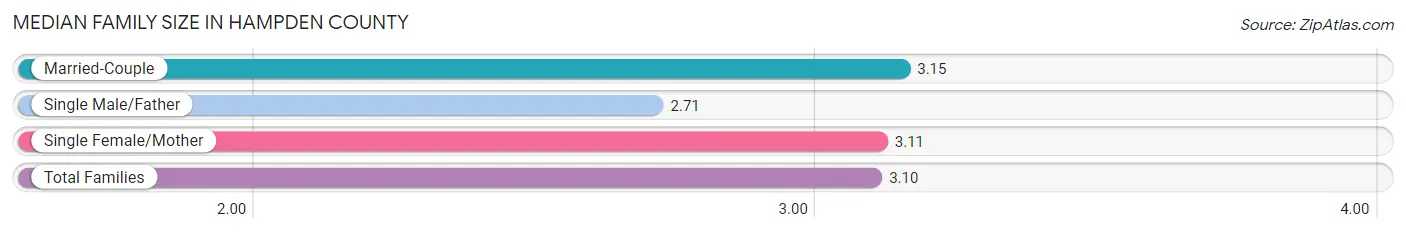
Median Family Size in Hampden County
The median family size in Hampden County is 3.10 persons per family, with married-couple families (74,933 | 65.3%) accounting for the largest median family size of 3.15 persons per family. On the other hand, single male/father families (10,267 | 8.9%) represent the smallest median family size with 2.71 persons per family.
| Family Type | # Families | Family Size |
| Married-Couple | 74,933 (65.3%) | 3.15 |
| Single Male/Father | 10,267 (8.9%) | 2.71 |
| Single Female/Mother | 29,614 (25.8%) | 3.11 |
| Total Families | 114,814 (100.0%) | 3.10 |
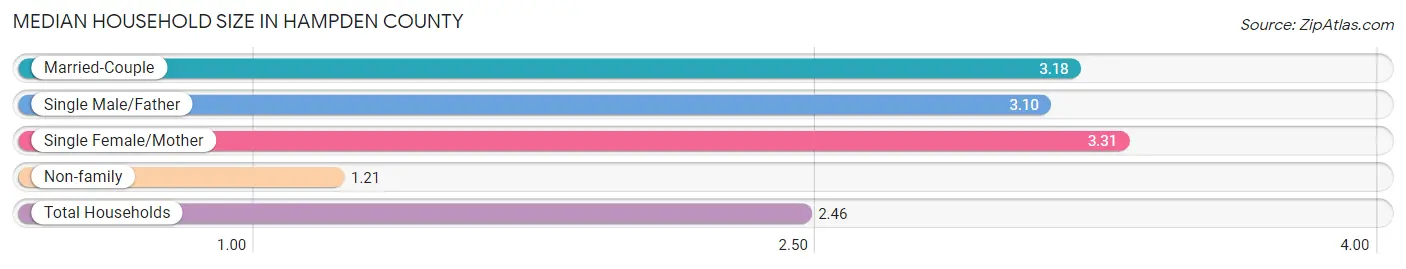
Median Household Size in Hampden County
The median household size in Hampden County is 2.46 persons per household, with single female/mother households (29,614 | 16.2%) accounting for the largest median household size of 3.31 persons per household. non-family households (68,566 | 37.4%) represent the smallest median household size with 1.21 persons per household.
| Household Type | # Households | Household Size |
| Married-Couple | 74,933 (40.9%) | 3.18 |
| Single Male/Father | 10,267 (5.6%) | 3.10 |
| Single Female/Mother | 29,614 (16.2%) | 3.31 |
| Non-family | 68,566 (37.4%) | 1.21 |
| Total Households | 183,380 (100.0%) | 2.46 |
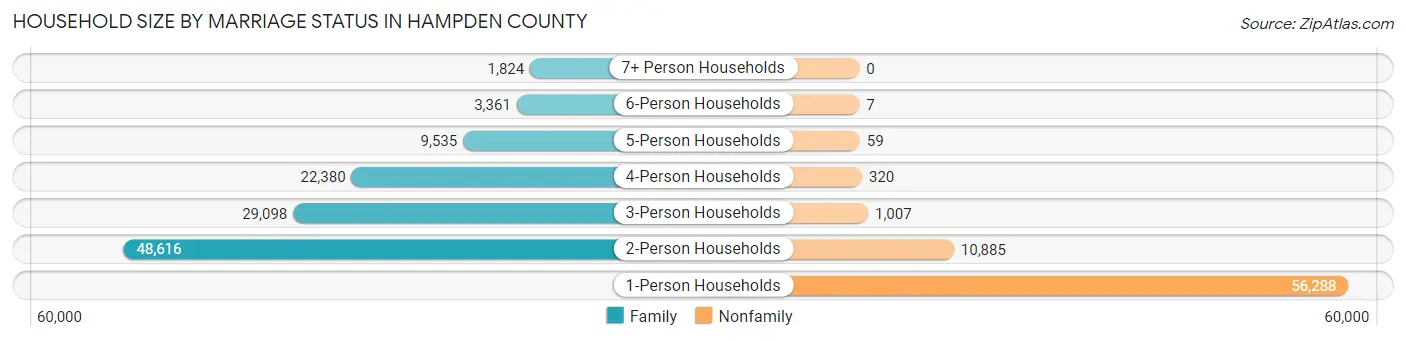
Household Size by Marriage Status in Hampden County
Out of a total of 183,380 households in Hampden County, 114,814 (62.6%) are family households, while 68,566 (37.4%) are nonfamily households. The most numerous type of family households are 2-person households, comprising 48,616, and the most common type of nonfamily households are 1-person households, comprising 56,288.
| Household Size | Family Households | Nonfamily Households |
| 1-Person Households | - | 56,288 (30.7%) |
| 2-Person Households | 48,616 (26.5%) | 10,885 (5.9%) |
| 3-Person Households | 29,098 (15.9%) | 1,007 (0.5%) |
| 4-Person Households | 22,380 (12.2%) | 320 (0.2%) |
| 5-Person Households | 9,535 (5.2%) | 59 (0.0%) |
| 6-Person Households | 3,361 (1.8%) | 7 (0.0%) |
| 7+ Person Households | 1,824 (1.0%) | 0 (0.0%) |
| Total | 114,814 (62.6%) | 68,566 (37.4%) |
Female Fertility in Hampden County
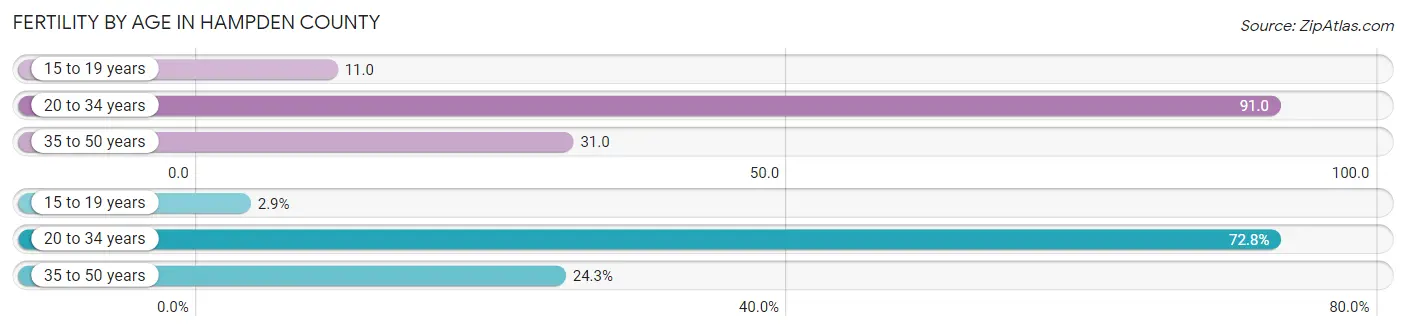
Fertility by Age in Hampden County
Average fertility rate in Hampden County is 54.0 births per 1,000 women. Women in the age bracket of 20 to 34 years have the highest fertility rate with 91.0 births per 1,000 women. Women in the age bracket of 20 to 34 years acount for 72.8% of all women with births.
| Age Bracket | Women with Births | Births / 1,000 Women |
| 15 to 19 years | 170 (2.9%) | 11.0 |
| 20 to 34 years | 4,270 (72.8%) | 91.0 |
| 35 to 50 years | 1,424 (24.3%) | 31.0 |
| Total | 5,864 (100.0%) | 54.0 |
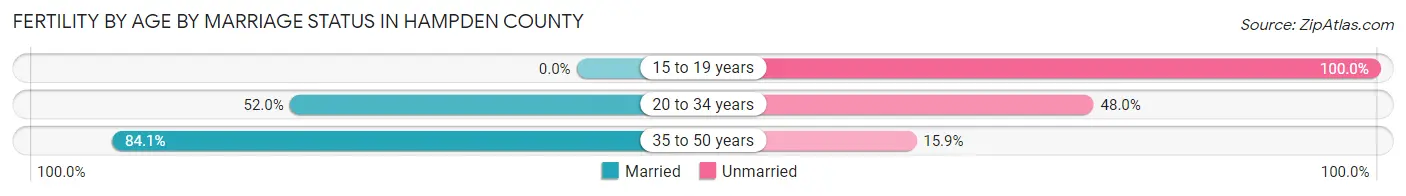
Fertility by Age by Marriage Status in Hampden County
58.3% of women with births (5,864) in Hampden County are married. The highest percentage of unmarried women with births falls into 15 to 19 years age bracket with 100.0% of them unmarried at the time of birth, while the lowest percentage of unmarried women with births belong to 35 to 50 years age bracket with 15.9% of them unmarried.
| Age Bracket | Married | Unmarried |
| 15 to 19 years | 0 (0.0%) | 170 (100.0%) |
| 20 to 34 years | 2,220 (52.0%) | 2,050 (48.0%) |
| 35 to 50 years | 1,198 (84.1%) | 226 (15.9%) |
| Total | 3,419 (58.3%) | 2,445 (41.7%) |
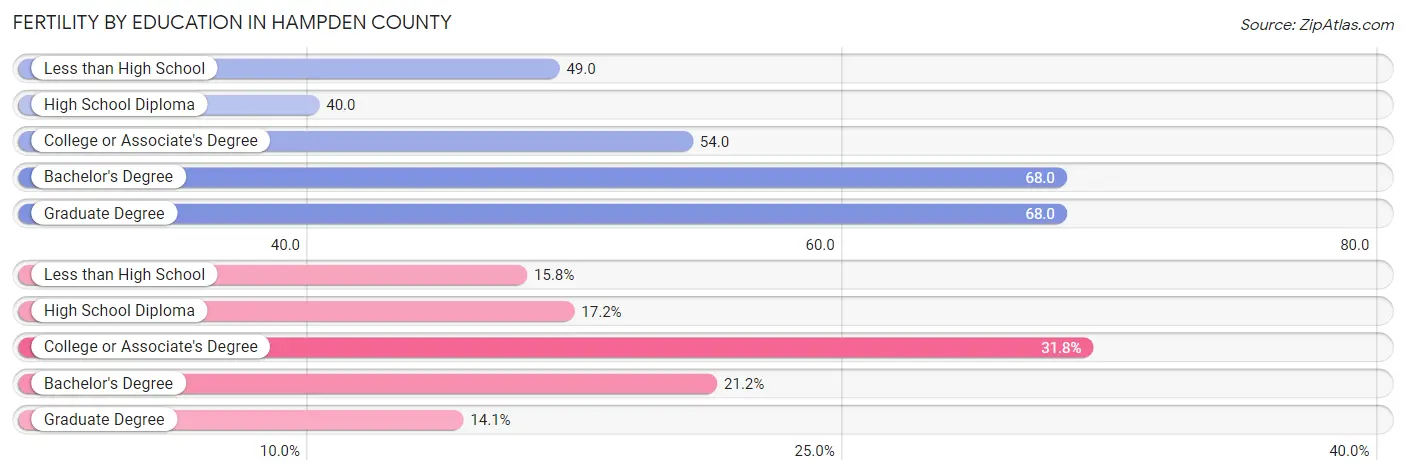
Fertility by Education in Hampden County
Average fertility rate in Hampden County is 54.0 births per 1,000 women. Women with the education attainment of bachelor's degree have the highest fertility rate of 68.0 births per 1,000 women, while women with the education attainment of high school diploma have the lowest fertility at 40.0 births per 1,000 women. Women with the education attainment of college or associate's degree represent 31.8% of all women with births.
| Educational Attainment | Women with Births | Births / 1,000 Women |
| Less than High School | 929 (15.8%) | 49.0 |
| High School Diploma | 1,007 (17.2%) | 40.0 |
| College or Associate's Degree | 1,862 (31.8%) | 54.0 |
| Bachelor's Degree | 1,242 (21.2%) | 68.0 |
| Graduate Degree | 824 (14.1%) | 68.0 |
| Total | 5,864 (100.0%) | 54.0 |
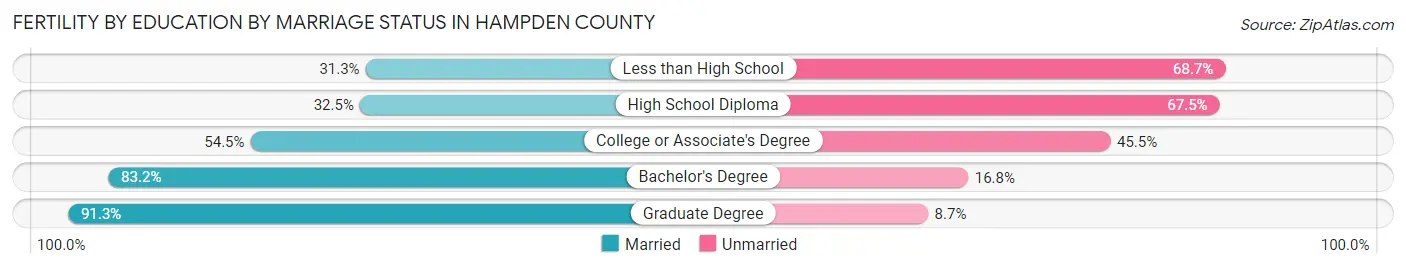
Fertility by Education by Marriage Status in Hampden County
41.7% of women with births in Hampden County are unmarried. Women with the educational attainment of graduate degree are most likely to be married with 91.3% of them married at childbirth, while women with the educational attainment of less than high school are least likely to be married with 68.7% of them unmarried at childbirth.
| Educational Attainment | Married | Unmarried |
| Less than High School | 291 (31.3%) | 638 (68.7%) |
| High School Diploma | 327 (32.5%) | 680 (67.5%) |
| College or Associate's Degree | 1,015 (54.5%) | 847 (45.5%) |
| Bachelor's Degree | 1,033 (83.2%) | 209 (16.8%) |
| Graduate Degree | 752 (91.3%) | 72 (8.7%) |
| Total | 3,419 (58.3%) | 2,445 (41.7%) |
Income in Hampden County
Income Overview in Hampden County
Per Capita Income in Hampden County is $35,884, while median incomes of families and households are $85,009 and $66,619 respectively.
| Characteristic | Number | Measure |
| Per Capita Income | 464,575 | $35,884 |
| Median Family Income | 114,814 | $85,009 |
| Mean Family Income | 114,814 | $108,837 |
| Median Household Income | 183,380 | $66,619 |
| Mean Household Income | 183,380 | $89,616 |
| Income Deficit | 114,814 | $10,372 |
| Wage / Income Gap (%) | 464,575 | 24.29% |
| Wage / Income Gap ($) | 464,575 | 75.71¢ per $1 |
| Gini / Inequality Index | 464,575 | 0.47 |
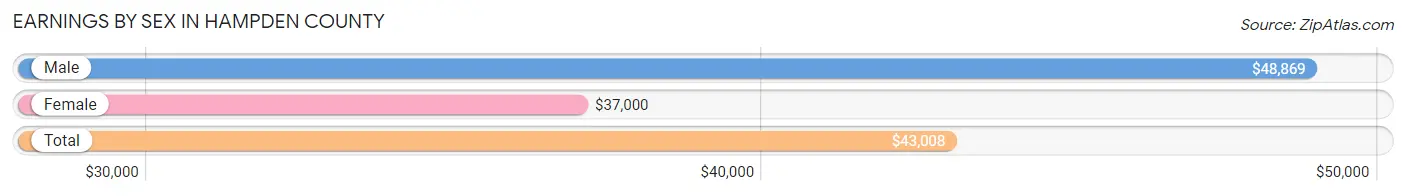
Earnings by Sex in Hampden County
Average Earnings in Hampden County are $43,008, $48,869 for men and $37,000 for women, a difference of 24.3%.
| Sex | Number | Average Earnings |
| Male | 119,593 (50.6%) | $48,869 |
| Female | 116,813 (49.4%) | $37,000 |
| Total | 236,406 (100.0%) | $43,008 |
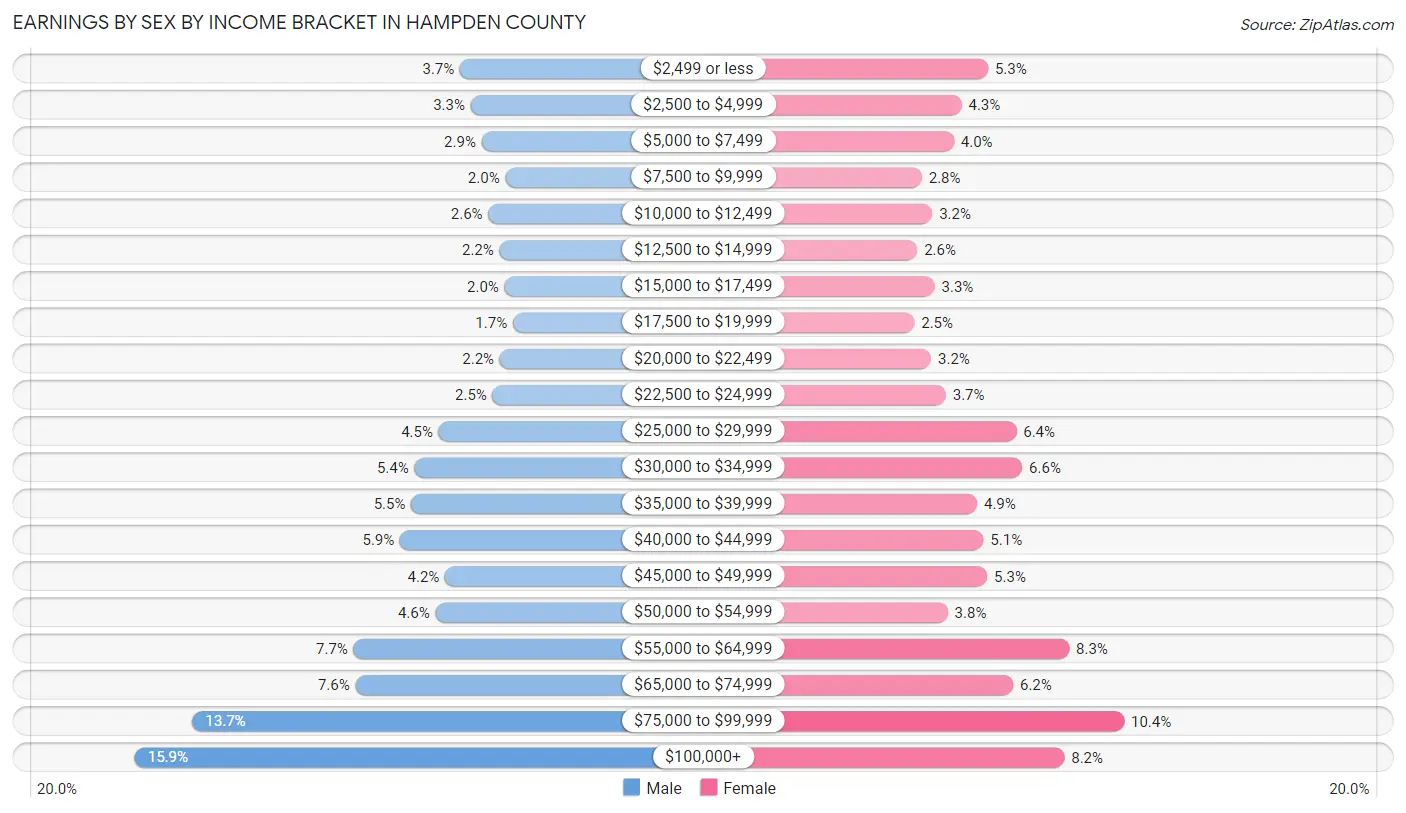
Earnings by Sex by Income Bracket in Hampden County
The most common earnings brackets in Hampden County are $100,000+ for men (18,977 | 15.9%) and $75,000 to $99,999 for women (12,134 | 10.4%).
| Income | Male | Female |
| $2,499 or less | 4,403 (3.7%) | 6,185 (5.3%) |
| $2,500 to $4,999 | 3,925 (3.3%) | 5,021 (4.3%) |
| $5,000 to $7,499 | 3,430 (2.9%) | 4,687 (4.0%) |
| $7,500 to $9,999 | 2,363 (2.0%) | 3,282 (2.8%) |
| $10,000 to $12,499 | 3,135 (2.6%) | 3,734 (3.2%) |
| $12,500 to $14,999 | 2,631 (2.2%) | 3,080 (2.6%) |
| $15,000 to $17,499 | 2,408 (2.0%) | 3,845 (3.3%) |
| $17,500 to $19,999 | 2,036 (1.7%) | 2,957 (2.5%) |
| $20,000 to $22,499 | 2,623 (2.2%) | 3,694 (3.2%) |
| $22,500 to $24,999 | 2,940 (2.5%) | 4,332 (3.7%) |
| $25,000 to $29,999 | 5,356 (4.5%) | 7,423 (6.4%) |
| $30,000 to $34,999 | 6,451 (5.4%) | 7,671 (6.6%) |
| $35,000 to $39,999 | 6,589 (5.5%) | 5,701 (4.9%) |
| $40,000 to $44,999 | 7,094 (5.9%) | 5,983 (5.1%) |
| $45,000 to $49,999 | 5,072 (4.2%) | 6,148 (5.3%) |
| $50,000 to $54,999 | 5,503 (4.6%) | 4,411 (3.8%) |
| $55,000 to $64,999 | 9,178 (7.7%) | 9,727 (8.3%) |
| $65,000 to $74,999 | 9,087 (7.6%) | 7,273 (6.2%) |
| $75,000 to $99,999 | 16,392 (13.7%) | 12,134 (10.4%) |
| $100,000+ | 18,977 (15.9%) | 9,525 (8.2%) |
| Total | 119,593 (100.0%) | 116,813 (100.0%) |
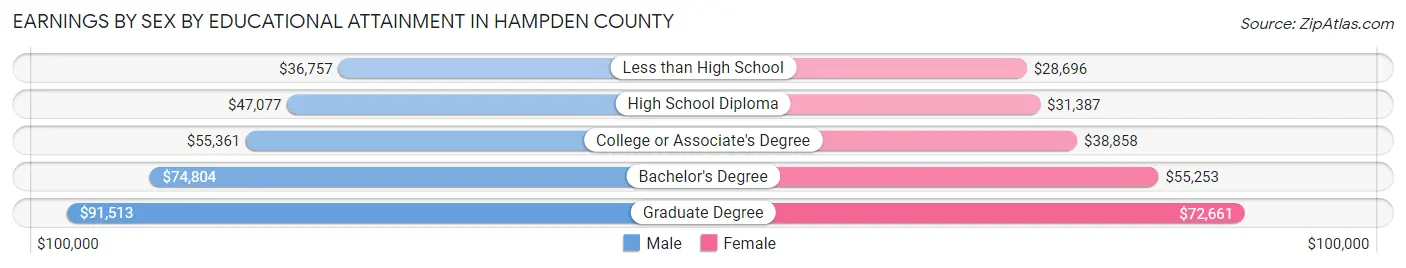
Earnings by Sex by Educational Attainment in Hampden County
Average earnings in Hampden County are $56,087 for men and $43,154 for women, a difference of 23.1%. Men with an educational attainment of graduate degree enjoy the highest average annual earnings of $91,513, while those with less than high school education earn the least with $36,757. Women with an educational attainment of graduate degree earn the most with the average annual earnings of $72,661, while those with less than high school education have the smallest earnings of $28,696.
| Educational Attainment | Male Income | Female Income |
| Less than High School | $36,757 | $28,696 |
| High School Diploma | $47,077 | $31,387 |
| College or Associate's Degree | $55,361 | $38,858 |
| Bachelor's Degree | $74,804 | $55,253 |
| Graduate Degree | $91,513 | $72,661 |
| Total | $56,087 | $43,154 |
Family Income in Hampden County
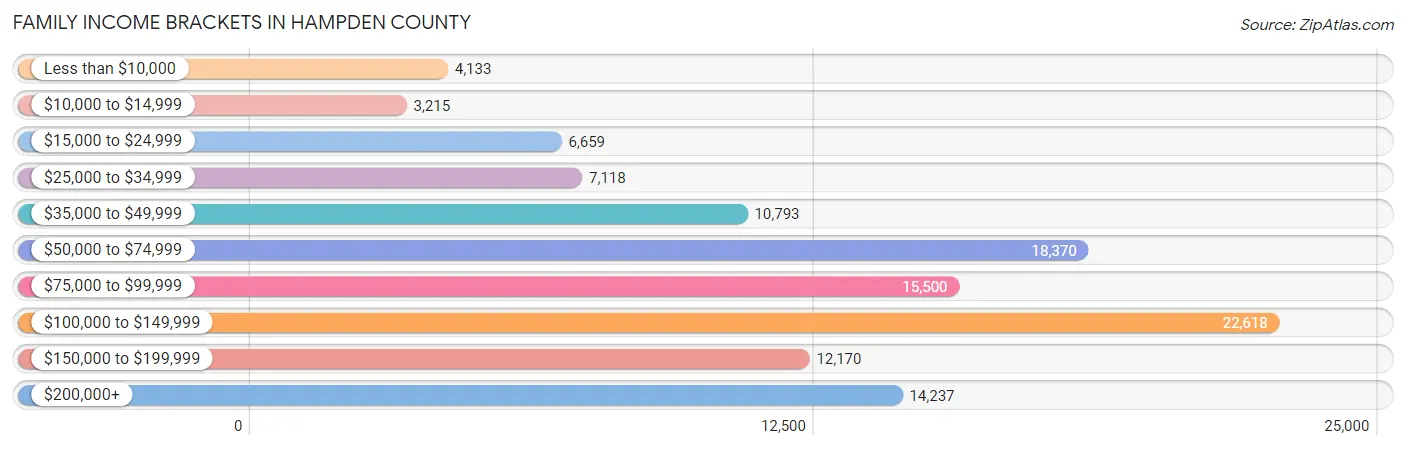
Family Income Brackets in Hampden County
According to the Hampden County family income data, there are 22,618 families falling into the $100,000 to $149,999 income range, which is the most common income bracket and makes up 19.7% of all families. Conversely, the $10,000 to $14,999 income bracket is the least frequent group with only 3,215 families (2.8%) belonging to this category.
| Income Bracket | # Families | % Families |
| Less than $10,000 | 4,133 | 3.6% |
| $10,000 to $14,999 | 3,215 | 2.8% |
| $15,000 to $24,999 | 6,659 | 5.8% |
| $25,000 to $34,999 | 7,118 | 6.2% |
| $35,000 to $49,999 | 10,793 | 9.4% |
| $50,000 to $74,999 | 18,370 | 16.0% |
| $75,000 to $99,999 | 15,500 | 13.5% |
| $100,000 to $149,999 | 22,618 | 19.7% |
| $150,000 to $199,999 | 12,170 | 10.6% |
| $200,000+ | 14,237 | 12.4% |
Family Income by Famaliy Size in Hampden County
5-person families (8,085 | 7.0%) account for the highest median family income in Hampden County with $116,207 per family, while 2-person families (53,085 | 46.2%) have the highest median income of $37,135 per family member.
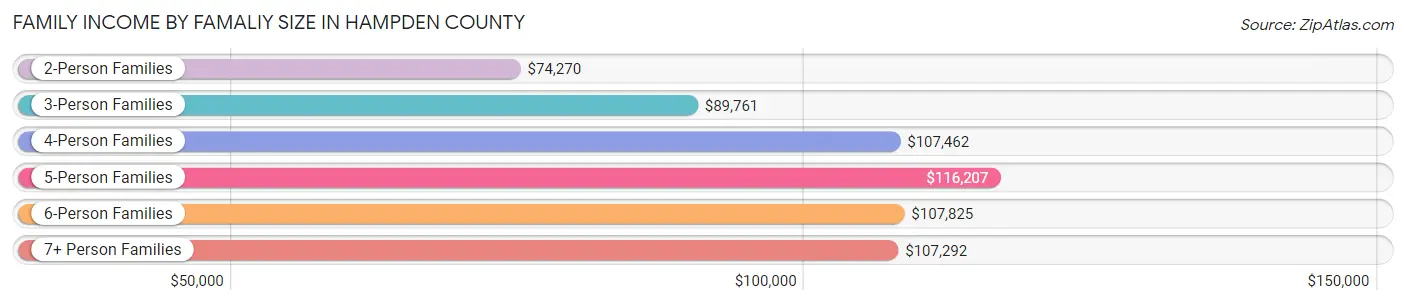
| Income Bracket | # Families | Median Income |
| 2-Person Families | 53,085 (46.2%) | $74,270 |
| 3-Person Families | 28,486 (24.8%) | $89,761 |
| 4-Person Families | 20,700 (18.0%) | $107,462 |
| 5-Person Families | 8,085 (7.0%) | $116,207 |
| 6-Person Families | 2,929 (2.5%) | $107,825 |
| 7+ Person Families | 1,529 (1.3%) | $107,292 |
| Total | 114,814 (100.0%) | $85,009 |
Family Income by Number of Earners in Hampden County
The median family income in Hampden County is $85,009, with families comprising 3+ earners (15,259) having the highest median family income of $160,597, while families with no earners (18,222) have the lowest median family income of $34,169, accounting for 13.3% and 15.9% of families, respectively.
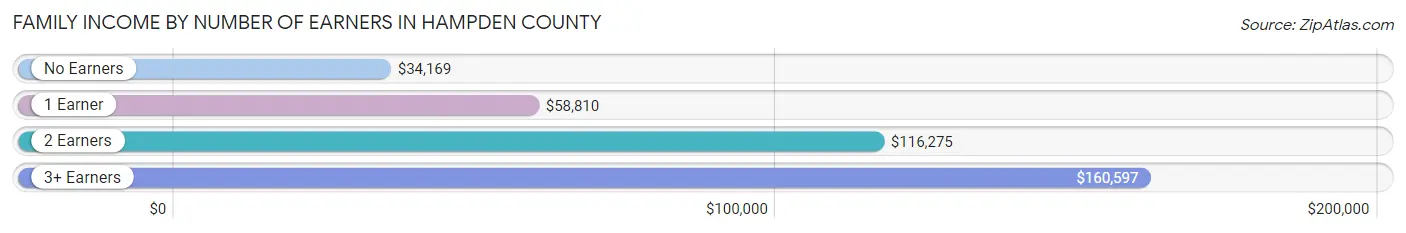
| Number of Earners | # Families | Median Income |
| No Earners | 18,222 (15.9%) | $34,169 |
| 1 Earner | 38,563 (33.6%) | $58,810 |
| 2 Earners | 42,770 (37.2%) | $116,275 |
| 3+ Earners | 15,259 (13.3%) | $160,597 |
| Total | 114,814 (100.0%) | $85,009 |
Household Income in Hampden County
Household Income Brackets in Hampden County
With 29,524 households falling in the category, the $100,000 to $149,999 income range is the most frequent in Hampden County, accounting for 16.1% of all households. In contrast, only 10,819 households (5.9%) fall into the less than $10,000 income bracket, making it the least populous group.
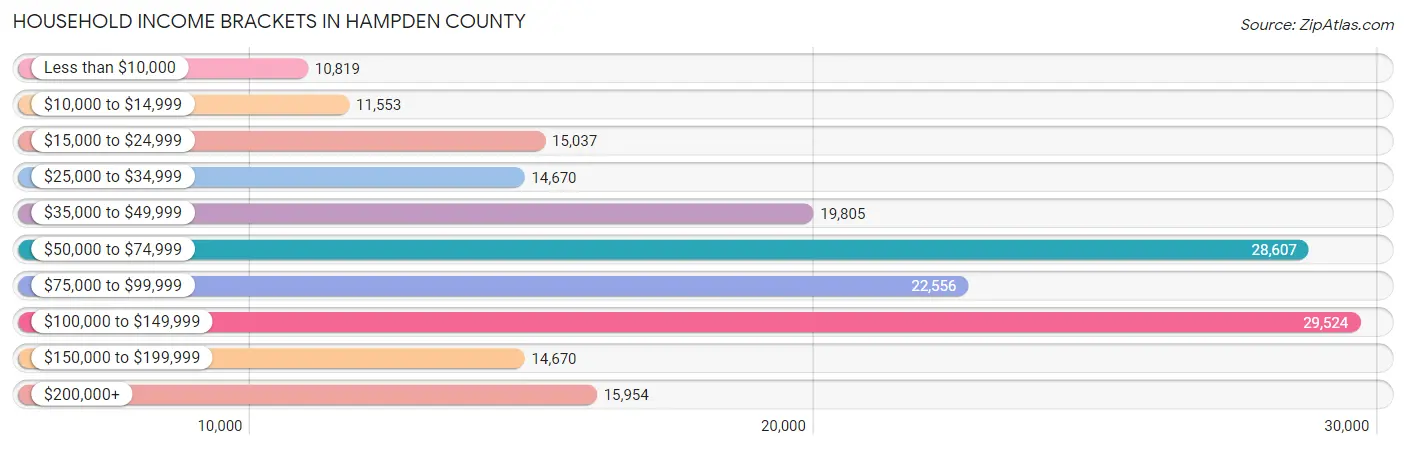
| Income Bracket | # Households | % Households |
| Less than $10,000 | 10,819 | 5.9% |
| $10,000 to $14,999 | 11,553 | 6.3% |
| $15,000 to $24,999 | 15,037 | 8.2% |
| $25,000 to $34,999 | 14,670 | 8.0% |
| $35,000 to $49,999 | 19,805 | 10.8% |
| $50,000 to $74,999 | 28,607 | 15.6% |
| $75,000 to $99,999 | 22,556 | 12.3% |
| $100,000 to $149,999 | 29,524 | 16.1% |
| $150,000 to $199,999 | 14,670 | 8.0% |
| $200,000+ | 15,954 | 8.7% |
Household Income by Householder Age in Hampden County
The median household income in Hampden County is $66,619, with the highest median household income of $82,282 found in the 45 to 64 years age bracket for the primary householder. A total of 70,548 households (38.5%) fall into this category. Meanwhile, the 15 to 24 years age bracket for the primary householder has the lowest median household income of $36,474, with 4,653 households (2.5%) in this group.
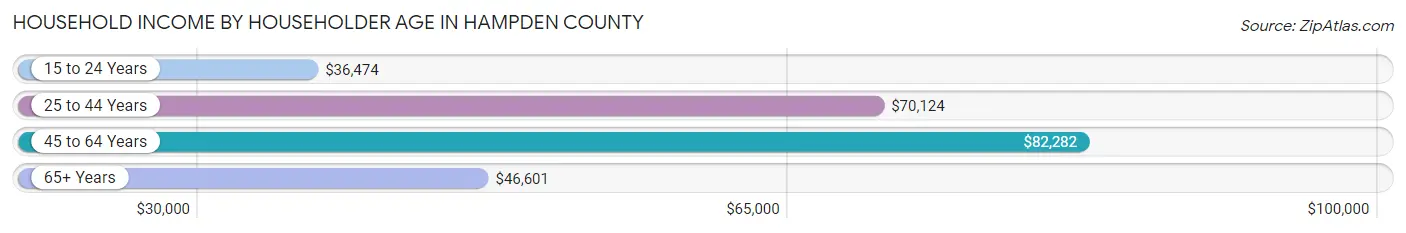
| Income Bracket | # Households | Median Income |
| 15 to 24 Years | 4,653 (2.5%) | $36,474 |
| 25 to 44 Years | 56,706 (30.9%) | $70,124 |
| 45 to 64 Years | 70,548 (38.5%) | $82,282 |
| 65+ Years | 51,473 (28.1%) | $46,601 |
| Total | 183,380 (100.0%) | $66,619 |
Poverty in Hampden County
Income Below Poverty by Sex and Age in Hampden County
With 14.2% poverty level for males and 17.2% for females among the residents of Hampden County, 15 year old males and 5 year old females are the most vulnerable to poverty, with 826 males (23.8%) and 700 females (25.3%) in their respective age groups living below the poverty level.
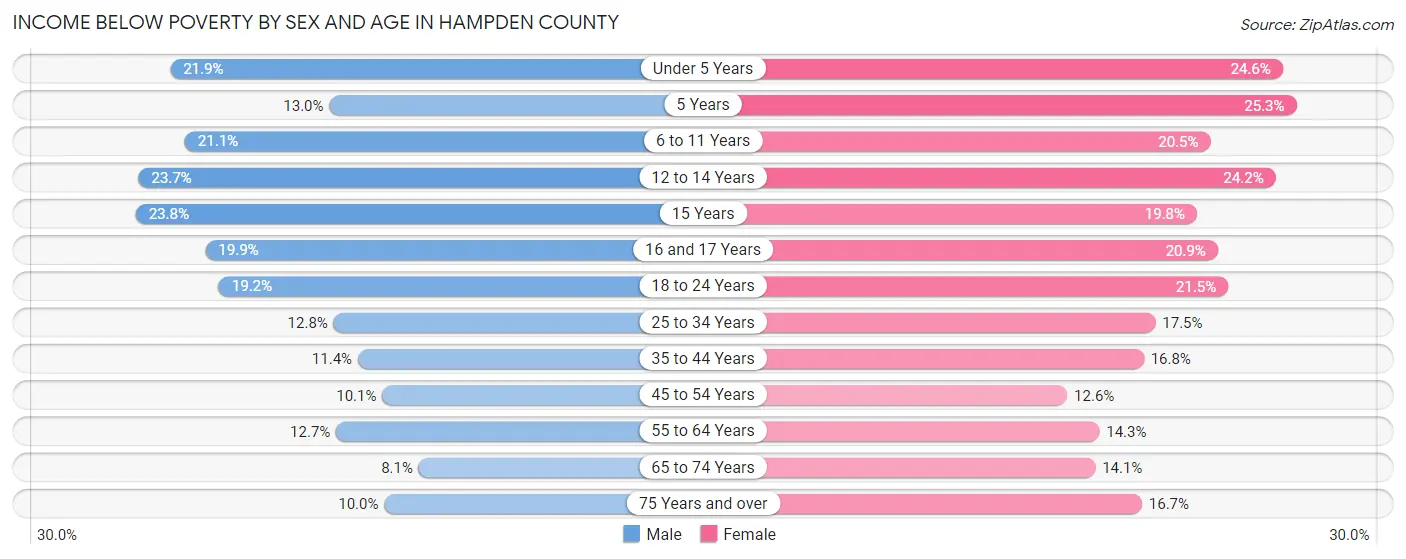
| Age Bracket | Male | Female |
| Under 5 Years | 2,727 (21.9%) | 2,920 (24.5%) |
| 5 Years | 282 (13.0%) | 700 (25.3%) |
| 6 to 11 Years | 3,485 (21.1%) | 3,229 (20.5%) |
| 12 to 14 Years | 2,207 (23.7%) | 1,842 (24.1%) |
| 15 Years | 826 (23.8%) | 535 (19.8%) |
| 16 and 17 Years | 1,182 (19.9%) | 1,278 (20.9%) |
| 18 to 24 Years | 4,025 (19.2%) | 4,239 (21.5%) |
| 25 to 34 Years | 3,947 (12.8%) | 5,330 (17.5%) |
| 35 to 44 Years | 3,038 (11.4%) | 4,848 (16.8%) |
| 45 to 54 Years | 2,747 (10.1%) | 3,719 (12.6%) |
| 55 to 64 Years | 3,863 (12.7%) | 4,665 (14.3%) |
| 65 to 74 Years | 1,755 (8.1%) | 3,520 (14.1%) |
| 75 Years and over | 1,235 (10.0%) | 3,108 (16.7%) |
| Total | 31,319 (14.2%) | 39,933 (17.2%) |
Income Above Poverty by Sex and Age in Hampden County
According to the poverty statistics in Hampden County, males aged 65 to 74 years and females aged 45 to 54 years are the age groups that are most secure financially, with 91.9% of males and 87.5% of females in these age groups living above the poverty line.
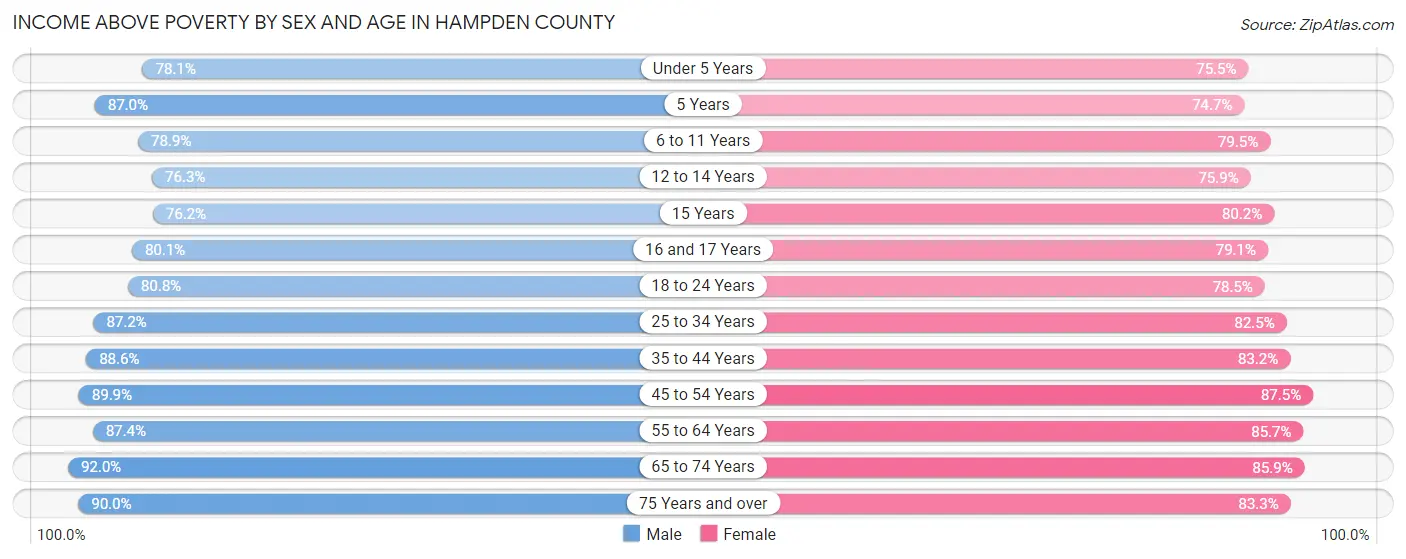
| Age Bracket | Male | Female |
| Under 5 Years | 9,730 (78.1%) | 8,972 (75.4%) |
| 5 Years | 1,882 (87.0%) | 2,066 (74.7%) |
| 6 to 11 Years | 13,057 (78.9%) | 12,507 (79.5%) |
| 12 to 14 Years | 7,121 (76.3%) | 5,784 (75.8%) |
| 15 Years | 2,643 (76.2%) | 2,171 (80.2%) |
| 16 and 17 Years | 4,750 (80.1%) | 4,829 (79.1%) |
| 18 to 24 Years | 16,961 (80.8%) | 15,469 (78.5%) |
| 25 to 34 Years | 26,916 (87.2%) | 25,204 (82.5%) |
| 35 to 44 Years | 23,508 (88.6%) | 23,992 (83.2%) |
| 45 to 54 Years | 24,509 (89.9%) | 25,920 (87.5%) |
| 55 to 64 Years | 26,685 (87.4%) | 27,868 (85.7%) |
| 65 to 74 Years | 20,035 (91.9%) | 21,423 (85.9%) |
| 75 Years and over | 11,149 (90.0%) | 15,487 (83.3%) |
| Total | 188,946 (85.8%) | 191,692 (82.8%) |
Income Below Poverty Among Married-Couple Families in Hampden County
The poverty statistics for married-couple families in Hampden County show that 4.4% or 3,324 of the total 74,933 families live below the poverty line. Families with 5 or more children have the highest poverty rate of 21.9%, comprising of 92 families. On the other hand, families with 1 or 2 children have the lowest poverty rate of 4.0%, which includes 875 families.
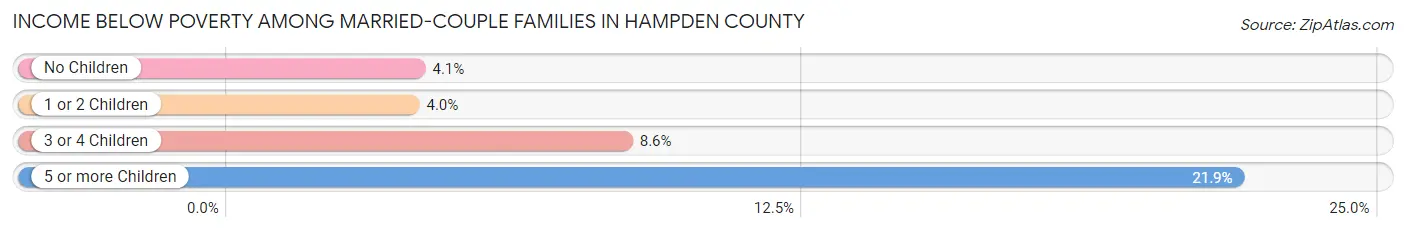
| Children | Above Poverty | Below Poverty |
| No Children | 45,593 (95.9%) | 1,941 (4.1%) |
| 1 or 2 Children | 21,262 (96.1%) | 875 (4.0%) |
| 3 or 4 Children | 4,426 (91.4%) | 416 (8.6%) |
| 5 or more Children | 328 (78.1%) | 92 (21.9%) |
| Total | 71,609 (95.6%) | 3,324 (4.4%) |
Income Below Poverty Among Single-Parent Households in Hampden County
According to the poverty data in Hampden County, 10.9% or 1,116 single-father households and 28.1% or 8,336 single-mother households are living below the poverty line. Among single-father households, those with 5 or more children have the highest poverty rate, with 23 households (48.9%) experiencing poverty. Likewise, among single-mother households, those with 5 or more children have the highest poverty rate, with 305 households (80.5%) falling below the poverty line.
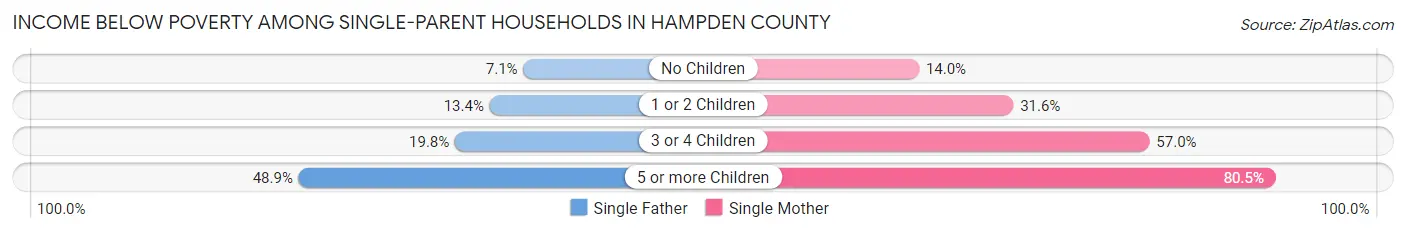
| Children | Single Father | Single Mother |
| No Children | 362 (7.1%) | 1,479 (14.0%) |
| 1 or 2 Children | 584 (13.4%) | 5,089 (31.6%) |
| 3 or 4 Children | 147 (19.8%) | 1,463 (57.0%) |
| 5 or more Children | 23 (48.9%) | 305 (80.5%) |
| Total | 1,116 (10.9%) | 8,336 (28.1%) |
Income Below Poverty Among Married-Couple vs Single-Parent Households in Hampden County
The poverty data for Hampden County shows that 3,324 of the married-couple family households (4.4%) and 9,452 of the single-parent households (23.7%) are living below the poverty level. Within the married-couple family households, those with 5 or more children have the highest poverty rate, with 92 households (21.9%) falling below the poverty line. Among the single-parent households, those with 5 or more children have the highest poverty rate, with 328 household (77.0%) living below poverty.
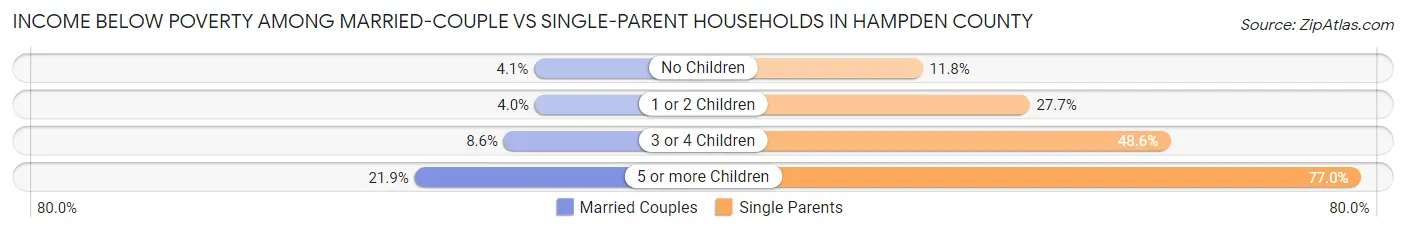
| Children | Married-Couple Families | Single-Parent Households |
| No Children | 1,941 (4.1%) | 1,841 (11.8%) |
| 1 or 2 Children | 875 (4.0%) | 5,673 (27.7%) |
| 3 or 4 Children | 416 (8.6%) | 1,610 (48.6%) |
| 5 or more Children | 92 (21.9%) | 328 (77.0%) |
| Total | 3,324 (4.4%) | 9,452 (23.7%) |
Employment Characteristics in Hampden County
Employment by Class of Employer in Hampden County
Among the 209,900 employed individuals in Hampden County, private company employees (135,209 | 64.4%), not-for-profit organizations (23,991 | 11.4%), and local government employees (18,466 | 8.8%) make up the most common classes of employment.
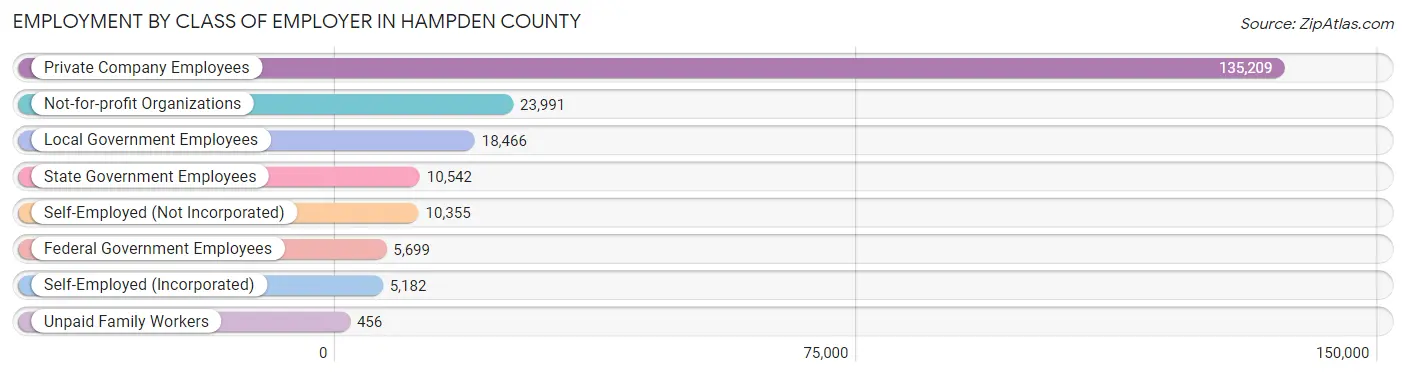
| Employer Class | # Employees | % Employees |
| Private Company Employees | 135,209 | 64.4% |
| Self-Employed (Incorporated) | 5,182 | 2.5% |
| Self-Employed (Not Incorporated) | 10,355 | 4.9% |
| Not-for-profit Organizations | 23,991 | 11.4% |
| Local Government Employees | 18,466 | 8.8% |
| State Government Employees | 10,542 | 5.0% |
| Federal Government Employees | 5,699 | 2.7% |
| Unpaid Family Workers | 456 | 0.2% |
| Total | 209,900 | 100.0% |
Employment Status by Age in Hampden County
According to the labor force statistics for Hampden County, out of the total population over 16 years of age (378,198), 60.2% or 227,675 individuals are in the labor force, with 6.2% or 14,116 of them unemployed. The age group with the highest labor force participation rate is 30 to 34 years, with 82.3% or 25,214 individuals in the labor force. Within the labor force, the 16 to 19 years age range has the highest percentage of unemployed individuals, with 21.3% or 1,830 of them being unemployed.
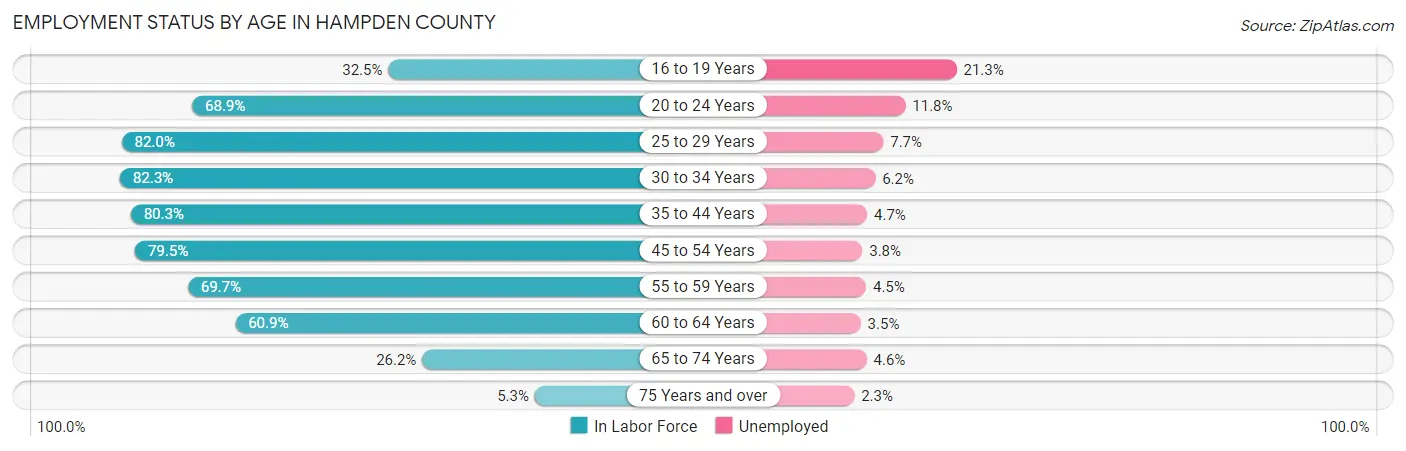
| Age Bracket | In Labor Force | Unemployed |
| 16 to 19 Years | 8,591 (32.5%) | 1,830 (21.3%) |
| 20 to 24 Years | 22,959 (68.9%) | 2,709 (11.8%) |
| 25 to 29 Years | 25,433 (82.0%) | 1,958 (7.7%) |
| 30 to 34 Years | 25,214 (82.3%) | 1,563 (6.2%) |
| 35 to 44 Years | 44,656 (80.3%) | 2,099 (4.7%) |
| 45 to 54 Years | 45,357 (79.5%) | 1,724 (3.8%) |
| 55 to 59 Years | 22,251 (69.7%) | 1,001 (4.5%) |
| 60 to 64 Years | 19,169 (60.9%) | 671 (3.5%) |
| 65 to 74 Years | 12,377 (26.2%) | 569 (4.6%) |
| 75 Years and over | 1,775 (5.3%) | 41 (2.3%) |
| Total | 227,675 (60.2%) | 14,116 (6.2%) |
Employment Status by Educational Attainment in Hampden County
According to labor force statistics for Hampden County, 76.6% of individuals (182,092) out of the total population between 25 and 64 years of age (237,718) are in the labor force, with 4.9% or 8,923 of them being unemployed. The group with the highest labor force participation rate are those with the educational attainment of bachelor's degree or higher, with 88.1% or 62,066 individuals in the labor force. Within the labor force, individuals with less than high school education have the highest percentage of unemployment, with 9.7% or 1,399 of them being unemployed.
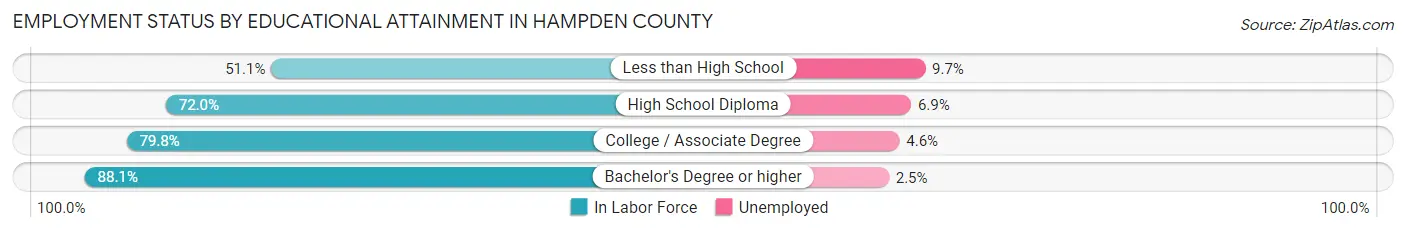
| Educational Attainment | In Labor Force | Unemployed |
| Less than High School | 14,418 (51.1%) | 2,737 (9.7%) |
| High School Diploma | 50,100 (72.0%) | 4,801 (6.9%) |
| College / Associate Degree | 55,436 (79.8%) | 3,196 (4.6%) |
| Bachelor's Degree or higher | 62,066 (88.1%) | 1,761 (2.5%) |
| Total | 182,092 (76.6%) | 11,648 (4.9%) |
Employment Occupations by Sex in Hampden County
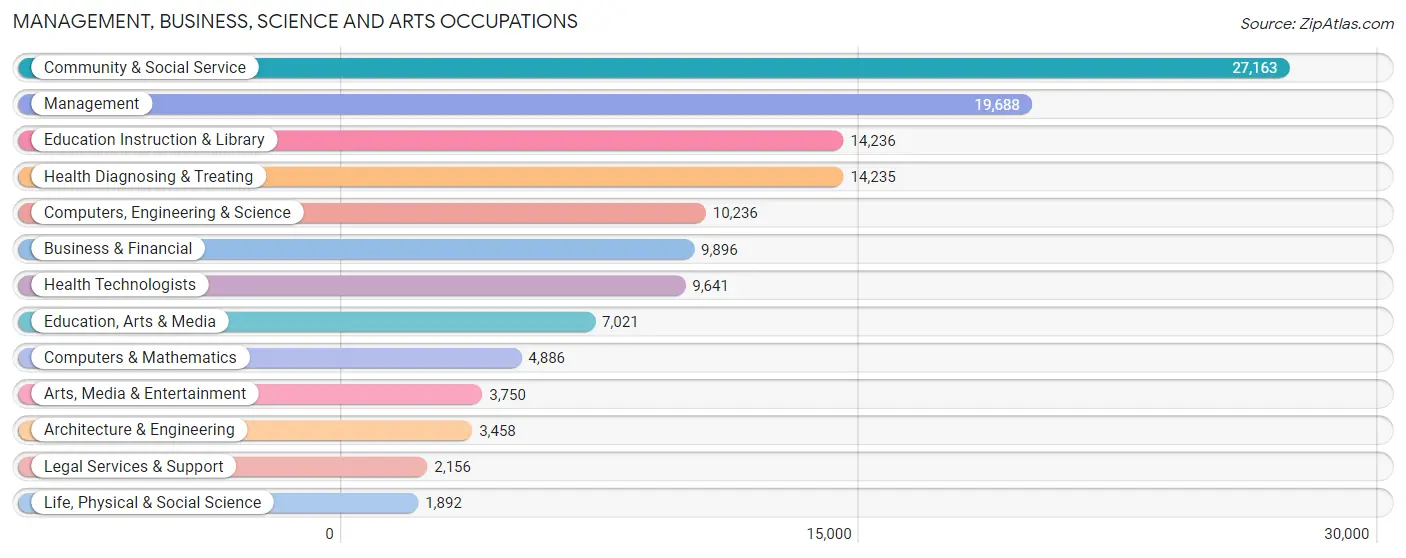
Management, Business, Science and Arts Occupations
The most common Management, Business, Science and Arts occupations in Hampden County are Community & Social Service (27,163 | 12.8%), Management (19,688 | 9.2%), Education Instruction & Library (14,236 | 6.7%), Health Diagnosing & Treating (14,235 | 6.7%), and Computers, Engineering & Science (10,236 | 4.8%).
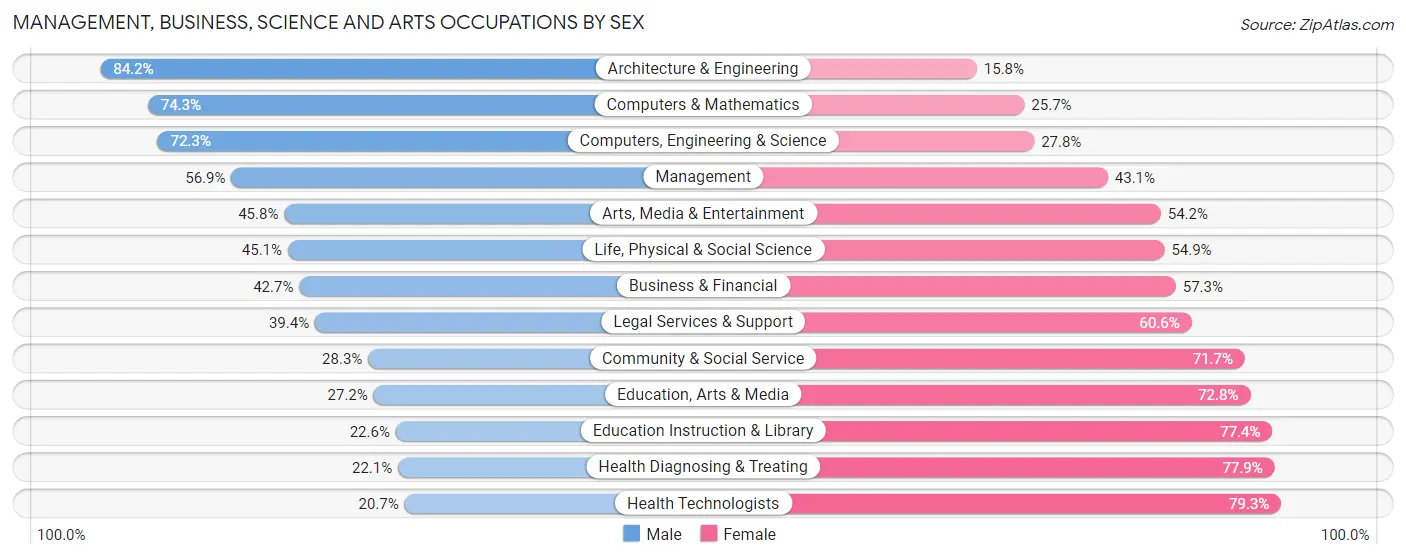
Management, Business, Science and Arts Occupations by Sex
Within the Management, Business, Science and Arts occupations in Hampden County, the most male-oriented occupations are Architecture & Engineering (84.2%), Computers & Mathematics (74.3%), and Computers, Engineering & Science (72.3%), while the most female-oriented occupations are Health Technologists (79.3%), Health Diagnosing & Treating (77.9%), and Education Instruction & Library (77.4%).
| Occupation | Male | Female |
| Management | 11,199 (56.9%) | 8,489 (43.1%) |
| Business & Financial | 4,227 (42.7%) | 5,669 (57.3%) |
| Computers, Engineering & Science | 7,395 (72.3%) | 2,841 (27.8%) |
| Computers & Mathematics | 3,630 (74.3%) | 1,256 (25.7%) |
| Architecture & Engineering | 2,912 (84.2%) | 546 (15.8%) |
| Life, Physical & Social Science | 853 (45.1%) | 1,039 (54.9%) |
| Community & Social Service | 7,694 (28.3%) | 19,469 (71.7%) |
| Education, Arts & Media | 1,910 (27.2%) | 5,111 (72.8%) |
| Legal Services & Support | 850 (39.4%) | 1,306 (60.6%) |
| Education Instruction & Library | 3,215 (22.6%) | 11,021 (77.4%) |
| Arts, Media & Entertainment | 1,719 (45.8%) | 2,031 (54.2%) |
| Health Diagnosing & Treating | 3,146 (22.1%) | 11,089 (77.9%) |
| Health Technologists | 2,000 (20.7%) | 7,641 (79.3%) |
| Total (Category) | 33,661 (41.4%) | 47,557 (58.6%) |
| Total (Overall) | 108,504 (50.9%) | 104,556 (49.1%) |
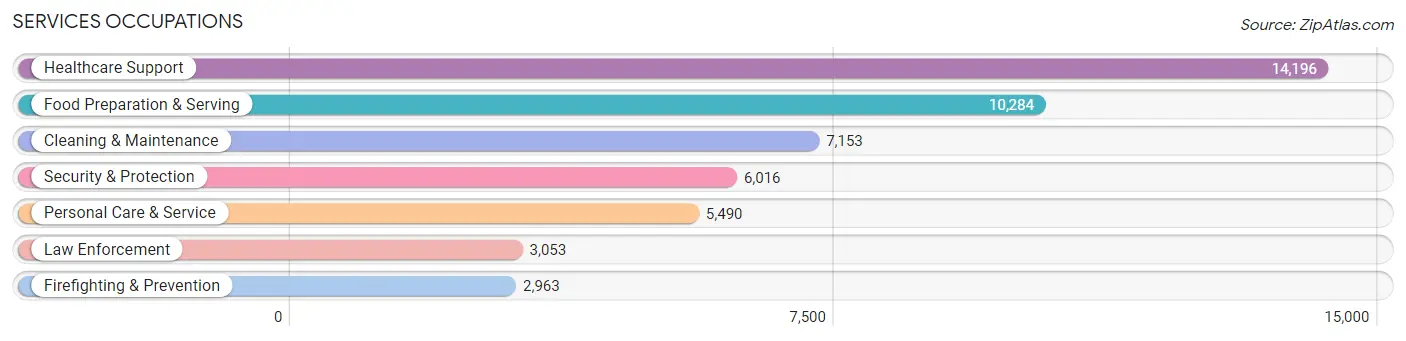
Services Occupations
The most common Services occupations in Hampden County are Healthcare Support (14,196 | 6.7%), Food Preparation & Serving (10,284 | 4.8%), Cleaning & Maintenance (7,153 | 3.4%), Security & Protection (6,016 | 2.8%), and Personal Care & Service (5,490 | 2.6%).
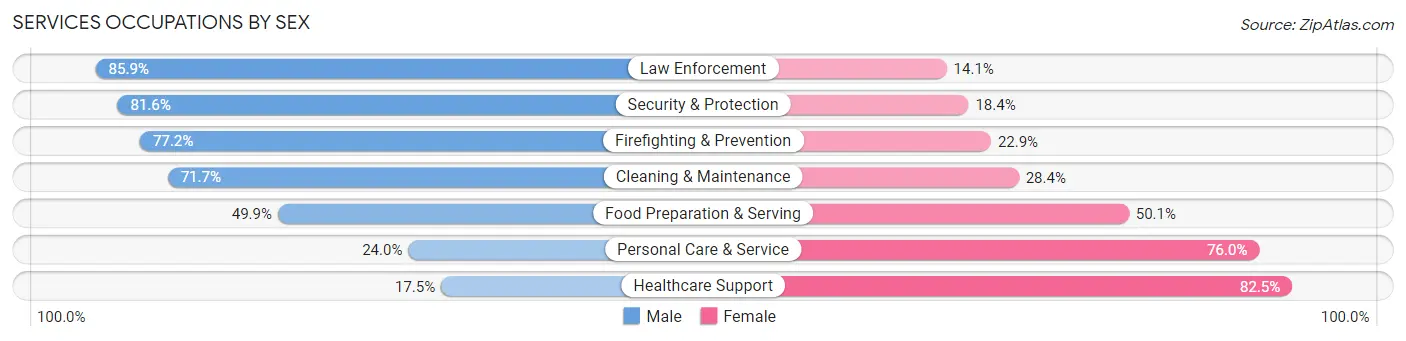
Services Occupations by Sex
Within the Services occupations in Hampden County, the most male-oriented occupations are Law Enforcement (85.9%), Security & Protection (81.6%), and Firefighting & Prevention (77.1%), while the most female-oriented occupations are Healthcare Support (82.5%), Personal Care & Service (76.0%), and Food Preparation & Serving (50.1%).
| Occupation | Male | Female |
| Healthcare Support | 2,488 (17.5%) | 11,708 (82.5%) |
| Security & Protection | 4,909 (81.6%) | 1,107 (18.4%) |
| Firefighting & Prevention | 2,286 (77.1%) | 677 (22.9%) |
| Law Enforcement | 2,623 (85.9%) | 430 (14.1%) |
| Food Preparation & Serving | 5,128 (49.9%) | 5,156 (50.1%) |
| Cleaning & Maintenance | 5,125 (71.7%) | 2,028 (28.3%) |
| Personal Care & Service | 1,319 (24.0%) | 4,171 (76.0%) |
| Total (Category) | 18,969 (44.0%) | 24,170 (56.0%) |
| Total (Overall) | 108,504 (50.9%) | 104,556 (49.1%) |
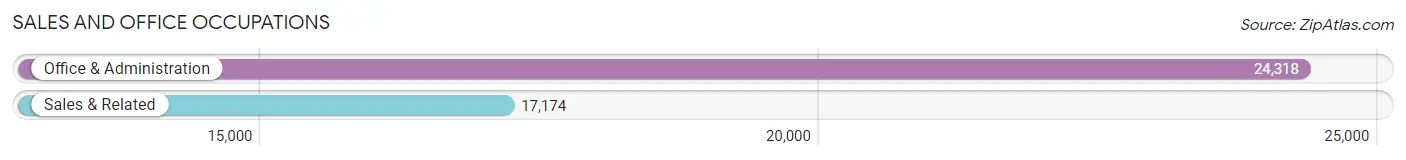
Sales and Office Occupations
The most common Sales and Office occupations in Hampden County are Office & Administration (24,318 | 11.4%), and Sales & Related (17,174 | 8.1%).
Sales and Office Occupations by Sex
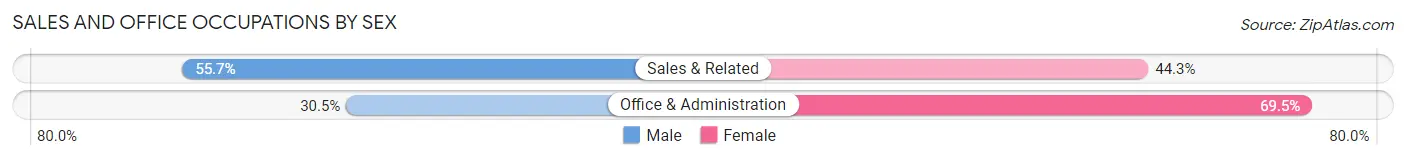
| Occupation | Male | Female |
| Sales & Related | 9,571 (55.7%) | 7,603 (44.3%) |
| Office & Administration | 7,422 (30.5%) | 16,896 (69.5%) |
| Total (Category) | 16,993 (40.9%) | 24,499 (59.1%) |
| Total (Overall) | 108,504 (50.9%) | 104,556 (49.1%) |
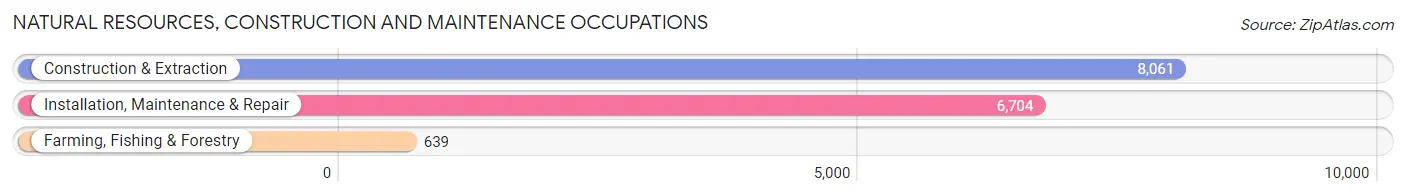
Natural Resources, Construction and Maintenance Occupations
The most common Natural Resources, Construction and Maintenance occupations in Hampden County are Construction & Extraction (8,061 | 3.8%), Installation, Maintenance & Repair (6,704 | 3.2%), and Farming, Fishing & Forestry (639 | 0.3%).
Natural Resources, Construction and Maintenance Occupations by Sex
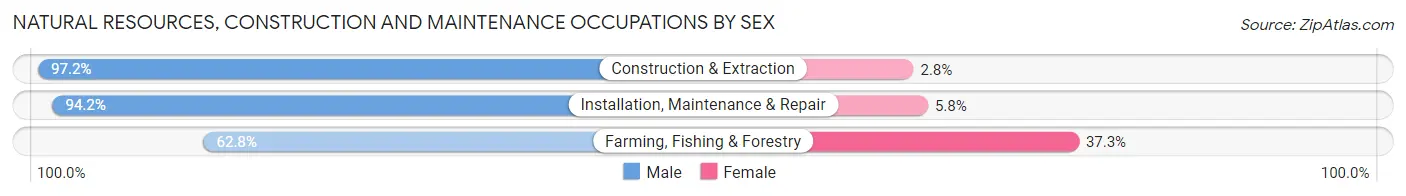
| Occupation | Male | Female |
| Farming, Fishing & Forestry | 401 (62.7%) | 238 (37.2%) |
| Construction & Extraction | 7,833 (97.2%) | 228 (2.8%) |
| Installation, Maintenance & Repair | 6,313 (94.2%) | 391 (5.8%) |
| Total (Category) | 14,547 (94.4%) | 857 (5.6%) |
| Total (Overall) | 108,504 (50.9%) | 104,556 (49.1%) |
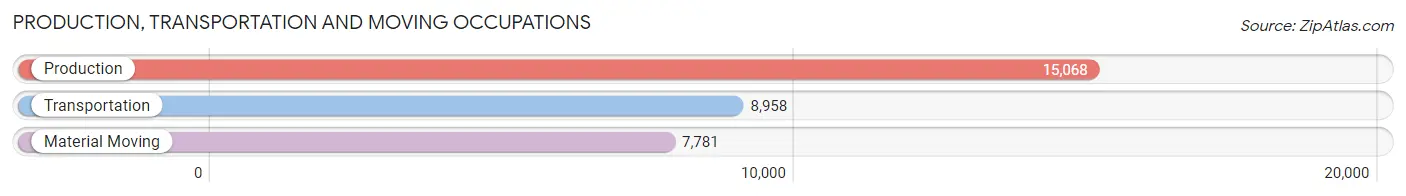
Production, Transportation and Moving Occupations
The most common Production, Transportation and Moving occupations in Hampden County are Production (15,068 | 7.1%), Transportation (8,958 | 4.2%), and Material Moving (7,781 | 3.6%).
Production, Transportation and Moving Occupations by Sex
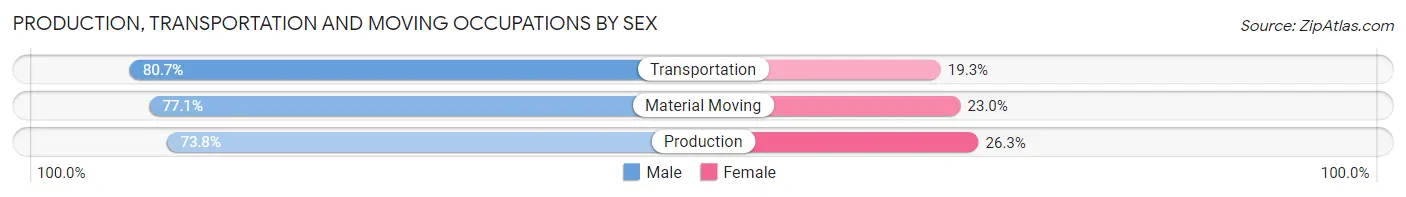
| Occupation | Male | Female |
| Production | 11,113 (73.8%) | 3,955 (26.3%) |
| Transportation | 7,226 (80.7%) | 1,732 (19.3%) |
| Material Moving | 5,995 (77.0%) | 1,786 (23.0%) |
| Total (Category) | 24,334 (76.5%) | 7,473 (23.5%) |
| Total (Overall) | 108,504 (50.9%) | 104,556 (49.1%) |
Employment Industries by Sex in Hampden County
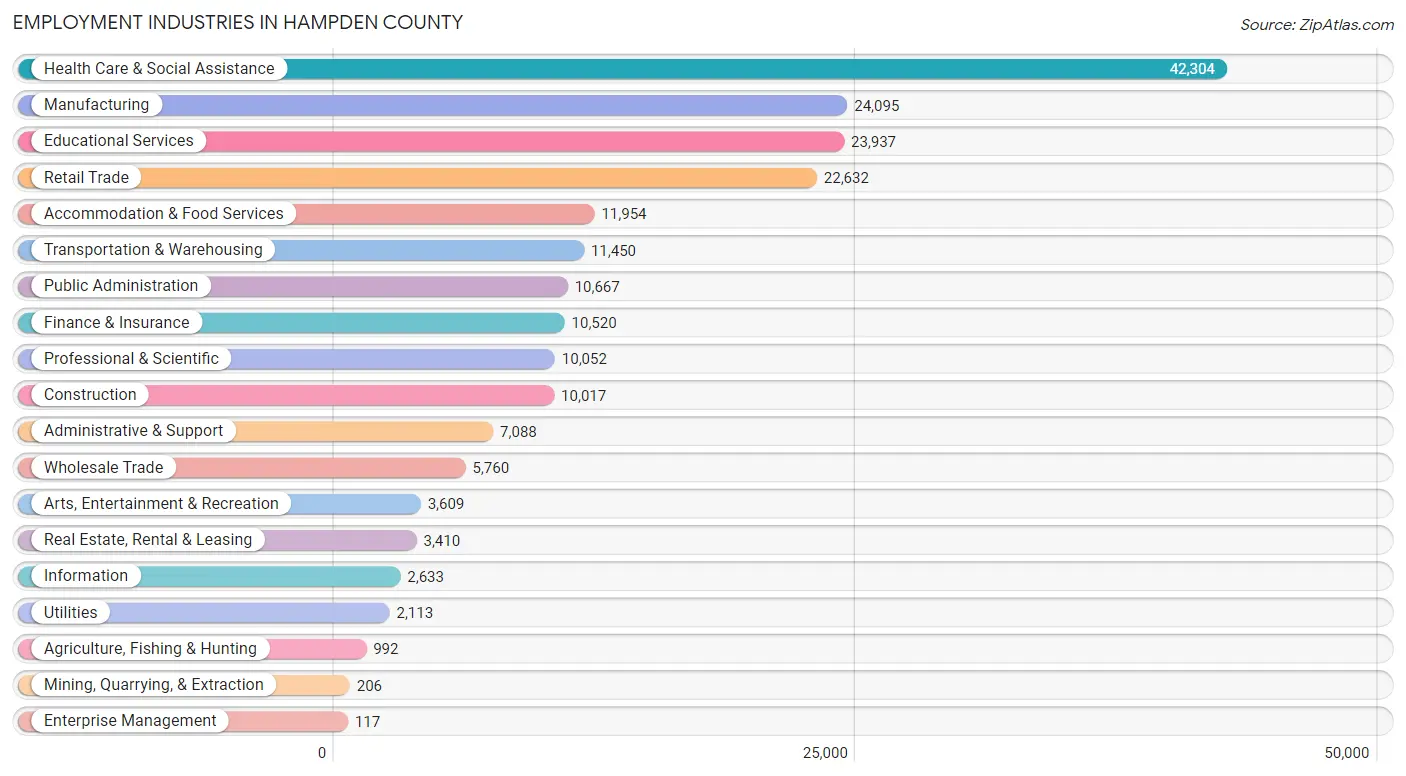
Employment Industries in Hampden County
The major employment industries in Hampden County include Health Care & Social Assistance (42,304 | 19.9%), Manufacturing (24,095 | 11.3%), Educational Services (23,937 | 11.2%), Retail Trade (22,632 | 10.6%), and Accommodation & Food Services (11,954 | 5.6%).
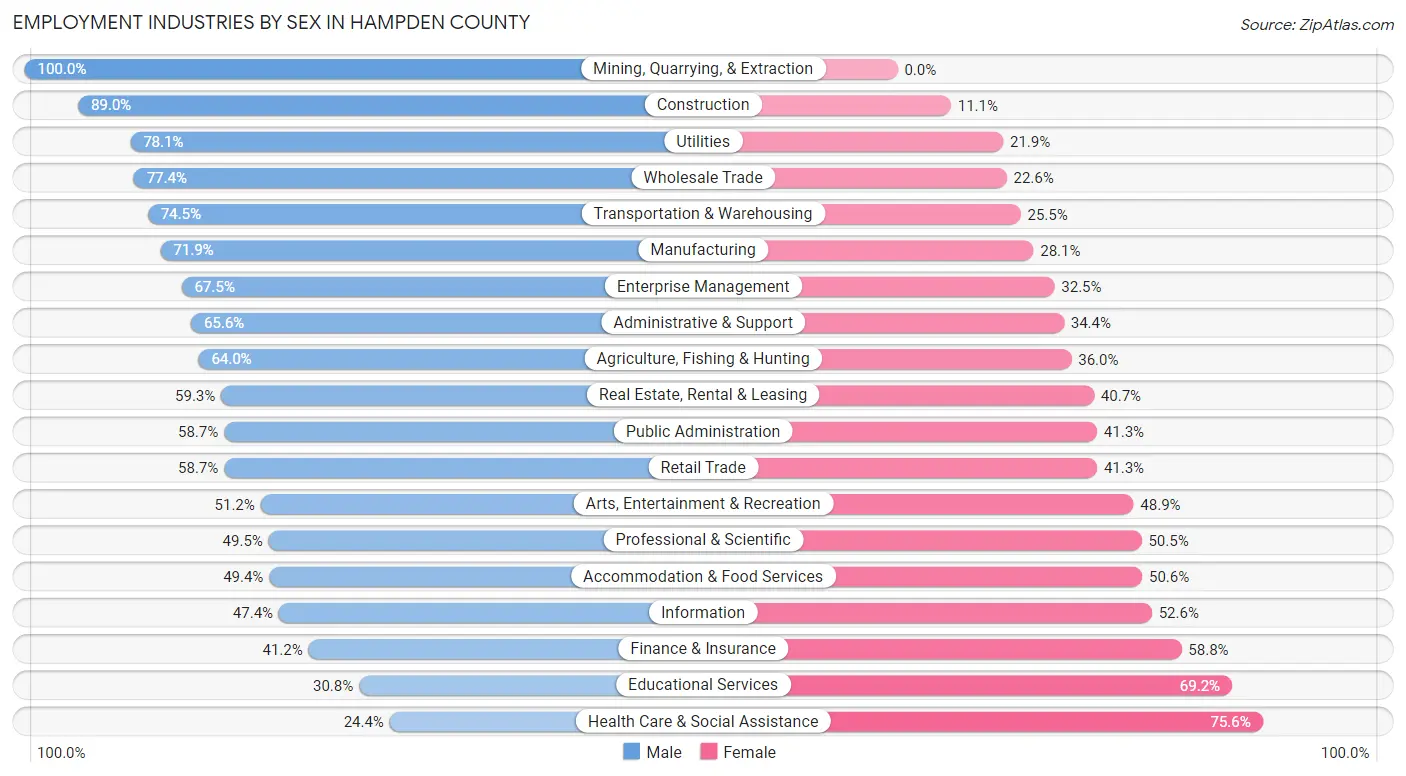
Employment Industries by Sex in Hampden County
The Hampden County industries that see more men than women are Mining, Quarrying, & Extraction (100.0%), Construction (88.9%), and Utilities (78.1%), whereas the industries that tend to have a higher number of women are Health Care & Social Assistance (75.6%), Educational Services (69.2%), and Finance & Insurance (58.8%).
| Industry | Male | Female |
| Agriculture, Fishing & Hunting | 635 (64.0%) | 357 (36.0%) |
| Mining, Quarrying, & Extraction | 206 (100.0%) | 0 (0.0%) |
| Construction | 8,910 (88.9%) | 1,107 (11.1%) |
| Manufacturing | 17,320 (71.9%) | 6,775 (28.1%) |
| Wholesale Trade | 4,459 (77.4%) | 1,301 (22.6%) |
| Retail Trade | 13,284 (58.7%) | 9,348 (41.3%) |
| Transportation & Warehousing | 8,531 (74.5%) | 2,919 (25.5%) |
| Utilities | 1,651 (78.1%) | 462 (21.9%) |
| Information | 1,247 (47.4%) | 1,386 (52.6%) |
| Finance & Insurance | 4,336 (41.2%) | 6,184 (58.8%) |
| Real Estate, Rental & Leasing | 2,023 (59.3%) | 1,387 (40.7%) |
| Professional & Scientific | 4,974 (49.5%) | 5,078 (50.5%) |
| Enterprise Management | 79 (67.5%) | 38 (32.5%) |
| Administrative & Support | 4,647 (65.6%) | 2,441 (34.4%) |
| Educational Services | 7,365 (30.8%) | 16,572 (69.2%) |
| Health Care & Social Assistance | 10,335 (24.4%) | 31,969 (75.6%) |
| Arts, Entertainment & Recreation | 1,846 (51.1%) | 1,763 (48.8%) |
| Accommodation & Food Services | 5,902 (49.4%) | 6,052 (50.6%) |
| Public Administration | 6,263 (58.7%) | 4,404 (41.3%) |
| Total | 108,504 (50.9%) | 104,556 (49.1%) |
Education in Hampden County
School Enrollment in Hampden County
The most common levels of schooling among the 111,014 students in Hampden County are high school (25,129 | 22.6%), college / undergraduate (24,679 | 22.2%), and middle school (22,815 | 20.5%).
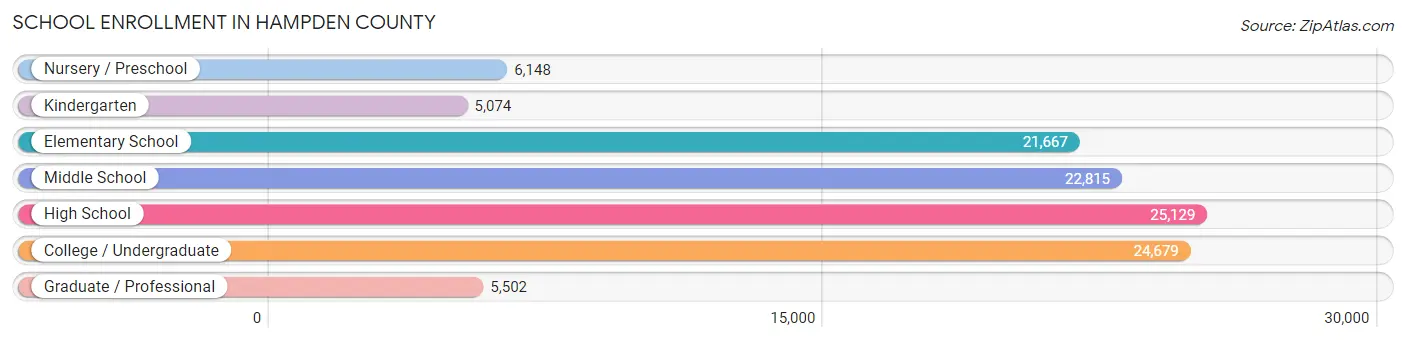
| School Level | # Students | % Students |
| Nursery / Preschool | 6,148 | 5.5% |
| Kindergarten | 5,074 | 4.6% |
| Elementary School | 21,667 | 19.5% |
| Middle School | 22,815 | 20.5% |
| High School | 25,129 | 22.6% |
| College / Undergraduate | 24,679 | 22.2% |
| Graduate / Professional | 5,502 | 5.0% |
| Total | 111,014 | 100.0% |
School Enrollment by Age by Funding Source in Hampden County
Out of a total of 111,014 students who are enrolled in schools in Hampden County, 20,094 (18.1%) attend a private institution, while the remaining 90,920 (81.9%) are enrolled in public schools. The age group of 20 to 24 year olds has the highest likelihood of being enrolled in private schools, with 5,678 (43.8% in the age bracket) enrolled. Conversely, the age group of 15 to 17 year olds has the lowest likelihood of being enrolled in a private school, with 16,489 (93.3% in the age bracket) attending a public institution.
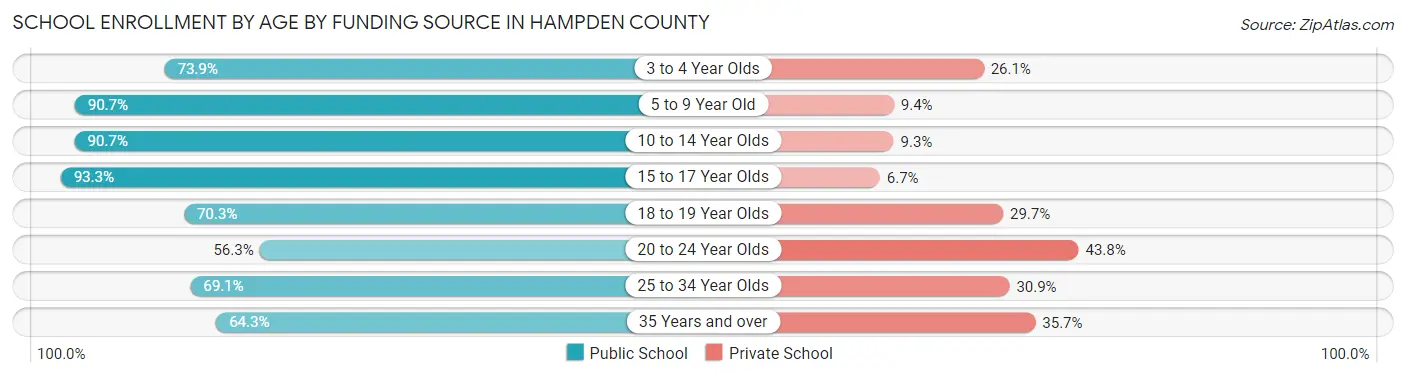
| Age Bracket | Public School | Private School |
| 3 to 4 Year Olds | 3,650 (73.9%) | 1,288 (26.1%) |
| 5 to 9 Year Old | 22,693 (90.6%) | 2,340 (9.3%) |
| 10 to 14 Year Olds | 25,682 (90.7%) | 2,633 (9.3%) |
| 15 to 17 Year Olds | 16,489 (93.3%) | 1,192 (6.7%) |
| 18 to 19 Year Olds | 7,485 (70.3%) | 3,161 (29.7%) |
| 20 to 24 Year Olds | 7,301 (56.2%) | 5,678 (43.8%) |
| 25 to 34 Year Olds | 3,980 (69.1%) | 1,778 (30.9%) |
| 35 Years and over | 3,642 (64.3%) | 2,022 (35.7%) |
| Total | 90,920 (81.9%) | 20,094 (18.1%) |
Educational Attainment by Field of Study in Hampden County
Business (18,213 | 18.6%), education (12,815 | 13.1%), science & technology (9,855 | 10.1%), arts & humanities (8,340 | 8.5%), and social sciences (7,380 | 7.5%) are the most common fields of study among 97,820 individuals in Hampden County who have obtained a bachelor's degree or higher.
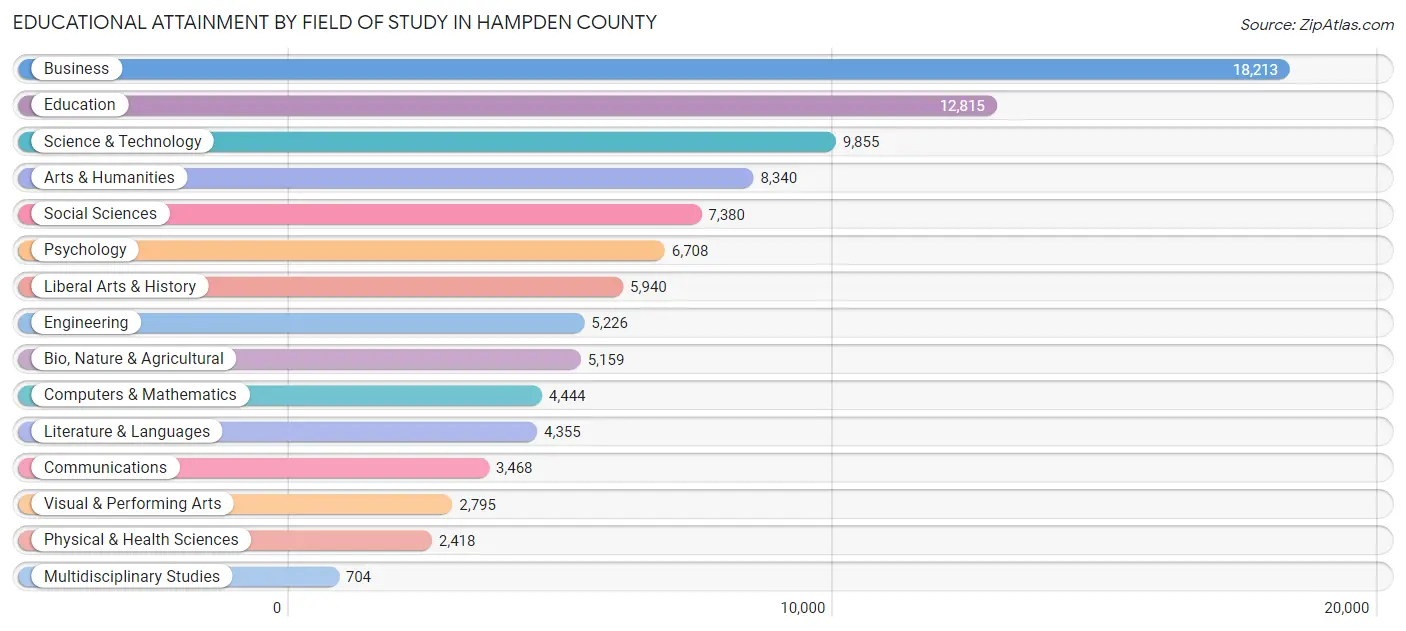
| Field of Study | # Graduates | % Graduates |
| Computers & Mathematics | 4,444 | 4.5% |
| Bio, Nature & Agricultural | 5,159 | 5.3% |
| Physical & Health Sciences | 2,418 | 2.5% |
| Psychology | 6,708 | 6.9% |
| Social Sciences | 7,380 | 7.5% |
| Engineering | 5,226 | 5.3% |
| Multidisciplinary Studies | 704 | 0.7% |
| Science & Technology | 9,855 | 10.1% |
| Business | 18,213 | 18.6% |
| Education | 12,815 | 13.1% |
| Literature & Languages | 4,355 | 4.4% |
| Liberal Arts & History | 5,940 | 6.1% |
| Visual & Performing Arts | 2,795 | 2.9% |
| Communications | 3,468 | 3.5% |
| Arts & Humanities | 8,340 | 8.5% |
| Total | 97,820 | 100.0% |
Transportation & Commute in Hampden County
Vehicle Availability by Sex in Hampden County
The most prevalent vehicle ownership categories in Hampden County are males with 2 vehicles (45,074, accounting for 42.2%) and females with 2 vehicles (41,897, making up 44.4%).
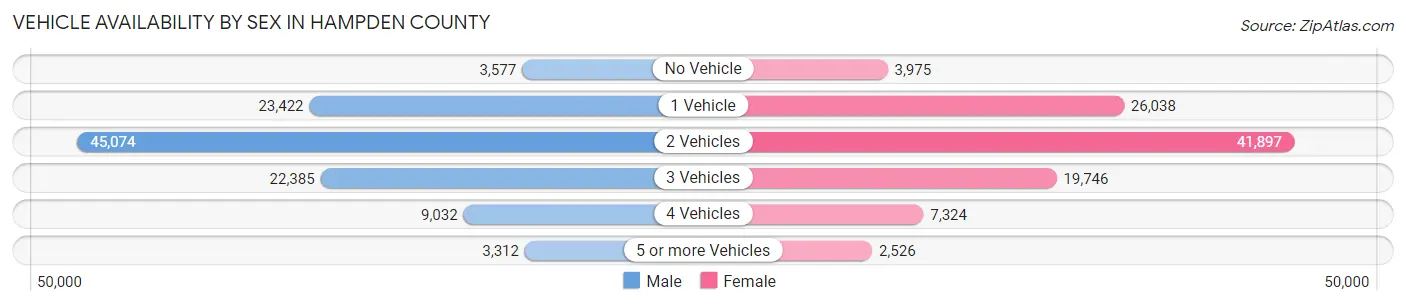
| Vehicles Available | Male | Female |
| No Vehicle | 3,577 (3.4%) | 3,975 (3.9%) |
| 1 Vehicle | 23,422 (21.9%) | 26,038 (25.7%) |
| 2 Vehicles | 45,074 (42.2%) | 41,897 (41.3%) |
| 3 Vehicles | 22,385 (21.0%) | 19,746 (19.5%) |
| 4 Vehicles | 9,032 (8.5%) | 7,324 (7.2%) |
| 5 or more Vehicles | 3,312 (3.1%) | 2,526 (2.5%) |
| Total | 106,802 (100.0%) | 101,506 (100.0%) |
Commute Time in Hampden County
The most frequently occuring commute durations in Hampden County are 15 to 19 minutes (35,174 commuters, 18.3%), 20 to 24 minutes (32,865 commuters, 17.1%), and 10 to 14 minutes (30,692 commuters, 16.0%).
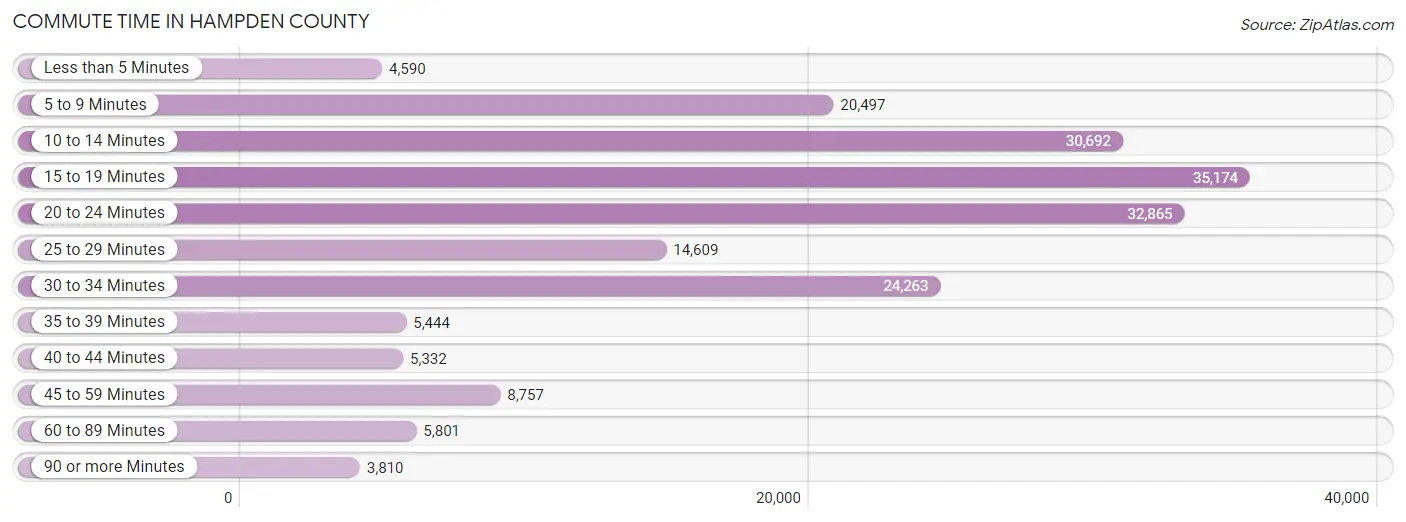
| Commute Time | # Commuters | % Commuters |
| Less than 5 Minutes | 4,590 | 2.4% |
| 5 to 9 Minutes | 20,497 | 10.7% |
| 10 to 14 Minutes | 30,692 | 16.0% |
| 15 to 19 Minutes | 35,174 | 18.3% |
| 20 to 24 Minutes | 32,865 | 17.1% |
| 25 to 29 Minutes | 14,609 | 7.6% |
| 30 to 34 Minutes | 24,263 | 12.7% |
| 35 to 39 Minutes | 5,444 | 2.8% |
| 40 to 44 Minutes | 5,332 | 2.8% |
| 45 to 59 Minutes | 8,757 | 4.6% |
| 60 to 89 Minutes | 5,801 | 3.0% |
| 90 or more Minutes | 3,810 | 2.0% |
Commute Time by Sex in Hampden County
The most common commute times in Hampden County are 15 to 19 minutes (17,087 commuters, 17.2%) for males and 15 to 19 minutes (18,087 commuters, 19.5%) for females.
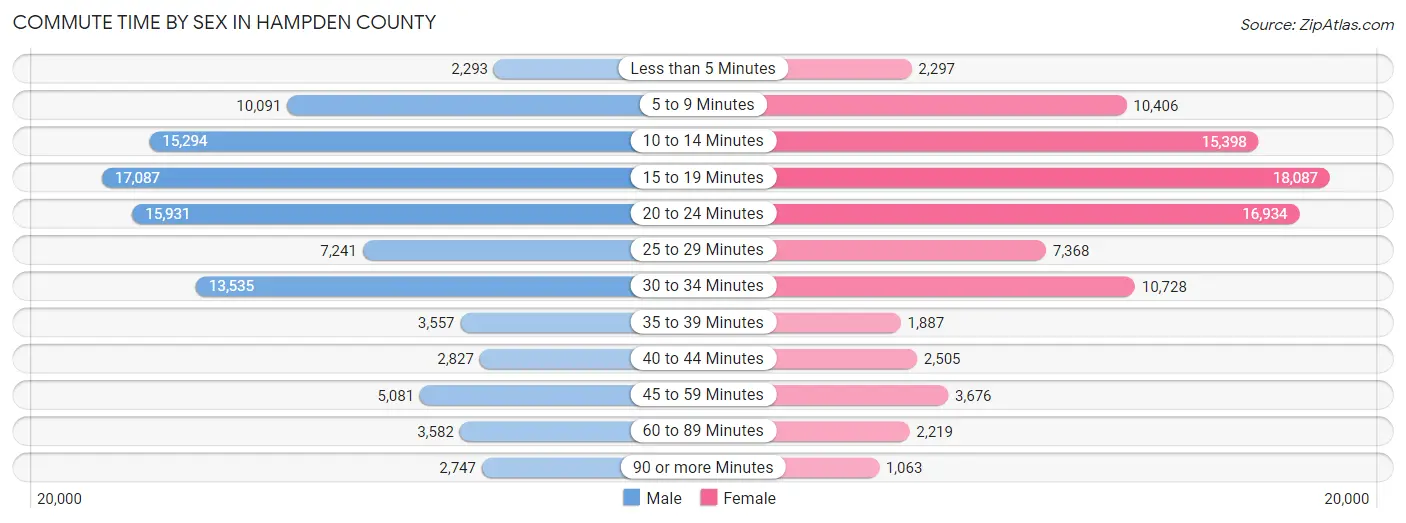
| Commute Time | Male | Female |
| Less than 5 Minutes | 2,293 (2.3%) | 2,297 (2.5%) |
| 5 to 9 Minutes | 10,091 (10.2%) | 10,406 (11.2%) |
| 10 to 14 Minutes | 15,294 (15.4%) | 15,398 (16.6%) |
| 15 to 19 Minutes | 17,087 (17.2%) | 18,087 (19.5%) |
| 20 to 24 Minutes | 15,931 (16.1%) | 16,934 (18.3%) |
| 25 to 29 Minutes | 7,241 (7.3%) | 7,368 (8.0%) |
| 30 to 34 Minutes | 13,535 (13.6%) | 10,728 (11.6%) |
| 35 to 39 Minutes | 3,557 (3.6%) | 1,887 (2.0%) |
| 40 to 44 Minutes | 2,827 (2.9%) | 2,505 (2.7%) |
| 45 to 59 Minutes | 5,081 (5.1%) | 3,676 (4.0%) |
| 60 to 89 Minutes | 3,582 (3.6%) | 2,219 (2.4%) |
| 90 or more Minutes | 2,747 (2.8%) | 1,063 (1.1%) |
Time of Departure to Work by Sex in Hampden County
The most frequent times of departure to work in Hampden County are 7:00 AM to 7:29 AM (13,177, 13.3%) for males and 7:30 AM to 7:59 AM (14,787, 16.0%) for females.
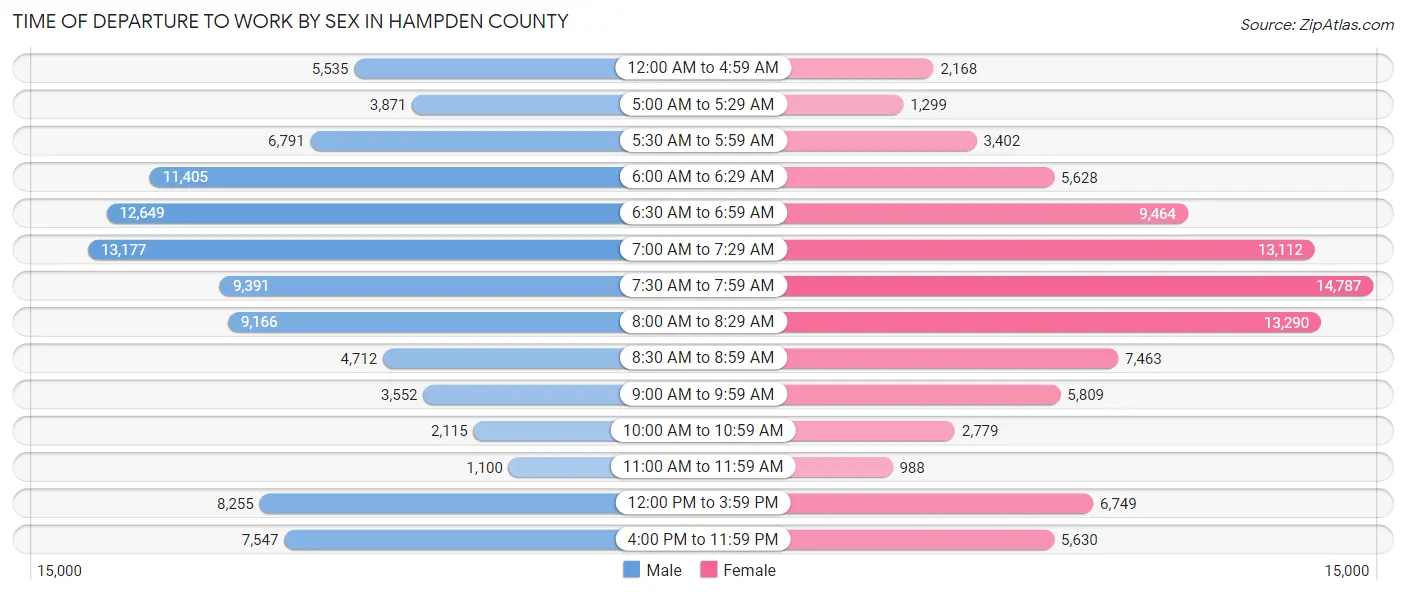
| Time of Departure | Male | Female |
| 12:00 AM to 4:59 AM | 5,535 (5.6%) | 2,168 (2.3%) |
| 5:00 AM to 5:29 AM | 3,871 (3.9%) | 1,299 (1.4%) |
| 5:30 AM to 5:59 AM | 6,791 (6.8%) | 3,402 (3.7%) |
| 6:00 AM to 6:29 AM | 11,405 (11.5%) | 5,628 (6.1%) |
| 6:30 AM to 6:59 AM | 12,649 (12.7%) | 9,464 (10.2%) |
| 7:00 AM to 7:29 AM | 13,177 (13.3%) | 13,112 (14.2%) |
| 7:30 AM to 7:59 AM | 9,391 (9.5%) | 14,787 (16.0%) |
| 8:00 AM to 8:29 AM | 9,166 (9.2%) | 13,290 (14.4%) |
| 8:30 AM to 8:59 AM | 4,712 (4.8%) | 7,463 (8.1%) |
| 9:00 AM to 9:59 AM | 3,552 (3.6%) | 5,809 (6.3%) |
| 10:00 AM to 10:59 AM | 2,115 (2.1%) | 2,779 (3.0%) |
| 11:00 AM to 11:59 AM | 1,100 (1.1%) | 988 (1.1%) |
| 12:00 PM to 3:59 PM | 8,255 (8.3%) | 6,749 (7.3%) |
| 4:00 PM to 11:59 PM | 7,547 (7.6%) | 5,630 (6.1%) |
| Total | 99,266 (100.0%) | 92,568 (100.0%) |
Housing Occupancy in Hampden County
Occupancy by Ownership in Hampden County
Of the total 183,380 dwellings in Hampden County, owner-occupied units account for 113,182 (61.7%), while renter-occupied units make up 70,198 (38.3%).
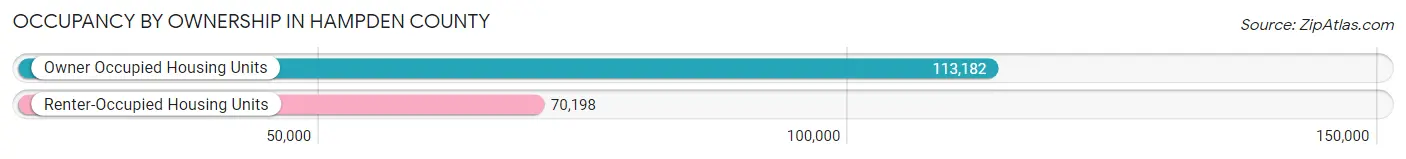
| Occupancy | # Housing Units | % Housing Units |
| Owner Occupied Housing Units | 113,182 | 61.7% |
| Renter-Occupied Housing Units | 70,198 | 38.3% |
| Total Occupied Housing Units | 183,380 | 100.0% |
Occupancy by Household Size in Hampden County
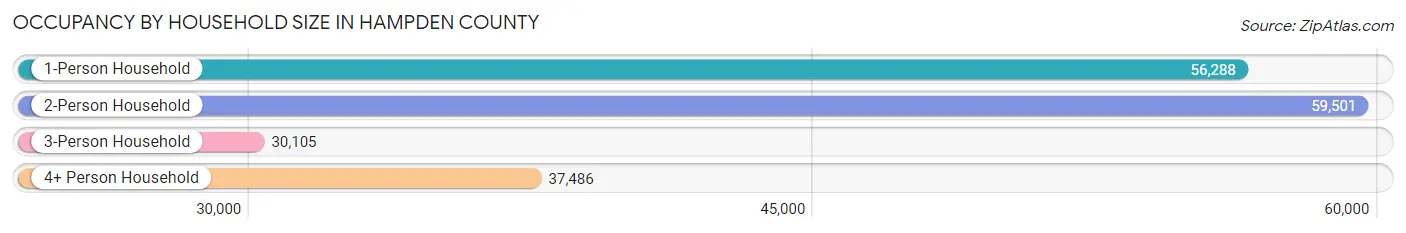
| Household Size | # Housing Units | % Housing Units |
| 1-Person Household | 56,288 | 30.7% |
| 2-Person Household | 59,501 | 32.5% |
| 3-Person Household | 30,105 | 16.4% |
| 4+ Person Household | 37,486 | 20.4% |
| Total Housing Units | 183,380 | 100.0% |
Occupancy by Ownership by Household Size in Hampden County
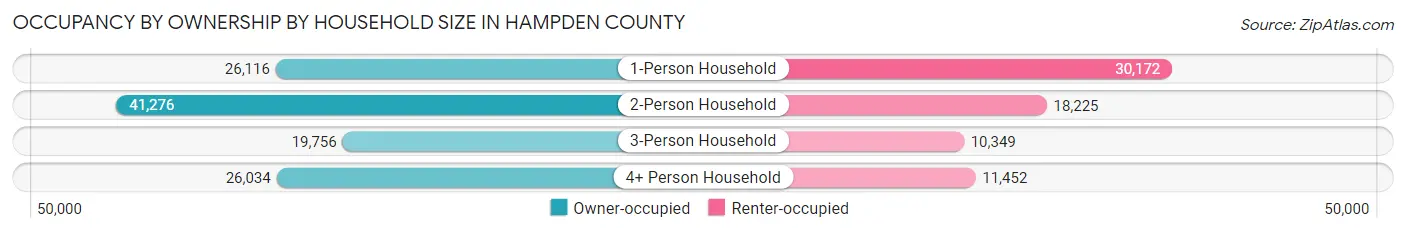
| Household Size | Owner-occupied | Renter-occupied |
| 1-Person Household | 26,116 (46.4%) | 30,172 (53.6%) |
| 2-Person Household | 41,276 (69.4%) | 18,225 (30.6%) |
| 3-Person Household | 19,756 (65.6%) | 10,349 (34.4%) |
| 4+ Person Household | 26,034 (69.5%) | 11,452 (30.5%) |
| Total Housing Units | 113,182 (61.7%) | 70,198 (38.3%) |
Occupancy by Educational Attainment in Hampden County
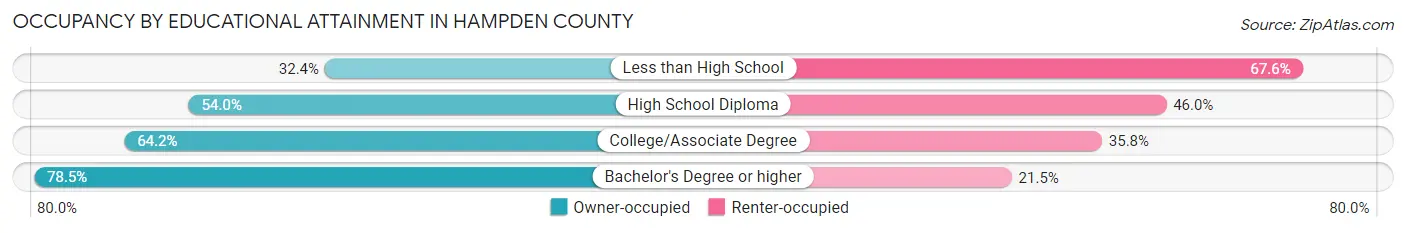
| Household Size | Owner-occupied | Renter-occupied |
| Less than High School | 7,226 (32.4%) | 15,099 (67.6%) |
| High School Diploma | 27,801 (54.0%) | 23,680 (46.0%) |
| College/Associate Degree | 35,295 (64.2%) | 19,684 (35.8%) |
| Bachelor's Degree or higher | 42,860 (78.5%) | 11,735 (21.5%) |
Occupancy by Age of Householder in Hampden County
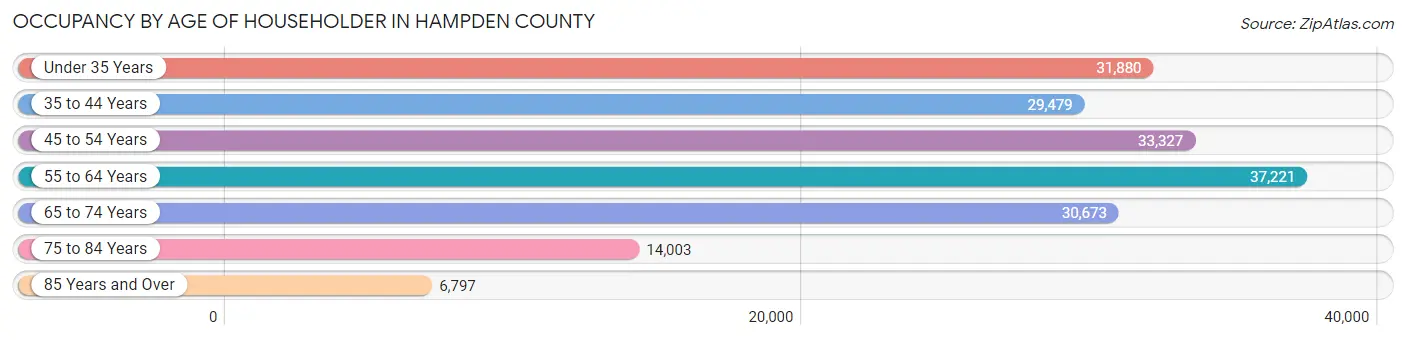
| Age Bracket | # Households | % Households |
| Under 35 Years | 31,880 | 17.4% |
| 35 to 44 Years | 29,479 | 16.1% |
| 45 to 54 Years | 33,327 | 18.2% |
| 55 to 64 Years | 37,221 | 20.3% |
| 65 to 74 Years | 30,673 | 16.7% |
| 75 to 84 Years | 14,003 | 7.6% |
| 85 Years and Over | 6,797 | 3.7% |
| Total | 183,380 | 100.0% |
Housing Finances in Hampden County
Median Income by Occupancy in Hampden County
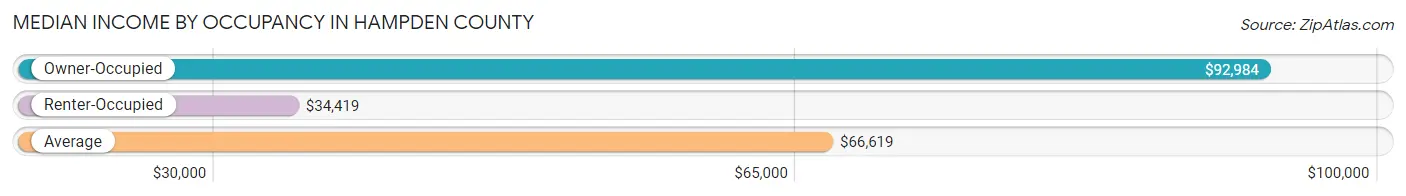
| Occupancy Type | # Households | Median Income |
| Owner-Occupied | 113,182 (61.7%) | $92,984 |
| Renter-Occupied | 70,198 (38.3%) | $34,419 |
| Average | 183,380 (100.0%) | $66,619 |
Occupancy by Householder Income Bracket in Hampden County
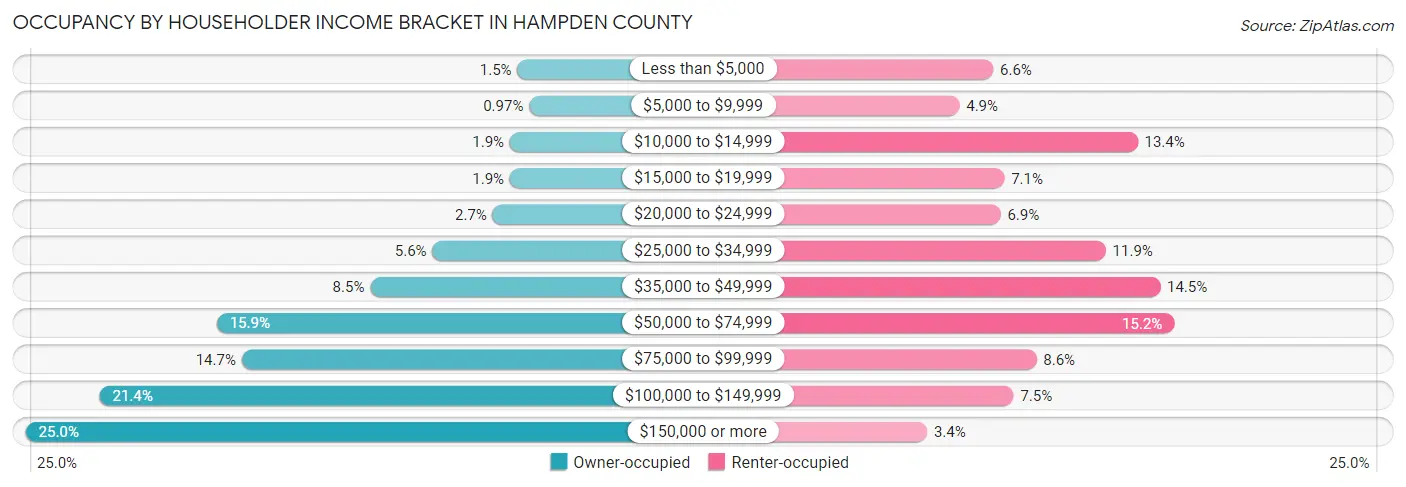
| Income Bracket | Owner-occupied | Renter-occupied |
| Less than $5,000 | 1,732 (1.5%) | 4,595 (6.6%) |
| $5,000 to $9,999 | 1,101 (1.0%) | 3,469 (4.9%) |
| $10,000 to $14,999 | 2,138 (1.9%) | 9,425 (13.4%) |
| $15,000 to $19,999 | 2,140 (1.9%) | 4,968 (7.1%) |
| $20,000 to $24,999 | 3,072 (2.7%) | 4,844 (6.9%) |
| $25,000 to $34,999 | 6,313 (5.6%) | 8,358 (11.9%) |
| $35,000 to $49,999 | 9,663 (8.5%) | 10,180 (14.5%) |
| $50,000 to $74,999 | 17,934 (15.9%) | 10,651 (15.2%) |
| $75,000 to $99,999 | 16,588 (14.7%) | 6,043 (8.6%) |
| $100,000 to $149,999 | 24,257 (21.4%) | 5,276 (7.5%) |
| $150,000 or more | 28,244 (24.9%) | 2,389 (3.4%) |
| Total | 113,182 (100.0%) | 70,198 (100.0%) |
Monthly Housing Cost Tiers in Hampden County
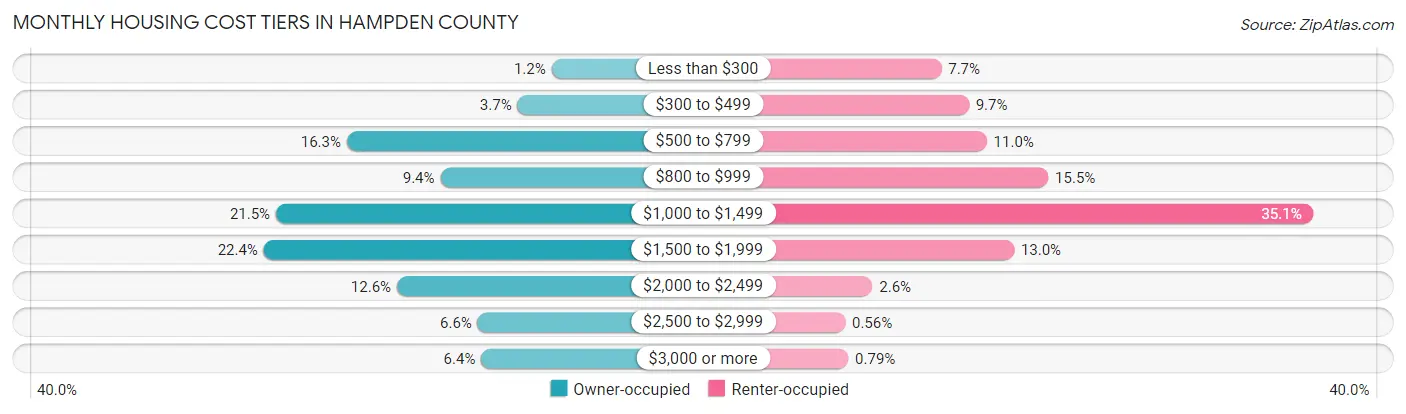
| Monthly Cost | Owner-occupied | Renter-occupied |
| Less than $300 | 1,342 (1.2%) | 5,369 (7.6%) |
| $300 to $499 | 4,188 (3.7%) | 6,788 (9.7%) |
| $500 to $799 | 18,412 (16.3%) | 7,713 (11.0%) |
| $800 to $999 | 10,619 (9.4%) | 10,892 (15.5%) |
| $1,000 to $1,499 | 24,323 (21.5%) | 24,609 (35.1%) |
| $1,500 to $1,999 | 25,336 (22.4%) | 9,126 (13.0%) |
| $2,000 to $2,499 | 14,240 (12.6%) | 1,803 (2.6%) |
| $2,500 to $2,999 | 7,509 (6.6%) | 391 (0.6%) |
| $3,000 or more | 7,213 (6.4%) | 557 (0.8%) |
| Total | 113,182 (100.0%) | 70,198 (100.0%) |
Physical Housing Characteristics in Hampden County
Housing Structures in Hampden County
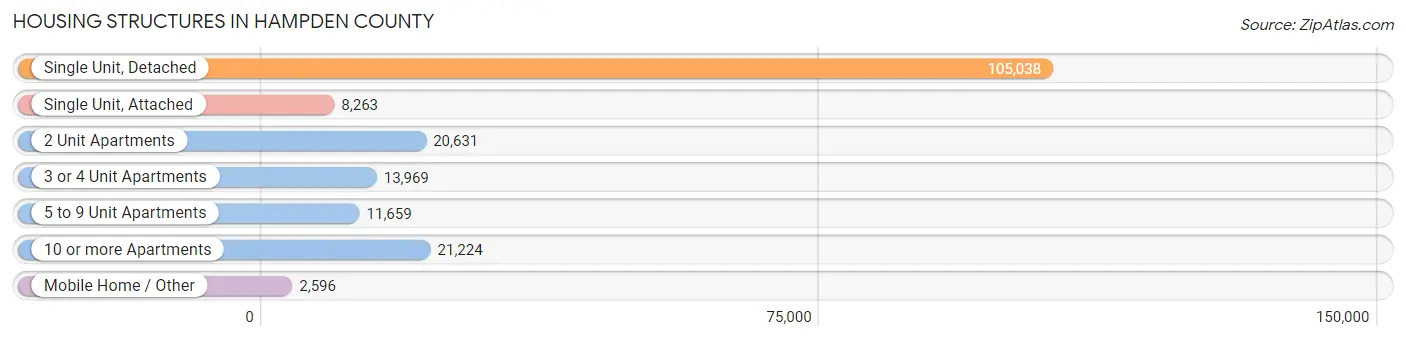
| Structure Type | # Housing Units | % Housing Units |
| Single Unit, Detached | 105,038 | 57.3% |
| Single Unit, Attached | 8,263 | 4.5% |
| 2 Unit Apartments | 20,631 | 11.3% |
| 3 or 4 Unit Apartments | 13,969 | 7.6% |
| 5 to 9 Unit Apartments | 11,659 | 6.4% |
| 10 or more Apartments | 21,224 | 11.6% |
| Mobile Home / Other | 2,596 | 1.4% |
| Total | 183,380 | 100.0% |
Housing Structures by Occupancy in Hampden County
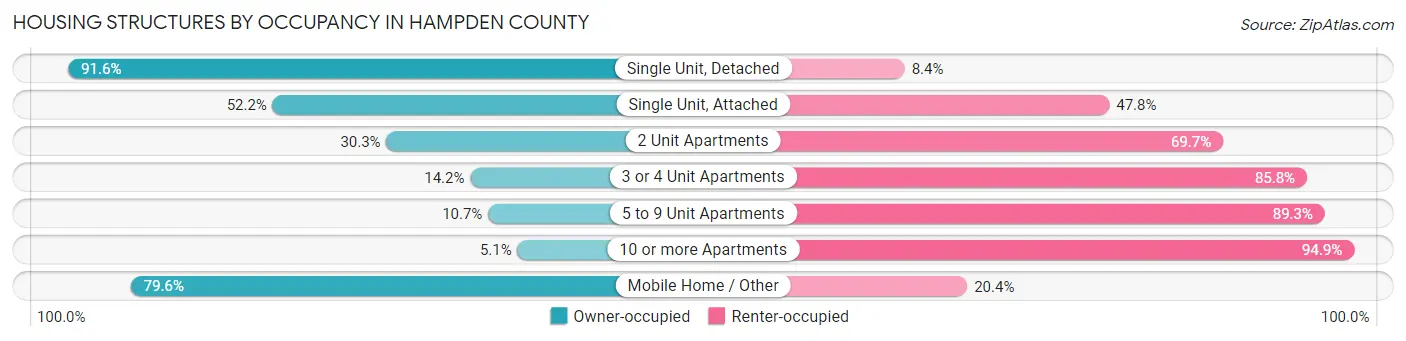
| Structure Type | Owner-occupied | Renter-occupied |
| Single Unit, Detached | 96,229 (91.6%) | 8,809 (8.4%) |
| Single Unit, Attached | 4,316 (52.2%) | 3,947 (47.8%) |
| 2 Unit Apartments | 6,258 (30.3%) | 14,373 (69.7%) |
| 3 or 4 Unit Apartments | 1,981 (14.2%) | 11,988 (85.8%) |
| 5 to 9 Unit Apartments | 1,252 (10.7%) | 10,407 (89.3%) |
| 10 or more Apartments | 1,080 (5.1%) | 20,144 (94.9%) |
| Mobile Home / Other | 2,066 (79.6%) | 530 (20.4%) |
| Total | 113,182 (61.7%) | 70,198 (38.3%) |
Housing Structures by Number of Rooms in Hampden County
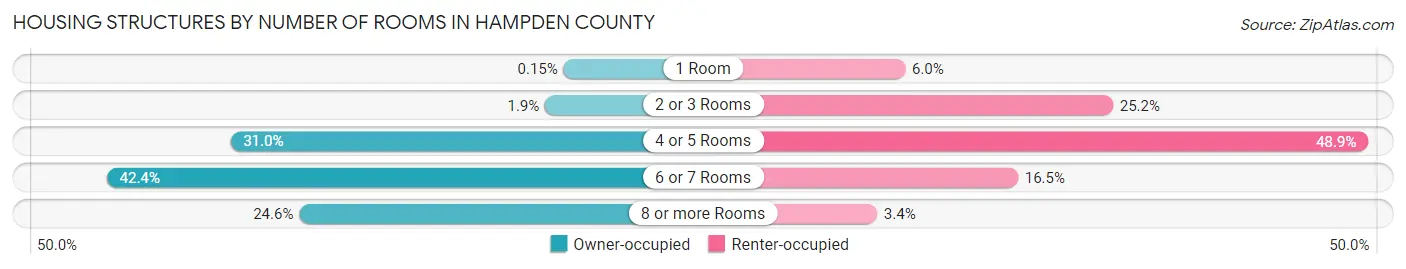
| Number of Rooms | Owner-occupied | Renter-occupied |
| 1 Room | 168 (0.2%) | 4,229 (6.0%) |
| 2 or 3 Rooms | 2,103 (1.9%) | 17,720 (25.2%) |
| 4 or 5 Rooms | 35,066 (31.0%) | 34,301 (48.9%) |
| 6 or 7 Rooms | 48,003 (42.4%) | 11,546 (16.5%) |
| 8 or more Rooms | 27,842 (24.6%) | 2,402 (3.4%) |
| Total | 113,182 (100.0%) | 70,198 (100.0%) |
Housing Structure by Heating Type in Hampden County
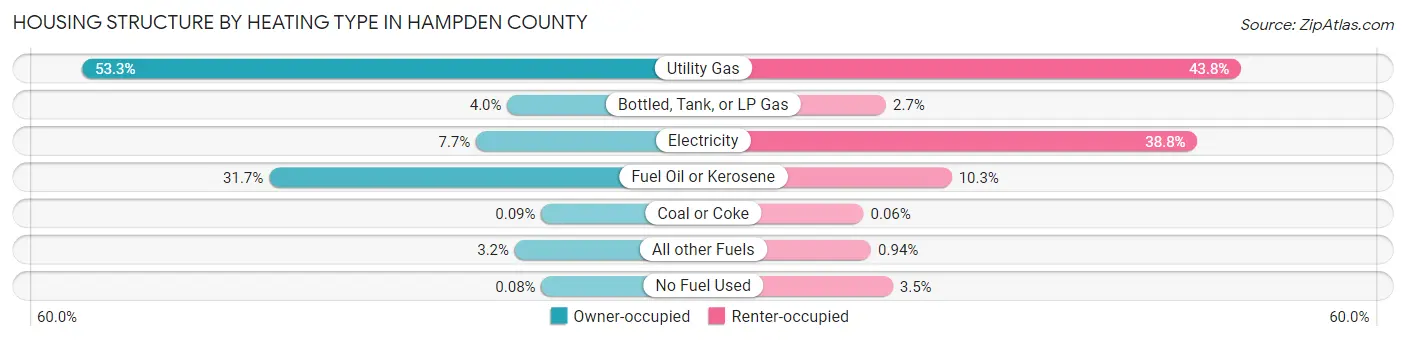
| Heating Type | Owner-occupied | Renter-occupied |
| Utility Gas | 60,371 (53.3%) | 30,772 (43.8%) |
| Bottled, Tank, or LP Gas | 4,557 (4.0%) | 1,874 (2.7%) |
| Electricity | 8,663 (7.6%) | 27,207 (38.8%) |
| Fuel Oil or Kerosene | 35,819 (31.7%) | 7,217 (10.3%) |
| Coal or Coke | 98 (0.1%) | 43 (0.1%) |
| All other Fuels | 3,581 (3.2%) | 659 (0.9%) |
| No Fuel Used | 93 (0.1%) | 2,426 (3.5%) |
| Total | 113,182 (100.0%) | 70,198 (100.0%) |
Household Vehicle Usage in Hampden County
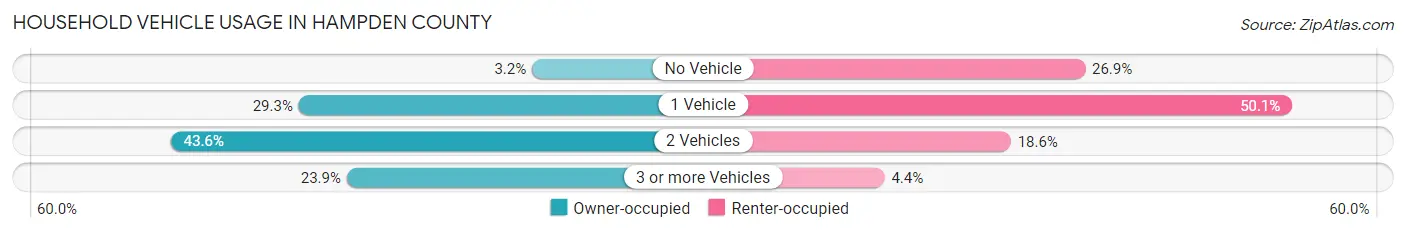
| Vehicles per Household | Owner-occupied | Renter-occupied |
| No Vehicle | 3,579 (3.2%) | 18,883 (26.9%) |
| 1 Vehicle | 33,148 (29.3%) | 35,166 (50.1%) |
| 2 Vehicles | 49,389 (43.6%) | 13,037 (18.6%) |
| 3 or more Vehicles | 27,066 (23.9%) | 3,112 (4.4%) |
| Total | 113,182 (100.0%) | 70,198 (100.0%) |
Real Estate & Mortgages in Hampden County
Real Estate and Mortgage Overview in Hampden County
| Characteristic | Without Mortgage | With Mortgage |
| Housing Units | 39,420 | 73,762 |
| Median Property Value | $250,000 | $262,100 |
| Median Household Income | $70,677 | $21,204 |
| Monthly Housing Costs | $765 | $7,162 |
| Real Estate Taxes | $4,157 | $1,472 |
Property Value by Mortgage Status in Hampden County
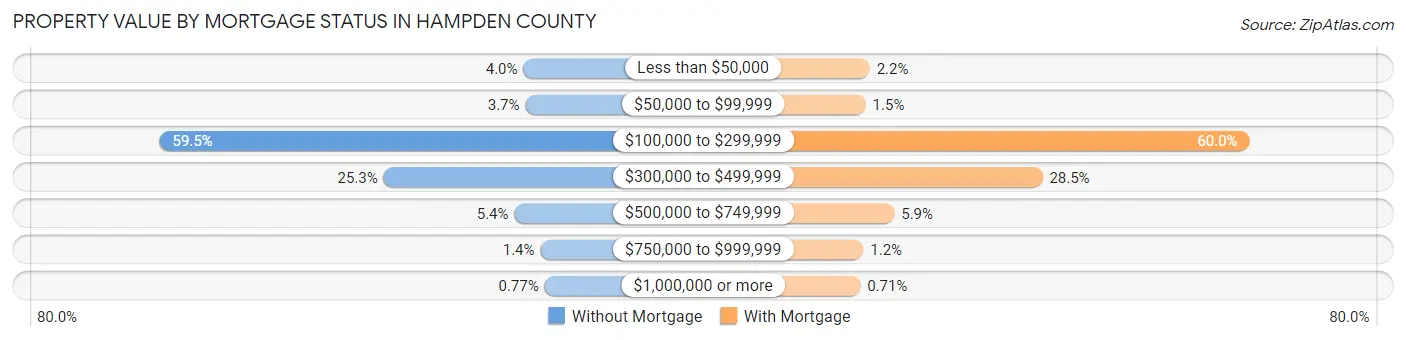
| Property Value | Without Mortgage | With Mortgage |
| Less than $50,000 | 1,577 (4.0%) | 1,591 (2.2%) |
| $50,000 to $99,999 | 1,455 (3.7%) | 1,133 (1.5%) |
| $100,000 to $299,999 | 23,437 (59.5%) | 44,274 (60.0%) |
| $300,000 to $499,999 | 9,975 (25.3%) | 21,010 (28.5%) |
| $500,000 to $749,999 | 2,118 (5.4%) | 4,350 (5.9%) |
| $750,000 to $999,999 | 555 (1.4%) | 877 (1.2%) |
| $1,000,000 or more | 303 (0.8%) | 527 (0.7%) |
| Total | 39,420 (100.0%) | 73,762 (100.0%) |
Household Income by Mortgage Status in Hampden County
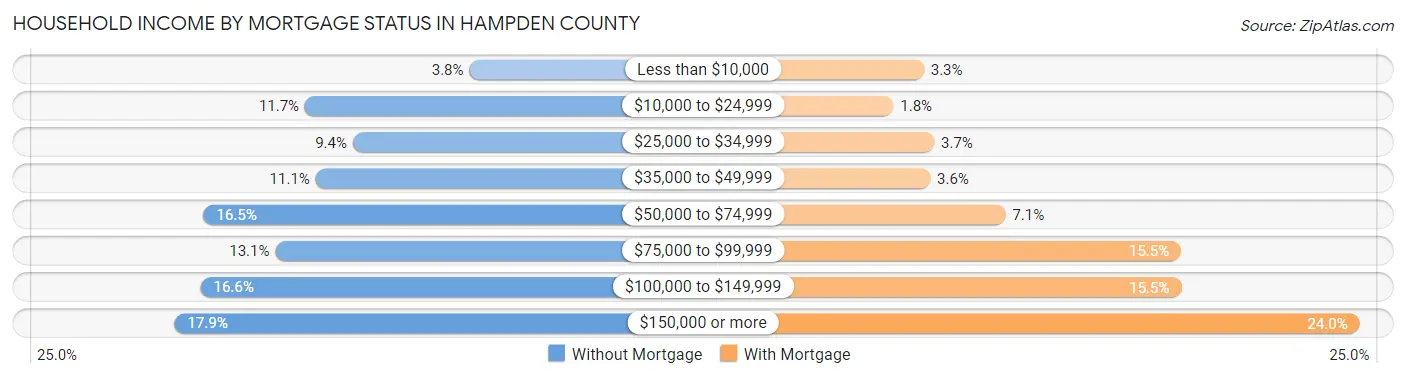
| Household Income | Without Mortgage | With Mortgage |
| Less than $10,000 | 1,504 (3.8%) | 2,394 (3.3%) |
| $10,000 to $24,999 | 4,592 (11.7%) | 1,329 (1.8%) |
| $25,000 to $34,999 | 3,692 (9.4%) | 2,758 (3.7%) |
| $35,000 to $49,999 | 4,393 (11.1%) | 2,621 (3.5%) |
| $50,000 to $74,999 | 6,498 (16.5%) | 5,270 (7.1%) |
| $75,000 to $99,999 | 5,149 (13.1%) | 11,436 (15.5%) |
| $100,000 to $149,999 | 6,552 (16.6%) | 11,439 (15.5%) |
| $150,000 or more | 7,040 (17.9%) | 17,705 (24.0%) |
| Total | 39,420 (100.0%) | 73,762 (100.0%) |
Property Value to Household Income Ratio in Hampden County
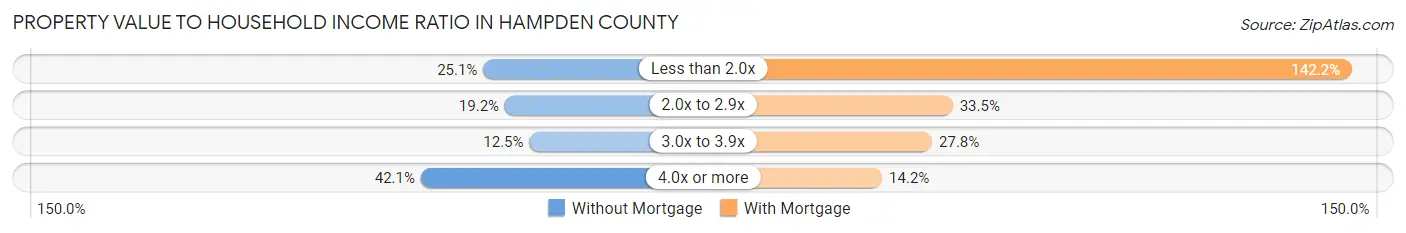
| Value-to-Income Ratio | Without Mortgage | With Mortgage |
| Less than 2.0x | 9,881 (25.1%) | 104,910 (142.2%) |
| 2.0x to 2.9x | 7,549 (19.2%) | 24,682 (33.5%) |
| 3.0x to 3.9x | 4,922 (12.5%) | 20,532 (27.8%) |
| 4.0x or more | 16,589 (42.1%) | 10,499 (14.2%) |
| Total | 39,420 (100.0%) | 73,762 (100.0%) |
Real Estate Taxes by Mortgage Status in Hampden County
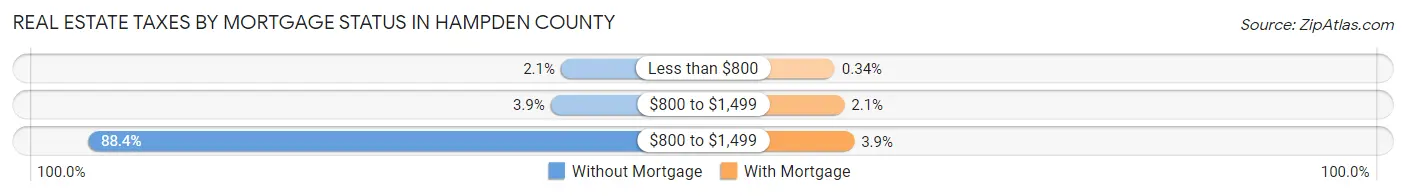
| Property Taxes | Without Mortgage | With Mortgage |
| Less than $800 | 817 (2.1%) | 253 (0.3%) |
| $800 to $1,499 | 1,555 (3.9%) | 1,524 (2.1%) |
| $800 to $1,499 | 34,846 (88.4%) | 2,845 (3.9%) |
| Total | 39,420 (100.0%) | 73,762 (100.0%) |
Health & Disability in Hampden County
Health Insurance Coverage by Age in Hampden County
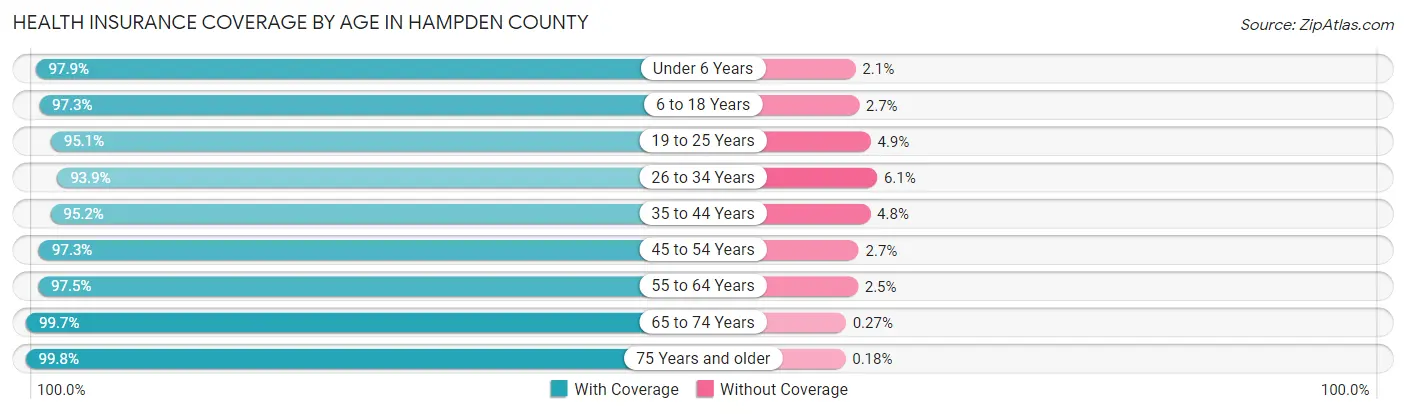
| Age Bracket | With Coverage | Without Coverage |
| Under 6 Years | 29,049 (97.9%) | 613 (2.1%) |
| 6 to 18 Years | 73,916 (97.3%) | 2,065 (2.7%) |
| 19 to 25 Years | 43,838 (95.1%) | 2,254 (4.9%) |
| 26 to 34 Years | 51,696 (93.9%) | 3,355 (6.1%) |
| 35 to 44 Years | 52,560 (95.2%) | 2,661 (4.8%) |
| 45 to 54 Years | 55,324 (97.3%) | 1,515 (2.7%) |
| 55 to 64 Years | 61,491 (97.5%) | 1,590 (2.5%) |
| 65 to 74 Years | 46,605 (99.7%) | 128 (0.3%) |
| 75 Years and older | 30,922 (99.8%) | 57 (0.2%) |
| Total | 445,401 (96.9%) | 14,238 (3.1%) |
Health Insurance Coverage by Citizenship Status in Hampden County
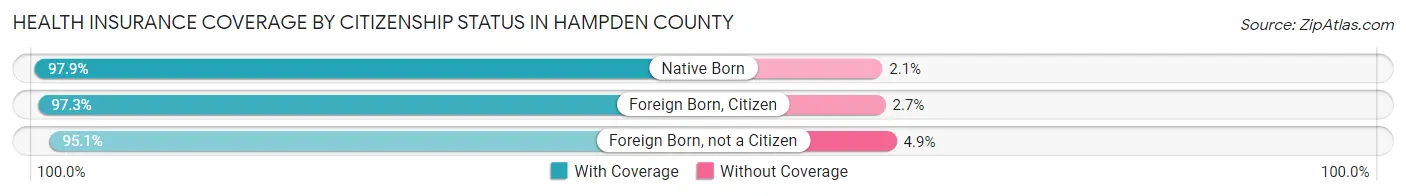
| Citizenship Status | With Coverage | Without Coverage |
| Native Born | 29,049 (97.9%) | 613 (2.1%) |
| Foreign Born, Citizen | 73,916 (97.3%) | 2,065 (2.7%) |
| Foreign Born, not a Citizen | 43,838 (95.1%) | 2,254 (4.9%) |
Health Insurance Coverage by Household Income in Hampden County
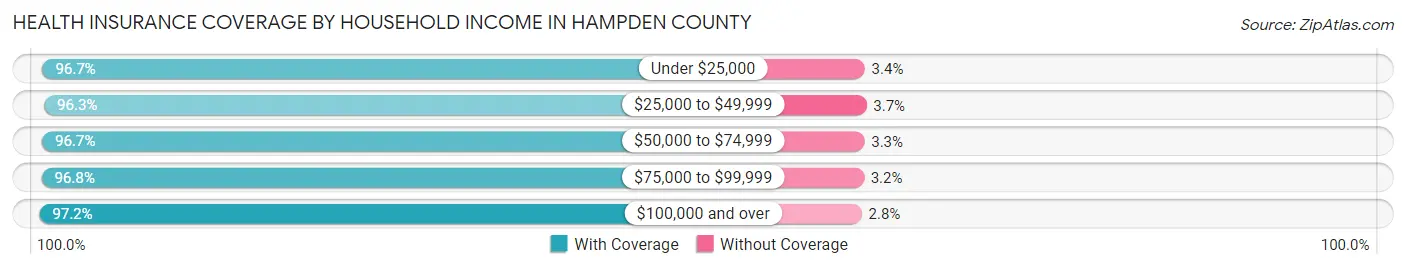
| Household Income | With Coverage | Without Coverage |
| Under $25,000 | 63,469 (96.7%) | 2,199 (3.4%) |
| $25,000 to $49,999 | 69,146 (96.3%) | 2,633 (3.7%) |
| $50,000 to $74,999 | 64,731 (96.7%) | 2,193 (3.3%) |
| $75,000 to $99,999 | 56,390 (96.8%) | 1,846 (3.2%) |
| $100,000 and over | 182,860 (97.2%) | 5,205 (2.8%) |
Public vs Private Health Insurance Coverage by Age in Hampden County
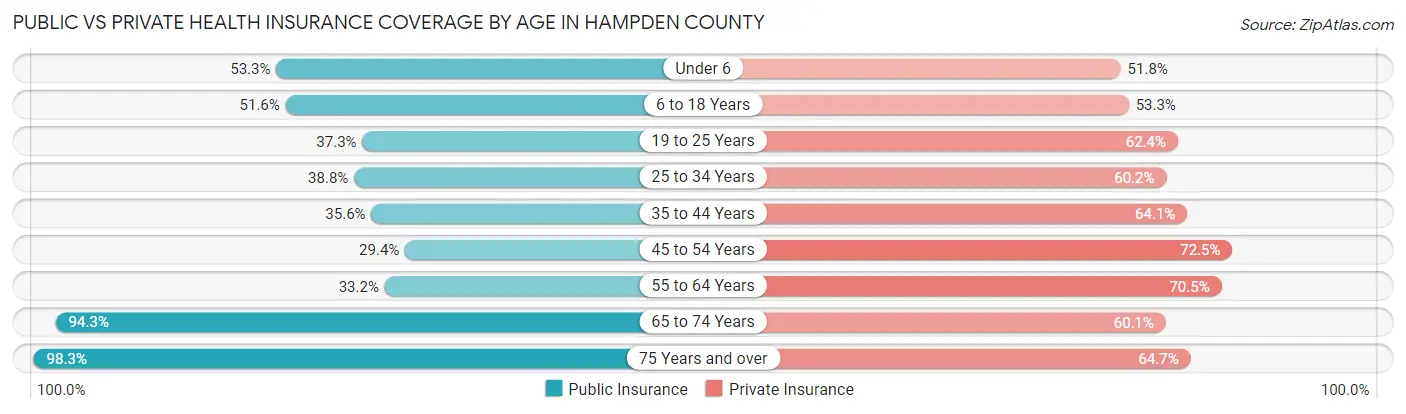
| Age Bracket | Public Insurance | Private Insurance |
| Under 6 | 15,805 (53.3%) | 15,354 (51.8%) |
| 6 to 18 Years | 39,178 (51.6%) | 40,461 (53.2%) |
| 19 to 25 Years | 17,192 (37.3%) | 28,745 (62.4%) |
| 25 to 34 Years | 21,377 (38.8%) | 33,158 (60.2%) |
| 35 to 44 Years | 19,678 (35.6%) | 35,394 (64.1%) |
| 45 to 54 Years | 16,688 (29.4%) | 41,192 (72.5%) |
| 55 to 64 Years | 20,911 (33.2%) | 44,453 (70.5%) |
| 65 to 74 Years | 44,050 (94.3%) | 28,103 (60.1%) |
| 75 Years and over | 30,460 (98.3%) | 20,050 (64.7%) |
| Total | 225,339 (49.0%) | 286,910 (62.4%) |
Disability Status by Sex by Age in Hampden County
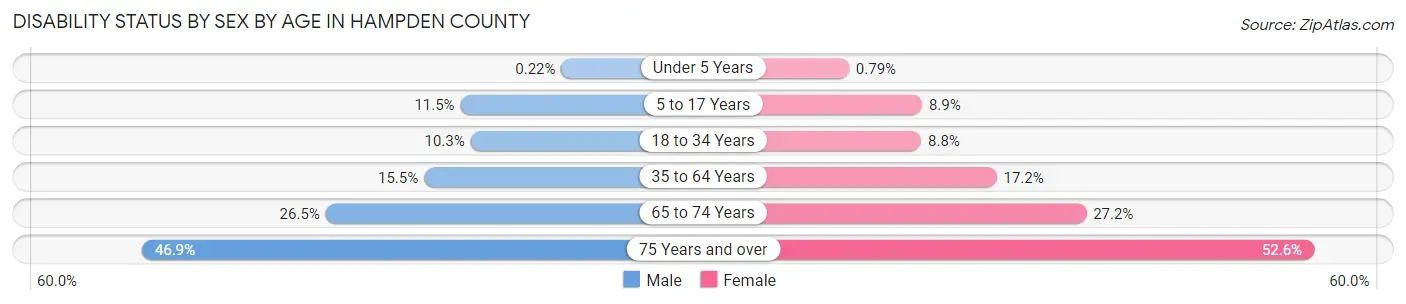
| Age Bracket | Male | Female |
| Under 5 Years | 28 (0.2%) | 94 (0.8%) |
| 5 to 17 Years | 4,347 (11.5%) | 3,191 (8.9%) |
| 18 to 34 Years | 5,645 (10.3%) | 4,757 (8.8%) |
| 35 to 64 Years | 13,059 (15.5%) | 15,668 (17.2%) |
| 65 to 74 Years | 5,767 (26.5%) | 6,790 (27.2%) |
| 75 Years and over | 5,813 (46.9%) | 9,778 (52.6%) |
Disability Class by Sex by Age in Hampden County
Disability Class: Hearing Difficulty
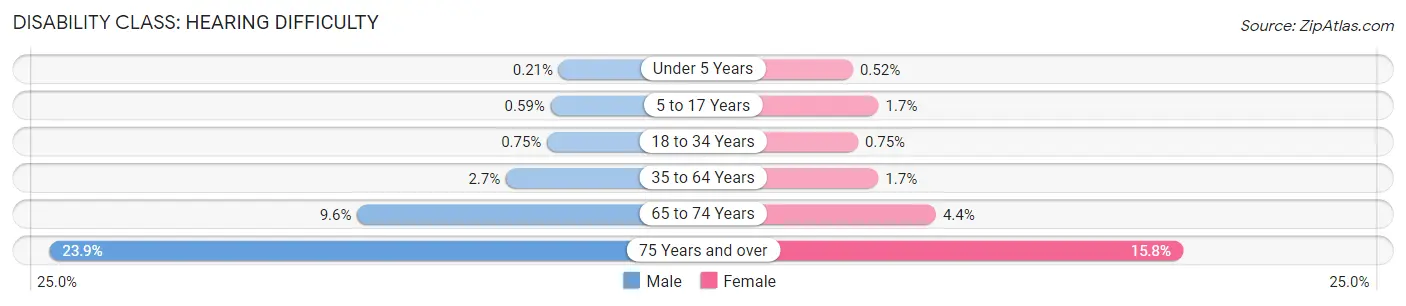
| Age Bracket | Male | Female |
| Under 5 Years | 27 (0.2%) | 62 (0.5%) |
| 5 to 17 Years | 225 (0.6%) | 613 (1.7%) |
| 18 to 34 Years | 411 (0.7%) | 403 (0.7%) |
| 35 to 64 Years | 2,241 (2.7%) | 1,548 (1.7%) |
| 65 to 74 Years | 2,083 (9.6%) | 1,089 (4.4%) |
| 75 Years and over | 2,954 (23.8%) | 2,941 (15.8%) |
Disability Class: Vision Difficulty
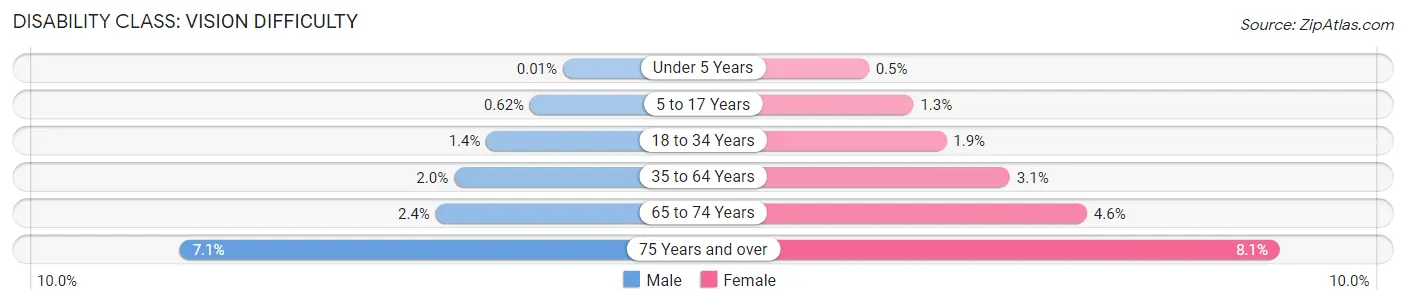
| Age Bracket | Male | Female |
| Under 5 Years | 1 (0.0%) | 60 (0.5%) |
| 5 to 17 Years | 236 (0.6%) | 477 (1.3%) |
| 18 to 34 Years | 782 (1.4%) | 1,044 (1.9%) |
| 35 to 64 Years | 1,707 (2.0%) | 2,838 (3.1%) |
| 65 to 74 Years | 516 (2.4%) | 1,134 (4.5%) |
| 75 Years and over | 882 (7.1%) | 1,512 (8.1%) |
Disability Class: Cognitive Difficulty
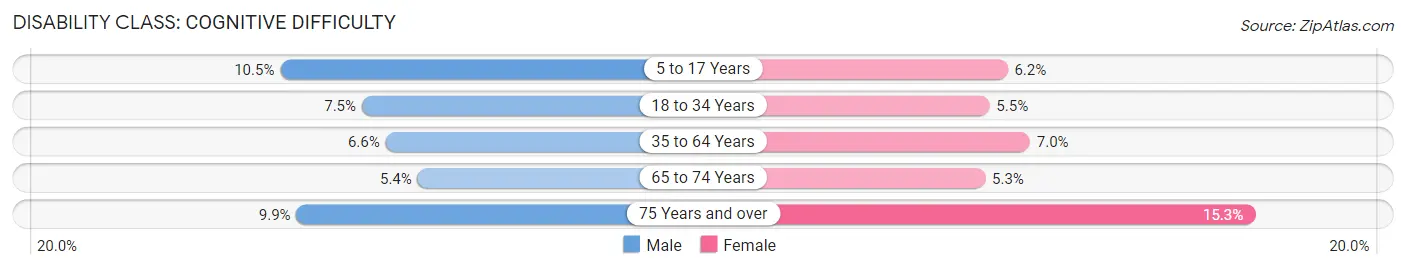
| Age Bracket | Male | Female |
| 5 to 17 Years | 3,989 (10.5%) | 2,199 (6.1%) |
| 18 to 34 Years | 4,083 (7.5%) | 2,952 (5.5%) |
| 35 to 64 Years | 5,556 (6.6%) | 6,350 (7.0%) |
| 65 to 74 Years | 1,179 (5.4%) | 1,327 (5.3%) |
| 75 Years and over | 1,227 (9.9%) | 2,853 (15.3%) |
Disability Class: Ambulatory Difficulty
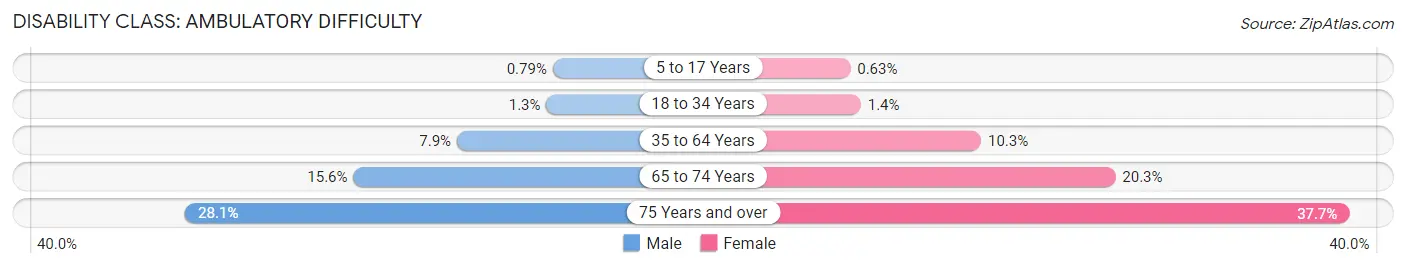
| Age Bracket | Male | Female |
| 5 to 17 Years | 299 (0.8%) | 225 (0.6%) |
| 18 to 34 Years | 687 (1.3%) | 762 (1.4%) |
| 35 to 64 Years | 6,649 (7.9%) | 9,405 (10.3%) |
| 65 to 74 Years | 3,398 (15.6%) | 5,067 (20.3%) |
| 75 Years and over | 3,477 (28.1%) | 7,005 (37.7%) |
Disability Class: Self-Care Difficulty
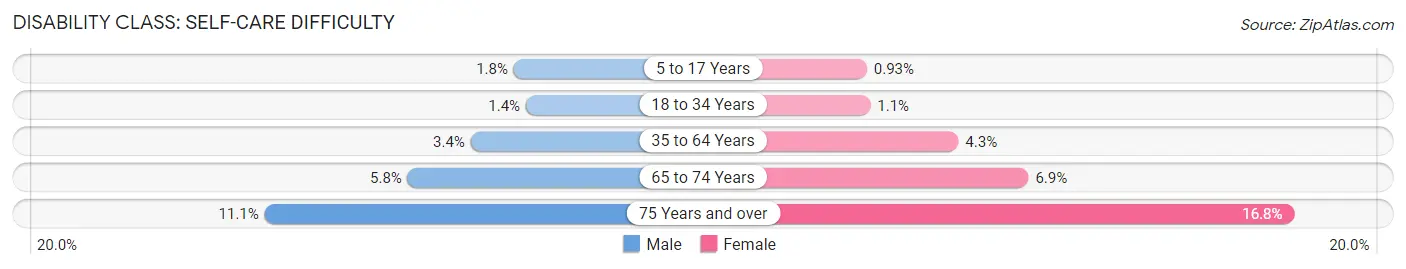
| Age Bracket | Male | Female |
| 5 to 17 Years | 698 (1.8%) | 333 (0.9%) |
| 18 to 34 Years | 759 (1.4%) | 571 (1.1%) |
| 35 to 64 Years | 2,897 (3.4%) | 3,936 (4.3%) |
| 65 to 74 Years | 1,259 (5.8%) | 1,728 (6.9%) |
| 75 Years and over | 1,374 (11.1%) | 3,124 (16.8%) |
Technology Access in Hampden County
Computing Device Access in Hampden County
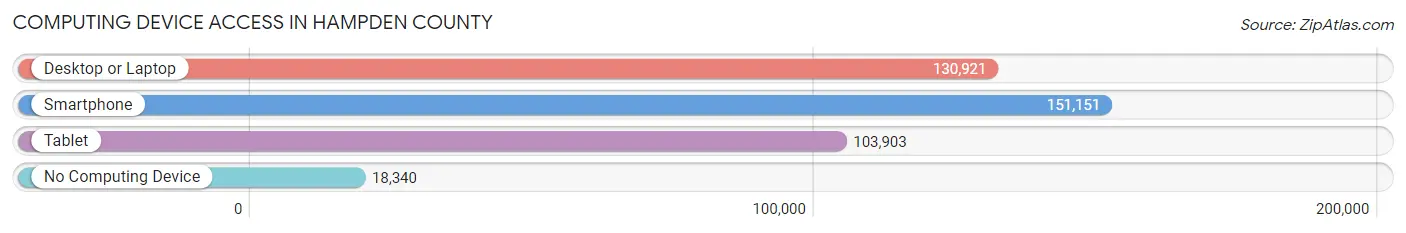
| Device Type | # Households | % Households |
| Desktop or Laptop | 130,921 | 71.4% |
| Smartphone | 151,151 | 82.4% |
| Tablet | 103,903 | 56.7% |
| No Computing Device | 18,340 | 10.0% |
| Total | 183,380 | 100.0% |
Internet Access in Hampden County
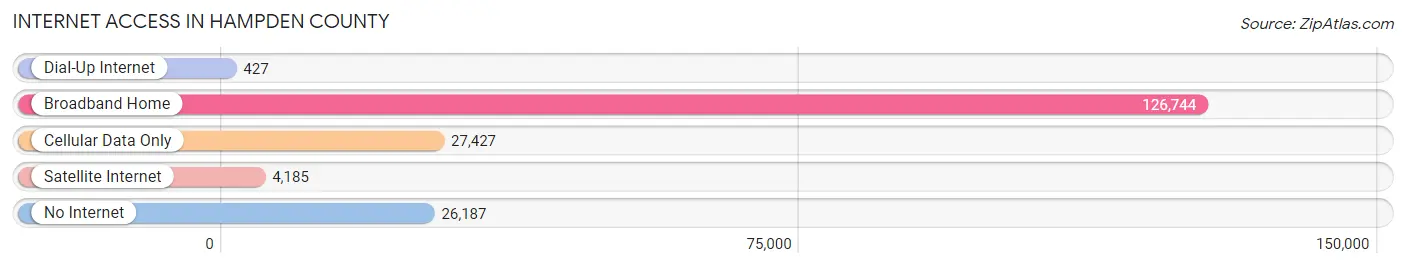
| Internet Type | # Households | % Households |
| Dial-Up Internet | 427 | 0.2% |
| Broadband Home | 126,744 | 69.1% |
| Cellular Data Only | 27,427 | 15.0% |
| Satellite Internet | 4,185 | 2.3% |
| No Internet | 26,187 | 14.3% |
| Total | 183,380 | 100.0% |
Hampden County Summary
Hampden County is located in the western part of Massachusetts and is part of the Pioneer Valley region. It is bordered by Berkshire County to the west, Franklin County to the north, Hampshire County to the east, and Hartford County, Connecticut to the south. The county seat is Springfield, the largest city in the county. Hampden County is home to a population of 477,973 people, making it the most populous county in western Massachusetts.
History
Hampden County was created in 1812 from parts of Hampshire and Berkshire Counties. It was named after John Hampden, an English patriot who fought in the English Civil War. The county was originally divided into four townships: Springfield, Westfield, Chicopee, and Northampton. In 1821, the townships of Granville, Montgomery, and Russell were added.
The county has a rich history, with many notable figures having lived and worked in the area. The poet Emily Dickinson was born in Amherst, which is located in the county. The abolitionist John Brown was born in Torrington, Connecticut, but lived in Springfield for a time. The inventor Thomas Blanchard was born in Sutton, and the author Mark Twain lived in Hartford, Connecticut, but wrote about his experiences in the area.
Geography
Hampden County covers an area of 545 square miles, making it the third-largest county in Massachusetts. The county is located in the Pioneer Valley region of the state, which is known for its rolling hills and fertile farmland. The Connecticut River forms the county’s southern border, and the Westfield River runs through the county. The highest point in the county is Mount Tom, which has an elevation of 1,200 feet.
The county is home to several state parks, including the Quabbin Reservoir, the largest body of water in Massachusetts. The reservoir was created in the 1930s to provide drinking water for the Boston area. The reservoir is home to a variety of wildlife, including bald eagles, ospreys, and beavers.
Economy
Hampden County has a diverse economy, with a mix of manufacturing, retail, and service industries. The county is home to several large employers, including Baystate Health, Smith & Wesson, and MassMutual. The county is also home to several colleges and universities, including the University of Massachusetts Amherst, Springfield College, and Western New England University.
The county’s largest industry is manufacturing, which accounts for nearly 20% of the county’s total employment. The county is home to several large manufacturers, including Smith & Wesson, Baystate Health, and MassMutual. The county is also home to several smaller manufacturers, including paper products, plastics, and electronics.
Demographics
Hampden County is home to a population of 477,973 people, making it the most populous county in western Massachusetts. The population is diverse, with a mix of races and ethnicities. The largest racial group is White, which makes up 73.3% of the population. The second-largest group is Hispanic or Latino, which makes up 11.3% of the population. Other racial groups include African American (7.7%), Asian (3.7%), and Native American (0.5%).
The median household income in the county is $60,845, and the median home value is $219,400. The poverty rate is 11.3%, which is slightly higher than the state average of 10.3%. The unemployment rate is 4.2%, which is lower than the state average of 4.7%.
Conclusion
Hampden County is located in the western part of Massachusetts and is part of the Pioneer Valley region. It is home to a population of 477,973 people, making it the most populous county in western Massachusetts. The county has a rich history, with many notable figures having lived and worked in the area. The county has a diverse economy, with a mix of manufacturing, retail, and service industries. The population is diverse, with a mix of races and ethnicities. The median household income in the county is $60,845, and the median home value is $219,400.
Common Questions
What is the Total Population of Hampden County?
Total Population of Hampden County is 464,575.
What is the Total Male Population of Hampden County?
Total Male Population of Hampden County is 226,201.
What is the Total Female Population of Hampden County?
Total Female Population of Hampden County is 238,374.
What is the Ratio of Males per 100 Females in Hampden County?
There are 94.89 Males per 100 Females in Hampden County.
What is the Ratio of Females per 100 Males in Hampden County?
There are 105.38 Females per 100 Males in Hampden County.
What is the Median Population Age in Hampden County?
Median Population Age in Hampden County is 39.5 Years.
What is the Average Family Size in Hampden County
Average Family Size in Hampden County is 3.1 People.
What is the Average Household Size in Hampden County
Average Household Size in Hampden County is 2.5 People.
What is Per Capita Income in Hampden County?
Per Capita income in Hampden County is $35,884.
What is the Median Family Income in Hampden County?
Median Family Income in Hampden County is $85,009.
What is the Median Household income in Hampden County?
Median Household Income in Hampden County is $66,619.
What is Income or Wage Gap in Hampden County?
Income or Wage Gap in Hampden County is 24.3%.
Women in Hampden County earn 75.7 cents for every dollar earned by a man.
What is Family Income Deficit in Hampden County?
Family Income Deficit in Hampden County is $10,372.
Families that are below poverty line in Hampden County earn $10,372 less on average than the poverty threshold level.
What is Inequality or Gini Index in Hampden County?
Inequality or Gini Index in Hampden County is 0.47.
How Large is the Labor Force in Hampden County?
There are 227,675 People in the Labor Forcein in Hampden County.
What is the Percentage of People in the Labor Force in Hampden County?
60.2% of People are in the Labor Force in Hampden County.
What is the Unemployment Rate in Hampden County?
Unemployment Rate in Hampden County is 6.2%.