Franklin County, MA
Franklin County Overview
70,980
TOTAL POPULATION
35,030
MALE POPULATION
35,950
FEMALE POPULATION
97.44
MALES / 100 FEMALES
102.63
FEMALES / 100 MALES
47.1
MEDIAN AGE
2.8
AVG FAMILY SIZE
2.2
AVG HOUSEHOLD SIZE
$40,282
PER CAPITA INCOME
$92,593
AVG FAMILY INCOME
$70,383
AVG HOUSEHOLD INCOME
21.1%
WAGE / INCOME GAP [ % ]
78.9¢/ $1
WAGE / INCOME GAP [ $ ]
$11,108
FAMILY INCOME DEFICIT
0.44
INEQUALITY / GINI INDEX
38,257
LABOR FORCE [ PEOPLE ]
63.1%
PERCENT IN LABOR FORCE
5.7%
UNEMPLOYMENT RATE
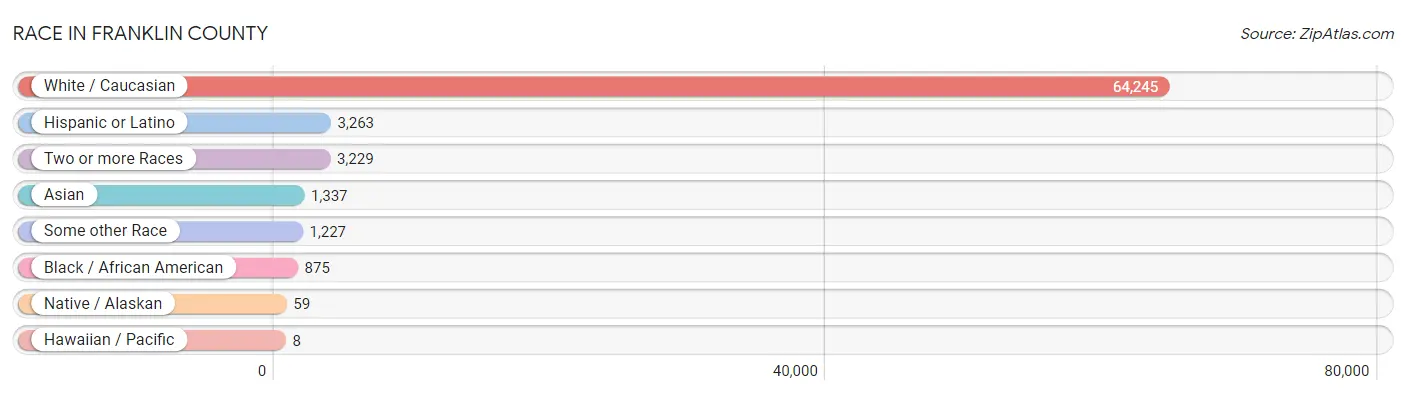
Race in Franklin County
The most populous races in Franklin County are White / Caucasian (64,245 | 90.5%), Hispanic or Latino (3,263 | 4.6%), and Two or more Races (3,229 | 4.5%).
| Race | # Population | % Population |
| Asian | 1,337 | 1.9% |
| Black / African American | 875 | 1.2% |
| Hawaiian / Pacific | 8 | 0.0% |
| Hispanic or Latino | 3,263 | 4.6% |
| Native / Alaskan | 59 | 0.1% |
| White / Caucasian | 64,245 | 90.5% |
| Two or more Races | 3,229 | 4.5% |
| Some other Race | 1,227 | 1.7% |
| Total | 70,980 | 100.0% |
Ancestry in Franklin County
The most populous ancestries reported in Franklin County are English (13,616 | 19.2%), Irish (12,222 | 17.2%), Polish (7,204 | 10.2%), German (6,893 | 9.7%), and French (6,865 | 9.7%), together accounting for 65.9% of all Franklin County residents.

| Ancestry | # Population | % Population |
| Afghan | 43 | 0.1% |
| African | 45 | 0.1% |
| Alaska Native | 11 | 0.0% |
| Albanian | 26 | 0.0% |
| Alsatian | 3 | 0.0% |
| American | 2,575 | 3.6% |
| Apache | 11 | 0.0% |
| Arab | 215 | 0.3% |
| Argentinean | 20 | 0.0% |
| Armenian | 117 | 0.2% |
| Assyrian / Chaldean / Syriac | 23 | 0.0% |
| Australian | 23 | 0.0% |
| Austrian | 317 | 0.4% |
| Bangladeshi | 110 | 0.2% |
| Barbadian | 4 | 0.0% |
| Belgian | 16 | 0.0% |
| Bhutanese | 119 | 0.2% |
| Blackfeet | 29 | 0.0% |
| Brazilian | 53 | 0.1% |
| British | 720 | 1.0% |
| British West Indian | 1 | 0.0% |
| Bulgarian | 43 | 0.1% |
| Burmese | 77 | 0.1% |
| Cajun | 21 | 0.0% |
| Canadian | 316 | 0.4% |
| Cape Verdean | 9 | 0.0% |
| Celtic | 36 | 0.1% |
| Central American | 303 | 0.4% |
| Central American Indian | 30 | 0.0% |
| Cherokee | 26 | 0.0% |
| Chippewa | 8 | 0.0% |
| Colombian | 275 | 0.4% |
| Costa Rican | 81 | 0.1% |
| Creek | 3 | 0.0% |
| Croatian | 29 | 0.0% |
| Crow | 15 | 0.0% |
| Cuban | 91 | 0.1% |
| Czech | 209 | 0.3% |
| Czechoslovakian | 45 | 0.1% |
| Danish | 178 | 0.3% |
| Dominican | 95 | 0.1% |
| Dutch | 632 | 0.9% |
| Eastern European | 574 | 0.8% |
| Ecuadorian | 104 | 0.2% |
| Egyptian | 19 | 0.0% |
| English | 13,616 | 19.2% |
| Estonian | 7 | 0.0% |
| European | 1,382 | 1.9% |
| Filipino | 7 | 0.0% |
| Finnish | 319 | 0.4% |
| French | 6,865 | 9.7% |
| French American Indian | 31 | 0.0% |
| French Canadian | 4,338 | 6.1% |
| German | 6,893 | 9.7% |
| Ghanaian | 13 | 0.0% |
| Greek | 421 | 0.6% |
| Guamanian / Chamorro | 44 | 0.1% |
| Guatemalan | 155 | 0.2% |
| Guyanese | 16 | 0.0% |
| Haitian | 41 | 0.1% |
| Hungarian | 331 | 0.5% |
| Indian (Asian) | 460 | 0.6% |
| Indonesian | 4 | 0.0% |
| Iranian | 35 | 0.1% |
| Iraqi | 8 | 0.0% |
| Irish | 12,222 | 17.2% |
| Iroquois | 39 | 0.1% |
| Israeli | 28 | 0.0% |
| Italian | 5,657 | 8.0% |
| Jamaican | 93 | 0.1% |
| Japanese | 165 | 0.2% |
| Korean | 184 | 0.3% |
| Laotian | 49 | 0.1% |
| Latvian | 25 | 0.0% |
| Lebanese | 155 | 0.2% |
| Lithuanian | 965 | 1.4% |
| Malaysian | 22 | 0.0% |
| Maltese | 10 | 0.0% |
| Mexican | 527 | 0.7% |
| Mexican American Indian | 33 | 0.1% |
| New Zealander | 66 | 0.1% |
| Nicaraguan | 6 | 0.0% |
| Northern European | 211 | 0.3% |
| Norwegian | 512 | 0.7% |
| Okinawan | 1 | 0.0% |
| Pakistani | 28 | 0.0% |
| Panamanian | 3 | 0.0% |
| Peruvian | 37 | 0.1% |
| Polish | 7,204 | 10.2% |
| Portuguese | 687 | 1.0% |
| Puerto Rican | 1,327 | 1.9% |
| Romanian | 317 | 0.4% |
| Russian | 743 | 1.1% |
| Salvadoran | 58 | 0.1% |
| Samoan | 20 | 0.0% |
| Scandinavian | 200 | 0.3% |
| Scotch-Irish | 856 | 1.2% |
| Scottish | 2,251 | 3.2% |
| Seminole | 1 | 0.0% |
| Sioux | 5 | 0.0% |
| Slavic | 45 | 0.1% |
| Slovak | 108 | 0.2% |
| Slovene | 5 | 0.0% |
| South African | 46 | 0.1% |
| South American | 590 | 0.8% |
| South American Indian | 25 | 0.0% |
| Spaniard | 81 | 0.1% |
| Spanish | 127 | 0.2% |
| Sri Lankan | 108 | 0.2% |
| Subsaharan African | 118 | 0.2% |
| Swedish | 1,448 | 2.0% |
| Swiss | 144 | 0.2% |
| Syrian | 7 | 0.0% |
| Taiwanese | 9 | 0.0% |
| Thai | 430 | 0.6% |
| Trinidadian and Tobagonian | 5 | 0.0% |
| Turkish | 86 | 0.1% |
| U.S. Virgin Islander | 10 | 0.0% |
| Ukrainian | 346 | 0.5% |
| Uruguayan | 9 | 0.0% |
| Venezuelan | 145 | 0.2% |
| Vietnamese | 45 | 0.1% |
| Welsh | 506 | 0.7% |
| West Indian | 37 | 0.1% |
| Yaqui | 9 | 0.0% |
| Yugoslavian | 7 | 0.0% | View All 126 Rows |
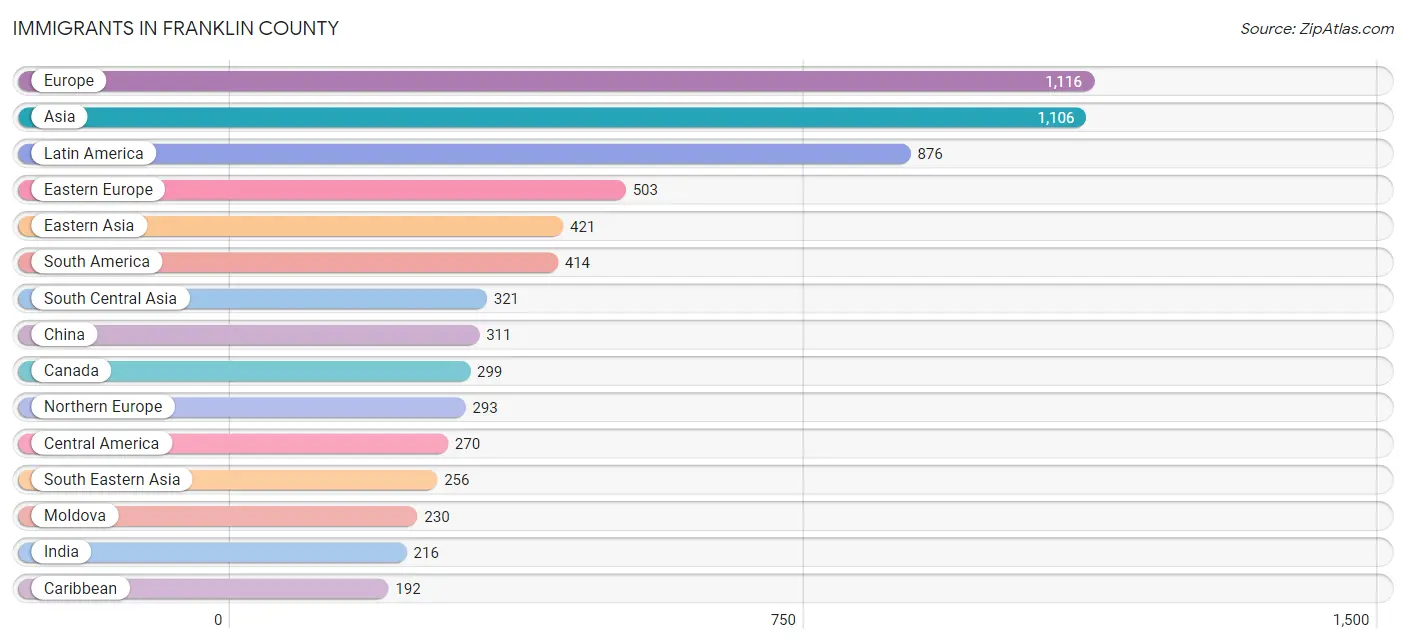
Immigrants in Franklin County
The most numerous immigrant groups reported in Franklin County came from Europe (1,116 | 1.6%), Asia (1,106 | 1.6%), Latin America (876 | 1.2%), Eastern Europe (503 | 0.7%), and Eastern Asia (421 | 0.6%), together accounting for 5.7% of all Franklin County residents.
| Immigration Origin | # Population | % Population |
| Africa | 93 | 0.1% |
| Argentina | 21 | 0.0% |
| Asia | 1,106 | 1.6% |
| Australia | 39 | 0.1% |
| Austria | 28 | 0.0% |
| Bangladesh | 45 | 0.1% |
| Barbados | 1 | 0.0% |
| Brazil | 97 | 0.1% |
| Bulgaria | 46 | 0.1% |
| Cambodia | 49 | 0.1% |
| Canada | 299 | 0.4% |
| Caribbean | 192 | 0.3% |
| Central America | 270 | 0.4% |
| Chile | 15 | 0.0% |
| China | 311 | 0.4% |
| Colombia | 113 | 0.2% |
| Costa Rica | 27 | 0.0% |
| Cuba | 52 | 0.1% |
| Czechoslovakia | 11 | 0.0% |
| Dominican Republic | 51 | 0.1% |
| Eastern Asia | 421 | 0.6% |
| Eastern Europe | 503 | 0.7% |
| Ecuador | 6 | 0.0% |
| Egypt | 25 | 0.0% |
| El Salvador | 29 | 0.0% |
| England | 133 | 0.2% |
| Europe | 1,116 | 1.6% |
| France | 25 | 0.0% |
| Germany | 80 | 0.1% |
| Ghana | 21 | 0.0% |
| Greece | 29 | 0.0% |
| Guatemala | 94 | 0.1% |
| Guyana | 29 | 0.0% |
| Haiti | 5 | 0.0% |
| Hungary | 29 | 0.0% |
| India | 216 | 0.3% |
| Indonesia | 26 | 0.0% |
| Iran | 55 | 0.1% |
| Iraq | 8 | 0.0% |
| Ireland | 47 | 0.1% |
| Israel | 19 | 0.0% |
| Italy | 36 | 0.1% |
| Jamaica | 78 | 0.1% |
| Japan | 84 | 0.1% |
| Jordan | 7 | 0.0% |
| Kazakhstan | 2 | 0.0% |
| Korea | 26 | 0.0% |
| Laos | 34 | 0.1% |
| Latin America | 876 | 1.2% |
| Lebanon | 24 | 0.0% |
| Liberia | 12 | 0.0% |
| Lithuania | 19 | 0.0% |
| Malaysia | 22 | 0.0% |
| Mexico | 117 | 0.2% |
| Middle Africa | 11 | 0.0% |
| Moldova | 230 | 0.3% |
| Netherlands | 15 | 0.0% |
| Northern Africa | 25 | 0.0% |
| Northern Europe | 293 | 0.4% |
| Norway | 8 | 0.0% |
| Oceania | 50 | 0.1% |
| Panama | 3 | 0.0% |
| Peru | 6 | 0.0% |
| Philippines | 71 | 0.1% |
| Poland | 71 | 0.1% |
| Portugal | 86 | 0.1% |
| Romania | 15 | 0.0% |
| Russia | 65 | 0.1% |
| Scotland | 32 | 0.1% |
| Singapore | 1 | 0.0% |
| South Africa | 24 | 0.0% |
| South America | 414 | 0.6% |
| South Central Asia | 321 | 0.4% |
| South Eastern Asia | 256 | 0.4% |
| Southern Europe | 164 | 0.2% |
| Spain | 13 | 0.0% |
| Switzerland | 8 | 0.0% |
| Taiwan | 52 | 0.1% |
| Thailand | 1 | 0.0% |
| Trinidad and Tobago | 5 | 0.0% |
| Turkey | 50 | 0.1% |
| Ukraine | 15 | 0.0% |
| Venezuela | 127 | 0.2% |
| Vietnam | 52 | 0.1% |
| Western Africa | 33 | 0.1% |
| Western Asia | 108 | 0.2% |
| Western Europe | 156 | 0.2% | View All 87 Rows |
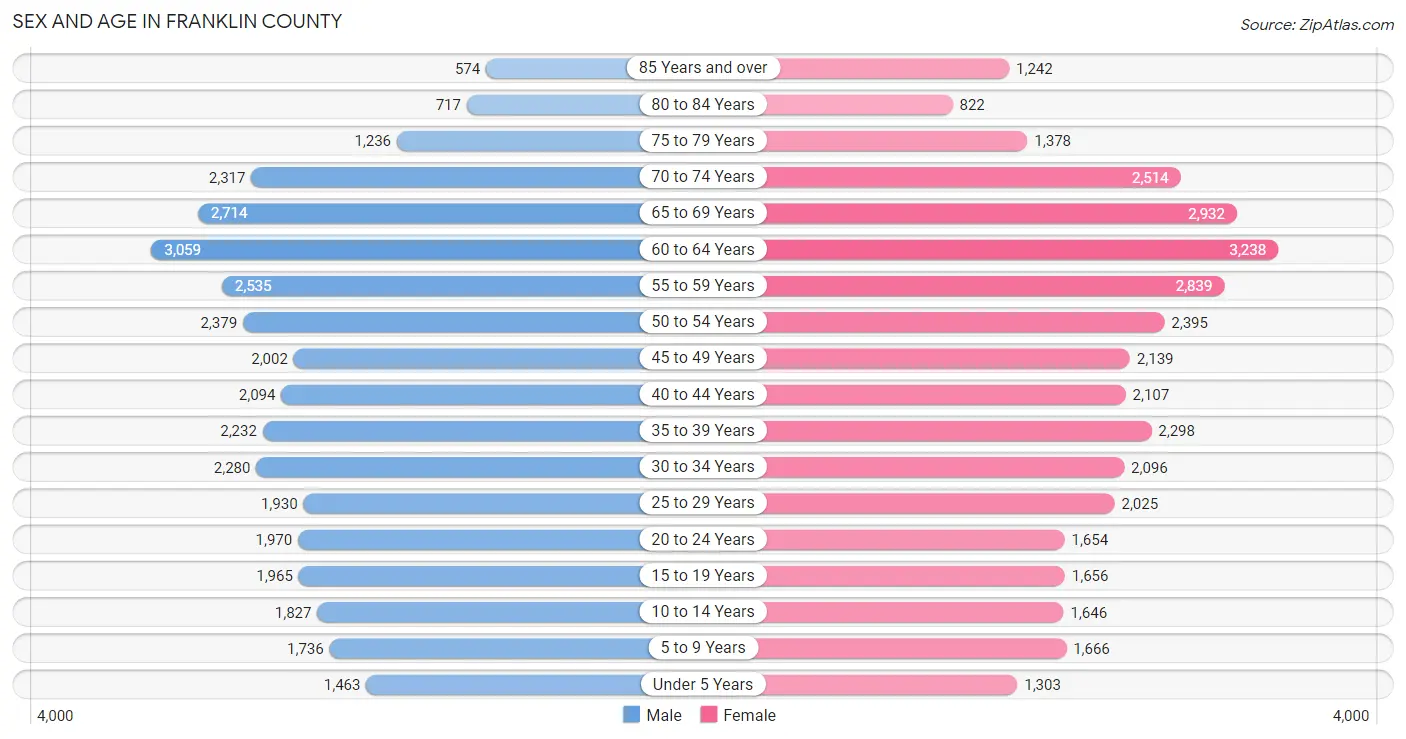
Sex and Age in Franklin County
Sex and Age in Franklin County
The most populous age groups in Franklin County are 60 to 64 Years (3,059 | 8.7%) for men and 60 to 64 Years (3,238 | 9.0%) for women.
| Age Bracket | Male | Female |
| Under 5 Years | 1,463 (4.2%) | 1,303 (3.6%) |
| 5 to 9 Years | 1,736 (5.0%) | 1,666 (4.6%) |
| 10 to 14 Years | 1,827 (5.2%) | 1,646 (4.6%) |
| 15 to 19 Years | 1,965 (5.6%) | 1,656 (4.6%) |
| 20 to 24 Years | 1,970 (5.6%) | 1,654 (4.6%) |
| 25 to 29 Years | 1,930 (5.5%) | 2,025 (5.6%) |
| 30 to 34 Years | 2,280 (6.5%) | 2,096 (5.8%) |
| 35 to 39 Years | 2,232 (6.4%) | 2,298 (6.4%) |
| 40 to 44 Years | 2,094 (6.0%) | 2,107 (5.9%) |
| 45 to 49 Years | 2,002 (5.7%) | 2,139 (5.9%) |
| 50 to 54 Years | 2,379 (6.8%) | 2,395 (6.7%) |
| 55 to 59 Years | 2,535 (7.2%) | 2,839 (7.9%) |
| 60 to 64 Years | 3,059 (8.7%) | 3,238 (9.0%) |
| 65 to 69 Years | 2,714 (7.7%) | 2,932 (8.2%) |
| 70 to 74 Years | 2,317 (6.6%) | 2,514 (7.0%) |
| 75 to 79 Years | 1,236 (3.5%) | 1,378 (3.8%) |
| 80 to 84 Years | 717 (2.1%) | 822 (2.3%) |
| 85 Years and over | 574 (1.6%) | 1,242 (3.5%) |
| Total | 35,030 (100.0%) | 35,950 (100.0%) |
Families and Households in Franklin County
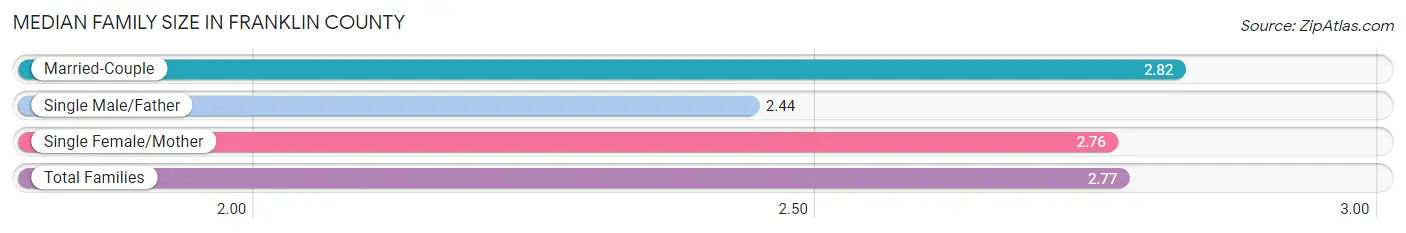
Median Family Size in Franklin County
The median family size in Franklin County is 2.77 persons per family, with married-couple families (13,458 | 73.3%) accounting for the largest median family size of 2.82 persons per family. On the other hand, single male/father families (1,597 | 8.7%) represent the smallest median family size with 2.44 persons per family.
| Family Type | # Families | Family Size |
| Married-Couple | 13,458 (73.3%) | 2.82 |
| Single Male/Father | 1,597 (8.7%) | 2.44 |
| Single Female/Mother | 3,296 (18.0%) | 2.76 |
| Total Families | 18,351 (100.0%) | 2.77 |
Median Household Size in Franklin County
The median household size in Franklin County is 2.22 persons per household, with single female/mother households (3,296 | 10.5%) accounting for the largest median household size of 3.13 persons per household. non-family households (12,883 | 41.2%) represent the smallest median household size with 1.27 persons per household.
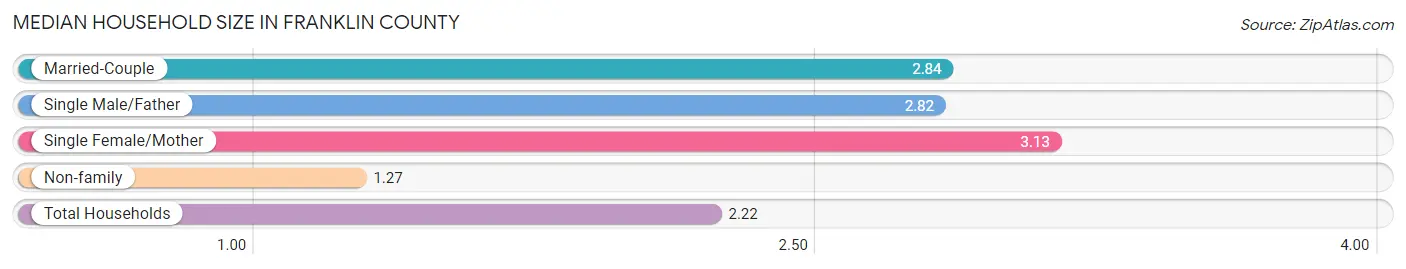
| Household Type | # Households | Household Size |
| Married-Couple | 13,458 (43.1%) | 2.84 |
| Single Male/Father | 1,597 (5.1%) | 2.82 |
| Single Female/Mother | 3,296 (10.5%) | 3.13 |
| Non-family | 12,883 (41.2%) | 1.27 |
| Total Households | 31,234 (100.0%) | 2.22 |
Household Size by Marriage Status in Franklin County
Out of a total of 31,234 households in Franklin County, 18,351 (58.8%) are family households, while 12,883 (41.2%) are nonfamily households. The most numerous type of family households are 2-person households, comprising 9,310, and the most common type of nonfamily households are 1-person households, comprising 10,016.

| Household Size | Family Households | Nonfamily Households |
| 1-Person Households | - | 10,016 (32.1%) |
| 2-Person Households | 9,310 (29.8%) | 2,539 (8.1%) |
| 3-Person Households | 4,432 (14.2%) | 286 (0.9%) |
| 4-Person Households | 3,080 (9.9%) | 10 (0.0%) |
| 5-Person Households | 926 (3.0%) | 27 (0.1%) |
| 6-Person Households | 282 (0.9%) | 0 (0.0%) |
| 7+ Person Households | 321 (1.0%) | 5 (0.0%) |
| Total | 18,351 (58.8%) | 12,883 (41.2%) |
Female Fertility in Franklin County
Fertility by Age in Franklin County
Average fertility rate in Franklin County is 51.0 births per 1,000 women. Women in the age bracket of 20 to 34 years have the highest fertility rate with 83.0 births per 1,000 women. Women in the age bracket of 20 to 34 years acount for 66.4% of all women with births.
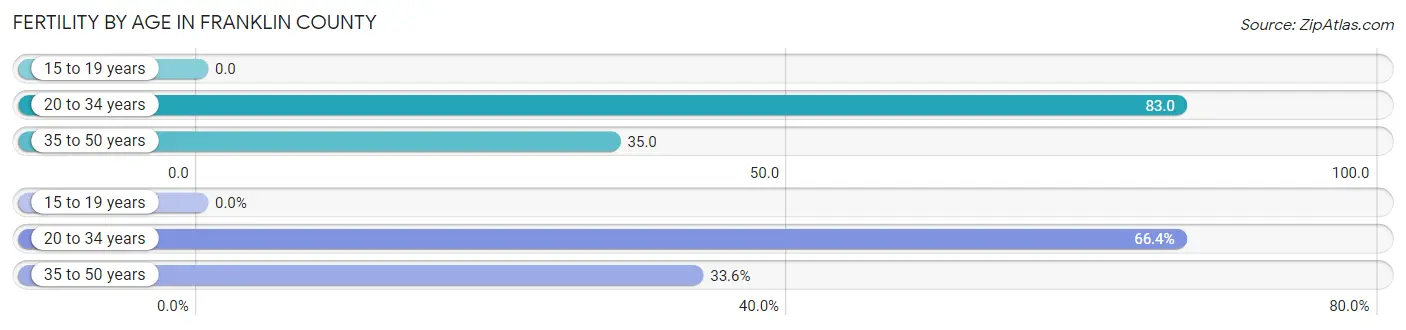
| Age Bracket | Women with Births | Births / 1,000 Women |
| 15 to 19 years | 0 (0.0%) | 0.0 |
| 20 to 34 years | 480 (66.4%) | 83.0 |
| 35 to 50 years | 243 (33.6%) | 35.0 |
| Total | 723 (100.0%) | 51.0 |
Fertility by Age by Marriage Status in Franklin County
70.5% of women with births (723) in Franklin County are married. The highest percentage of unmarried women with births falls into 20 to 34 years age bracket with 30.8% of them unmarried at the time of birth, while the lowest percentage of unmarried women with births belong to 35 to 50 years age bracket with 26.7% of them unmarried.
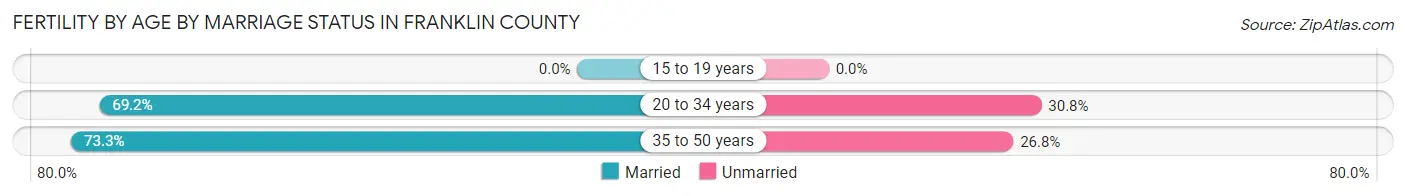
| Age Bracket | Married | Unmarried |
| 15 to 19 years | 0 (0.0%) | 0 (0.0%) |
| 20 to 34 years | 332 (69.2%) | 148 (30.8%) |
| 35 to 50 years | 178 (73.3%) | 65 (26.8%) |
| Total | 510 (70.5%) | 213 (29.5%) |
Fertility by Education in Franklin County
Average fertility rate in Franklin County is 51.0 births per 1,000 women. Women with the education attainment of graduate degree have the highest fertility rate of 89.0 births per 1,000 women, while women with the education attainment of less than high school have the lowest fertility at 10.0 births per 1,000 women. Women with the education attainment of college or associate's degree represent 29.3% of all women with births.
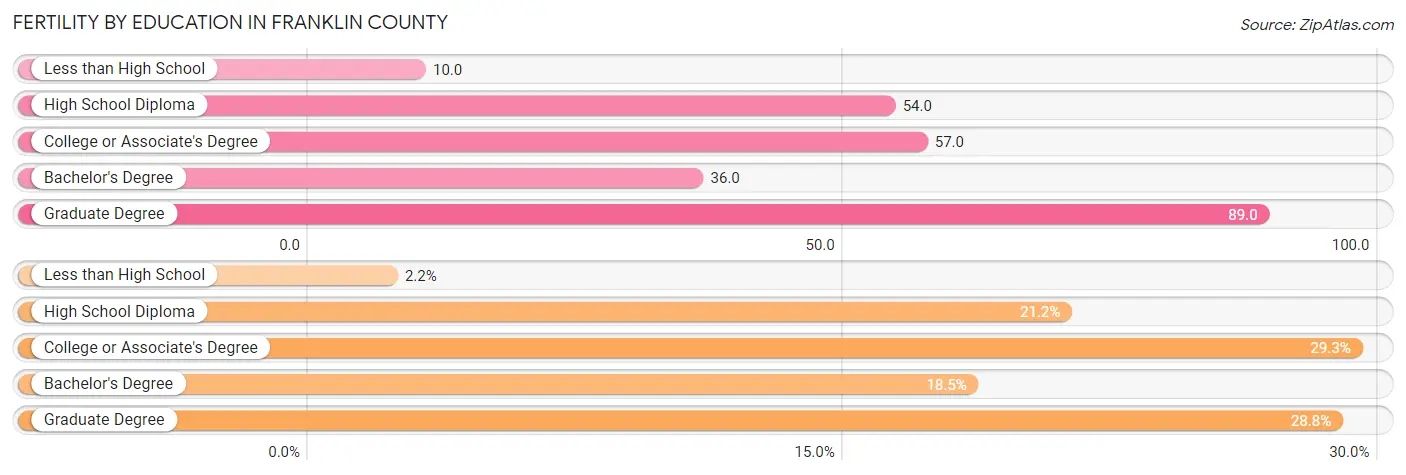
| Educational Attainment | Women with Births | Births / 1,000 Women |
| Less than High School | 16 (2.2%) | 10.0 |
| High School Diploma | 153 (21.2%) | 54.0 |
| College or Associate's Degree | 212 (29.3%) | 57.0 |
| Bachelor's Degree | 134 (18.5%) | 36.0 |
| Graduate Degree | 208 (28.8%) | 89.0 |
| Total | 723 (100.0%) | 51.0 |
Fertility by Education by Marriage Status in Franklin County
29.5% of women with births in Franklin County are unmarried. Women with the educational attainment of graduate degree are most likely to be married with 90.4% of them married at childbirth, while women with the educational attainment of less than high school are least likely to be married with 68.8% of them unmarried at childbirth.
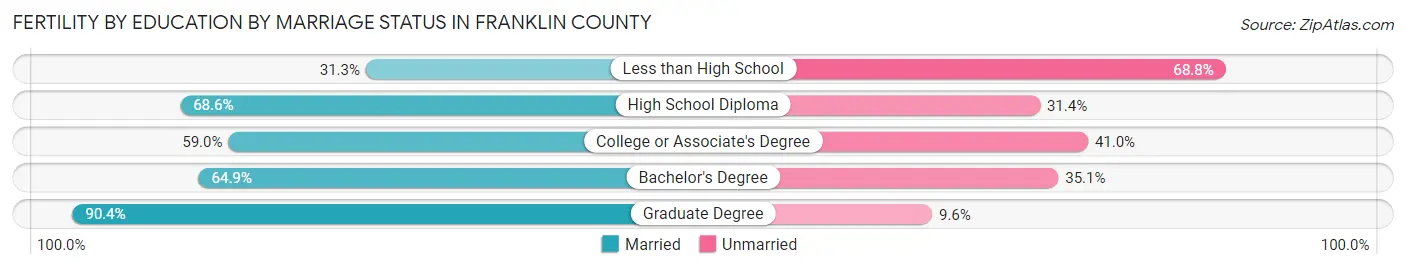
| Educational Attainment | Married | Unmarried |
| Less than High School | 5 (31.2%) | 11 (68.8%) |
| High School Diploma | 105 (68.6%) | 48 (31.4%) |
| College or Associate's Degree | 125 (59.0%) | 87 (41.0%) |
| Bachelor's Degree | 87 (64.9%) | 47 (35.1%) |
| Graduate Degree | 188 (90.4%) | 20 (9.6%) |
| Total | 510 (70.5%) | 213 (29.5%) |
Income in Franklin County
Income Overview in Franklin County
Per Capita Income in Franklin County is $40,282, while median incomes of families and households are $92,593 and $70,383 respectively.
| Characteristic | Number | Measure |
| Per Capita Income | 70,980 | $40,282 |
| Median Family Income | 18,351 | $92,593 |
| Mean Family Income | 18,351 | $109,290 |
| Median Household Income | 31,234 | $70,383 |
| Mean Household Income | 31,234 | $89,416 |
| Income Deficit | 18,351 | $11,108 |
| Wage / Income Gap (%) | 70,980 | 21.11% |
| Wage / Income Gap ($) | 70,980 | 78.89¢ per $1 |
| Gini / Inequality Index | 70,980 | 0.44 |
Earnings by Sex in Franklin County
Average Earnings in Franklin County are $40,363, $45,504 for men and $35,896 for women, a difference of 21.1%.
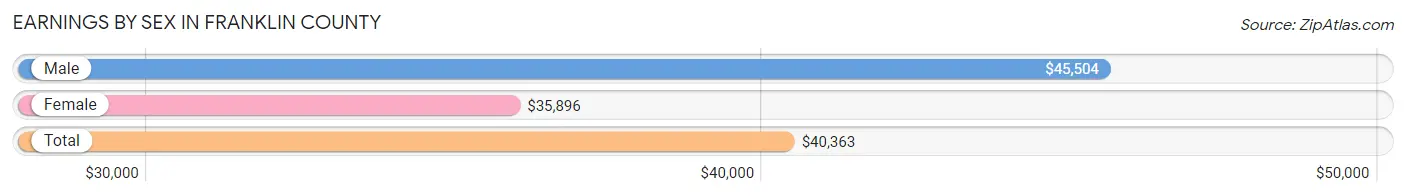
| Sex | Number | Average Earnings |
| Male | 20,443 (50.6%) | $45,504 |
| Female | 19,927 (49.4%) | $35,896 |
| Total | 40,370 (100.0%) | $40,363 |
Earnings by Sex by Income Bracket in Franklin County
The most common earnings brackets in Franklin County are $75,000 to $99,999 for men (2,597 | 12.7%) and $75,000 to $99,999 for women (1,816 | 9.1%).
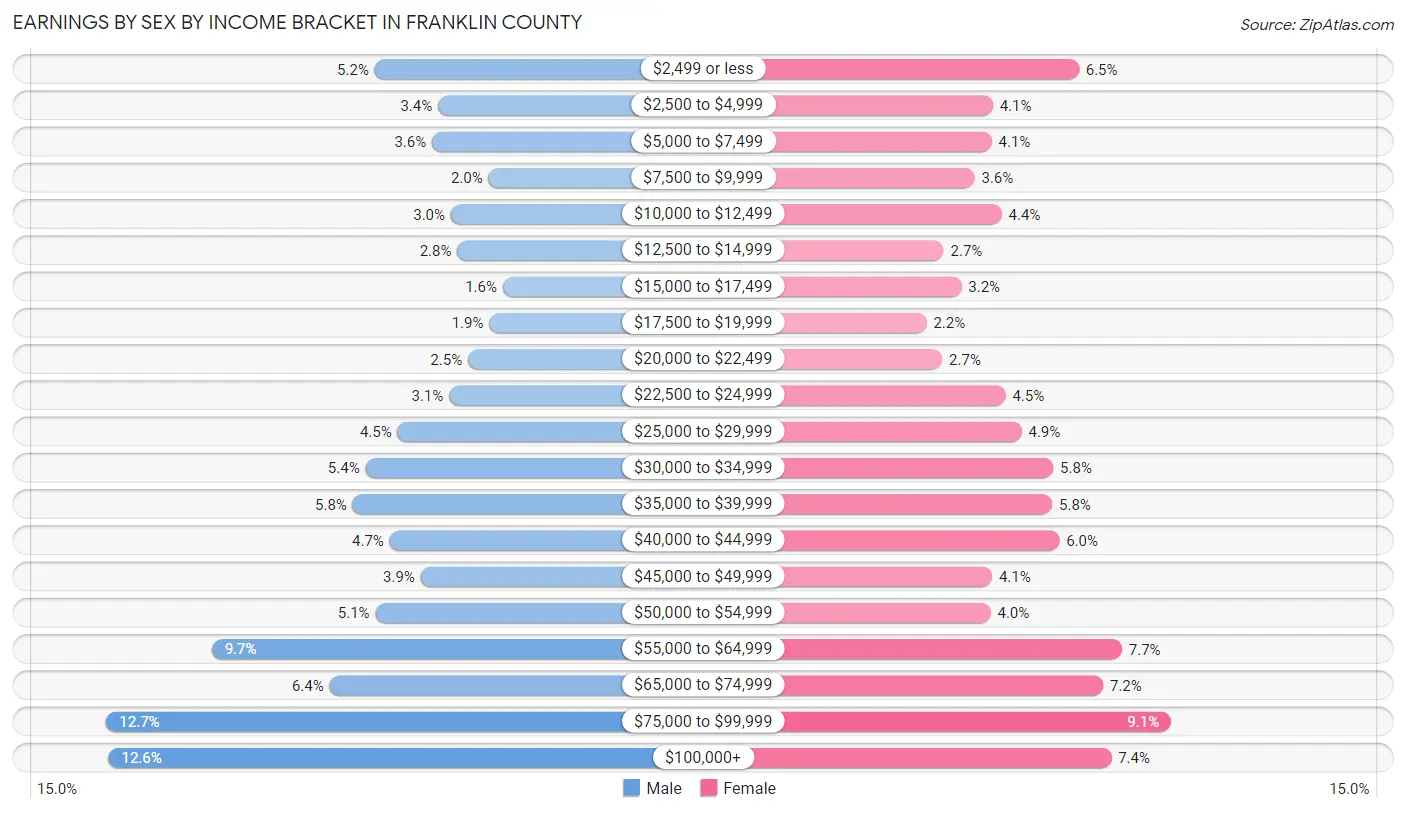
| Income | Male | Female |
| $2,499 or less | 1,054 (5.2%) | 1,300 (6.5%) |
| $2,500 to $4,999 | 691 (3.4%) | 817 (4.1%) |
| $5,000 to $7,499 | 725 (3.5%) | 811 (4.1%) |
| $7,500 to $9,999 | 401 (2.0%) | 716 (3.6%) |
| $10,000 to $12,499 | 617 (3.0%) | 867 (4.3%) |
| $12,500 to $14,999 | 581 (2.8%) | 543 (2.7%) |
| $15,000 to $17,499 | 319 (1.6%) | 641 (3.2%) |
| $17,500 to $19,999 | 396 (1.9%) | 446 (2.2%) |
| $20,000 to $22,499 | 519 (2.5%) | 535 (2.7%) |
| $22,500 to $24,999 | 627 (3.1%) | 888 (4.5%) |
| $25,000 to $29,999 | 924 (4.5%) | 979 (4.9%) |
| $30,000 to $34,999 | 1,109 (5.4%) | 1,155 (5.8%) |
| $35,000 to $39,999 | 1,182 (5.8%) | 1,149 (5.8%) |
| $40,000 to $44,999 | 969 (4.7%) | 1,190 (6.0%) |
| $45,000 to $49,999 | 792 (3.9%) | 814 (4.1%) |
| $50,000 to $54,999 | 1,050 (5.1%) | 806 (4.0%) |
| $55,000 to $64,999 | 1,991 (9.7%) | 1,540 (7.7%) |
| $65,000 to $74,999 | 1,314 (6.4%) | 1,434 (7.2%) |
| $75,000 to $99,999 | 2,597 (12.7%) | 1,816 (9.1%) |
| $100,000+ | 2,585 (12.6%) | 1,480 (7.4%) |
| Total | 20,443 (100.0%) | 19,927 (100.0%) |
Earnings by Sex by Educational Attainment in Franklin County
Average earnings in Franklin County are $52,140 for men and $40,281 for women, a difference of 22.7%. Men with an educational attainment of graduate degree enjoy the highest average annual earnings of $72,193, while those with less than high school education earn the least with $36,897. Women with an educational attainment of graduate degree earn the most with the average annual earnings of $59,265, while those with less than high school education have the smallest earnings of $22,344.
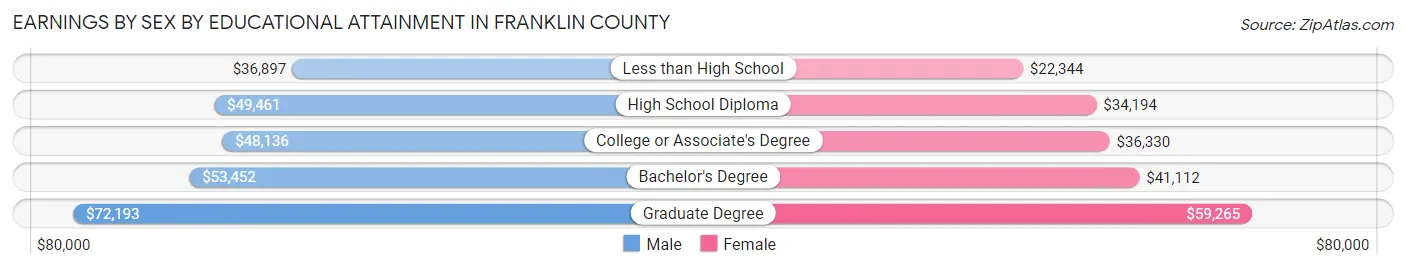
| Educational Attainment | Male Income | Female Income |
| Less than High School | $36,897 | $22,344 |
| High School Diploma | $49,461 | $34,194 |
| College or Associate's Degree | $48,136 | $36,330 |
| Bachelor's Degree | $53,452 | $41,112 |
| Graduate Degree | $72,193 | $59,265 |
| Total | $52,140 | $40,281 |
Family Income in Franklin County
Family Income Brackets in Franklin County
According to the Franklin County family income data, there are 4,496 families falling into the $100,000 to $149,999 income range, which is the most common income bracket and makes up 24.5% of all families. Conversely, the $10,000 to $14,999 income bracket is the least frequent group with only 367 families (2.0%) belonging to this category.
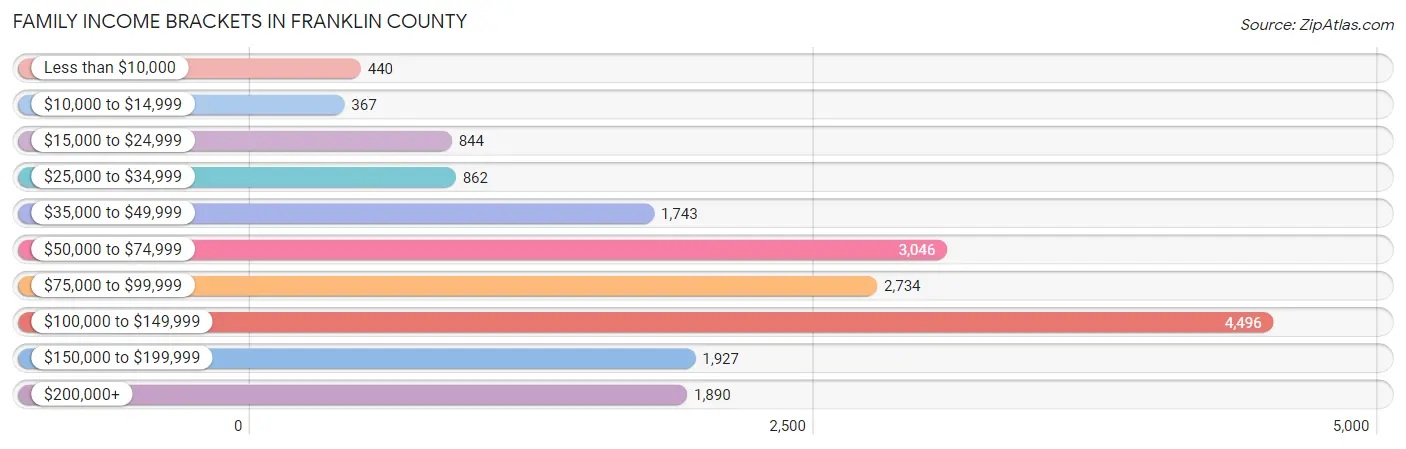
| Income Bracket | # Families | % Families |
| Less than $10,000 | 440 | 2.4% |
| $10,000 to $14,999 | 367 | 2.0% |
| $15,000 to $24,999 | 844 | 4.6% |
| $25,000 to $34,999 | 862 | 4.7% |
| $35,000 to $49,999 | 1,743 | 9.5% |
| $50,000 to $74,999 | 3,046 | 16.6% |
| $75,000 to $99,999 | 2,734 | 14.9% |
| $100,000 to $149,999 | 4,496 | 24.5% |
| $150,000 to $199,999 | 1,927 | 10.5% |
| $200,000+ | 1,890 | 10.3% |
Family Income by Famaliy Size in Franklin County
5-person families (803 | 4.4%) account for the highest median family income in Franklin County with $119,353 per family, while 2-person families (10,167 | 55.4%) have the highest median income of $40,799 per family member.
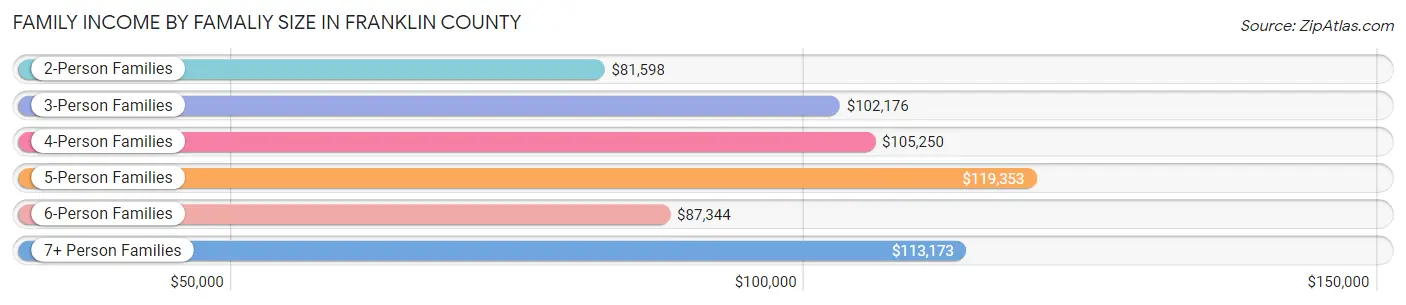
| Income Bracket | # Families | Median Income |
| 2-Person Families | 10,167 (55.4%) | $81,598 |
| 3-Person Families | 4,078 (22.2%) | $102,176 |
| 4-Person Families | 2,865 (15.6%) | $105,250 |
| 5-Person Families | 803 (4.4%) | $119,353 |
| 6-Person Families | 249 (1.4%) | $87,344 |
| 7+ Person Families | 189 (1.0%) | $113,173 |
| Total | 18,351 (100.0%) | $92,593 |
Family Income by Number of Earners in Franklin County
The median family income in Franklin County is $92,593, with families comprising 3+ earners (2,122) having the highest median family income of $141,740, while families with no earners (3,143) have the lowest median family income of $55,445, accounting for 11.6% and 17.1% of families, respectively.
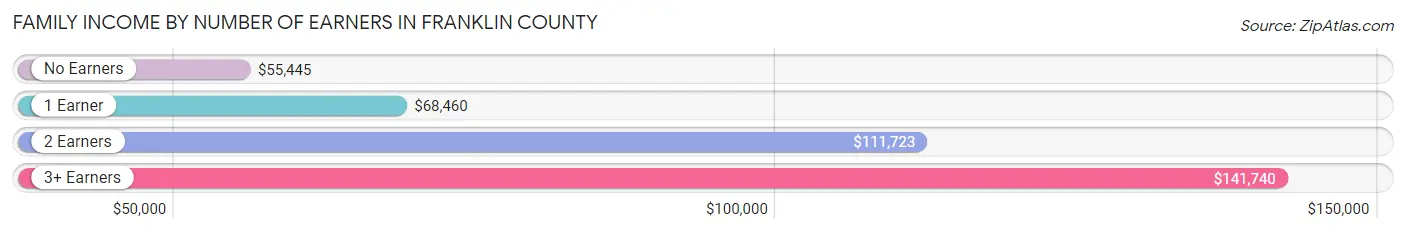
| Number of Earners | # Families | Median Income |
| No Earners | 3,143 (17.1%) | $55,445 |
| 1 Earner | 5,497 (29.9%) | $68,460 |
| 2 Earners | 7,589 (41.3%) | $111,723 |
| 3+ Earners | 2,122 (11.6%) | $141,740 |
| Total | 18,351 (100.0%) | $92,593 |
Household Income in Franklin County
Household Income Brackets in Franklin County
With 5,841 households falling in the category, the $50,000 to $74,999 income range is the most frequent in Franklin County, accounting for 18.7% of all households. In contrast, only 1,281 households (4.1%) fall into the less than $10,000 income bracket, making it the least populous group.
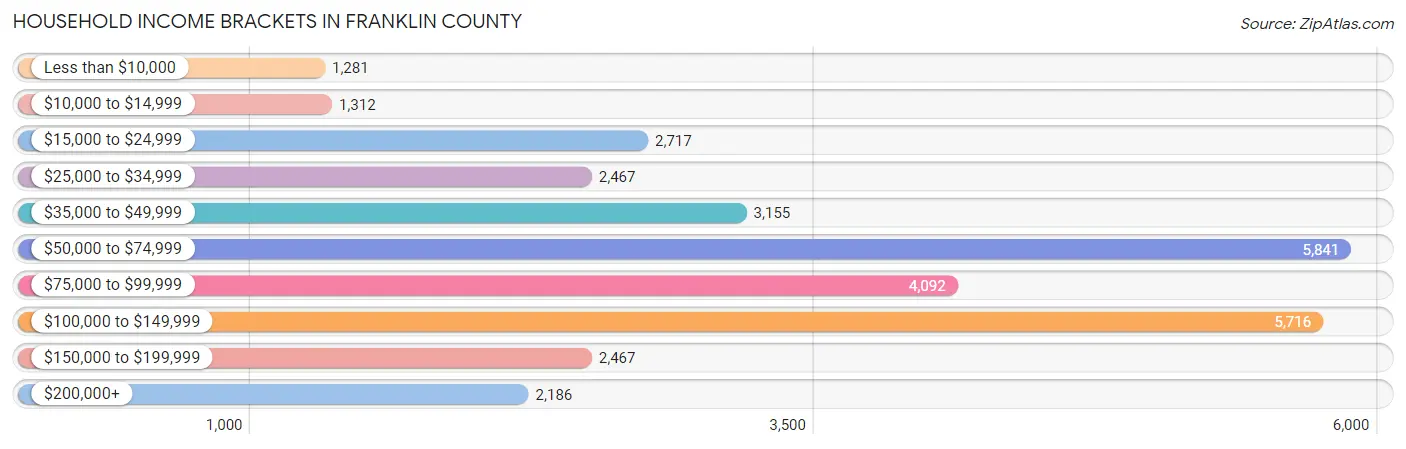
| Income Bracket | # Households | % Households |
| Less than $10,000 | 1,281 | 4.1% |
| $10,000 to $14,999 | 1,312 | 4.2% |
| $15,000 to $24,999 | 2,717 | 8.7% |
| $25,000 to $34,999 | 2,467 | 7.9% |
| $35,000 to $49,999 | 3,155 | 10.1% |
| $50,000 to $74,999 | 5,841 | 18.7% |
| $75,000 to $99,999 | 4,092 | 13.1% |
| $100,000 to $149,999 | 5,716 | 18.3% |
| $150,000 to $199,999 | 2,467 | 7.9% |
| $200,000+ | 2,186 | 7.0% |
Household Income by Householder Age in Franklin County
The median household income in Franklin County is $70,383, with the highest median household income of $84,406 found in the 45 to 64 years age bracket for the primary householder. A total of 11,628 households (37.2%) fall into this category. Meanwhile, the 15 to 24 years age bracket for the primary householder has the lowest median household income of $55,642, with 863 households (2.8%) in this group.
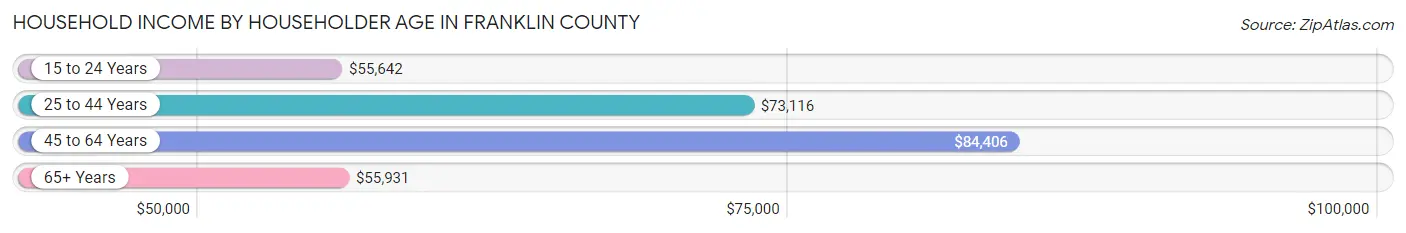
| Income Bracket | # Households | Median Income |
| 15 to 24 Years | 863 (2.8%) | $55,642 |
| 25 to 44 Years | 7,926 (25.4%) | $73,116 |
| 45 to 64 Years | 11,628 (37.2%) | $84,406 |
| 65+ Years | 10,817 (34.6%) | $55,931 |
| Total | 31,234 (100.0%) | $70,383 |
Poverty in Franklin County
Income Below Poverty by Sex and Age in Franklin County
With 10.4% poverty level for males and 13.5% for females among the residents of Franklin County, 5 year old males and 5 year old females are the most vulnerable to poverty, with 88 males (27.9%) and 71 females (22.4%) in their respective age groups living below the poverty level.
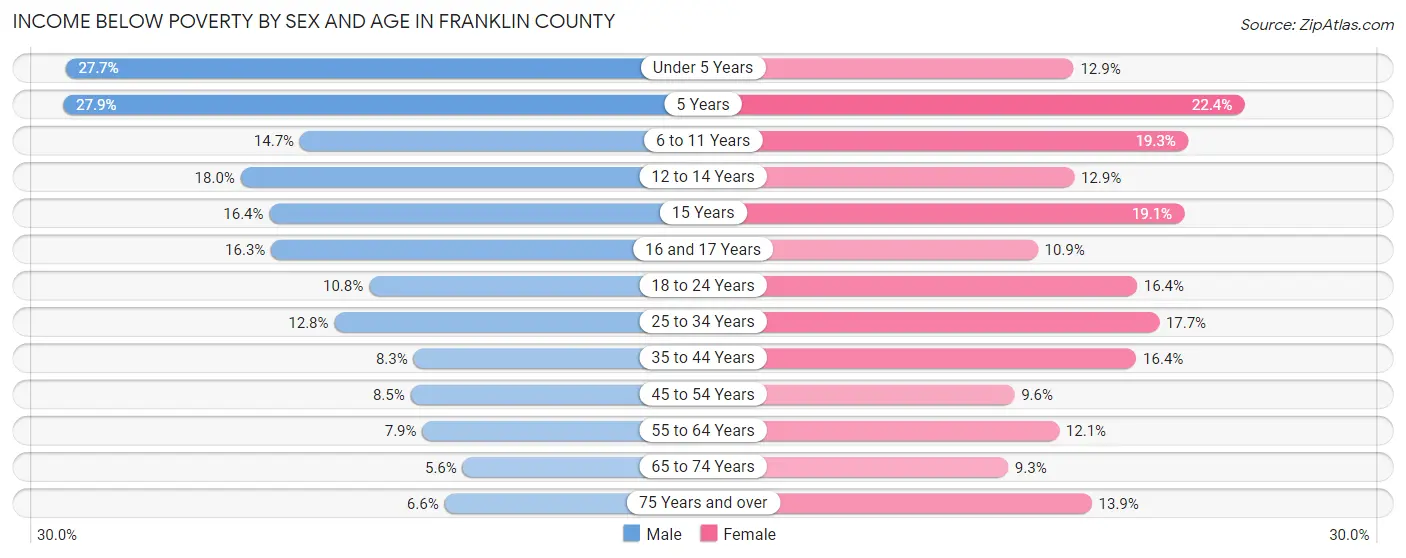
| Age Bracket | Male | Female |
| Under 5 Years | 389 (27.7%) | 161 (12.9%) |
| 5 Years | 88 (27.9%) | 71 (22.4%) |
| 6 to 11 Years | 323 (14.7%) | 338 (19.3%) |
| 12 to 14 Years | 166 (18.0%) | 138 (12.9%) |
| 15 Years | 73 (16.4%) | 48 (19.1%) |
| 16 and 17 Years | 135 (16.3%) | 87 (10.9%) |
| 18 to 24 Years | 275 (10.8%) | 364 (16.4%) |
| 25 to 34 Years | 533 (12.8%) | 726 (17.7%) |
| 35 to 44 Years | 357 (8.3%) | 721 (16.4%) |
| 45 to 54 Years | 370 (8.5%) | 434 (9.6%) |
| 55 to 64 Years | 438 (7.9%) | 732 (12.1%) |
| 65 to 74 Years | 278 (5.6%) | 502 (9.2%) |
| 75 Years and over | 164 (6.6%) | 449 (13.9%) |
| Total | 3,589 (10.4%) | 4,771 (13.5%) |
Income Above Poverty by Sex and Age in Franklin County
According to the poverty statistics in Franklin County, males aged 65 to 74 years and females aged 65 to 74 years are the age groups that are most secure financially, with 94.4% of males and 90.7% of females in these age groups living above the poverty line.
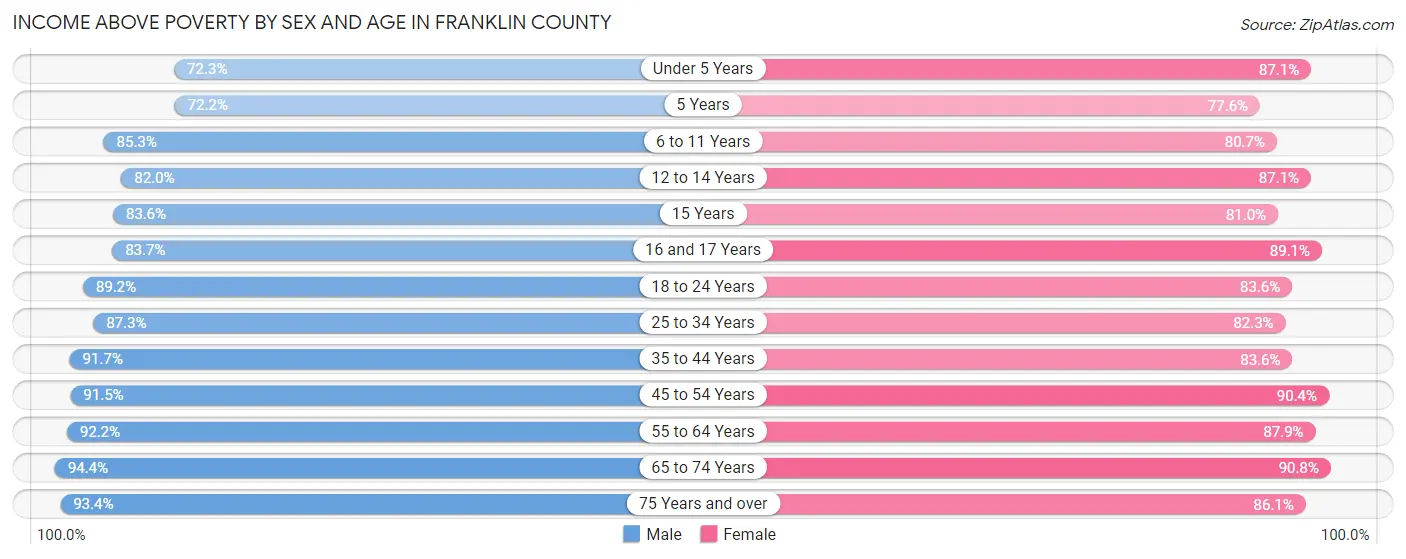
| Age Bracket | Male | Female |
| Under 5 Years | 1,014 (72.3%) | 1,087 (87.1%) |
| 5 Years | 228 (72.2%) | 246 (77.6%) |
| 6 to 11 Years | 1,879 (85.3%) | 1,417 (80.7%) |
| 12 to 14 Years | 758 (82.0%) | 929 (87.1%) |
| 15 Years | 373 (83.6%) | 204 (80.9%) |
| 16 and 17 Years | 695 (83.7%) | 711 (89.1%) |
| 18 to 24 Years | 2,267 (89.2%) | 1,852 (83.6%) |
| 25 to 34 Years | 3,647 (87.3%) | 3,386 (82.3%) |
| 35 to 44 Years | 3,924 (91.7%) | 3,678 (83.6%) |
| 45 to 54 Years | 3,977 (91.5%) | 4,087 (90.4%) |
| 55 to 64 Years | 5,145 (92.1%) | 5,321 (87.9%) |
| 65 to 74 Years | 4,679 (94.4%) | 4,924 (90.7%) |
| 75 Years and over | 2,313 (93.4%) | 2,779 (86.1%) |
| Total | 30,899 (89.6%) | 30,621 (86.5%) |
Income Below Poverty Among Married-Couple Families in Franklin County
The poverty statistics for married-couple families in Franklin County show that 3.6% or 480 of the total 13,458 families live below the poverty line. Families with 5 or more children have the highest poverty rate of 47.4%, comprising of 27 families. On the other hand, families with no children have the lowest poverty rate of 2.4%, which includes 215 families.
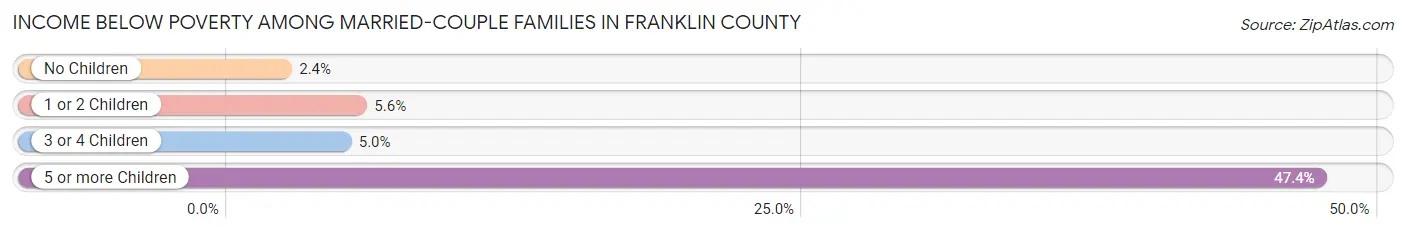
| Children | Above Poverty | Below Poverty |
| No Children | 8,898 (97.6%) | 215 (2.4%) |
| 1 or 2 Children | 3,570 (94.4%) | 213 (5.6%) |
| 3 or 4 Children | 480 (95.1%) | 25 (5.0%) |
| 5 or more Children | 30 (52.6%) | 27 (47.4%) |
| Total | 12,978 (96.4%) | 480 (3.6%) |
Income Below Poverty Among Single-Parent Households in Franklin County
According to the poverty data in Franklin County, 12.1% or 193 single-father households and 19.4% or 639 single-mother households are living below the poverty line. Among single-father households, those with 1 or 2 children have the highest poverty rate, with 150 households (20.3%) experiencing poverty. Likewise, among single-mother households, those with 3 or 4 children have the highest poverty rate, with 120 households (43.0%) falling below the poverty line.
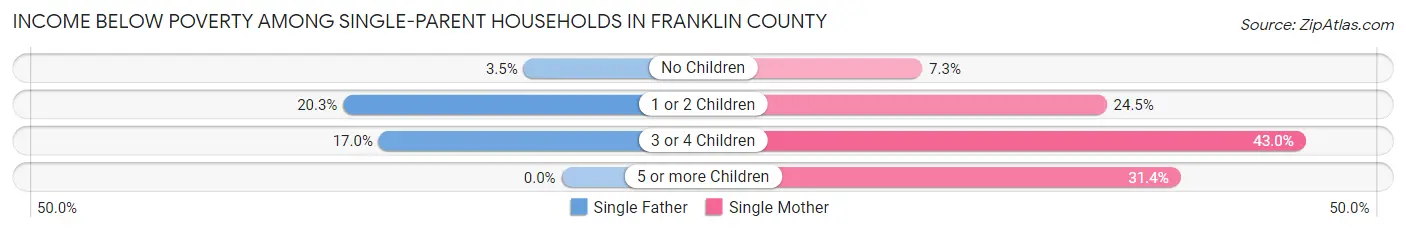
| Children | Single Father | Single Mother |
| No Children | 27 (3.5%) | 95 (7.3%) |
| 1 or 2 Children | 150 (20.3%) | 408 (24.5%) |
| 3 or 4 Children | 16 (17.0%) | 120 (43.0%) |
| 5 or more Children | 0 (0.0%) | 16 (31.4%) |
| Total | 193 (12.1%) | 639 (19.4%) |
Income Below Poverty Among Married-Couple vs Single-Parent Households in Franklin County
The poverty data for Franklin County shows that 480 of the married-couple family households (3.6%) and 832 of the single-parent households (17.0%) are living below the poverty level. Within the married-couple family households, those with 5 or more children have the highest poverty rate, with 27 households (47.4%) falling below the poverty line. Among the single-parent households, those with 3 or 4 children have the highest poverty rate, with 136 household (36.5%) living below poverty.
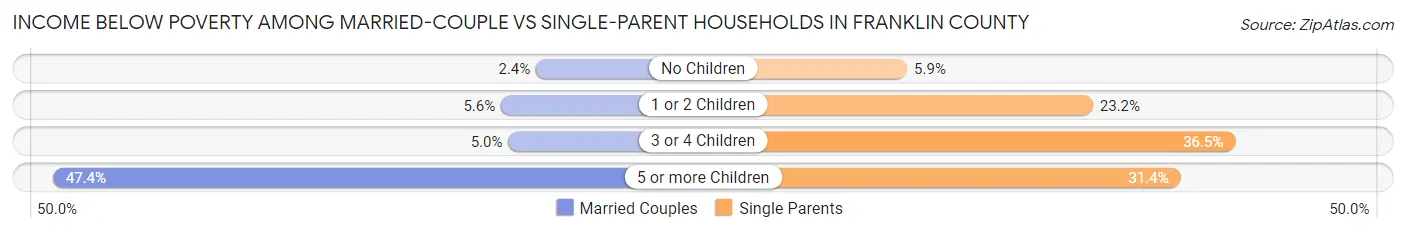
| Children | Married-Couple Families | Single-Parent Households |
| No Children | 215 (2.4%) | 122 (5.9%) |
| 1 or 2 Children | 213 (5.6%) | 558 (23.2%) |
| 3 or 4 Children | 25 (5.0%) | 136 (36.5%) |
| 5 or more Children | 27 (47.4%) | 16 (31.4%) |
| Total | 480 (3.6%) | 832 (17.0%) |
Employment Characteristics in Franklin County
Employment by Class of Employer in Franklin County
Among the 35,365 employed individuals in Franklin County, private company employees (18,968 | 53.6%), not-for-profit organizations (4,835 | 13.7%), and self-employed (not incorporated) (4,055 | 11.5%) make up the most common classes of employment.
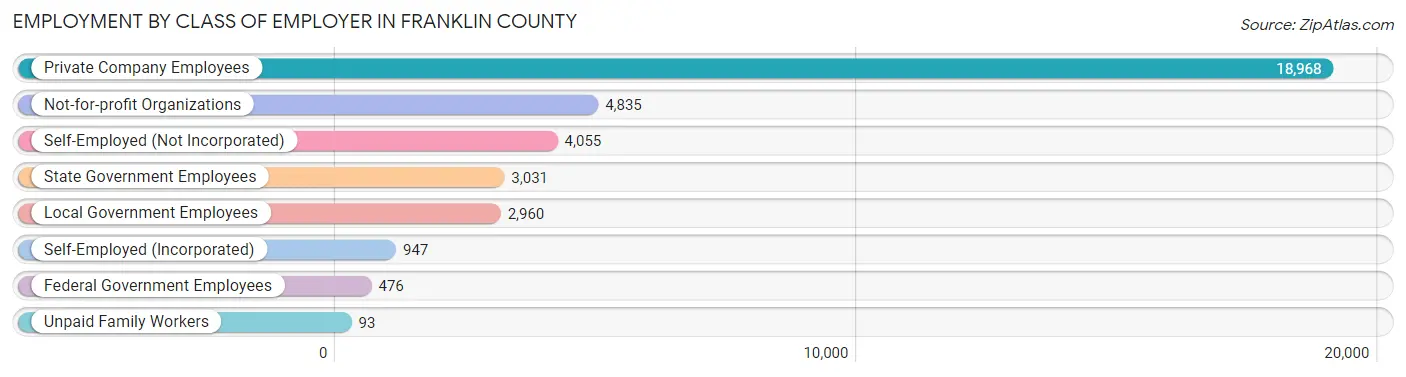
| Employer Class | # Employees | % Employees |
| Private Company Employees | 18,968 | 53.6% |
| Self-Employed (Incorporated) | 947 | 2.7% |
| Self-Employed (Not Incorporated) | 4,055 | 11.5% |
| Not-for-profit Organizations | 4,835 | 13.7% |
| Local Government Employees | 2,960 | 8.4% |
| State Government Employees | 3,031 | 8.6% |
| Federal Government Employees | 476 | 1.3% |
| Unpaid Family Workers | 93 | 0.3% |
| Total | 35,365 | 100.0% |
Employment Status by Age in Franklin County
According to the labor force statistics for Franklin County, out of the total population over 16 years of age (60,629), 63.1% or 38,257 individuals are in the labor force, with 5.7% or 2,181 of them unemployed. The age group with the highest labor force participation rate is 30 to 34 years, with 89.6% or 3,921 individuals in the labor force. Within the labor force, the 16 to 19 years age range has the highest percentage of unemployed individuals, with 17.7% or 242 of them being unemployed.
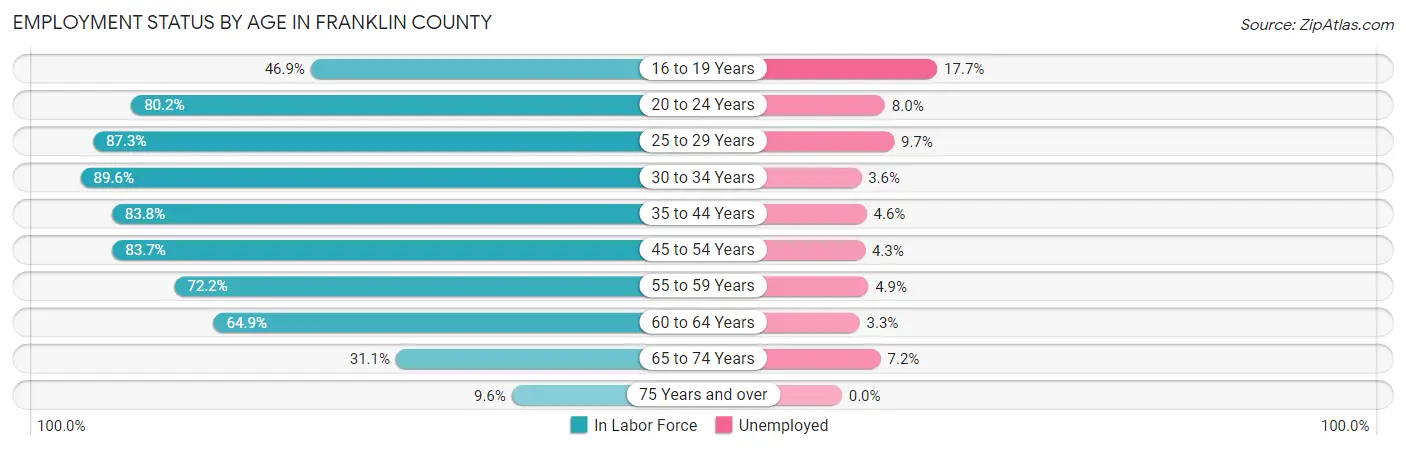
| Age Bracket | In Labor Force | Unemployed |
| 16 to 19 Years | 1,365 (46.9%) | 242 (17.7%) |
| 20 to 24 Years | 2,906 (80.2%) | 232 (8.0%) |
| 25 to 29 Years | 3,453 (87.3%) | 335 (9.7%) |
| 30 to 34 Years | 3,921 (89.6%) | 141 (3.6%) |
| 35 to 44 Years | 7,317 (83.8%) | 337 (4.6%) |
| 45 to 54 Years | 7,462 (83.7%) | 321 (4.3%) |
| 55 to 59 Years | 3,880 (72.2%) | 190 (4.9%) |
| 60 to 64 Years | 4,087 (64.9%) | 135 (3.3%) |
| 65 to 74 Years | 3,258 (31.1%) | 235 (7.2%) |
| 75 Years and over | 573 (9.6%) | 0 (0.0%) |
| Total | 38,257 (63.1%) | 2,181 (5.7%) |
Employment Status by Educational Attainment in Franklin County
According to labor force statistics for Franklin County, 80.0% of individuals (30,118) out of the total population between 25 and 64 years of age (37,648) are in the labor force, with 4.9% or 1,476 of them being unemployed. The group with the highest labor force participation rate are those with the educational attainment of bachelor's degree or higher, with 86.2% or 12,396 individuals in the labor force. Within the labor force, individuals with less than high school education have the highest percentage of unemployment, with 7.4% or 96 of them being unemployed.
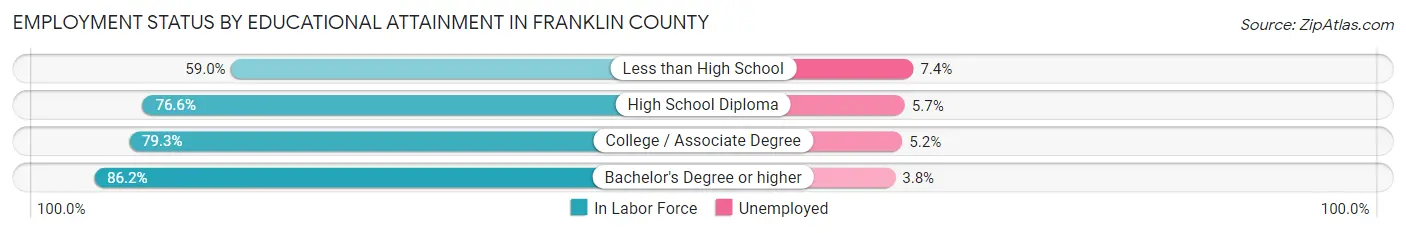
| Educational Attainment | In Labor Force | Unemployed |
| Less than High School | 1,303 (59.0%) | 163 (7.4%) |
| High School Diploma | 7,832 (76.6%) | 583 (5.7%) |
| College / Associate Degree | 8,591 (79.3%) | 563 (5.2%) |
| Bachelor's Degree or higher | 12,396 (86.2%) | 546 (3.8%) |
| Total | 30,118 (80.0%) | 1,845 (4.9%) |
Employment Occupations by Sex in Franklin County
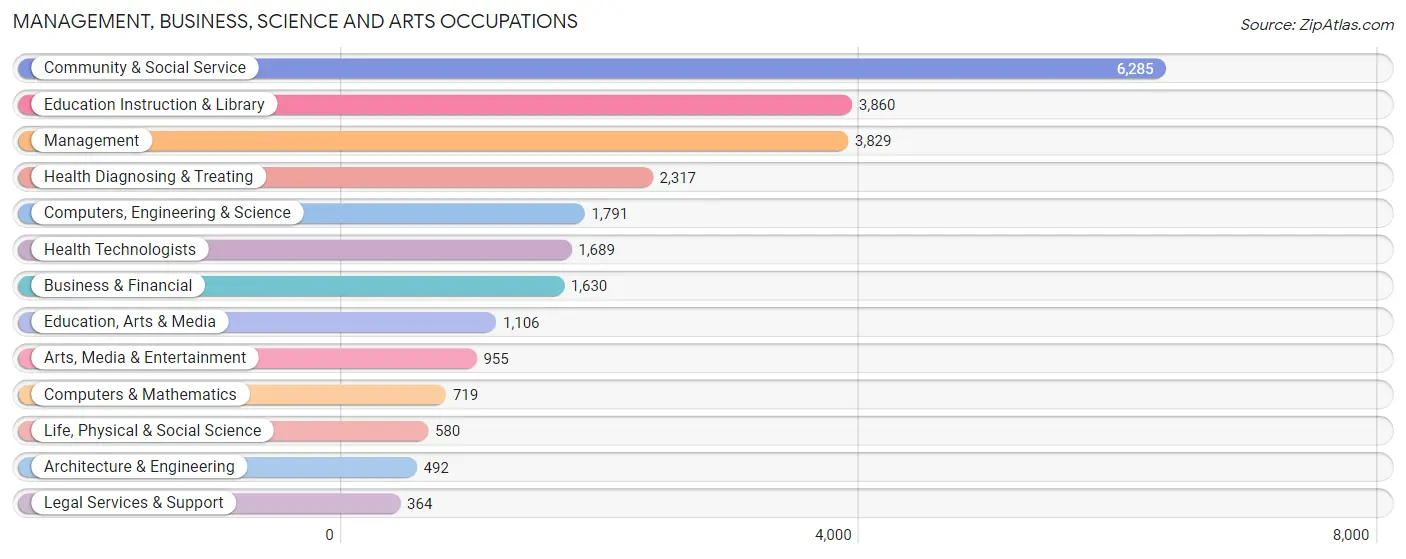
Management, Business, Science and Arts Occupations
The most common Management, Business, Science and Arts occupations in Franklin County are Community & Social Service (6,285 | 17.4%), Education Instruction & Library (3,860 | 10.7%), Management (3,829 | 10.6%), Health Diagnosing & Treating (2,317 | 6.4%), and Computers, Engineering & Science (1,791 | 5.0%).
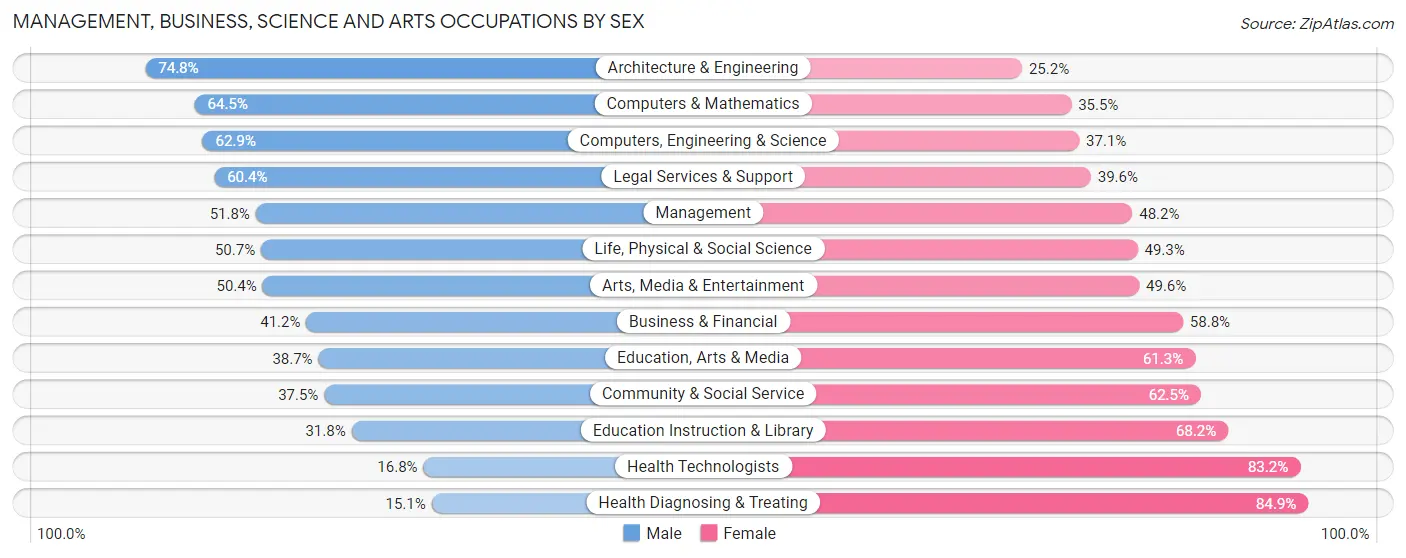
Management, Business, Science and Arts Occupations by Sex
Within the Management, Business, Science and Arts occupations in Franklin County, the most male-oriented occupations are Architecture & Engineering (74.8%), Computers & Mathematics (64.5%), and Computers, Engineering & Science (62.9%), while the most female-oriented occupations are Health Diagnosing & Treating (84.9%), Health Technologists (83.2%), and Education Instruction & Library (68.2%).
| Occupation | Male | Female |
| Management | 1,983 (51.8%) | 1,846 (48.2%) |
| Business & Financial | 672 (41.2%) | 958 (58.8%) |
| Computers, Engineering & Science | 1,126 (62.9%) | 665 (37.1%) |
| Computers & Mathematics | 464 (64.5%) | 255 (35.5%) |
| Architecture & Engineering | 368 (74.8%) | 124 (25.2%) |
| Life, Physical & Social Science | 294 (50.7%) | 286 (49.3%) |
| Community & Social Service | 2,357 (37.5%) | 3,928 (62.5%) |
| Education, Arts & Media | 428 (38.7%) | 678 (61.3%) |
| Legal Services & Support | 220 (60.4%) | 144 (39.6%) |
| Education Instruction & Library | 1,228 (31.8%) | 2,632 (68.2%) |
| Arts, Media & Entertainment | 481 (50.4%) | 474 (49.6%) |
| Health Diagnosing & Treating | 350 (15.1%) | 1,967 (84.9%) |
| Health Technologists | 284 (16.8%) | 1,405 (83.2%) |
| Total (Category) | 6,488 (40.9%) | 9,364 (59.1%) |
| Total (Overall) | 18,419 (51.1%) | 17,624 (48.9%) |
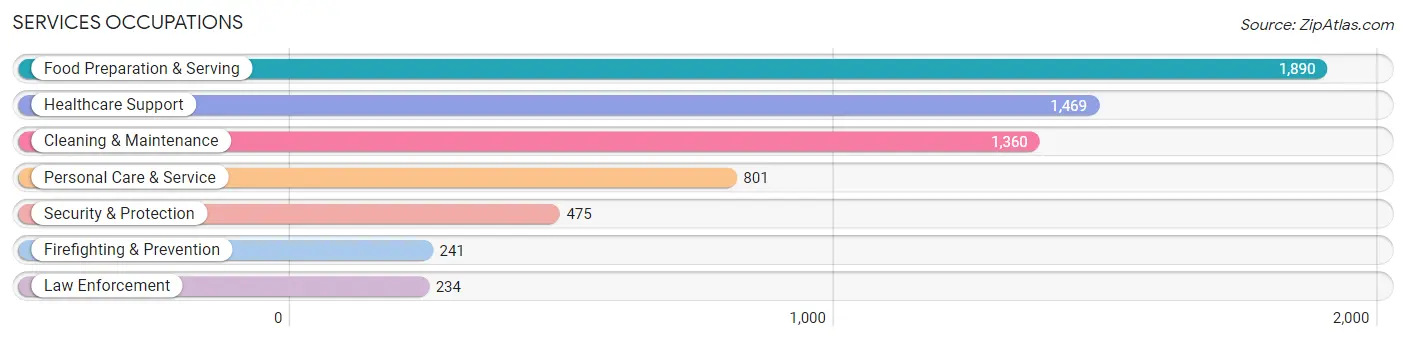
Services Occupations
The most common Services occupations in Franklin County are Food Preparation & Serving (1,890 | 5.2%), Healthcare Support (1,469 | 4.1%), Cleaning & Maintenance (1,360 | 3.8%), Personal Care & Service (801 | 2.2%), and Security & Protection (475 | 1.3%).
Services Occupations by Sex
Within the Services occupations in Franklin County, the most male-oriented occupations are Law Enforcement (84.2%), Security & Protection (82.1%), and Firefighting & Prevention (80.1%), while the most female-oriented occupations are Healthcare Support (78.6%), Personal Care & Service (68.8%), and Food Preparation & Serving (56.0%).
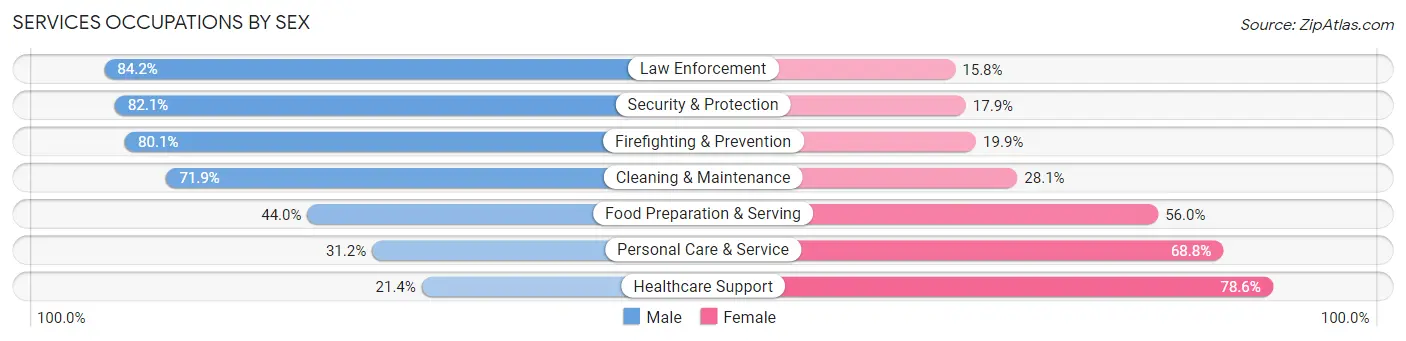
| Occupation | Male | Female |
| Healthcare Support | 314 (21.4%) | 1,155 (78.6%) |
| Security & Protection | 390 (82.1%) | 85 (17.9%) |
| Firefighting & Prevention | 193 (80.1%) | 48 (19.9%) |
| Law Enforcement | 197 (84.2%) | 37 (15.8%) |
| Food Preparation & Serving | 832 (44.0%) | 1,058 (56.0%) |
| Cleaning & Maintenance | 978 (71.9%) | 382 (28.1%) |
| Personal Care & Service | 250 (31.2%) | 551 (68.8%) |
| Total (Category) | 2,764 (46.1%) | 3,231 (53.9%) |
| Total (Overall) | 18,419 (51.1%) | 17,624 (48.9%) |
Sales and Office Occupations
The most common Sales and Office occupations in Franklin County are Office & Administration (3,539 | 9.8%), and Sales & Related (2,478 | 6.9%).

Sales and Office Occupations by Sex
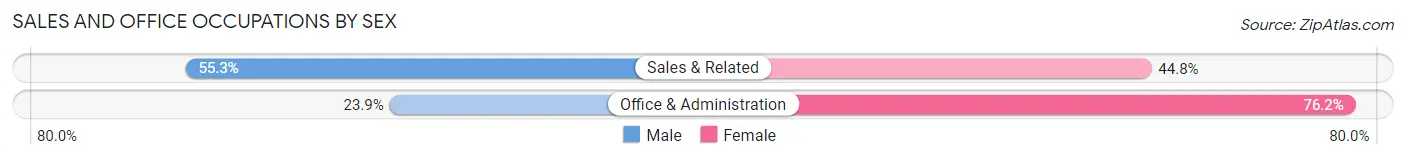
| Occupation | Male | Female |
| Sales & Related | 1,369 (55.2%) | 1,109 (44.8%) |
| Office & Administration | 844 (23.8%) | 2,695 (76.1%) |
| Total (Category) | 2,213 (36.8%) | 3,804 (63.2%) |
| Total (Overall) | 18,419 (51.1%) | 17,624 (48.9%) |
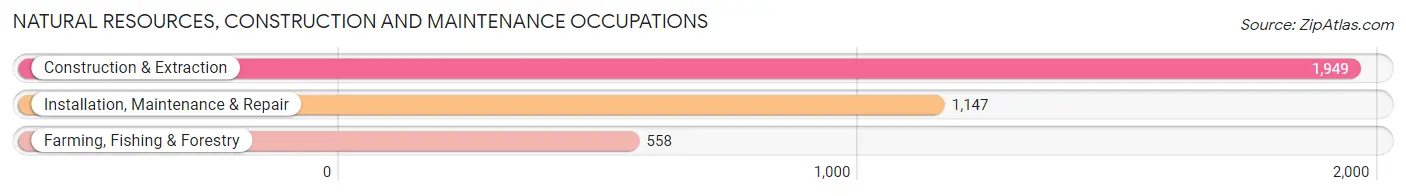
Natural Resources, Construction and Maintenance Occupations
The most common Natural Resources, Construction and Maintenance occupations in Franklin County are Construction & Extraction (1,949 | 5.4%), Installation, Maintenance & Repair (1,147 | 3.2%), and Farming, Fishing & Forestry (558 | 1.5%).
Natural Resources, Construction and Maintenance Occupations by Sex
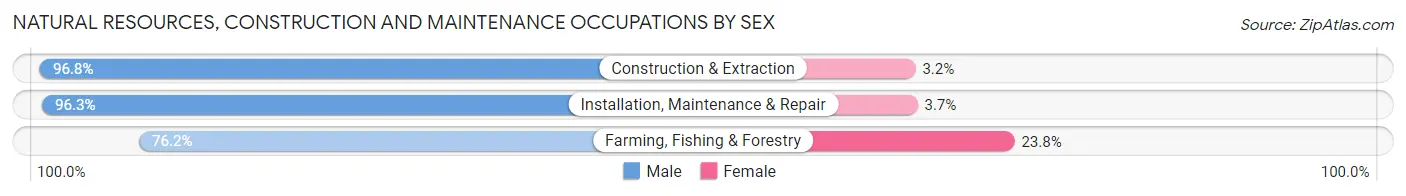
| Occupation | Male | Female |
| Farming, Fishing & Forestry | 425 (76.2%) | 133 (23.8%) |
| Construction & Extraction | 1,886 (96.8%) | 63 (3.2%) |
| Installation, Maintenance & Repair | 1,105 (96.3%) | 42 (3.7%) |
| Total (Category) | 3,416 (93.5%) | 238 (6.5%) |
| Total (Overall) | 18,419 (51.1%) | 17,624 (48.9%) |
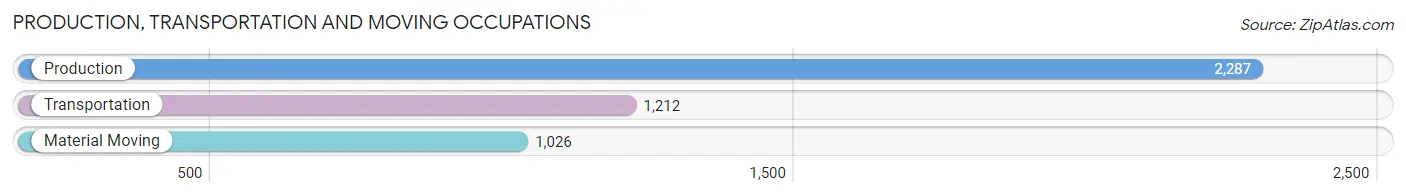
Production, Transportation and Moving Occupations
The most common Production, Transportation and Moving occupations in Franklin County are Production (2,287 | 6.4%), Transportation (1,212 | 3.4%), and Material Moving (1,026 | 2.9%).
Production, Transportation and Moving Occupations by Sex
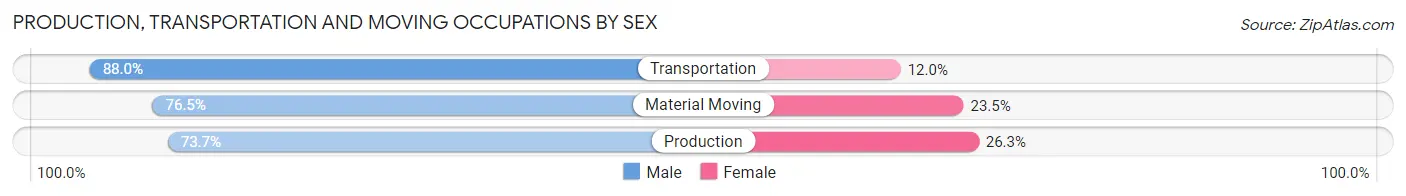
| Occupation | Male | Female |
| Production | 1,686 (73.7%) | 601 (26.3%) |
| Transportation | 1,067 (88.0%) | 145 (12.0%) |
| Material Moving | 785 (76.5%) | 241 (23.5%) |
| Total (Category) | 3,538 (78.2%) | 987 (21.8%) |
| Total (Overall) | 18,419 (51.1%) | 17,624 (48.9%) |
Employment Industries by Sex in Franklin County
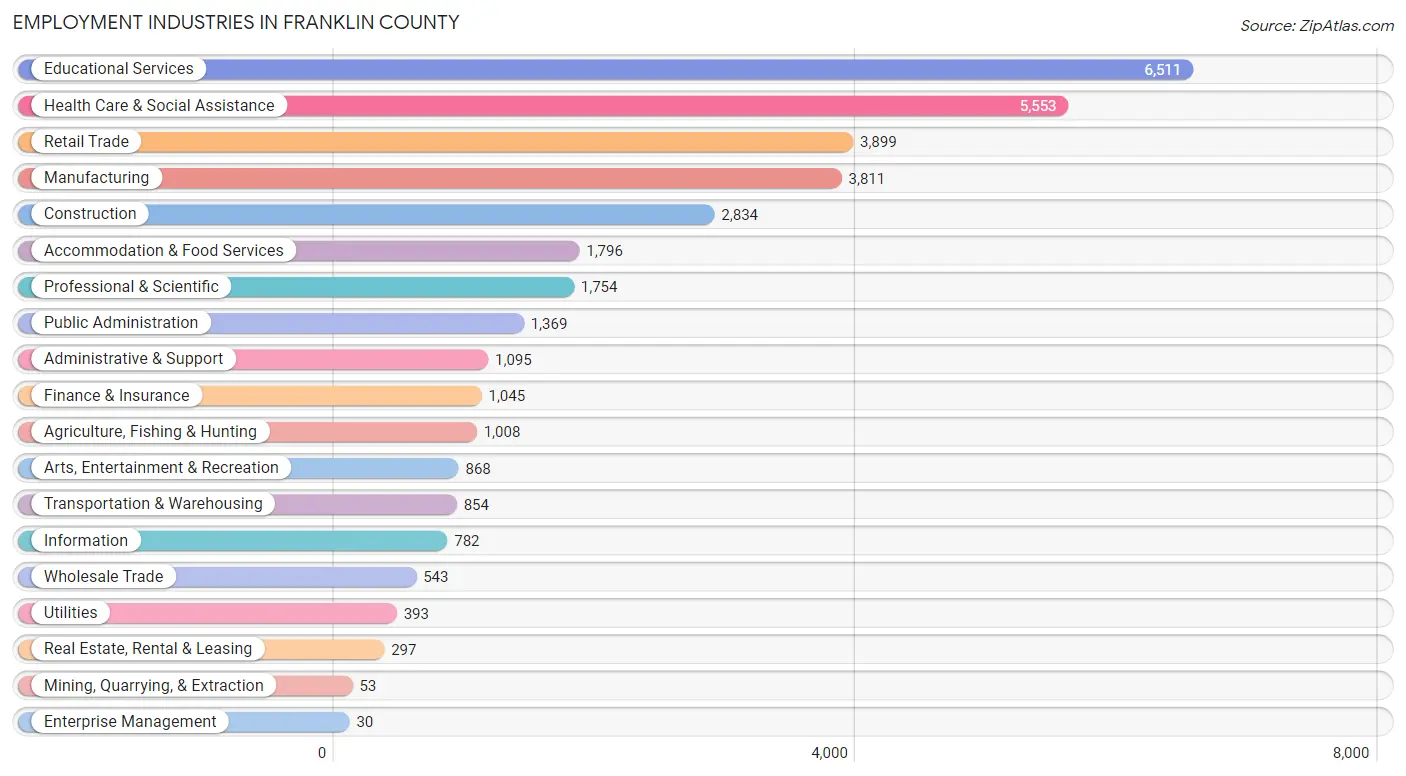
Employment Industries in Franklin County
The major employment industries in Franklin County include Educational Services (6,511 | 18.1%), Health Care & Social Assistance (5,553 | 15.4%), Retail Trade (3,899 | 10.8%), Manufacturing (3,811 | 10.6%), and Construction (2,834 | 7.9%).
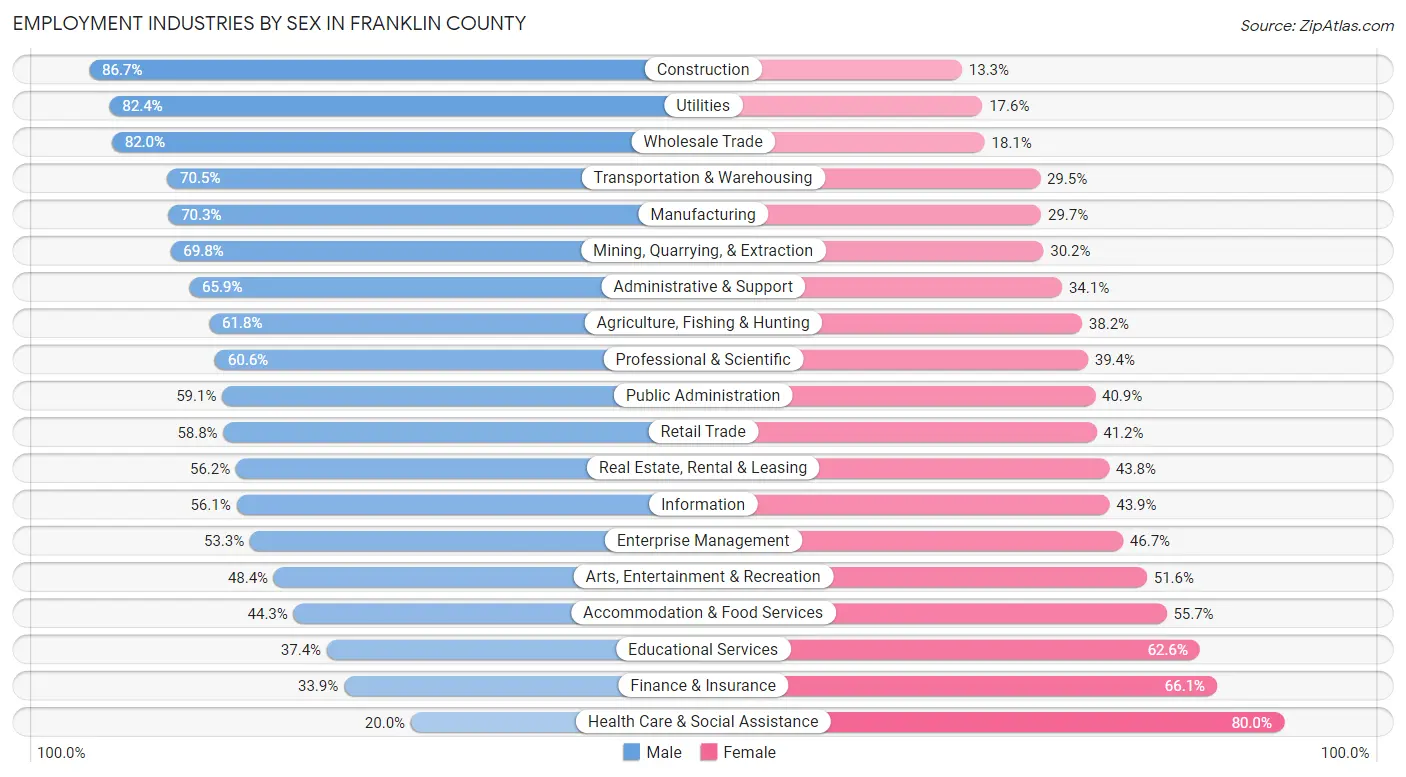
Employment Industries by Sex in Franklin County
The Franklin County industries that see more men than women are Construction (86.7%), Utilities (82.4%), and Wholesale Trade (82.0%), whereas the industries that tend to have a higher number of women are Health Care & Social Assistance (80.0%), Finance & Insurance (66.1%), and Educational Services (62.6%).
| Industry | Male | Female |
| Agriculture, Fishing & Hunting | 623 (61.8%) | 385 (38.2%) |
| Mining, Quarrying, & Extraction | 37 (69.8%) | 16 (30.2%) |
| Construction | 2,456 (86.7%) | 378 (13.3%) |
| Manufacturing | 2,678 (70.3%) | 1,133 (29.7%) |
| Wholesale Trade | 445 (82.0%) | 98 (18.0%) |
| Retail Trade | 2,294 (58.8%) | 1,605 (41.2%) |
| Transportation & Warehousing | 602 (70.5%) | 252 (29.5%) |
| Utilities | 324 (82.4%) | 69 (17.6%) |
| Information | 439 (56.1%) | 343 (43.9%) |
| Finance & Insurance | 354 (33.9%) | 691 (66.1%) |
| Real Estate, Rental & Leasing | 167 (56.2%) | 130 (43.8%) |
| Professional & Scientific | 1,063 (60.6%) | 691 (39.4%) |
| Enterprise Management | 16 (53.3%) | 14 (46.7%) |
| Administrative & Support | 722 (65.9%) | 373 (34.1%) |
| Educational Services | 2,437 (37.4%) | 4,074 (62.6%) |
| Health Care & Social Assistance | 1,113 (20.0%) | 4,440 (80.0%) |
| Arts, Entertainment & Recreation | 420 (48.4%) | 448 (51.6%) |
| Accommodation & Food Services | 796 (44.3%) | 1,000 (55.7%) |
| Public Administration | 809 (59.1%) | 560 (40.9%) |
| Total | 18,419 (51.1%) | 17,624 (48.9%) |
Education in Franklin County
School Enrollment in Franklin County
The most common levels of schooling among the 13,583 students in Franklin County are middle school (2,949 | 21.7%), high school (2,937 | 21.6%), and elementary school (2,529 | 18.6%).
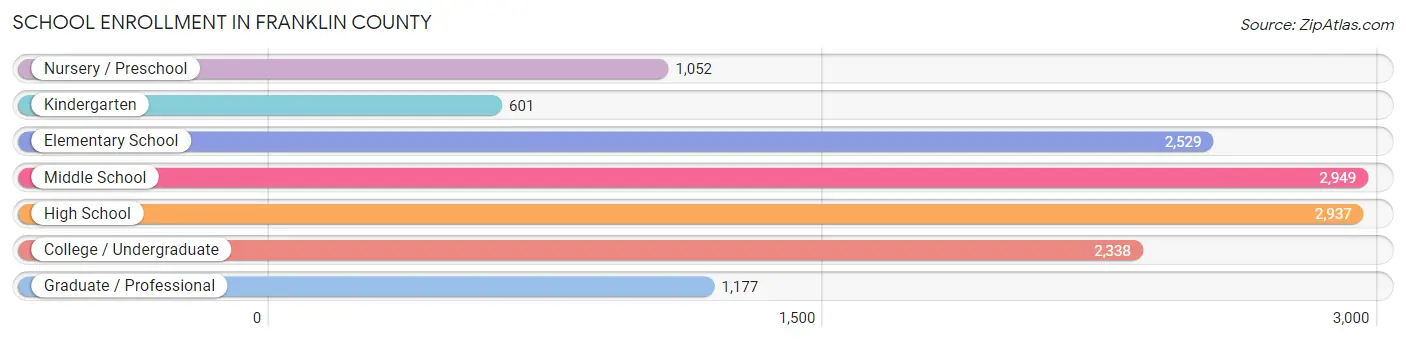
| School Level | # Students | % Students |
| Nursery / Preschool | 1,052 | 7.7% |
| Kindergarten | 601 | 4.4% |
| Elementary School | 2,529 | 18.6% |
| Middle School | 2,949 | 21.7% |
| High School | 2,937 | 21.6% |
| College / Undergraduate | 2,338 | 17.2% |
| Graduate / Professional | 1,177 | 8.7% |
| Total | 13,583 | 100.0% |
School Enrollment by Age by Funding Source in Franklin County
Out of a total of 13,583 students who are enrolled in schools in Franklin County, 2,105 (15.5%) attend a private institution, while the remaining 11,478 (84.5%) are enrolled in public schools. The age group of 3 to 4 year olds has the highest likelihood of being enrolled in private schools, with 324 (44.4% in the age bracket) enrolled. Conversely, the age group of 5 to 9 year old has the lowest likelihood of being enrolled in a private school, with 2,842 (89.5% in the age bracket) attending a public institution.
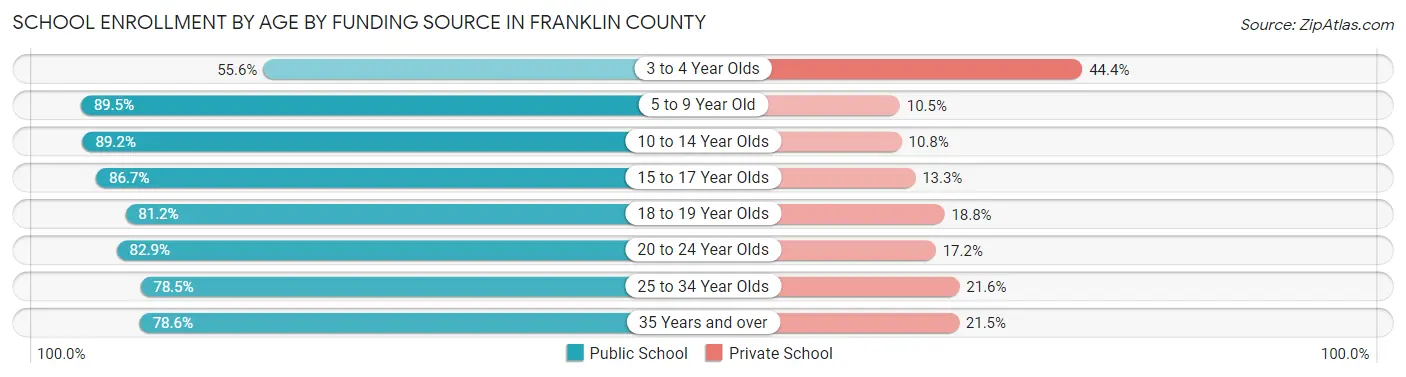
| Age Bracket | Public School | Private School |
| 3 to 4 Year Olds | 405 (55.6%) | 324 (44.4%) |
| 5 to 9 Year Old | 2,842 (89.5%) | 332 (10.5%) |
| 10 to 14 Year Olds | 3,043 (89.2%) | 368 (10.8%) |
| 15 to 17 Year Olds | 1,972 (86.7%) | 303 (13.3%) |
| 18 to 19 Year Olds | 675 (81.2%) | 156 (18.8%) |
| 20 to 24 Year Olds | 1,145 (82.9%) | 237 (17.2%) |
| 25 to 34 Year Olds | 812 (78.4%) | 223 (21.5%) |
| 35 Years and over | 586 (78.5%) | 160 (21.4%) |
| Total | 11,478 (84.5%) | 2,105 (15.5%) |
Educational Attainment by Field of Study in Franklin County
Social sciences (2,639 | 11.1%), education (2,569 | 10.8%), literature & languages (2,406 | 10.1%), bio, nature & agricultural (2,171 | 9.1%), and business (2,064 | 8.7%) are the most common fields of study among 23,738 individuals in Franklin County who have obtained a bachelor's degree or higher.
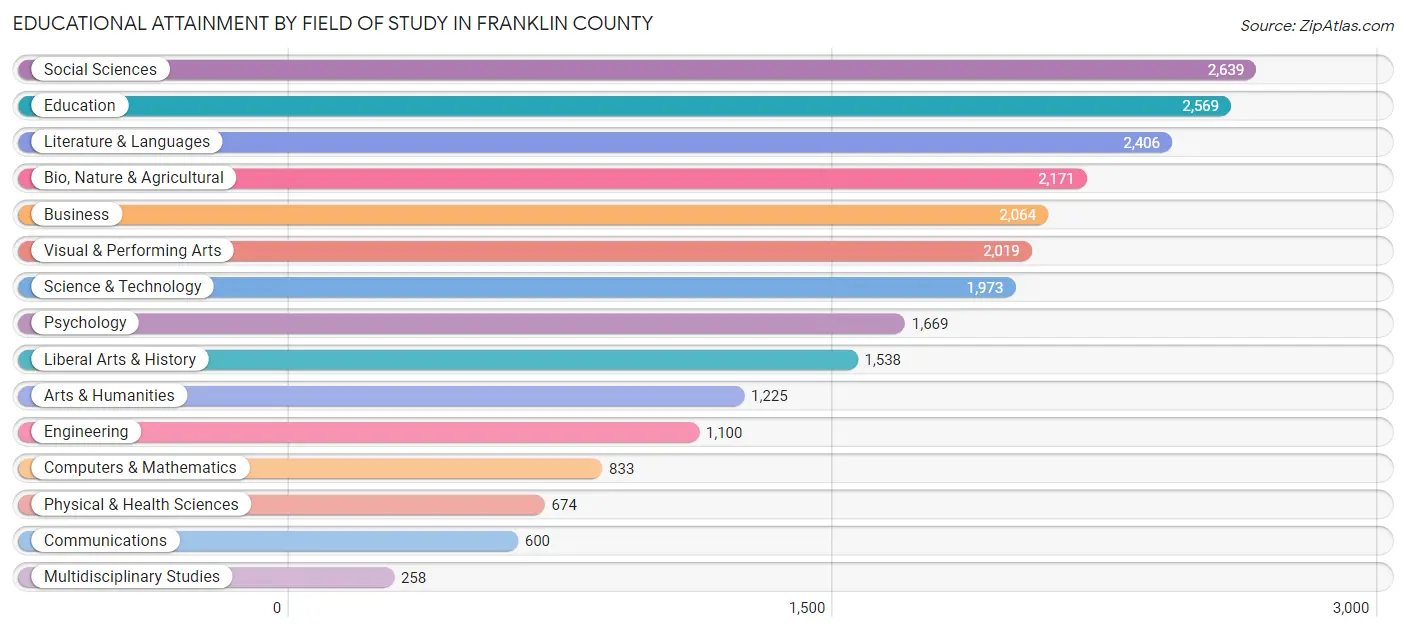
| Field of Study | # Graduates | % Graduates |
| Computers & Mathematics | 833 | 3.5% |
| Bio, Nature & Agricultural | 2,171 | 9.1% |
| Physical & Health Sciences | 674 | 2.8% |
| Psychology | 1,669 | 7.0% |
| Social Sciences | 2,639 | 11.1% |
| Engineering | 1,100 | 4.6% |
| Multidisciplinary Studies | 258 | 1.1% |
| Science & Technology | 1,973 | 8.3% |
| Business | 2,064 | 8.7% |
| Education | 2,569 | 10.8% |
| Literature & Languages | 2,406 | 10.1% |
| Liberal Arts & History | 1,538 | 6.5% |
| Visual & Performing Arts | 2,019 | 8.5% |
| Communications | 600 | 2.5% |
| Arts & Humanities | 1,225 | 5.2% |
| Total | 23,738 | 100.0% |
Transportation & Commute in Franklin County
Vehicle Availability by Sex in Franklin County
The most prevalent vehicle ownership categories in Franklin County are males with 2 vehicles (8,580, accounting for 47.7%) and females with 2 vehicles (7,858, making up 50.4%).
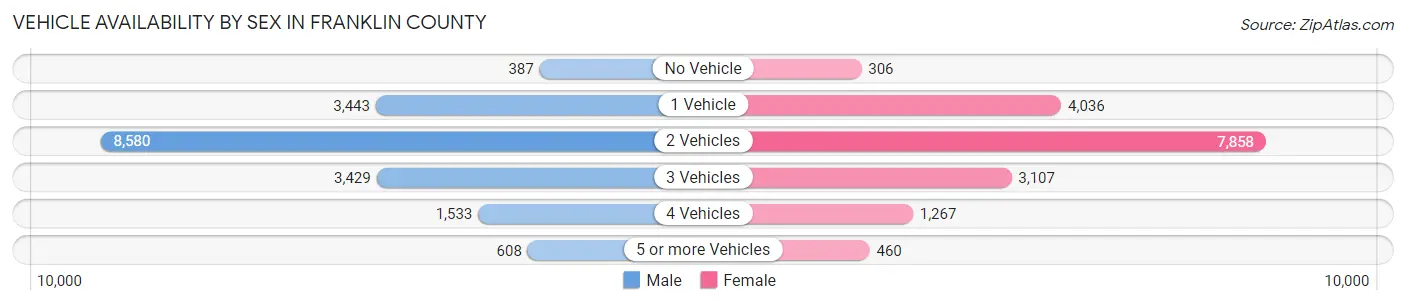
| Vehicles Available | Male | Female |
| No Vehicle | 387 (2.1%) | 306 (1.8%) |
| 1 Vehicle | 3,443 (19.2%) | 4,036 (23.7%) |
| 2 Vehicles | 8,580 (47.7%) | 7,858 (46.1%) |
| 3 Vehicles | 3,429 (19.1%) | 3,107 (18.2%) |
| 4 Vehicles | 1,533 (8.5%) | 1,267 (7.4%) |
| 5 or more Vehicles | 608 (3.4%) | 460 (2.7%) |
| Total | 17,980 (100.0%) | 17,034 (100.0%) |
Commute Time in Franklin County
The most frequently occuring commute durations in Franklin County are 15 to 19 minutes (4,881 commuters, 16.0%), 5 to 9 minutes (4,365 commuters, 14.3%), and 30 to 34 minutes (3,769 commuters, 12.3%).
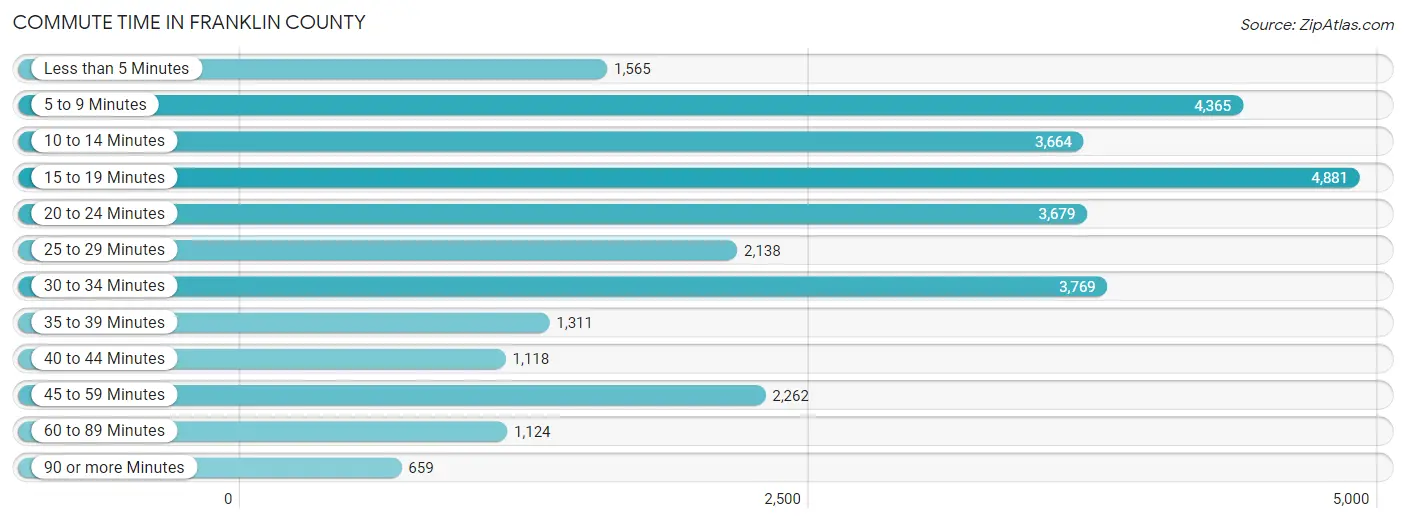
| Commute Time | # Commuters | % Commuters |
| Less than 5 Minutes | 1,565 | 5.1% |
| 5 to 9 Minutes | 4,365 | 14.3% |
| 10 to 14 Minutes | 3,664 | 12.0% |
| 15 to 19 Minutes | 4,881 | 16.0% |
| 20 to 24 Minutes | 3,679 | 12.0% |
| 25 to 29 Minutes | 2,138 | 7.0% |
| 30 to 34 Minutes | 3,769 | 12.3% |
| 35 to 39 Minutes | 1,311 | 4.3% |
| 40 to 44 Minutes | 1,118 | 3.7% |
| 45 to 59 Minutes | 2,262 | 7.4% |
| 60 to 89 Minutes | 1,124 | 3.7% |
| 90 or more Minutes | 659 | 2.2% |
Commute Time by Sex in Franklin County
The most common commute times in Franklin County are 15 to 19 minutes (2,441 commuters, 15.2%) for males and 15 to 19 minutes (2,440 commuters, 16.8%) for females.
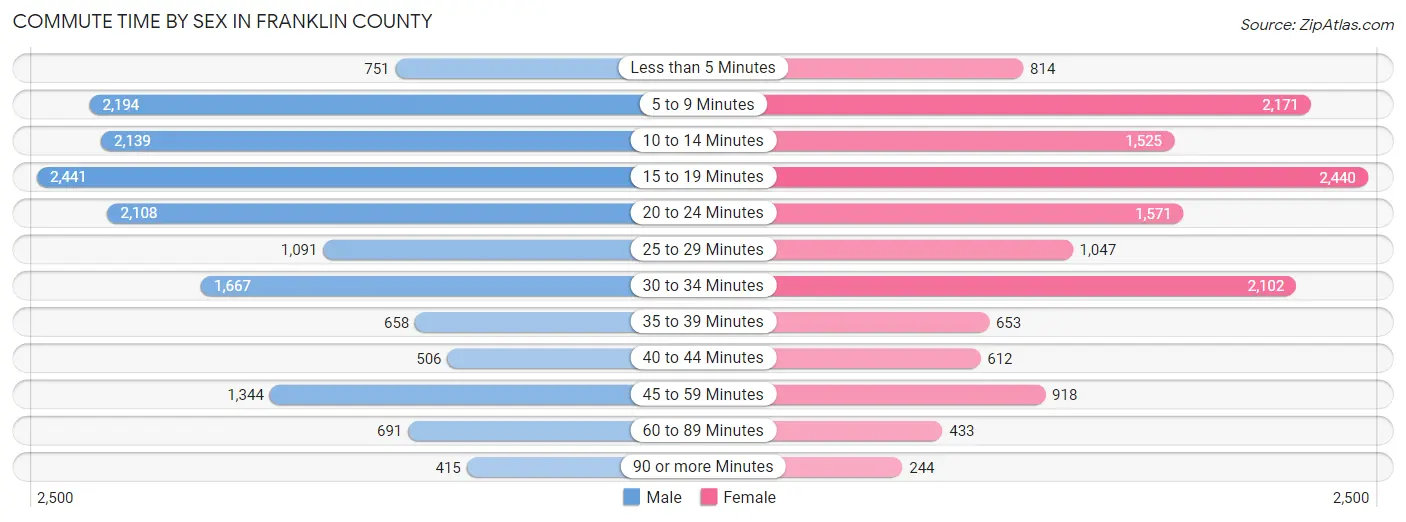
| Commute Time | Male | Female |
| Less than 5 Minutes | 751 (4.7%) | 814 (5.6%) |
| 5 to 9 Minutes | 2,194 (13.7%) | 2,171 (14.9%) |
| 10 to 14 Minutes | 2,139 (13.4%) | 1,525 (10.5%) |
| 15 to 19 Minutes | 2,441 (15.2%) | 2,440 (16.8%) |
| 20 to 24 Minutes | 2,108 (13.2%) | 1,571 (10.8%) |
| 25 to 29 Minutes | 1,091 (6.8%) | 1,047 (7.2%) |
| 30 to 34 Minutes | 1,667 (10.4%) | 2,102 (14.5%) |
| 35 to 39 Minutes | 658 (4.1%) | 653 (4.5%) |
| 40 to 44 Minutes | 506 (3.2%) | 612 (4.2%) |
| 45 to 59 Minutes | 1,344 (8.4%) | 918 (6.3%) |
| 60 to 89 Minutes | 691 (4.3%) | 433 (3.0%) |
| 90 or more Minutes | 415 (2.6%) | 244 (1.7%) |
Time of Departure to Work by Sex in Franklin County
The most frequent times of departure to work in Franklin County are 7:00 AM to 7:29 AM (1,897, 11.8%) for males and 7:30 AM to 7:59 AM (2,615, 18.0%) for females.
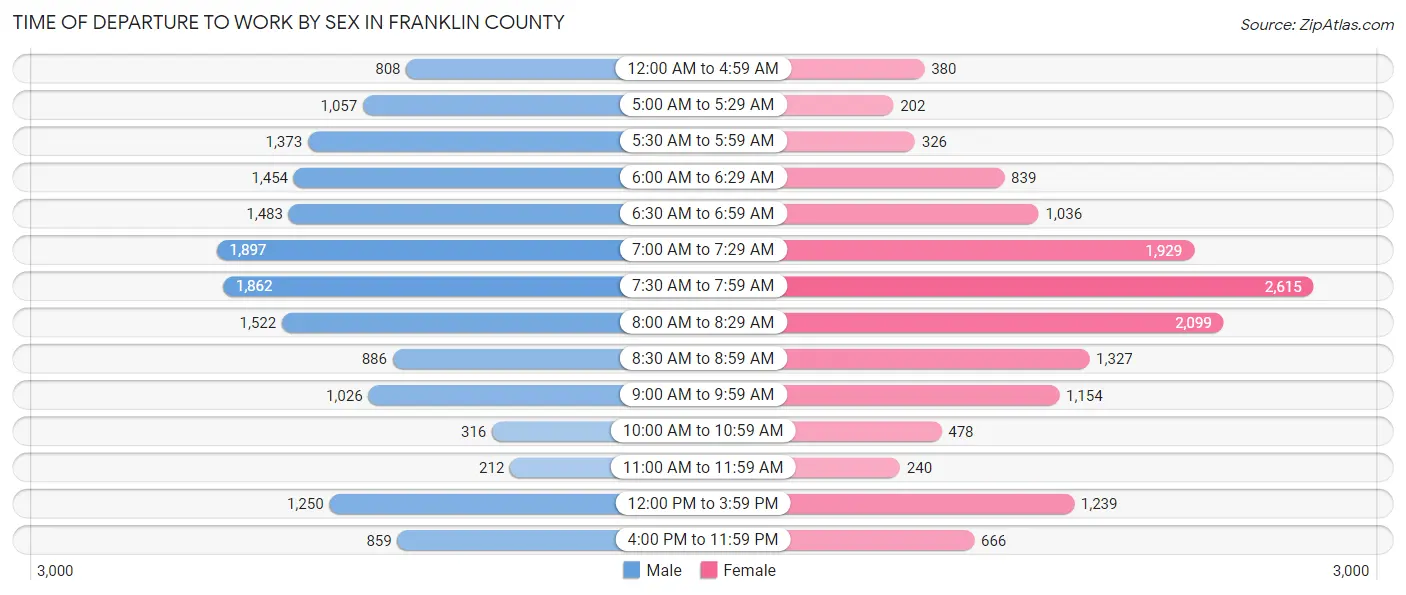
| Time of Departure | Male | Female |
| 12:00 AM to 4:59 AM | 808 (5.1%) | 380 (2.6%) |
| 5:00 AM to 5:29 AM | 1,057 (6.6%) | 202 (1.4%) |
| 5:30 AM to 5:59 AM | 1,373 (8.6%) | 326 (2.2%) |
| 6:00 AM to 6:29 AM | 1,454 (9.1%) | 839 (5.8%) |
| 6:30 AM to 6:59 AM | 1,483 (9.3%) | 1,036 (7.1%) |
| 7:00 AM to 7:29 AM | 1,897 (11.8%) | 1,929 (13.3%) |
| 7:30 AM to 7:59 AM | 1,862 (11.6%) | 2,615 (18.0%) |
| 8:00 AM to 8:29 AM | 1,522 (9.5%) | 2,099 (14.4%) |
| 8:30 AM to 8:59 AM | 886 (5.5%) | 1,327 (9.1%) |
| 9:00 AM to 9:59 AM | 1,026 (6.4%) | 1,154 (7.9%) |
| 10:00 AM to 10:59 AM | 316 (2.0%) | 478 (3.3%) |
| 11:00 AM to 11:59 AM | 212 (1.3%) | 240 (1.7%) |
| 12:00 PM to 3:59 PM | 1,250 (7.8%) | 1,239 (8.5%) |
| 4:00 PM to 11:59 PM | 859 (5.4%) | 666 (4.6%) |
| Total | 16,005 (100.0%) | 14,530 (100.0%) |
Housing Occupancy in Franklin County
Occupancy by Ownership in Franklin County
Of the total 31,234 dwellings in Franklin County, owner-occupied units account for 21,737 (69.6%), while renter-occupied units make up 9,497 (30.4%).
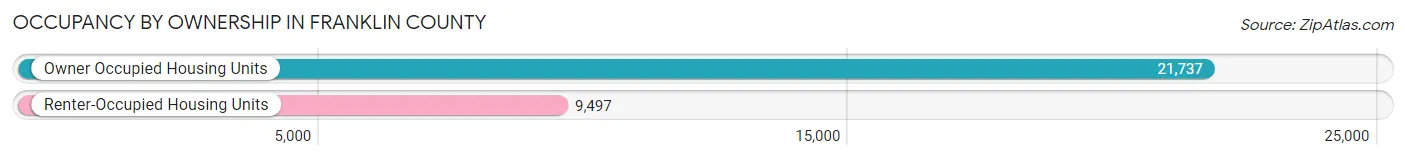
| Occupancy | # Housing Units | % Housing Units |
| Owner Occupied Housing Units | 21,737 | 69.6% |
| Renter-Occupied Housing Units | 9,497 | 30.4% |
| Total Occupied Housing Units | 31,234 | 100.0% |
Occupancy by Household Size in Franklin County
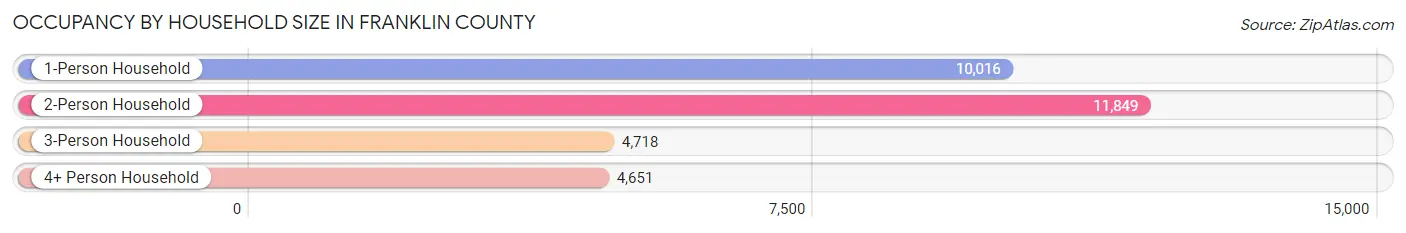
| Household Size | # Housing Units | % Housing Units |
| 1-Person Household | 10,016 | 32.1% |
| 2-Person Household | 11,849 | 37.9% |
| 3-Person Household | 4,718 | 15.1% |
| 4+ Person Household | 4,651 | 14.9% |
| Total Housing Units | 31,234 | 100.0% |
Occupancy by Ownership by Household Size in Franklin County
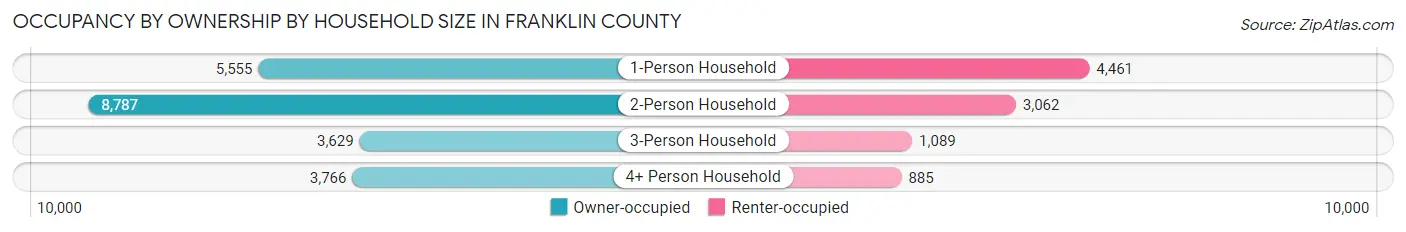
| Household Size | Owner-occupied | Renter-occupied |
| 1-Person Household | 5,555 (55.5%) | 4,461 (44.5%) |
| 2-Person Household | 8,787 (74.2%) | 3,062 (25.8%) |
| 3-Person Household | 3,629 (76.9%) | 1,089 (23.1%) |
| 4+ Person Household | 3,766 (81.0%) | 885 (19.0%) |
| Total Housing Units | 21,737 (69.6%) | 9,497 (30.4%) |
Occupancy by Educational Attainment in Franklin County
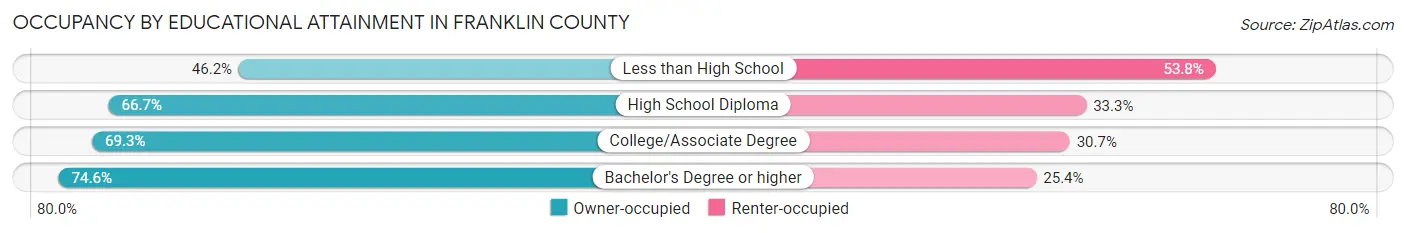
| Household Size | Owner-occupied | Renter-occupied |
| Less than High School | 813 (46.2%) | 948 (53.8%) |
| High School Diploma | 4,872 (66.7%) | 2,435 (33.3%) |
| College/Associate Degree | 6,317 (69.3%) | 2,798 (30.7%) |
| Bachelor's Degree or higher | 9,735 (74.6%) | 3,316 (25.4%) |
Occupancy by Age of Householder in Franklin County
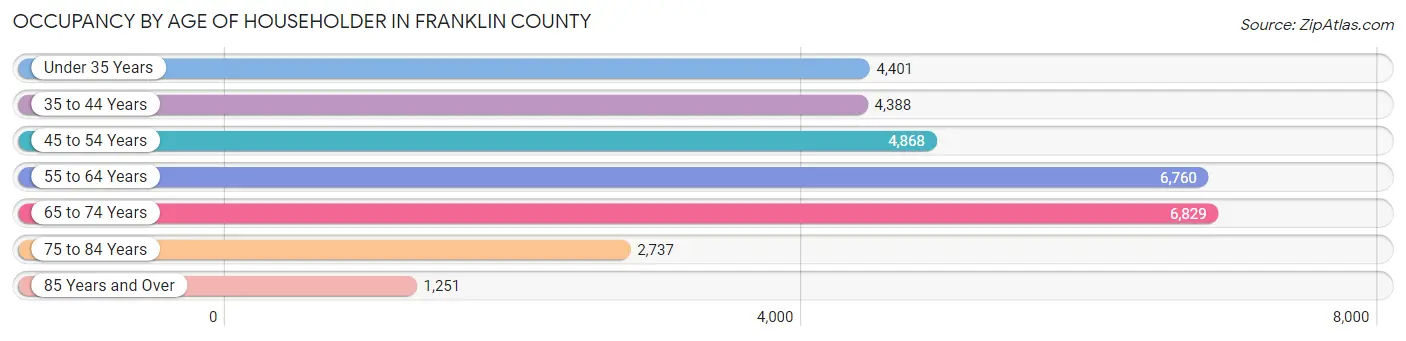
| Age Bracket | # Households | % Households |
| Under 35 Years | 4,401 | 14.1% |
| 35 to 44 Years | 4,388 | 14.1% |
| 45 to 54 Years | 4,868 | 15.6% |
| 55 to 64 Years | 6,760 | 21.6% |
| 65 to 74 Years | 6,829 | 21.9% |
| 75 to 84 Years | 2,737 | 8.8% |
| 85 Years and Over | 1,251 | 4.0% |
| Total | 31,234 | 100.0% |
Housing Finances in Franklin County
Median Income by Occupancy in Franklin County
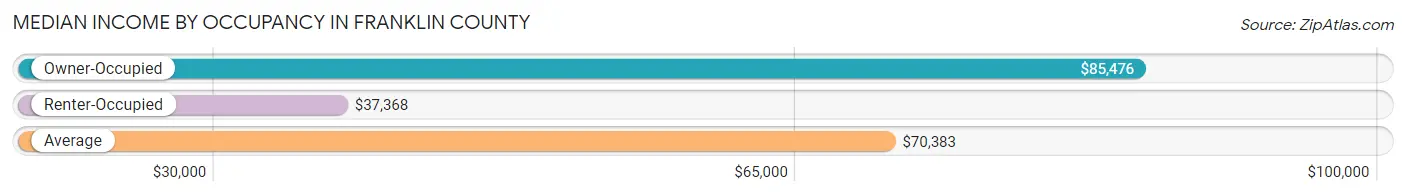
| Occupancy Type | # Households | Median Income |
| Owner-Occupied | 21,737 (69.6%) | $85,476 |
| Renter-Occupied | 9,497 (30.4%) | $37,368 |
| Average | 31,234 (100.0%) | $70,383 |
Occupancy by Householder Income Bracket in Franklin County
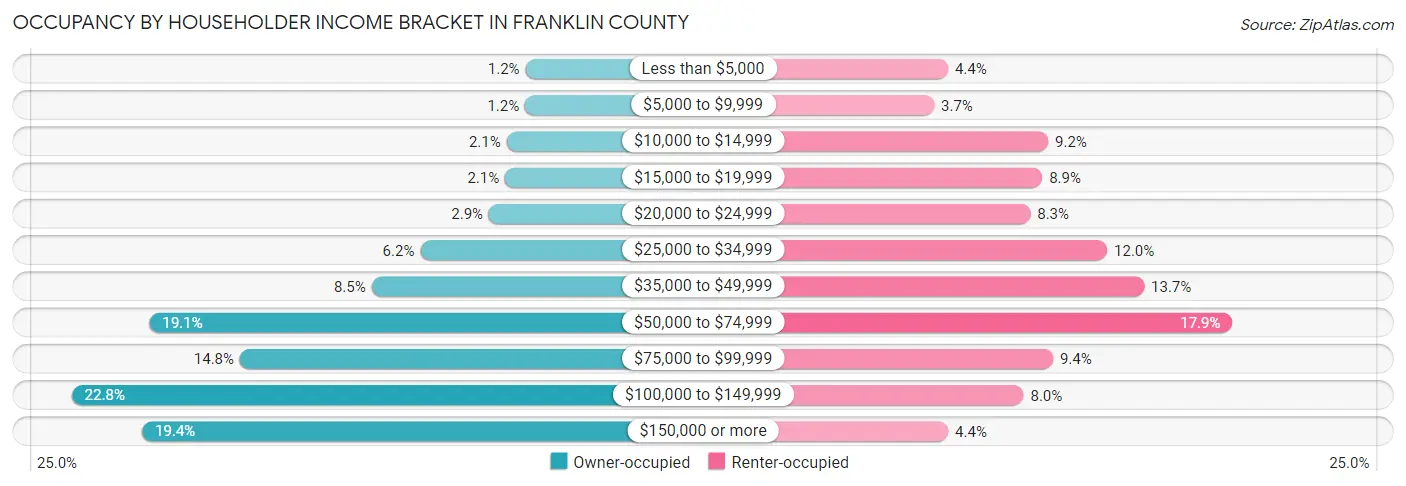
| Income Bracket | Owner-occupied | Renter-occupied |
| Less than $5,000 | 250 (1.1%) | 418 (4.4%) |
| $5,000 to $9,999 | 254 (1.2%) | 355 (3.7%) |
| $10,000 to $14,999 | 445 (2.1%) | 871 (9.2%) |
| $15,000 to $19,999 | 461 (2.1%) | 844 (8.9%) |
| $20,000 to $24,999 | 628 (2.9%) | 790 (8.3%) |
| $25,000 to $34,999 | 1,339 (6.2%) | 1,138 (12.0%) |
| $35,000 to $49,999 | 1,843 (8.5%) | 1,305 (13.7%) |
| $50,000 to $74,999 | 4,144 (19.1%) | 1,704 (17.9%) |
| $75,000 to $99,999 | 3,207 (14.7%) | 893 (9.4%) |
| $100,000 to $149,999 | 4,947 (22.8%) | 760 (8.0%) |
| $150,000 or more | 4,219 (19.4%) | 419 (4.4%) |
| Total | 21,737 (100.0%) | 9,497 (100.0%) |
Monthly Housing Cost Tiers in Franklin County
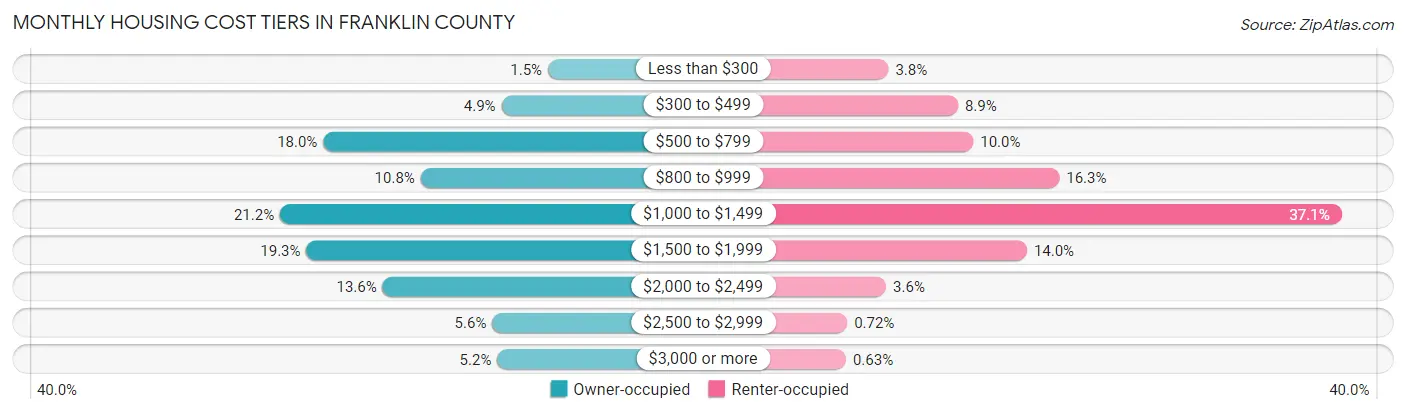
| Monthly Cost | Owner-occupied | Renter-occupied |
| Less than $300 | 317 (1.5%) | 357 (3.8%) |
| $300 to $499 | 1,060 (4.9%) | 843 (8.9%) |
| $500 to $799 | 3,914 (18.0%) | 951 (10.0%) |
| $800 to $999 | 2,355 (10.8%) | 1,552 (16.3%) |
| $1,000 to $1,499 | 4,605 (21.2%) | 3,525 (37.1%) |
| $1,500 to $1,999 | 4,184 (19.3%) | 1,326 (14.0%) |
| $2,000 to $2,499 | 2,965 (13.6%) | 341 (3.6%) |
| $2,500 to $2,999 | 1,208 (5.6%) | 68 (0.7%) |
| $3,000 or more | 1,129 (5.2%) | 60 (0.6%) |
| Total | 21,737 (100.0%) | 9,497 (100.0%) |
Physical Housing Characteristics in Franklin County
Housing Structures in Franklin County
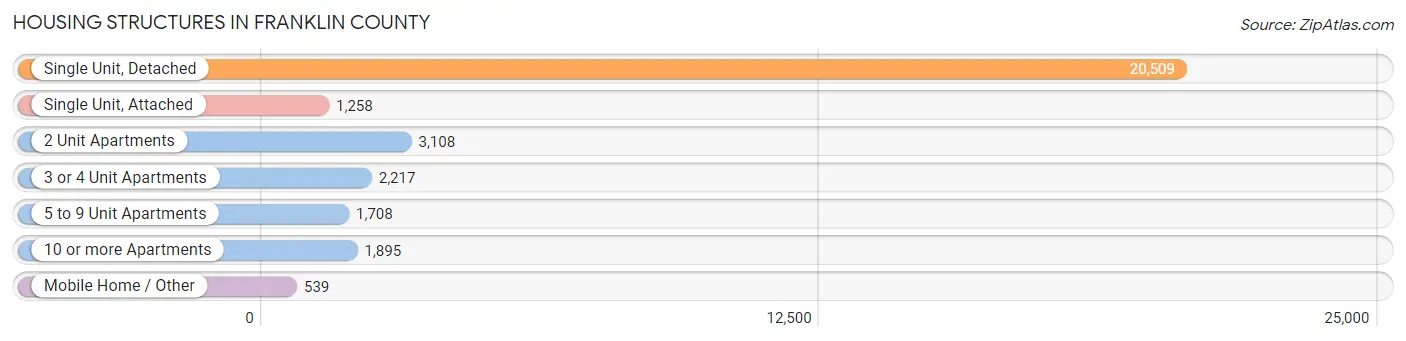
| Structure Type | # Housing Units | % Housing Units |
| Single Unit, Detached | 20,509 | 65.7% |
| Single Unit, Attached | 1,258 | 4.0% |
| 2 Unit Apartments | 3,108 | 10.0% |
| 3 or 4 Unit Apartments | 2,217 | 7.1% |
| 5 to 9 Unit Apartments | 1,708 | 5.5% |
| 10 or more Apartments | 1,895 | 6.1% |
| Mobile Home / Other | 539 | 1.7% |
| Total | 31,234 | 100.0% |
Housing Structures by Occupancy in Franklin County
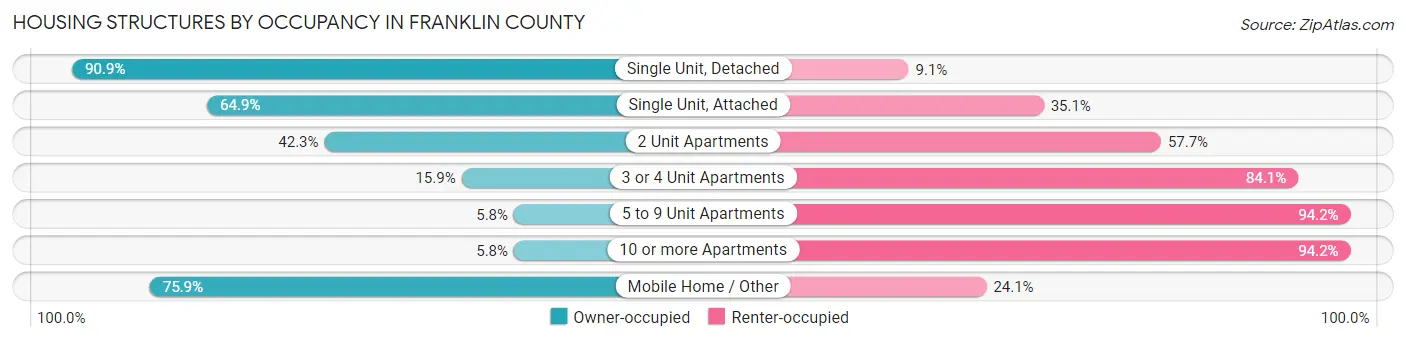
| Structure Type | Owner-occupied | Renter-occupied |
| Single Unit, Detached | 18,637 (90.9%) | 1,872 (9.1%) |
| Single Unit, Attached | 816 (64.9%) | 442 (35.1%) |
| 2 Unit Apartments | 1,314 (42.3%) | 1,794 (57.7%) |
| 3 or 4 Unit Apartments | 352 (15.9%) | 1,865 (84.1%) |
| 5 to 9 Unit Apartments | 99 (5.8%) | 1,609 (94.2%) |
| 10 or more Apartments | 110 (5.8%) | 1,785 (94.2%) |
| Mobile Home / Other | 409 (75.9%) | 130 (24.1%) |
| Total | 21,737 (69.6%) | 9,497 (30.4%) |
Housing Structures by Number of Rooms in Franklin County
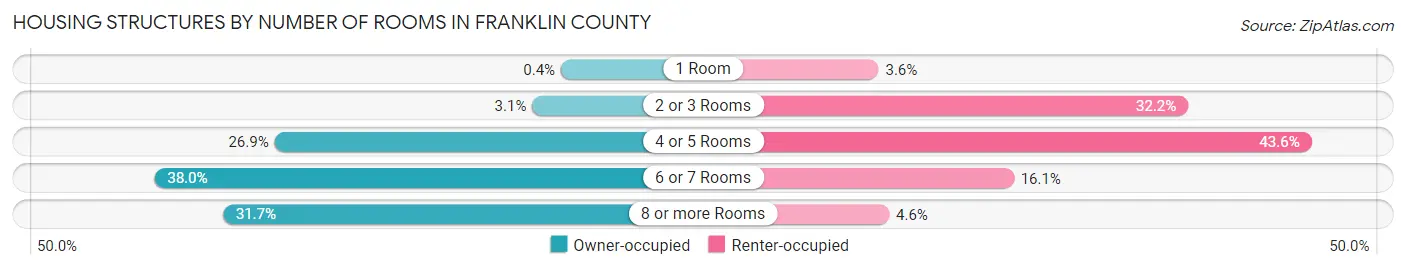
| Number of Rooms | Owner-occupied | Renter-occupied |
| 1 Room | 87 (0.4%) | 339 (3.6%) |
| 2 or 3 Rooms | 662 (3.0%) | 3,058 (32.2%) |
| 4 or 5 Rooms | 5,844 (26.9%) | 4,142 (43.6%) |
| 6 or 7 Rooms | 8,260 (38.0%) | 1,526 (16.1%) |
| 8 or more Rooms | 6,884 (31.7%) | 432 (4.5%) |
| Total | 21,737 (100.0%) | 9,497 (100.0%) |
Housing Structure by Heating Type in Franklin County
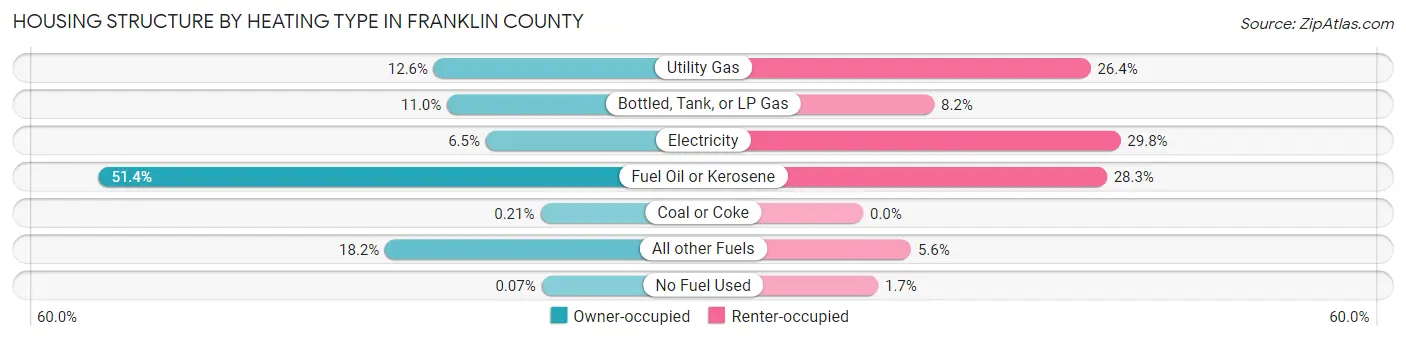
| Heating Type | Owner-occupied | Renter-occupied |
| Utility Gas | 2,729 (12.6%) | 2,504 (26.4%) |
| Bottled, Tank, or LP Gas | 2,394 (11.0%) | 783 (8.2%) |
| Electricity | 1,419 (6.5%) | 2,834 (29.8%) |
| Fuel Oil or Kerosene | 11,178 (51.4%) | 2,683 (28.2%) |
| Coal or Coke | 45 (0.2%) | 0 (0.0%) |
| All other Fuels | 3,956 (18.2%) | 528 (5.6%) |
| No Fuel Used | 16 (0.1%) | 165 (1.7%) |
| Total | 21,737 (100.0%) | 9,497 (100.0%) |
Household Vehicle Usage in Franklin County
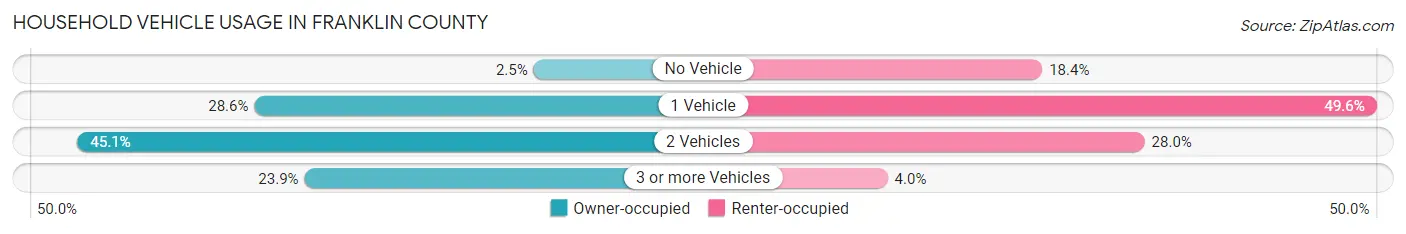
| Vehicles per Household | Owner-occupied | Renter-occupied |
| No Vehicle | 541 (2.5%) | 1,749 (18.4%) |
| 1 Vehicle | 6,209 (28.6%) | 4,712 (49.6%) |
| 2 Vehicles | 9,797 (45.1%) | 2,657 (28.0%) |
| 3 or more Vehicles | 5,190 (23.9%) | 379 (4.0%) |
| Total | 21,737 (100.0%) | 9,497 (100.0%) |
Real Estate & Mortgages in Franklin County
Real Estate and Mortgage Overview in Franklin County
| Characteristic | Without Mortgage | With Mortgage |
| Housing Units | 8,570 | 13,167 |
| Median Property Value | $277,900 | $287,400 |
| Median Household Income | $69,475 | $3,033 |
| Monthly Housing Costs | $755 | $1,111 |
| Real Estate Taxes | $4,542 | $116 |
Property Value by Mortgage Status in Franklin County
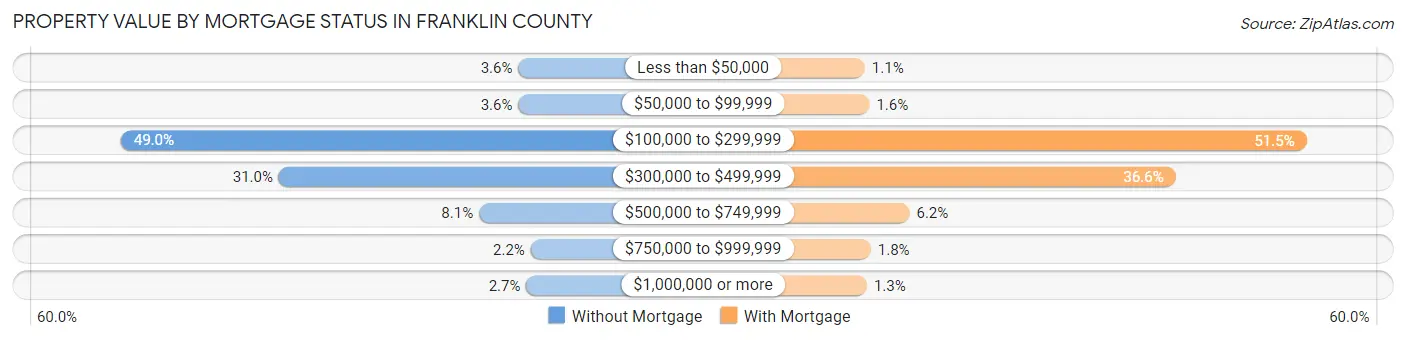
| Property Value | Without Mortgage | With Mortgage |
| Less than $50,000 | 307 (3.6%) | 141 (1.1%) |
| $50,000 to $99,999 | 307 (3.6%) | 210 (1.6%) |
| $100,000 to $299,999 | 4,199 (49.0%) | 6,785 (51.5%) |
| $300,000 to $499,999 | 2,652 (30.9%) | 4,815 (36.6%) |
| $500,000 to $749,999 | 692 (8.1%) | 813 (6.2%) |
| $750,000 to $999,999 | 185 (2.2%) | 230 (1.8%) |
| $1,000,000 or more | 228 (2.7%) | 173 (1.3%) |
| Total | 8,570 (100.0%) | 13,167 (100.0%) |
Household Income by Mortgage Status in Franklin County
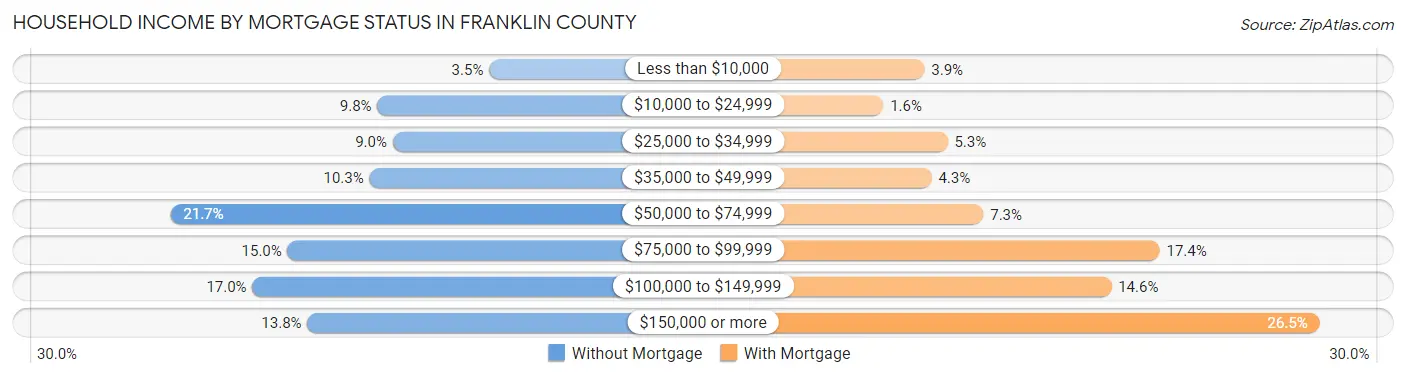
| Household Income | Without Mortgage | With Mortgage |
| Less than $10,000 | 296 (3.5%) | 517 (3.9%) |
| $10,000 to $24,999 | 843 (9.8%) | 208 (1.6%) |
| $25,000 to $34,999 | 768 (9.0%) | 691 (5.2%) |
| $35,000 to $49,999 | 882 (10.3%) | 571 (4.3%) |
| $50,000 to $74,999 | 1,857 (21.7%) | 961 (7.3%) |
| $75,000 to $99,999 | 1,283 (15.0%) | 2,287 (17.4%) |
| $100,000 to $149,999 | 1,455 (17.0%) | 1,924 (14.6%) |
| $150,000 or more | 1,186 (13.8%) | 3,492 (26.5%) |
| Total | 8,570 (100.0%) | 13,167 (100.0%) |
Property Value to Household Income Ratio in Franklin County
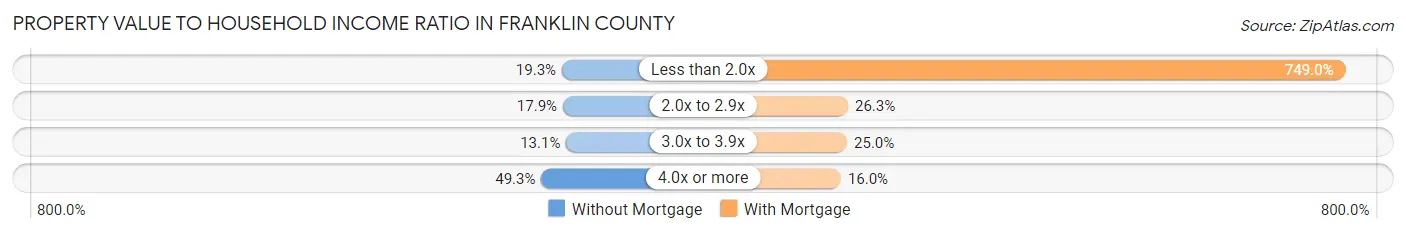
| Value-to-Income Ratio | Without Mortgage | With Mortgage |
| Less than 2.0x | 1,657 (19.3%) | 98,620 (749.0%) |
| 2.0x to 2.9x | 1,534 (17.9%) | 3,462 (26.3%) |
| 3.0x to 3.9x | 1,119 (13.1%) | 3,289 (25.0%) |
| 4.0x or more | 4,227 (49.3%) | 2,109 (16.0%) |
| Total | 8,570 (100.0%) | 13,167 (100.0%) |
Real Estate Taxes by Mortgage Status in Franklin County
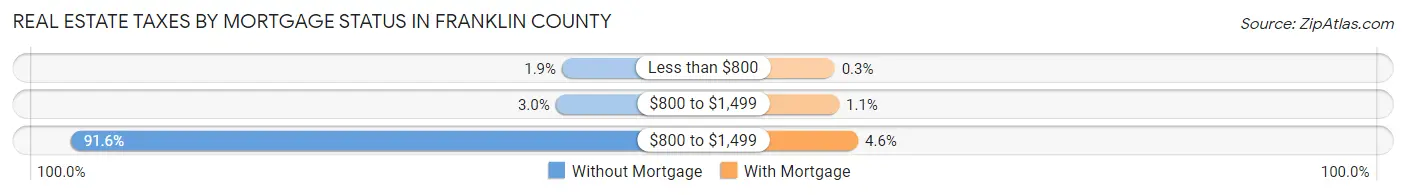
| Property Taxes | Without Mortgage | With Mortgage |
| Less than $800 | 160 (1.9%) | 39 (0.3%) |
| $800 to $1,499 | 259 (3.0%) | 145 (1.1%) |
| $800 to $1,499 | 7,847 (91.6%) | 602 (4.6%) |
| Total | 8,570 (100.0%) | 13,167 (100.0%) |
Health & Disability in Franklin County
Health Insurance Coverage by Age in Franklin County
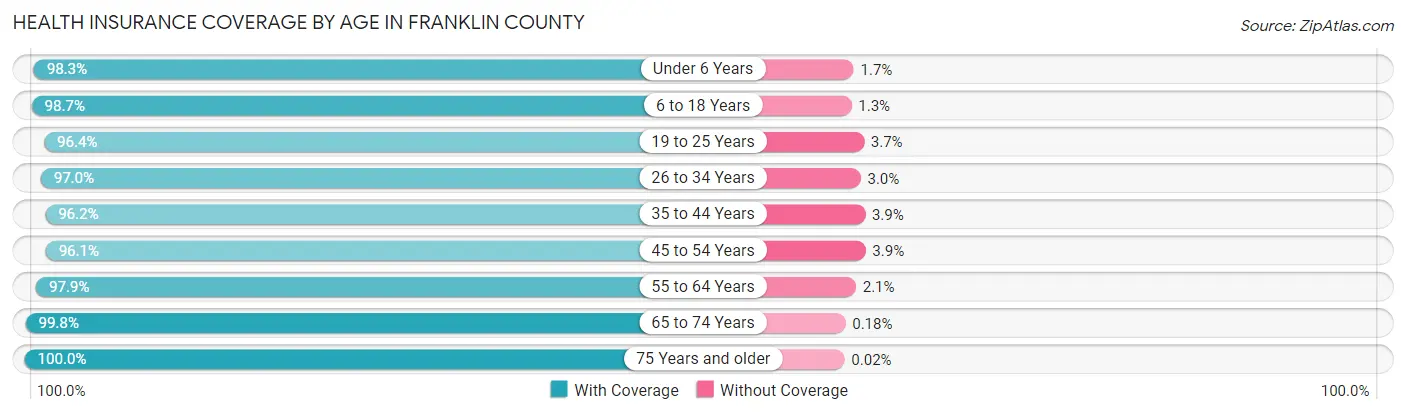
| Age Bracket | With Coverage | Without Coverage |
| Under 6 Years | 3,342 (98.3%) | 59 (1.7%) |
| 6 to 18 Years | 9,066 (98.7%) | 120 (1.3%) |
| 19 to 25 Years | 4,824 (96.4%) | 183 (3.6%) |
| 26 to 34 Years | 7,269 (97.0%) | 227 (3.0%) |
| 35 to 44 Years | 8,337 (96.2%) | 334 (3.8%) |
| 45 to 54 Years | 8,517 (96.1%) | 349 (3.9%) |
| 55 to 64 Years | 11,387 (97.9%) | 249 (2.1%) |
| 65 to 74 Years | 10,364 (99.8%) | 19 (0.2%) |
| 75 Years and older | 5,704 (100.0%) | 1 (0.0%) |
| Total | 68,810 (97.8%) | 1,541 (2.2%) |
Health Insurance Coverage by Citizenship Status in Franklin County
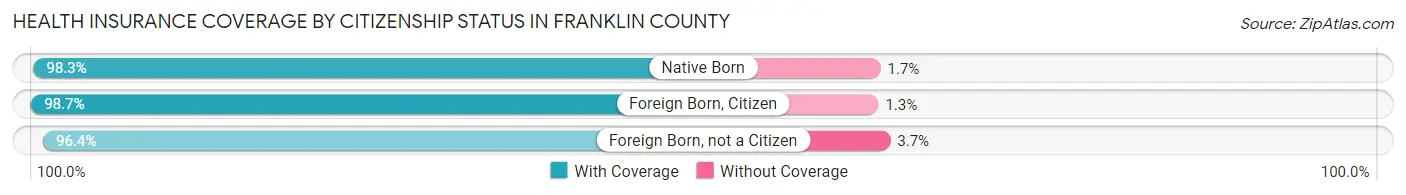
| Citizenship Status | With Coverage | Without Coverage |
| Native Born | 3,342 (98.3%) | 59 (1.7%) |
| Foreign Born, Citizen | 9,066 (98.7%) | 120 (1.3%) |
| Foreign Born, not a Citizen | 4,824 (96.4%) | 183 (3.6%) |
Health Insurance Coverage by Household Income in Franklin County
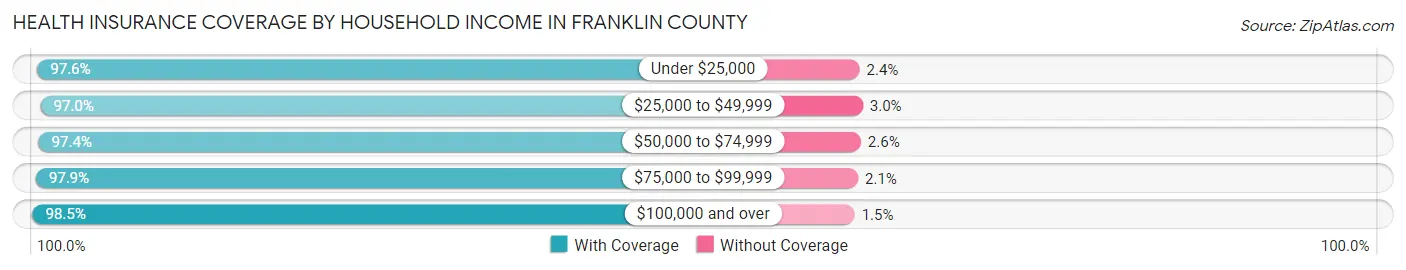
| Household Income | With Coverage | Without Coverage |
| Under $25,000 | 7,778 (97.6%) | 191 (2.4%) |
| $25,000 to $49,999 | 9,777 (97.0%) | 303 (3.0%) |
| $50,000 to $74,999 | 12,557 (97.4%) | 340 (2.6%) |
| $75,000 to $99,999 | 9,012 (97.9%) | 195 (2.1%) |
| $100,000 and over | 28,845 (98.5%) | 432 (1.5%) |
Public vs Private Health Insurance Coverage by Age in Franklin County
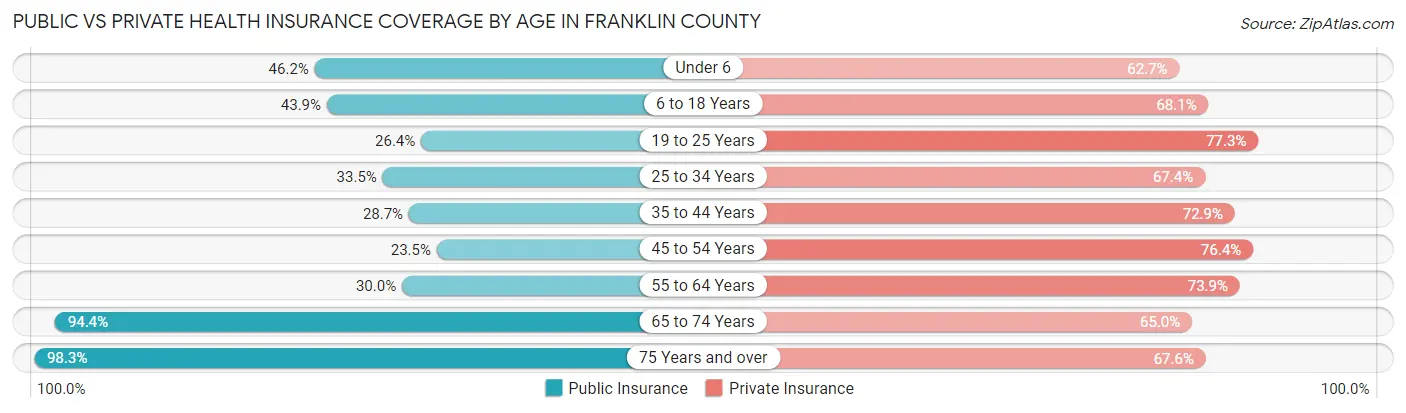
| Age Bracket | Public Insurance | Private Insurance |
| Under 6 | 1,570 (46.2%) | 2,131 (62.7%) |
| 6 to 18 Years | 4,033 (43.9%) | 6,252 (68.1%) |
| 19 to 25 Years | 1,322 (26.4%) | 3,870 (77.3%) |
| 25 to 34 Years | 2,514 (33.5%) | 5,054 (67.4%) |
| 35 to 44 Years | 2,485 (28.7%) | 6,325 (72.9%) |
| 45 to 54 Years | 2,083 (23.5%) | 6,769 (76.3%) |
| 55 to 64 Years | 3,485 (29.9%) | 8,595 (73.9%) |
| 65 to 74 Years | 9,799 (94.4%) | 6,749 (65.0%) |
| 75 Years and over | 5,605 (98.3%) | 3,854 (67.5%) |
| Total | 32,896 (46.8%) | 49,599 (70.5%) |
Disability Status by Sex by Age in Franklin County
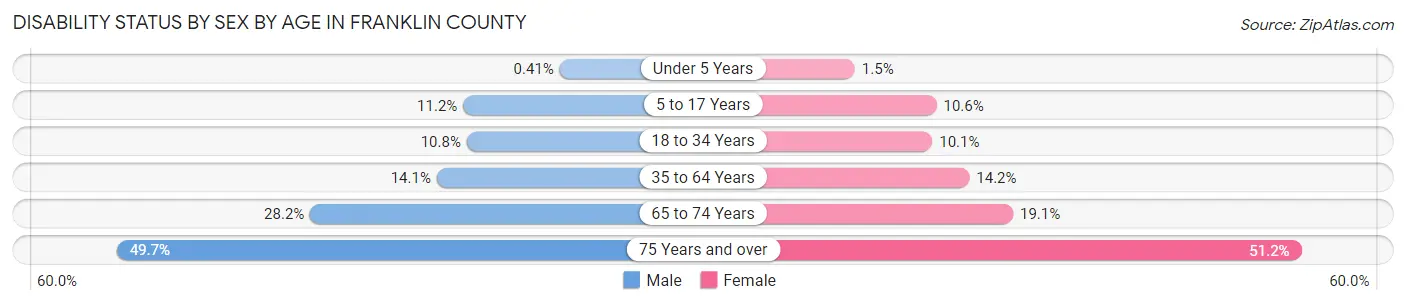
| Age Bracket | Male | Female |
| Under 5 Years | 6 (0.4%) | 19 (1.5%) |
| 5 to 17 Years | 538 (11.2%) | 460 (10.5%) |
| 18 to 34 Years | 730 (10.8%) | 641 (10.1%) |
| 35 to 64 Years | 2,003 (14.1%) | 2,127 (14.2%) |
| 65 to 74 Years | 1,398 (28.2%) | 1,035 (19.1%) |
| 75 Years and over | 1,232 (49.7%) | 1,652 (51.2%) |
Disability Class by Sex by Age in Franklin County
Disability Class: Hearing Difficulty
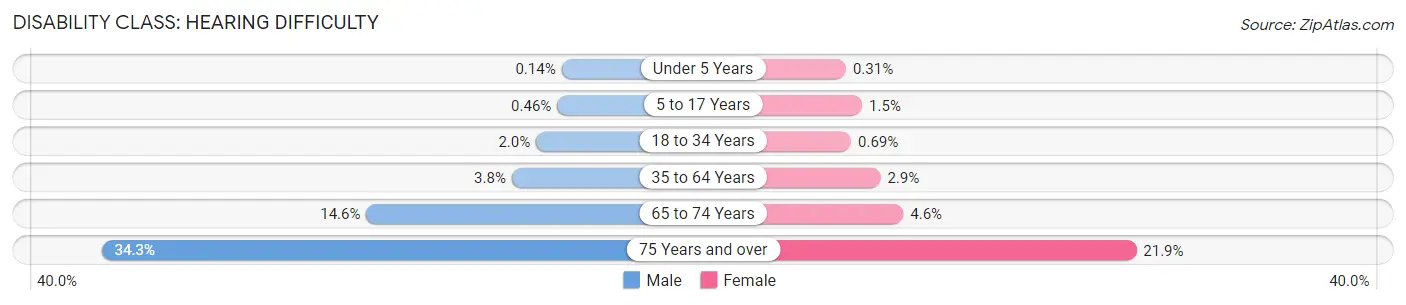
| Age Bracket | Male | Female |
| Under 5 Years | 2 (0.1%) | 4 (0.3%) |
| 5 to 17 Years | 22 (0.5%) | 66 (1.5%) |
| 18 to 34 Years | 138 (2.0%) | 44 (0.7%) |
| 35 to 64 Years | 544 (3.8%) | 430 (2.9%) |
| 65 to 74 Years | 725 (14.6%) | 248 (4.6%) |
| 75 Years and over | 849 (34.3%) | 706 (21.9%) |
Disability Class: Vision Difficulty
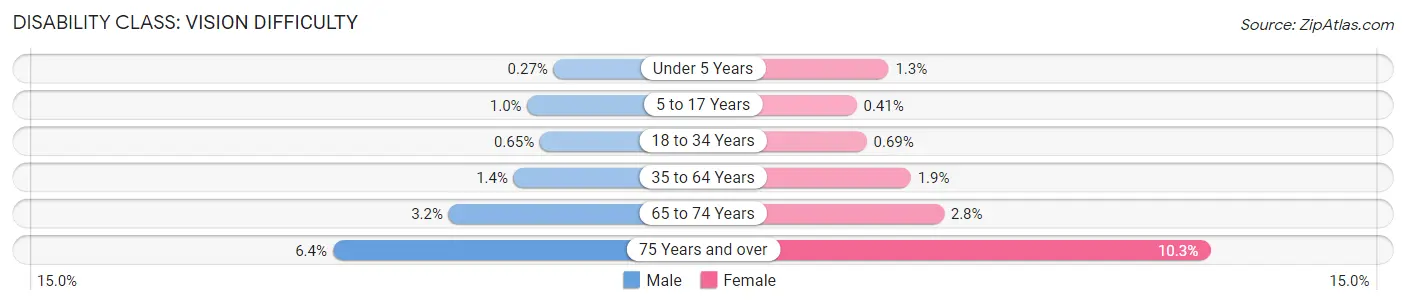
| Age Bracket | Male | Female |
| Under 5 Years | 4 (0.3%) | 17 (1.3%) |
| 5 to 17 Years | 48 (1.0%) | 18 (0.4%) |
| 18 to 34 Years | 44 (0.6%) | 44 (0.7%) |
| 35 to 64 Years | 196 (1.4%) | 288 (1.9%) |
| 65 to 74 Years | 158 (3.2%) | 154 (2.8%) |
| 75 Years and over | 159 (6.4%) | 331 (10.2%) |
Disability Class: Cognitive Difficulty
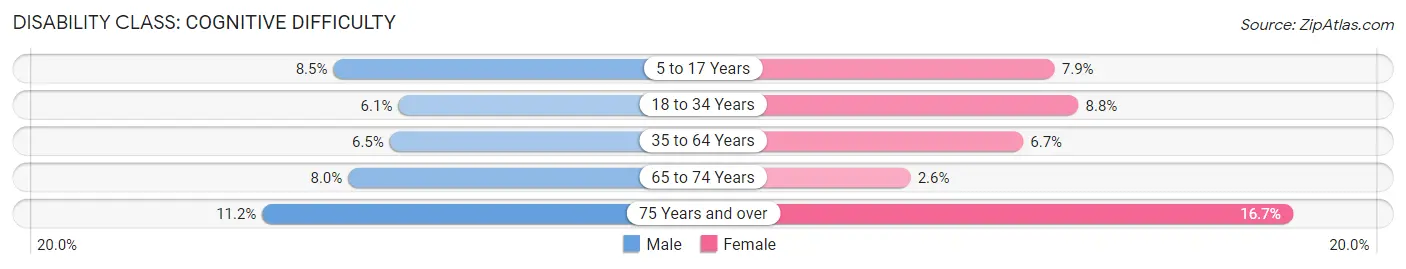
| Age Bracket | Male | Female |
| 5 to 17 Years | 412 (8.5%) | 345 (7.9%) |
| 18 to 34 Years | 416 (6.1%) | 559 (8.8%) |
| 35 to 64 Years | 916 (6.5%) | 1,009 (6.7%) |
| 65 to 74 Years | 396 (8.0%) | 139 (2.6%) |
| 75 Years and over | 277 (11.2%) | 540 (16.7%) |
Disability Class: Ambulatory Difficulty
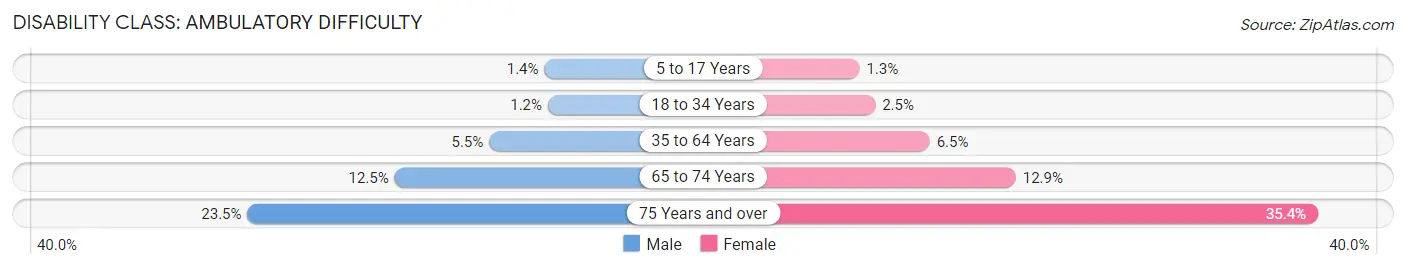
| Age Bracket | Male | Female |
| 5 to 17 Years | 68 (1.4%) | 57 (1.3%) |
| 18 to 34 Years | 78 (1.1%) | 158 (2.5%) |
| 35 to 64 Years | 783 (5.5%) | 978 (6.5%) |
| 65 to 74 Years | 621 (12.5%) | 701 (12.9%) |
| 75 Years and over | 581 (23.5%) | 1,141 (35.3%) |
Disability Class: Self-Care Difficulty
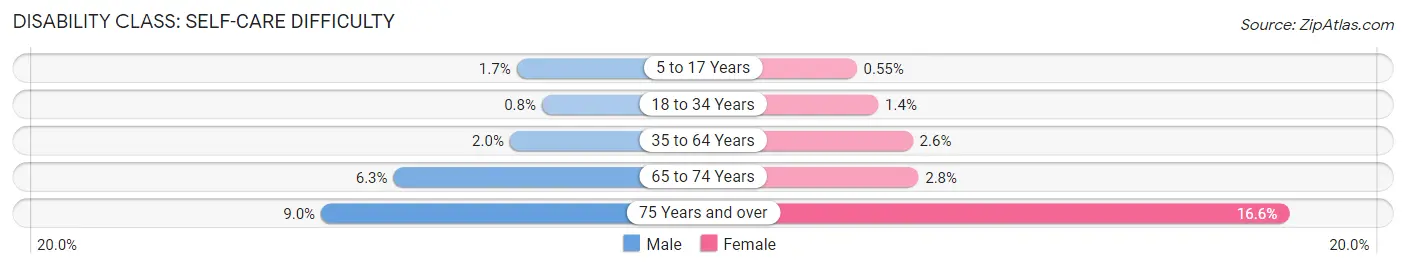
| Age Bracket | Male | Female |
| 5 to 17 Years | 84 (1.7%) | 24 (0.5%) |
| 18 to 34 Years | 54 (0.8%) | 86 (1.3%) |
| 35 to 64 Years | 282 (2.0%) | 393 (2.6%) |
| 65 to 74 Years | 313 (6.3%) | 154 (2.8%) |
| 75 Years and over | 223 (9.0%) | 536 (16.6%) |
Technology Access in Franklin County
Computing Device Access in Franklin County
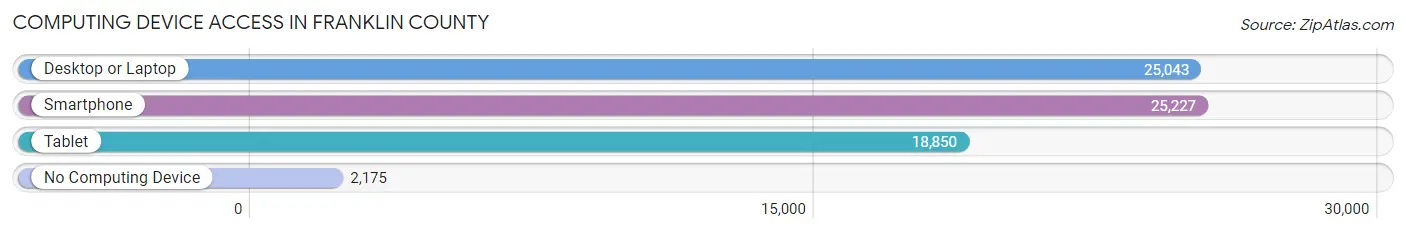
| Device Type | # Households | % Households |
| Desktop or Laptop | 25,043 | 80.2% |
| Smartphone | 25,227 | 80.8% |
| Tablet | 18,850 | 60.4% |
| No Computing Device | 2,175 | 7.0% |
| Total | 31,234 | 100.0% |
Internet Access in Franklin County
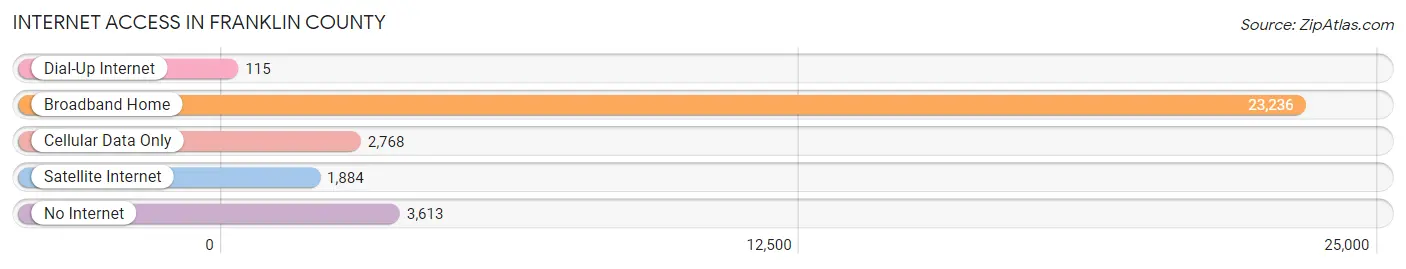
| Internet Type | # Households | % Households |
| Dial-Up Internet | 115 | 0.4% |
| Broadband Home | 23,236 | 74.4% |
| Cellular Data Only | 2,768 | 8.9% |
| Satellite Internet | 1,884 | 6.0% |
| No Internet | 3,613 | 11.6% |
| Total | 31,234 | 100.0% |
Franklin County Summary
Franklin County is a county located in the U.S. state of Massachusetts. As of the 2010 census, the population was 71,372, making it the least populous county in Massachusetts. Its county seat is Greenfield. Franklin County comprises the Greenfield Town, MA Micropolitan Statistical Area, which is included in the Springfield-Greenfield Town, MA Combined Statistical Area.
History
Franklin County was created on 24 June 1811 from the northern third of Hampshire County. It was named for Benjamin Franklin, American statesman, scientist, and printer. Franklin County is part of the Springfield, MA Metropolitan Statistical Area.
Geography
Franklin County is located in the western part of Massachusetts. It is bordered by Hampshire County to the south, Berkshire County to the west, and Worcester County to the east. The Connecticut River forms the northern border of the county. The county has a total area of 567 square miles, of which 545 square miles is land and 22 square miles (3.9%) is water.
The highest point in Franklin County is the summit of Mount Greylock in Adams, which is 3,491 feet above sea level. The county has a humid continental climate, with cold, snowy winters, and warm, humid summers.
Economy
Franklin County is a rural county with a diverse economy. The county is home to a variety of industries, including manufacturing, agriculture, tourism, and retail.
Manufacturing is a major part of the economy in Franklin County. The county is home to several large manufacturing companies, including Smith & Wesson, a firearms manufacturer, and the Franklin County Tool Company, a tool and die manufacturer.
Agriculture is also an important part of the economy in Franklin County. The county is home to several large farms, including the Franklin County Farm, which produces a variety of fruits and vegetables.
Tourism is also an important part of the economy in Franklin County. The county is home to several popular tourist attractions, including the Berkshire Botanical Garden, the Mohawk Trail State Forest, and the Shelburne Falls Trolley Museum.
Demographics
As of the 2010 census, there were 71,372 people, 28,845 households, and 18,845 families residing in the county. The population density was 130.7 people per square mile. There were 31,945 housing units at an average density of 58.3 per square mile. The racial makeup of the county was 94.2% White, 1.2% African American, 0.3% Native American, 1.2% Asian, 0.1% Pacific Islander, 1.2% from other races, and 1.9% from two or more races. Hispanic or Latino of any race were 3.2% of the population.
The median income for a household in the county was $45,859, and the median income for a family was $54,844. Males had a median income of $41,890 versus $30,845 for females. The per capita income for the county was $22,845. About 8.2% of families and 11.2% of the population were below the poverty line, including 15.2% of those under age 18 and 8.2% of those age 65 or over.
Common Questions
What is the Total Population of Franklin County?
Total Population of Franklin County is 70,980.
What is the Total Male Population of Franklin County?
Total Male Population of Franklin County is 35,030.
What is the Total Female Population of Franklin County?
Total Female Population of Franklin County is 35,950.
What is the Ratio of Males per 100 Females in Franklin County?
There are 97.44 Males per 100 Females in Franklin County.
What is the Ratio of Females per 100 Males in Franklin County?
There are 102.63 Females per 100 Males in Franklin County.
What is the Median Population Age in Franklin County?
Median Population Age in Franklin County is 47.1 Years.
What is the Average Family Size in Franklin County
Average Family Size in Franklin County is 2.8 People.
What is the Average Household Size in Franklin County
Average Household Size in Franklin County is 2.2 People.
What is Per Capita Income in Franklin County?
Per Capita income in Franklin County is $40,282.
What is the Median Family Income in Franklin County?
Median Family Income in Franklin County is $92,593.
What is the Median Household income in Franklin County?
Median Household Income in Franklin County is $70,383.
What is Income or Wage Gap in Franklin County?
Income or Wage Gap in Franklin County is 21.1%.
Women in Franklin County earn 78.9 cents for every dollar earned by a man.
What is Family Income Deficit in Franklin County?
Family Income Deficit in Franklin County is $11,108.
Families that are below poverty line in Franklin County earn $11,108 less on average than the poverty threshold level.
What is Inequality or Gini Index in Franklin County?
Inequality or Gini Index in Franklin County is 0.44.
How Large is the Labor Force in Franklin County?
There are 38,257 People in the Labor Forcein in Franklin County.
What is the Percentage of People in the Labor Force in Franklin County?
63.1% of People are in the Labor Force in Franklin County.
What is the Unemployment Rate in Franklin County?
Unemployment Rate in Franklin County is 5.7%.