Dukes County, MA
Dukes County Map
Dukes County Overview
20,543
TOTAL POPULATION
10,091
MALE POPULATION
10,452
FEMALE POPULATION
96.55
MALES / 100 FEMALES
103.58
FEMALES / 100 MALES
49.2
MEDIAN AGE
3.7
AVG FAMILY SIZE
2.9
AVG HOUSEHOLD SIZE
$60,845
PER CAPITA INCOME
$121,417
AVG FAMILY INCOME
$93,225
AVG HOUSEHOLD INCOME
27.3%
WAGE / INCOME GAP [ % ]
72.7¢/ $1
WAGE / INCOME GAP [ $ ]
0.54
INEQUALITY / GINI INDEX
11,279
LABOR FORCE [ PEOPLE ]
64.9%
PERCENT IN LABOR FORCE
7.0%
UNEMPLOYMENT RATE
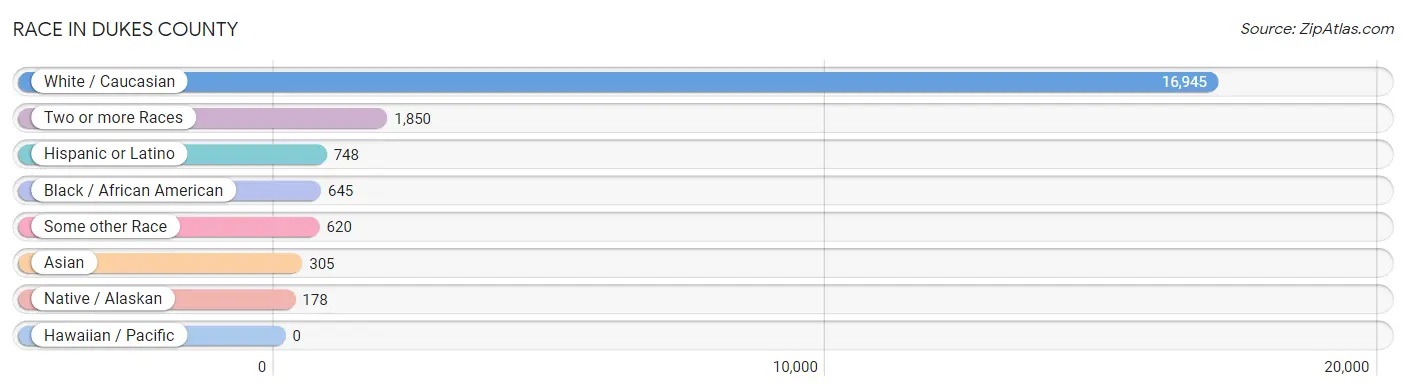
Race in Dukes County
The most populous races in Dukes County are White / Caucasian (16,945 | 82.5%), Two or more Races (1,850 | 9.0%), and Hispanic or Latino (748 | 3.6%).
| Race | # Population | % Population |
| Asian | 305 | 1.5% |
| Black / African American | 645 | 3.1% |
| Hawaiian / Pacific | 0 | 0.0% |
| Hispanic or Latino | 748 | 3.6% |
| Native / Alaskan | 178 | 0.9% |
| White / Caucasian | 16,945 | 82.5% |
| Two or more Races | 1,850 | 9.0% |
| Some other Race | 620 | 3.0% |
| Total | 20,543 | 100.0% |
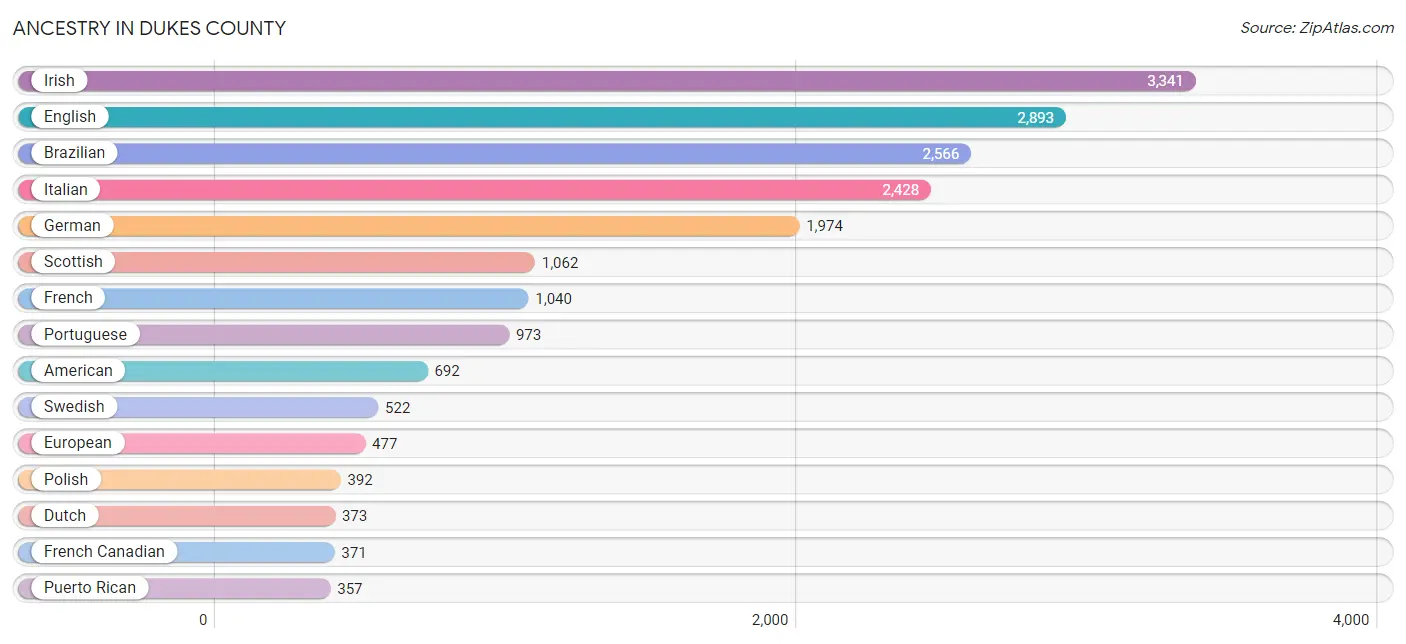
Ancestry in Dukes County
The most populous ancestries reported in Dukes County are Irish (3,341 | 16.3%), English (2,893 | 14.1%), Brazilian (2,566 | 12.5%), Italian (2,428 | 11.8%), and German (1,974 | 9.6%), together accounting for 64.3% of all Dukes County residents.
| Ancestry | # Population | % Population |
| African | 66 | 0.3% |
| Alsatian | 7 | 0.0% |
| American | 692 | 3.4% |
| Arab | 71 | 0.4% |
| Austrian | 41 | 0.2% |
| Basque | 9 | 0.0% |
| Belgian | 33 | 0.2% |
| Bhutanese | 111 | 0.5% |
| Brazilian | 2,566 | 12.5% |
| British | 83 | 0.4% |
| Bulgarian | 15 | 0.1% |
| Burmese | 24 | 0.1% |
| Cambodian | 47 | 0.2% |
| Canadian | 62 | 0.3% |
| Cape Verdean | 96 | 0.5% |
| Central American | 90 | 0.4% |
| Central American Indian | 38 | 0.2% |
| Chippewa | 9 | 0.0% |
| Costa Rican | 15 | 0.1% |
| Cuban | 20 | 0.1% |
| Czech | 2 | 0.0% |
| Czechoslovakian | 35 | 0.2% |
| Danish | 53 | 0.3% |
| Dominican | 2 | 0.0% |
| Dutch | 373 | 1.8% |
| Eastern European | 160 | 0.8% |
| English | 2,893 | 14.1% |
| Ethiopian | 2 | 0.0% |
| European | 477 | 2.3% |
| Filipino | 5 | 0.0% |
| Finnish | 24 | 0.1% |
| French | 1,040 | 5.1% |
| French Canadian | 371 | 1.8% |
| German | 1,974 | 9.6% |
| Greek | 42 | 0.2% |
| Guatemalan | 75 | 0.4% |
| Haitian | 2 | 0.0% |
| Hungarian | 240 | 1.2% |
| Icelander | 5 | 0.0% |
| Indian (Asian) | 25 | 0.1% |
| Irish | 3,341 | 16.3% |
| Italian | 2,428 | 11.8% |
| Jamaican | 78 | 0.4% |
| Japanese | 193 | 0.9% |
| Korean | 55 | 0.3% |
| Laotian | 1 | 0.0% |
| Lebanese | 62 | 0.3% |
| Lithuanian | 189 | 0.9% |
| Luxembourger | 9 | 0.0% |
| Malaysian | 6 | 0.0% |
| Mexican | 116 | 0.6% |
| Moroccan | 3 | 0.0% |
| Native Hawaiian | 13 | 0.1% |
| Nigerian | 11 | 0.1% |
| Northern European | 107 | 0.5% |
| Norwegian | 186 | 0.9% |
| Polish | 392 | 1.9% |
| Portuguese | 973 | 4.7% |
| Puerto Rican | 357 | 1.7% |
| Romanian | 7 | 0.0% |
| Russian | 282 | 1.4% |
| Scandinavian | 16 | 0.1% |
| Scotch-Irish | 134 | 0.6% |
| Scottish | 1,062 | 5.2% |
| South African | 5 | 0.0% |
| South American | 145 | 0.7% |
| Spaniard | 1 | 0.0% |
| Subsaharan African | 198 | 1.0% |
| Swedish | 522 | 2.5% |
| Swiss | 25 | 0.1% |
| Syrian | 6 | 0.0% |
| Thai | 6 | 0.0% |
| Trinidadian and Tobagonian | 8 | 0.0% |
| U.S. Virgin Islander | 28 | 0.1% |
| Ugandan | 6 | 0.0% |
| Ukrainian | 24 | 0.1% |
| Uruguayan | 145 | 0.7% |
| Welsh | 115 | 0.6% |
| West Indian | 31 | 0.2% | View All 79 Rows |
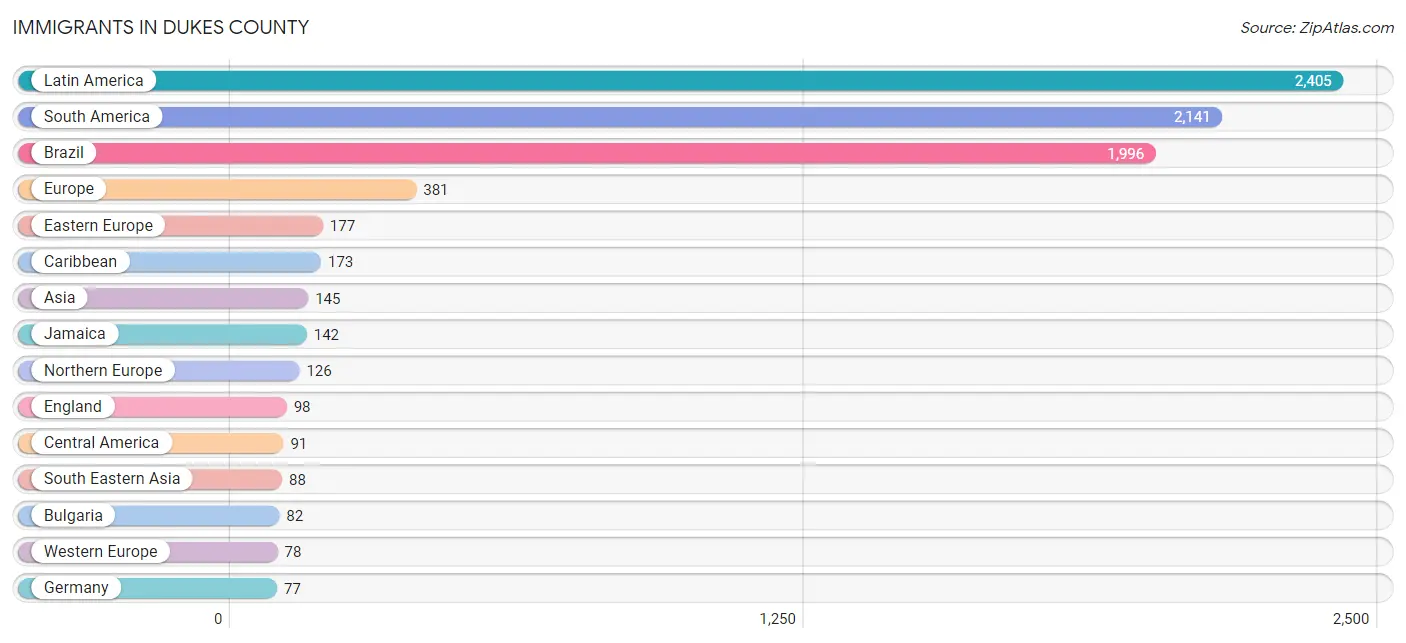
Immigrants in Dukes County
The most numerous immigrant groups reported in Dukes County came from Latin America (2,405 | 11.7%), South America (2,141 | 10.4%), Brazil (1,996 | 9.7%), Europe (381 | 1.8%), and Eastern Europe (177 | 0.9%), together accounting for 34.6% of all Dukes County residents.
| Immigration Origin | # Population | % Population |
| Africa | 12 | 0.1% |
| Asia | 145 | 0.7% |
| Brazil | 1,996 | 9.7% |
| Bulgaria | 82 | 0.4% |
| Cambodia | 20 | 0.1% |
| Canada | 68 | 0.3% |
| Caribbean | 173 | 0.8% |
| Central America | 91 | 0.4% |
| China | 23 | 0.1% |
| Costa Rica | 16 | 0.1% |
| Dominican Republic | 2 | 0.0% |
| Eastern Asia | 47 | 0.2% |
| Eastern Europe | 177 | 0.9% |
| England | 98 | 0.5% |
| Europe | 381 | 1.8% |
| Germany | 77 | 0.4% |
| Guatemala | 75 | 0.4% |
| Haiti | 2 | 0.0% |
| Hungary | 27 | 0.1% |
| Jamaica | 142 | 0.7% |
| Korea | 24 | 0.1% |
| Latin America | 2,405 | 11.7% |
| Netherlands | 1 | 0.0% |
| Nigeria | 11 | 0.1% |
| Northern Europe | 126 | 0.6% |
| Poland | 36 | 0.2% |
| Russia | 32 | 0.2% |
| South Africa | 1 | 0.0% |
| South America | 2,141 | 10.4% |
| South Eastern Asia | 88 | 0.4% |
| Thailand | 21 | 0.1% |
| Trinidad and Tobago | 27 | 0.1% |
| Uruguay | 53 | 0.3% |
| Vietnam | 47 | 0.2% |
| Western Africa | 11 | 0.1% |
| Western Europe | 78 | 0.4% | View All 36 Rows |
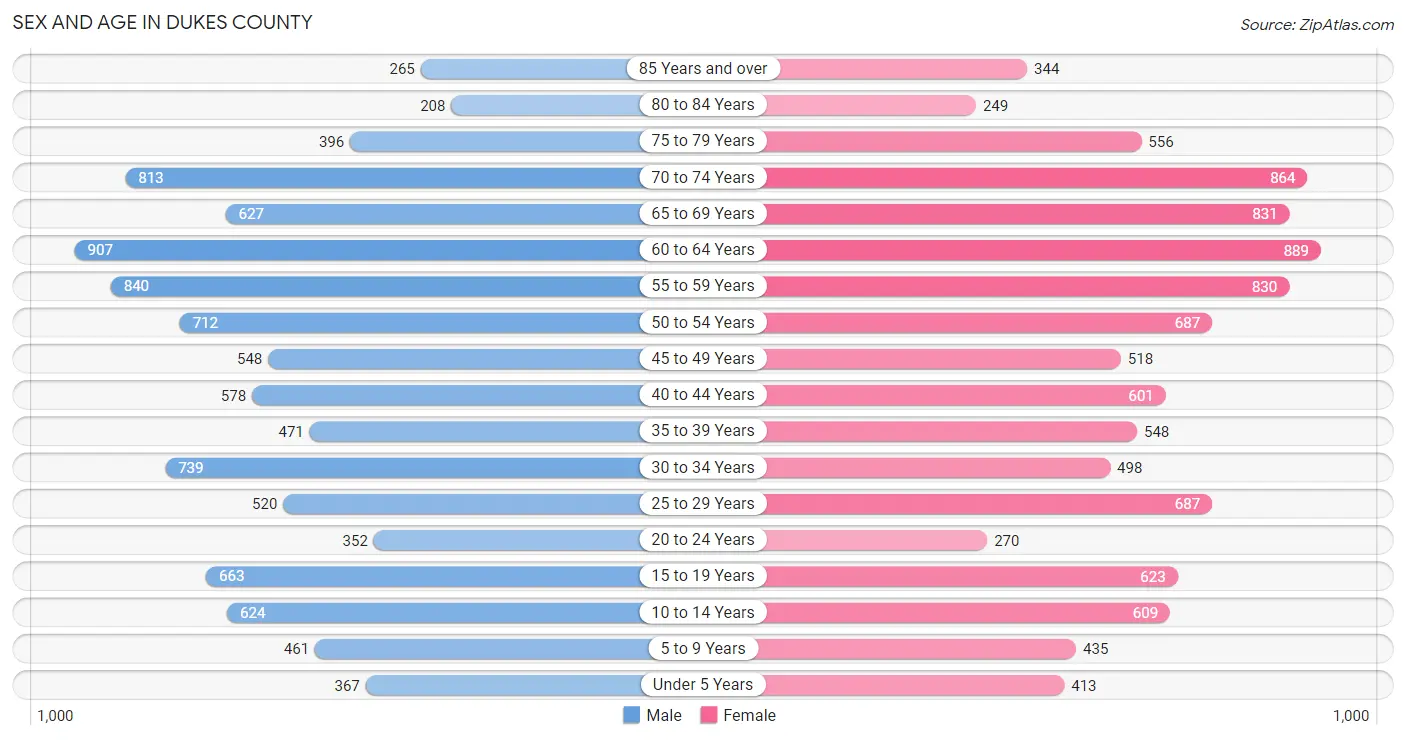
Sex and Age in Dukes County
Sex and Age in Dukes County
The most populous age groups in Dukes County are 60 to 64 Years (907 | 9.0%) for men and 60 to 64 Years (889 | 8.5%) for women.
| Age Bracket | Male | Female |
| Under 5 Years | 367 (3.6%) | 413 (4.0%) |
| 5 to 9 Years | 461 (4.6%) | 435 (4.2%) |
| 10 to 14 Years | 624 (6.2%) | 609 (5.8%) |
| 15 to 19 Years | 663 (6.6%) | 623 (6.0%) |
| 20 to 24 Years | 352 (3.5%) | 270 (2.6%) |
| 25 to 29 Years | 520 (5.1%) | 687 (6.6%) |
| 30 to 34 Years | 739 (7.3%) | 498 (4.8%) |
| 35 to 39 Years | 471 (4.7%) | 548 (5.2%) |
| 40 to 44 Years | 578 (5.7%) | 601 (5.8%) |
| 45 to 49 Years | 548 (5.4%) | 518 (5.0%) |
| 50 to 54 Years | 712 (7.1%) | 687 (6.6%) |
| 55 to 59 Years | 840 (8.3%) | 830 (7.9%) |
| 60 to 64 Years | 907 (9.0%) | 889 (8.5%) |
| 65 to 69 Years | 627 (6.2%) | 831 (8.0%) |
| 70 to 74 Years | 813 (8.1%) | 864 (8.3%) |
| 75 to 79 Years | 396 (3.9%) | 556 (5.3%) |
| 80 to 84 Years | 208 (2.1%) | 249 (2.4%) |
| 85 Years and over | 265 (2.6%) | 344 (3.3%) |
| Total | 10,091 (100.0%) | 10,452 (100.0%) |
Families and Households in Dukes County
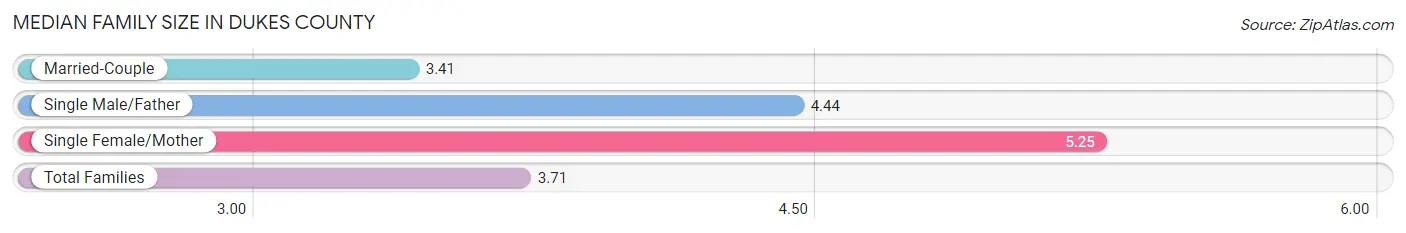
Median Family Size in Dukes County
The median family size in Dukes County is 3.71 persons per family, with single female/mother families (533 | 12.7%) accounting for the largest median family size of 5.25 persons per family. On the other hand, married-couple families (3,403 | 81.2%) represent the smallest median family size with 3.41 persons per family.
| Family Type | # Families | Family Size |
| Married-Couple | 3,403 (81.2%) | 3.41 |
| Single Male/Father | 253 (6.0%) | 4.44 |
| Single Female/Mother | 533 (12.7%) | 5.25 |
| Total Families | 4,189 (100.0%) | 3.71 |
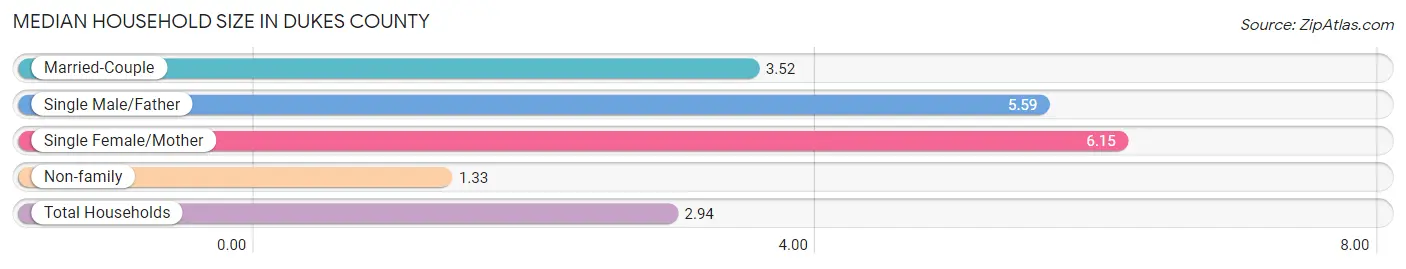
Median Household Size in Dukes County
The median household size in Dukes County is 2.94 persons per household, with single female/mother households (533 | 7.7%) accounting for the largest median household size of 6.15 persons per household. non-family households (2,710 | 39.3%) represent the smallest median household size with 1.33 persons per household.
| Household Type | # Households | Household Size |
| Married-Couple | 3,403 (49.3%) | 3.52 |
| Single Male/Father | 253 (3.7%) | 5.59 |
| Single Female/Mother | 533 (7.7%) | 6.15 |
| Non-family | 2,710 (39.3%) | 1.33 |
| Total Households | 6,899 (100.0%) | 2.94 |
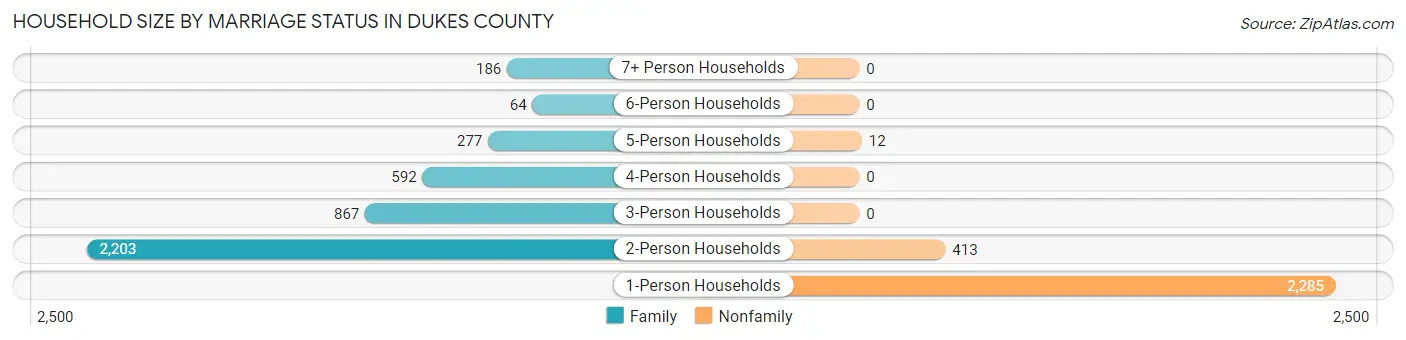
Household Size by Marriage Status in Dukes County
Out of a total of 6,899 households in Dukes County, 4,189 (60.7%) are family households, while 2,710 (39.3%) are nonfamily households. The most numerous type of family households are 2-person households, comprising 2,203, and the most common type of nonfamily households are 1-person households, comprising 2,285.
| Household Size | Family Households | Nonfamily Households |
| 1-Person Households | - | 2,285 (33.1%) |
| 2-Person Households | 2,203 (31.9%) | 413 (6.0%) |
| 3-Person Households | 867 (12.6%) | 0 (0.0%) |
| 4-Person Households | 592 (8.6%) | 0 (0.0%) |
| 5-Person Households | 277 (4.0%) | 12 (0.2%) |
| 6-Person Households | 64 (0.9%) | 0 (0.0%) |
| 7+ Person Households | 186 (2.7%) | 0 (0.0%) |
| Total | 4,189 (60.7%) | 2,710 (39.3%) |
Female Fertility in Dukes County
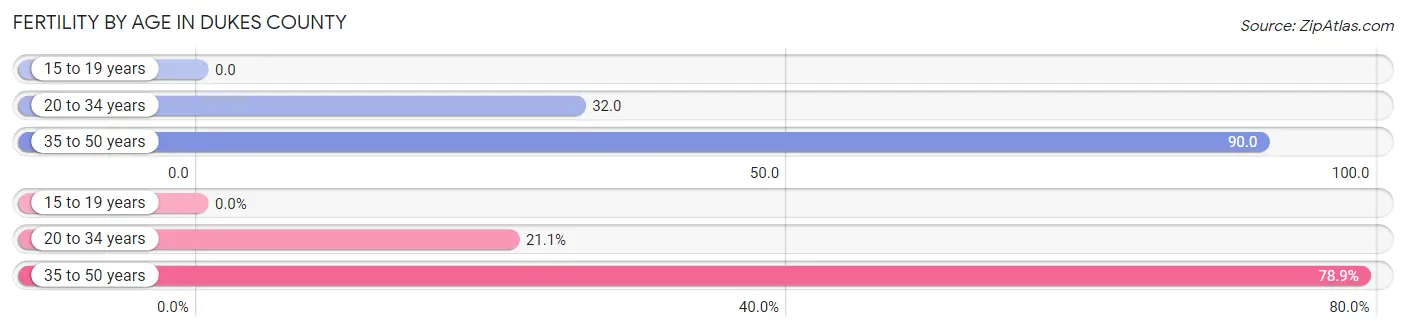
Fertility by Age in Dukes County
Average fertility rate in Dukes County is 55.0 births per 1,000 women. Women in the age bracket of 35 to 50 years have the highest fertility rate with 90.0 births per 1,000 women. Women in the age bracket of 35 to 50 years acount for 78.9% of all women with births.
| Age Bracket | Women with Births | Births / 1,000 Women |
| 15 to 19 years | 0 (0.0%) | 0.0 |
| 20 to 34 years | 46 (21.1%) | 32.0 |
| 35 to 50 years | 172 (78.9%) | 90.0 |
| Total | 218 (100.0%) | 55.0 |
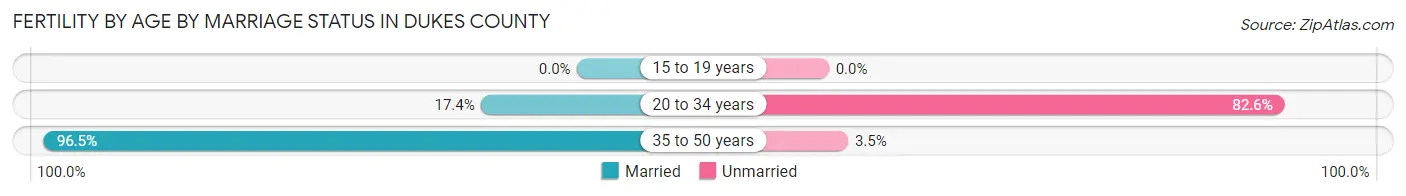
Fertility by Age by Marriage Status in Dukes County
79.8% of women with births (218) in Dukes County are married. The highest percentage of unmarried women with births falls into 20 to 34 years age bracket with 82.6% of them unmarried at the time of birth, while the lowest percentage of unmarried women with births belong to 35 to 50 years age bracket with 3.5% of them unmarried.
| Age Bracket | Married | Unmarried |
| 15 to 19 years | 0 (0.0%) | 0 (0.0%) |
| 20 to 34 years | 8 (17.4%) | 38 (82.6%) |
| 35 to 50 years | 166 (96.5%) | 6 (3.5%) |
| Total | 174 (79.8%) | 44 (20.2%) |
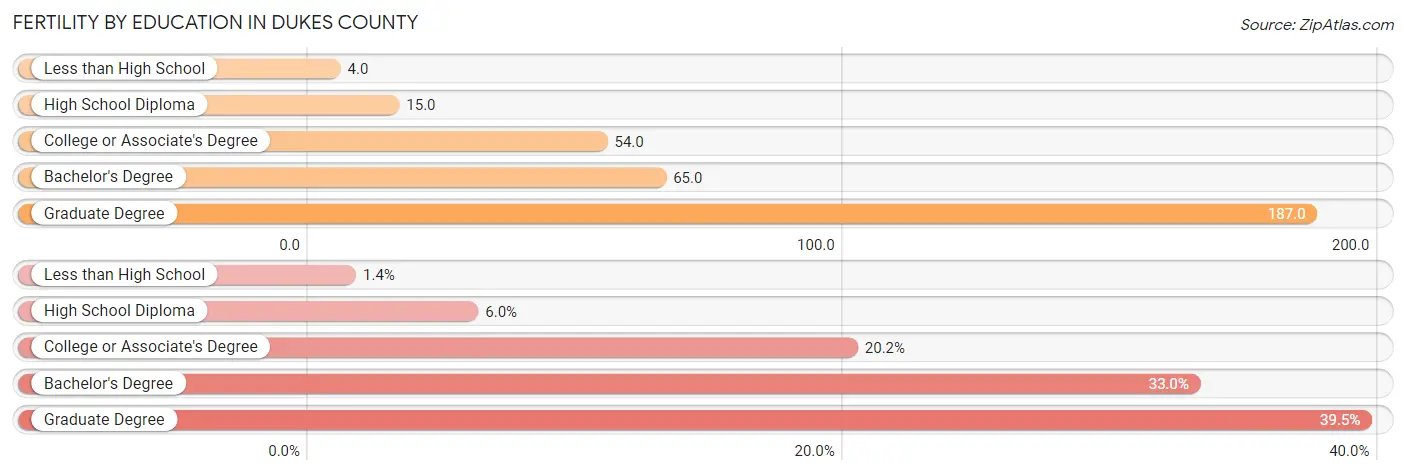
Fertility by Education in Dukes County
Average fertility rate in Dukes County is 55.0 births per 1,000 women. Women with the education attainment of graduate degree have the highest fertility rate of 187.0 births per 1,000 women, while women with the education attainment of less than high school have the lowest fertility at 4.0 births per 1,000 women. Women with the education attainment of graduate degree represent 39.5% of all women with births.
| Educational Attainment | Women with Births | Births / 1,000 Women |
| Less than High School | 3 (1.4%) | 4.0 |
| High School Diploma | 13 (6.0%) | 15.0 |
| College or Associate's Degree | 44 (20.2%) | 54.0 |
| Bachelor's Degree | 72 (33.0%) | 65.0 |
| Graduate Degree | 86 (39.5%) | 187.0 |
| Total | 218 (100.0%) | 55.0 |
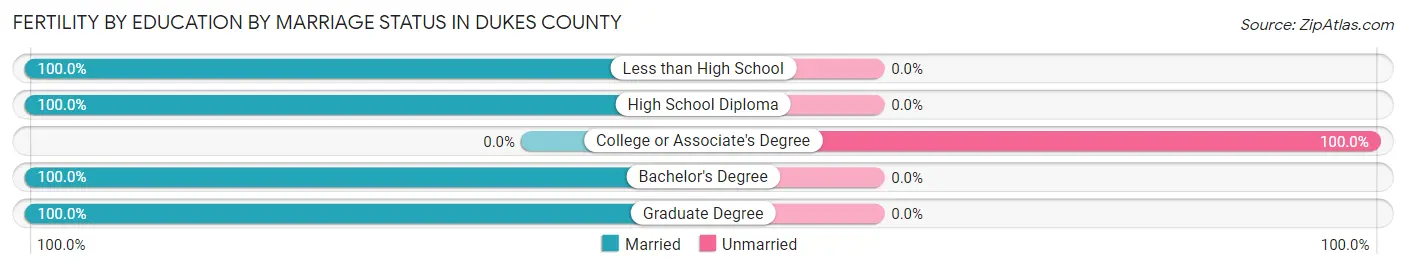
Fertility by Education by Marriage Status in Dukes County
20.2% of women with births in Dukes County are unmarried. Women with the educational attainment of less than high school are most likely to be married with 100.0% of them married at childbirth, while women with the educational attainment of college or associate's degree are least likely to be married with 100.0% of them unmarried at childbirth.
| Educational Attainment | Married | Unmarried |
| Less than High School | 3 (100.0%) | 0 (0.0%) |
| High School Diploma | 13 (100.0%) | 0 (0.0%) |
| College or Associate's Degree | 0 (0.0%) | 44 (100.0%) |
| Bachelor's Degree | 72 (100.0%) | 0 (0.0%) |
| Graduate Degree | 86 (100.0%) | 0 (0.0%) |
| Total | 174 (79.8%) | 44 (20.2%) |
Income in Dukes County
Income Overview in Dukes County
Per Capita Income in Dukes County is $60,845, while median incomes of families and households are $121,417 and $93,225 respectively.
| Characteristic | Number | Measure |
| Per Capita Income | 20,543 | $60,845 |
| Median Family Income | 4,189 | $121,417 |
| Mean Family Income | 4,189 | $191,380 |
| Median Household Income | 6,899 | $93,225 |
| Mean Household Income | 6,899 | $154,247 |
| Income Deficit | 4,189 | $0 |
| Wage / Income Gap (%) | 20,543 | 27.28% |
| Wage / Income Gap ($) | 20,543 | 72.72¢ per $1 |
| Gini / Inequality Index | 20,543 | 0.54 |
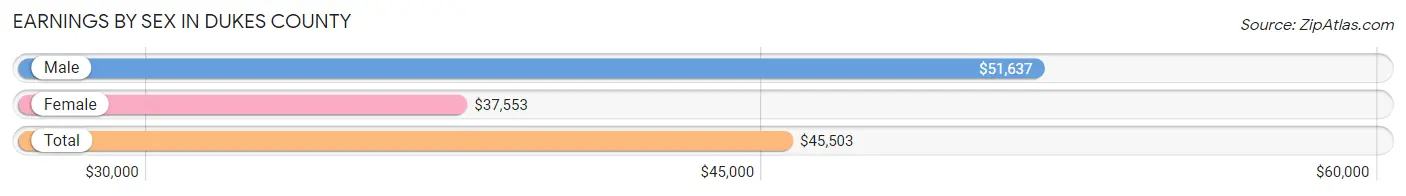
Earnings by Sex in Dukes County
Average Earnings in Dukes County are $45,503, $51,637 for men and $37,553 for women, a difference of 27.3%.
| Sex | Number | Average Earnings |
| Male | 6,379 (53.2%) | $51,637 |
| Female | 5,609 (46.8%) | $37,553 |
| Total | 11,988 (100.0%) | $45,503 |
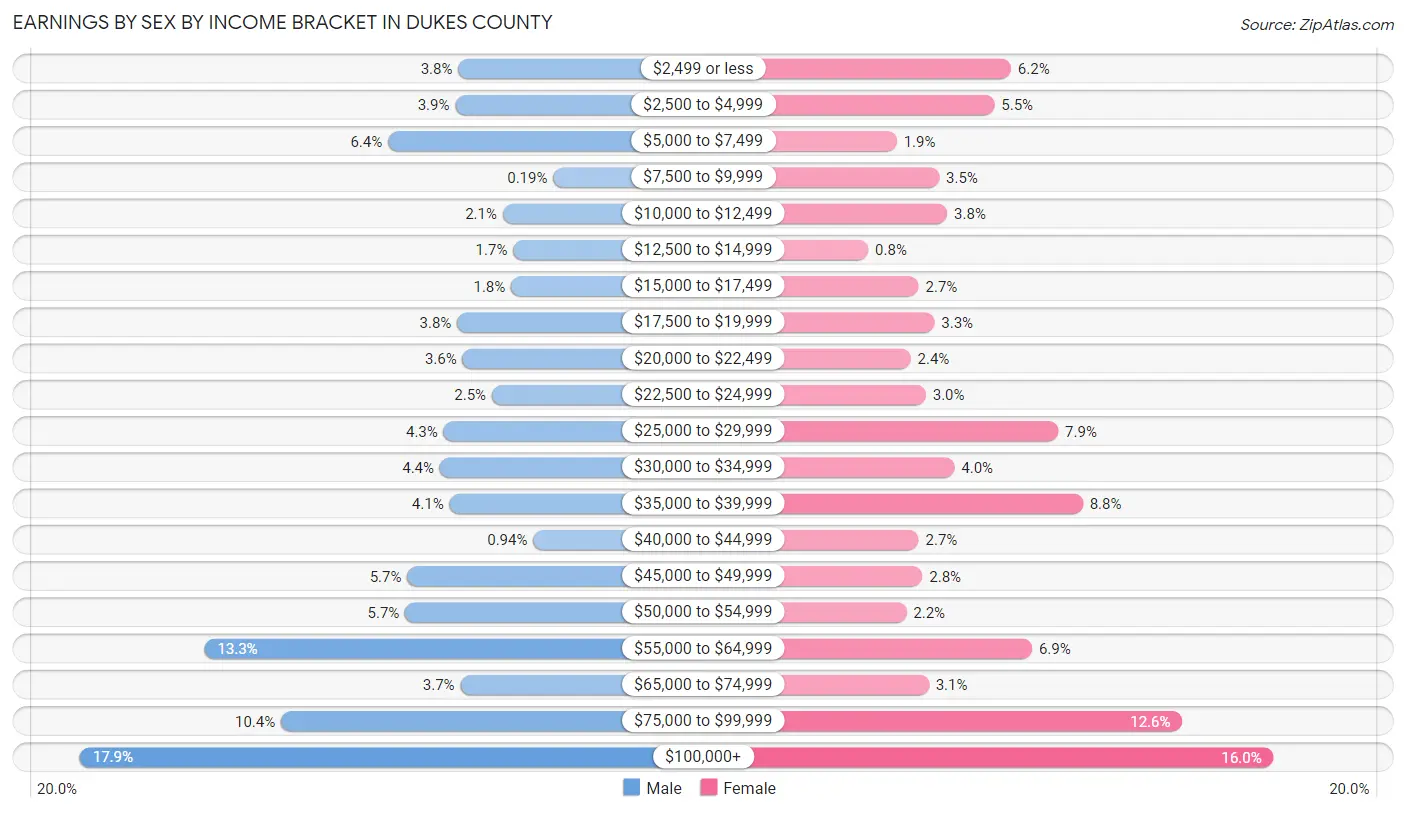
Earnings by Sex by Income Bracket in Dukes County
The most common earnings brackets in Dukes County are $100,000+ for men (1,144 | 17.9%) and $100,000+ for women (897 | 16.0%).
| Income | Male | Female |
| $2,499 or less | 239 (3.7%) | 345 (6.1%) |
| $2,500 to $4,999 | 246 (3.9%) | 310 (5.5%) |
| $5,000 to $7,499 | 407 (6.4%) | 105 (1.9%) |
| $7,500 to $9,999 | 12 (0.2%) | 194 (3.5%) |
| $10,000 to $12,499 | 133 (2.1%) | 211 (3.8%) |
| $12,500 to $14,999 | 108 (1.7%) | 45 (0.8%) |
| $15,000 to $17,499 | 113 (1.8%) | 151 (2.7%) |
| $17,500 to $19,999 | 242 (3.8%) | 184 (3.3%) |
| $20,000 to $22,499 | 229 (3.6%) | 134 (2.4%) |
| $22,500 to $24,999 | 159 (2.5%) | 166 (3.0%) |
| $25,000 to $29,999 | 274 (4.3%) | 444 (7.9%) |
| $30,000 to $34,999 | 283 (4.4%) | 226 (4.0%) |
| $35,000 to $39,999 | 260 (4.1%) | 496 (8.8%) |
| $40,000 to $44,999 | 60 (0.9%) | 151 (2.7%) |
| $45,000 to $49,999 | 361 (5.7%) | 159 (2.8%) |
| $50,000 to $54,999 | 366 (5.7%) | 125 (2.2%) |
| $55,000 to $64,999 | 846 (13.3%) | 389 (6.9%) |
| $65,000 to $74,999 | 234 (3.7%) | 172 (3.1%) |
| $75,000 to $99,999 | 663 (10.4%) | 705 (12.6%) |
| $100,000+ | 1,144 (17.9%) | 897 (16.0%) |
| Total | 6,379 (100.0%) | 5,609 (100.0%) |
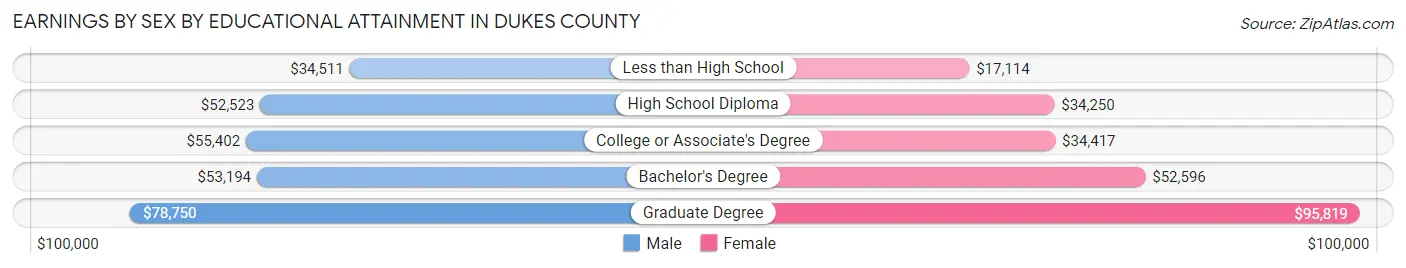
Earnings by Sex by Educational Attainment in Dukes County
Average earnings in Dukes County are $54,730 for men and $41,410 for women, a difference of 24.3%. Men with an educational attainment of graduate degree enjoy the highest average annual earnings of $78,750, while those with less than high school education earn the least with $34,511. Women with an educational attainment of graduate degree earn the most with the average annual earnings of $95,819, while those with less than high school education have the smallest earnings of $17,114.
| Educational Attainment | Male Income | Female Income |
| Less than High School | $34,511 | $17,114 |
| High School Diploma | $52,523 | $34,250 |
| College or Associate's Degree | $55,402 | $34,417 |
| Bachelor's Degree | $53,194 | $52,596 |
| Graduate Degree | $78,750 | $95,819 |
| Total | $54,730 | $41,410 |
Family Income in Dukes County
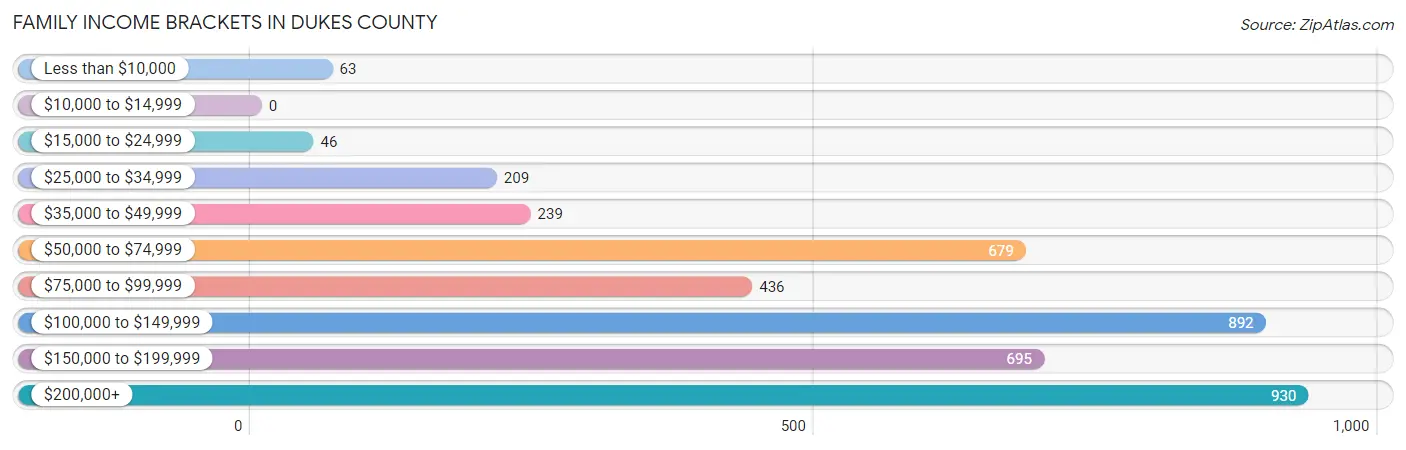
Family Income Brackets in Dukes County
According to the Dukes County family income data, there are 930 families falling into the $200,000+ income range, which is the most common income bracket and makes up 22.2% of all families.
| Income Bracket | # Families | % Families |
| Less than $10,000 | 63 | 1.5% |
| $10,000 to $14,999 | 0 | 0.0% |
| $15,000 to $24,999 | 46 | 1.1% |
| $25,000 to $34,999 | 209 | 5.0% |
| $35,000 to $49,999 | 239 | 5.7% |
| $50,000 to $74,999 | 679 | 16.2% |
| $75,000 to $99,999 | 436 | 10.4% |
| $100,000 to $149,999 | 892 | 21.3% |
| $150,000 to $199,999 | 695 | 16.6% |
| $200,000+ | 930 | 22.2% |
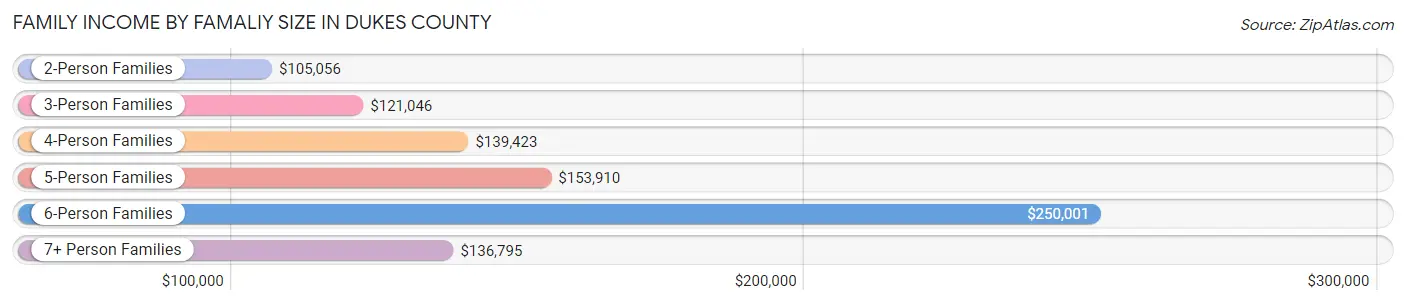
Family Income by Famaliy Size in Dukes County
6-person families (59 | 1.4%) account for the highest median family income in Dukes County with $250,001 per family, while 2-person families (2,429 | 58.0%) have the highest median income of $52,528 per family member.
| Income Bracket | # Families | Median Income |
| 2-Person Families | 2,429 (58.0%) | $105,056 |
| 3-Person Families | 709 (16.9%) | $121,046 |
| 4-Person Families | 626 (14.9%) | $139,423 |
| 5-Person Families | 254 (6.1%) | $153,910 |
| 6-Person Families | 59 (1.4%) | $250,001 |
| 7+ Person Families | 112 (2.7%) | $136,795 |
| Total | 4,189 (100.0%) | $121,417 |
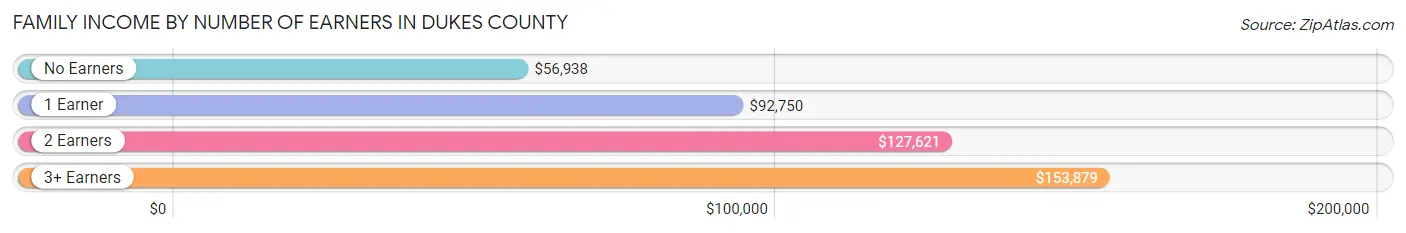
Family Income by Number of Earners in Dukes County
The median family income in Dukes County is $121,417, with families comprising 3+ earners (658) having the highest median family income of $153,879, while families with no earners (794) have the lowest median family income of $56,938, accounting for 15.7% and 19.0% of families, respectively.
| Number of Earners | # Families | Median Income |
| No Earners | 794 (19.0%) | $56,938 |
| 1 Earner | 1,000 (23.9%) | $92,750 |
| 2 Earners | 1,737 (41.5%) | $127,621 |
| 3+ Earners | 658 (15.7%) | $153,879 |
| Total | 4,189 (100.0%) | $121,417 |
Household Income in Dukes County
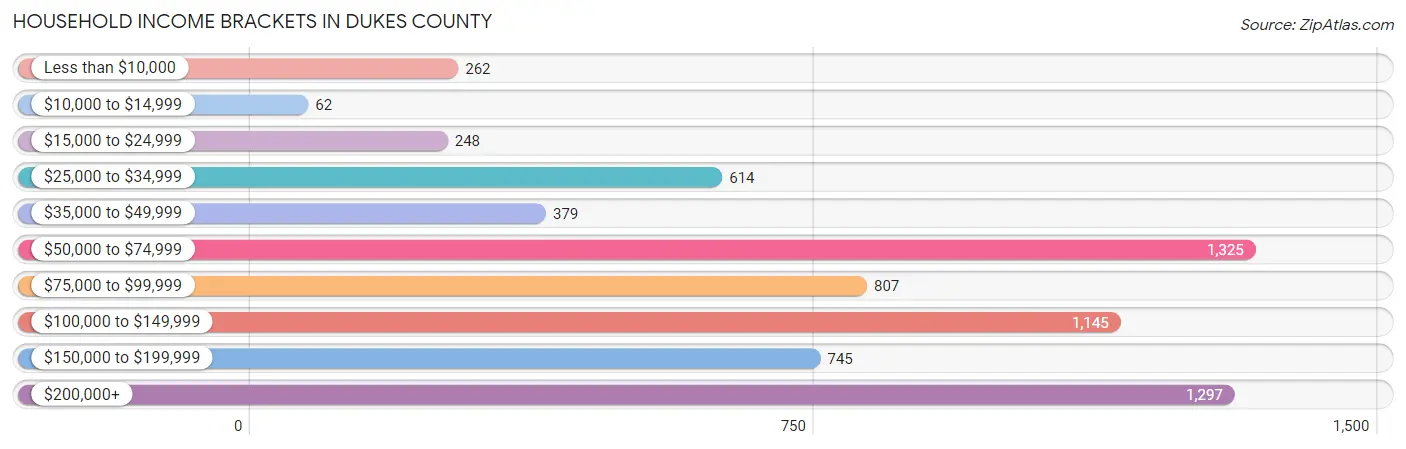
Household Income Brackets in Dukes County
With 1,325 households falling in the category, the $50,000 to $74,999 income range is the most frequent in Dukes County, accounting for 19.2% of all households. In contrast, only 62 households (0.9%) fall into the $10,000 to $14,999 income bracket, making it the least populous group.
| Income Bracket | # Households | % Households |
| Less than $10,000 | 262 | 3.8% |
| $10,000 to $14,999 | 62 | 0.9% |
| $15,000 to $24,999 | 248 | 3.6% |
| $25,000 to $34,999 | 614 | 8.9% |
| $35,000 to $49,999 | 379 | 5.5% |
| $50,000 to $74,999 | 1,325 | 19.2% |
| $75,000 to $99,999 | 807 | 11.7% |
| $100,000 to $149,999 | 1,145 | 16.6% |
| $150,000 to $199,999 | 745 | 10.8% |
| $200,000+ | 1,297 | 18.8% |
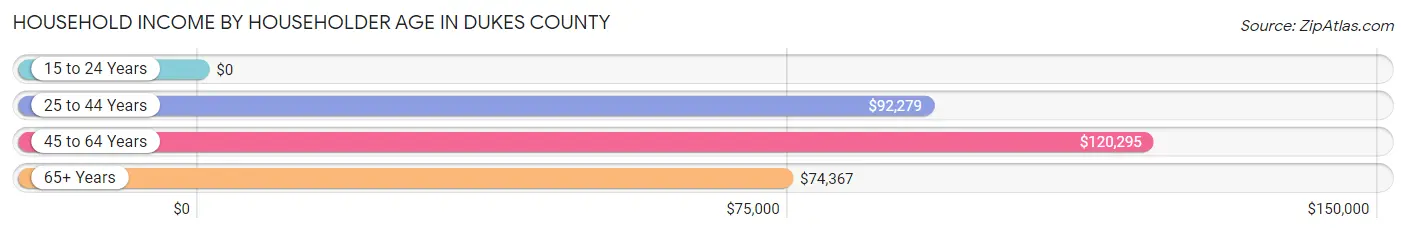
Household Income by Householder Age in Dukes County
The median household income in Dukes County is $93,225, with the highest median household income of $120,295 found in the 45 to 64 years age bracket for the primary householder. A total of 2,594 households (37.6%) fall into this category. Meanwhile, the 15 to 24 years age bracket for the primary householder has the lowest median household income of $0, with 23 households (0.3%) in this group.
| Income Bracket | # Households | Median Income |
| 15 to 24 Years | 23 (0.3%) | $0 |
| 25 to 44 Years | 976 (14.1%) | $92,279 |
| 45 to 64 Years | 2,594 (37.6%) | $120,295 |
| 65+ Years | 3,306 (47.9%) | $74,367 |
| Total | 6,899 (100.0%) | $93,225 |
Poverty in Dukes County
Income Below Poverty by Sex and Age in Dukes County
With 6.2% poverty level for males and 7.2% for females among the residents of Dukes County, 16 and 17 year old males and 45 to 54 year old females are the most vulnerable to poverty, with 82 males (30.5%) and 207 females (17.2%) in their respective age groups living below the poverty level.
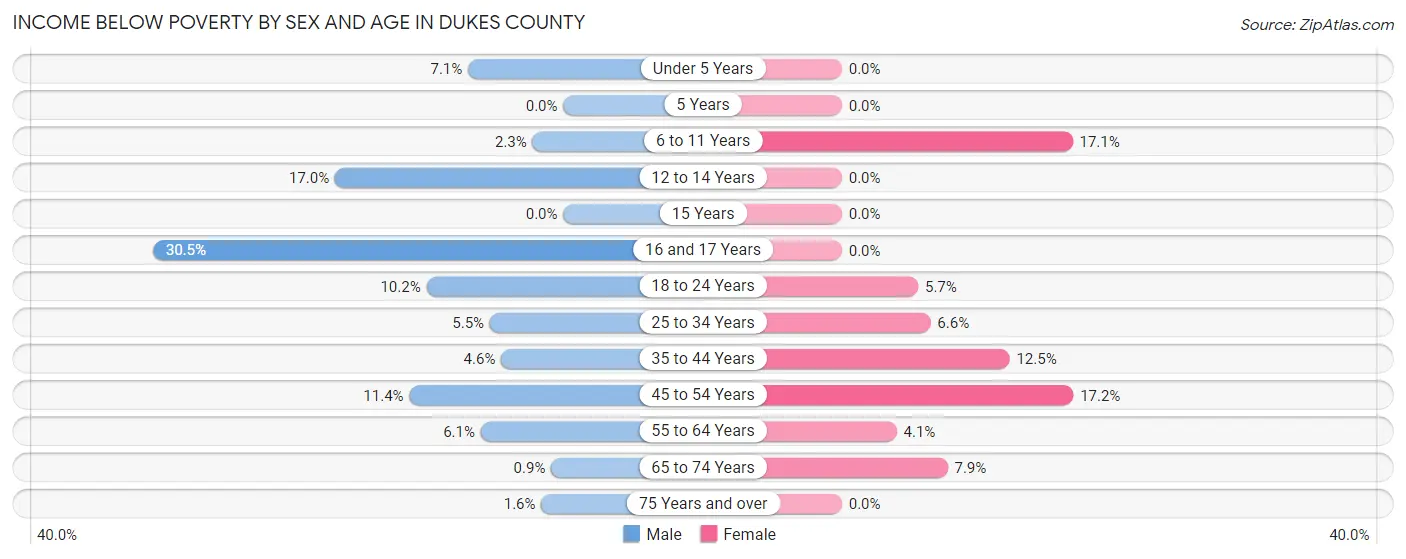
| Age Bracket | Male | Female |
| Under 5 Years | 22 (7.1%) | 0 (0.0%) |
| 5 Years | 0 (0.0%) | 0 (0.0%) |
| 6 to 11 Years | 19 (2.3%) | 87 (17.1%) |
| 12 to 14 Years | 40 (17.0%) | 0 (0.0%) |
| 15 Years | 0 (0.0%) | 0 (0.0%) |
| 16 and 17 Years | 82 (30.5%) | 0 (0.0%) |
| 18 to 24 Years | 64 (10.2%) | 27 (5.7%) |
| 25 to 34 Years | 68 (5.4%) | 78 (6.6%) |
| 35 to 44 Years | 48 (4.6%) | 143 (12.4%) |
| 45 to 54 Years | 144 (11.4%) | 207 (17.2%) |
| 55 to 64 Years | 105 (6.1%) | 70 (4.1%) |
| 65 to 74 Years | 13 (0.9%) | 133 (7.9%) |
| 75 Years and over | 14 (1.6%) | 0 (0.0%) |
| Total | 619 (6.2%) | 745 (7.2%) |
Income Above Poverty by Sex and Age in Dukes County
According to the poverty statistics in Dukes County, males aged 5 years and females aged under 5 years are the age groups that are most secure financially, with 100.0% of males and 100.0% of females in these age groups living above the poverty line.
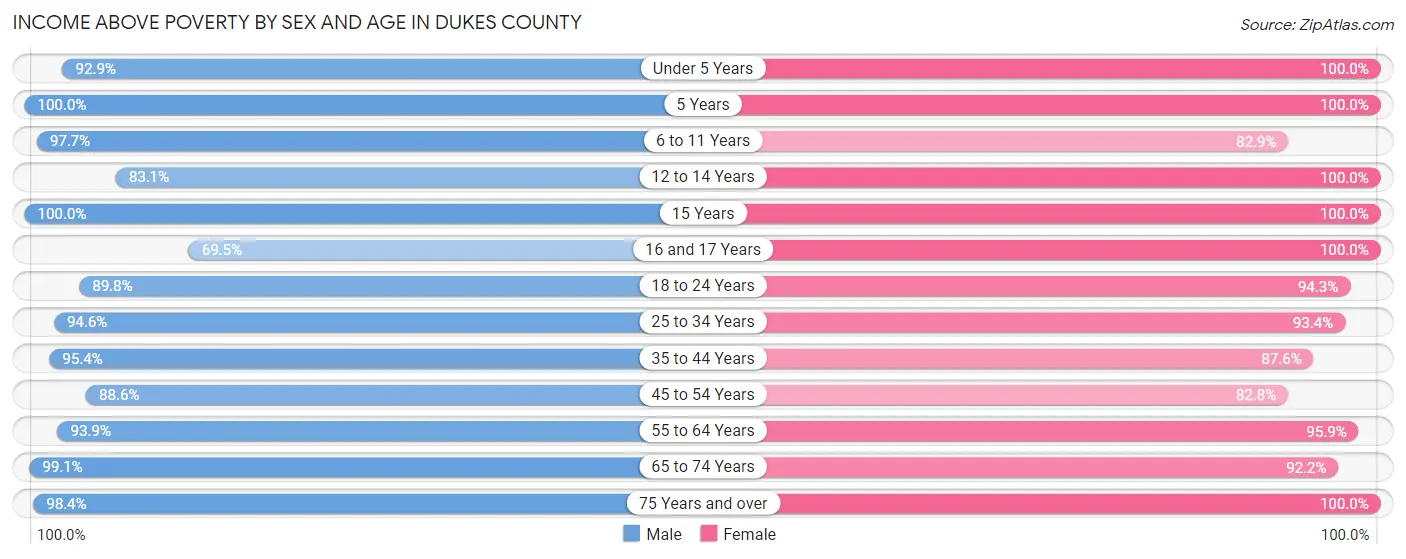
| Age Bracket | Male | Female |
| Under 5 Years | 289 (92.9%) | 413 (100.0%) |
| 5 Years | 7 (100.0%) | 79 (100.0%) |
| 6 to 11 Years | 816 (97.7%) | 421 (82.9%) |
| 12 to 14 Years | 196 (83.1%) | 422 (100.0%) |
| 15 Years | 84 (100.0%) | 168 (100.0%) |
| 16 and 17 Years | 187 (69.5%) | 226 (100.0%) |
| 18 to 24 Years | 566 (89.8%) | 450 (94.3%) |
| 25 to 34 Years | 1,180 (94.6%) | 1,107 (93.4%) |
| 35 to 44 Years | 994 (95.4%) | 1,006 (87.5%) |
| 45 to 54 Years | 1,116 (88.6%) | 998 (82.8%) |
| 55 to 64 Years | 1,609 (93.9%) | 1,649 (95.9%) |
| 65 to 74 Years | 1,427 (99.1%) | 1,562 (92.1%) |
| 75 Years and over | 846 (98.4%) | 1,139 (100.0%) |
| Total | 9,317 (93.8%) | 9,640 (92.8%) |
Income Below Poverty Among Married-Couple Families in Dukes County
The poverty statistics for married-couple families in Dukes County show that 1.0% or 33 of the total 3,403 families live below the poverty line. Families with no children have the highest poverty rate of 1.5%, comprising of 33 families. On the other hand, families with 1 or 2 children have the lowest poverty rate of 0.0%, which includes 0 families.
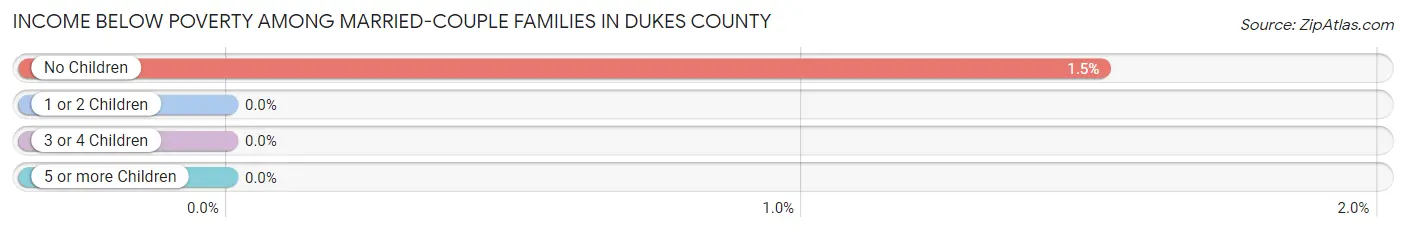
| Children | Above Poverty | Below Poverty |
| No Children | 2,135 (98.5%) | 33 (1.5%) |
| 1 or 2 Children | 1,176 (100.0%) | 0 (0.0%) |
| 3 or 4 Children | 59 (100.0%) | 0 (0.0%) |
| 5 or more Children | 0 (0.0%) | 0 (0.0%) |
| Total | 3,370 (99.0%) | 33 (1.0%) |
Income Below Poverty Among Single-Parent Households in Dukes County
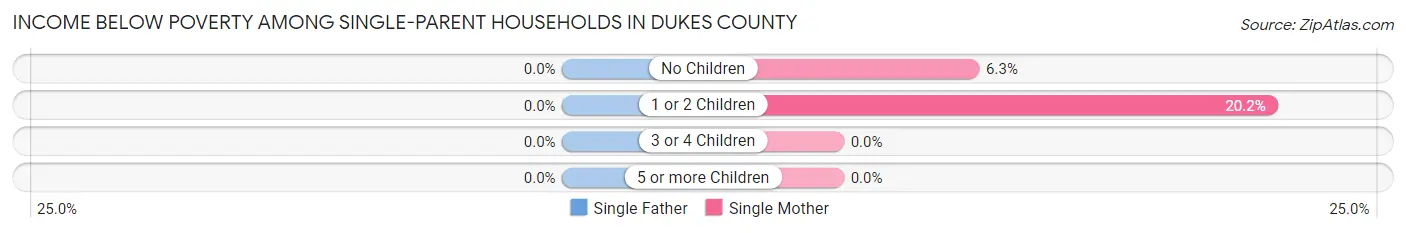
| Children | Single Father | Single Mother |
| No Children | 0 (0.0%) | 14 (6.3%) |
| 1 or 2 Children | 0 (0.0%) | 62 (20.2%) |
| 3 or 4 Children | 0 (0.0%) | 0 (0.0%) |
| 5 or more Children | 0 (0.0%) | 0 (0.0%) |
| Total | 0 (0.0%) | 76 (14.3%) |
Income Below Poverty Among Married-Couple vs Single-Parent Households in Dukes County
The poverty data for Dukes County shows that 33 of the married-couple family households (1.0%) and 76 of the single-parent households (9.7%) are living below the poverty level. Within the married-couple family households, those with no children have the highest poverty rate, with 33 households (1.5%) falling below the poverty line. Among the single-parent households, those with 1 or 2 children have the highest poverty rate, with 62 household (15.9%) living below poverty.
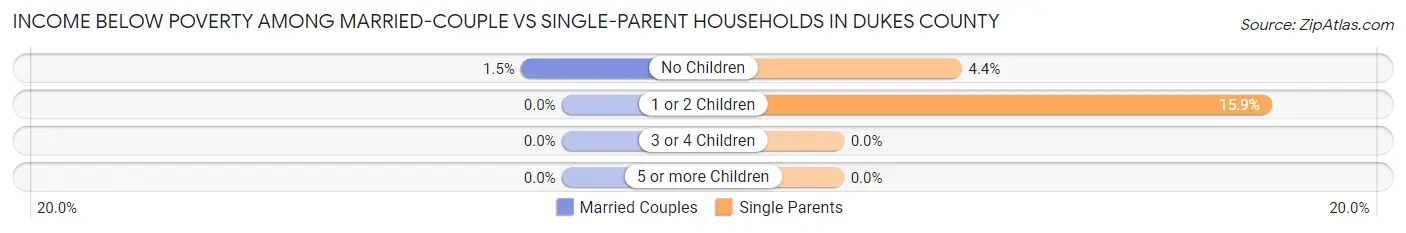
| Children | Married-Couple Families | Single-Parent Households |
| No Children | 33 (1.5%) | 14 (4.4%) |
| 1 or 2 Children | 0 (0.0%) | 62 (15.9%) |
| 3 or 4 Children | 0 (0.0%) | 0 (0.0%) |
| 5 or more Children | 0 (0.0%) | 0 (0.0%) |
| Total | 33 (1.0%) | 76 (9.7%) |
Employment Characteristics in Dukes County
Employment by Class of Employer in Dukes County
Among the 10,084 employed individuals in Dukes County, private company employees (5,284 | 52.4%), self-employed (not incorporated) (1,859 | 18.4%), and local government employees (1,007 | 10.0%) make up the most common classes of employment.
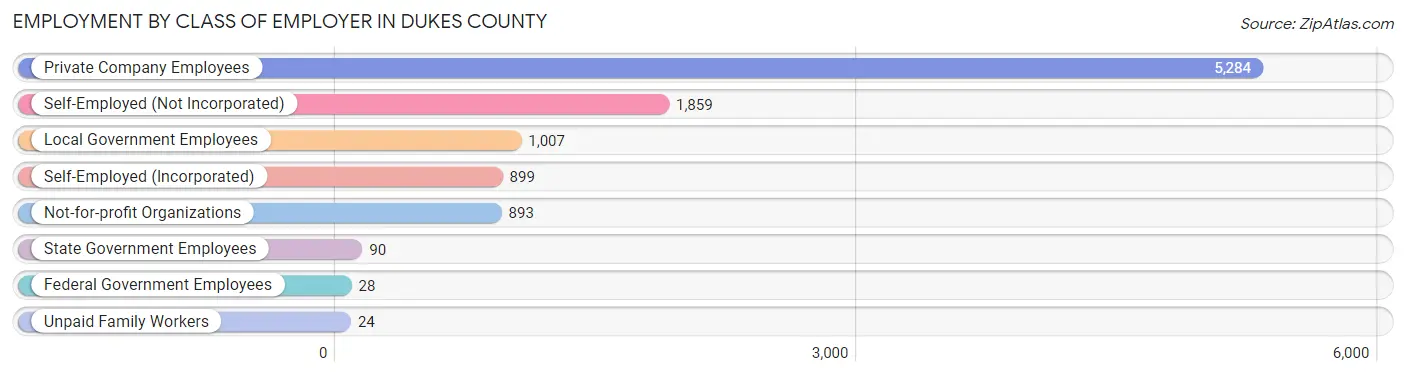
| Employer Class | # Employees | % Employees |
| Private Company Employees | 5,284 | 52.4% |
| Self-Employed (Incorporated) | 899 | 8.9% |
| Self-Employed (Not Incorporated) | 1,859 | 18.4% |
| Not-for-profit Organizations | 893 | 8.9% |
| Local Government Employees | 1,007 | 10.0% |
| State Government Employees | 90 | 0.9% |
| Federal Government Employees | 28 | 0.3% |
| Unpaid Family Workers | 24 | 0.2% |
| Total | 10,084 | 100.0% |
Employment Status by Age in Dukes County
According to the labor force statistics for Dukes County, out of the total population over 16 years of age (17,379), 64.9% or 11,279 individuals are in the labor force, with 7.0% or 790 of them unemployed. The age group with the highest labor force participation rate is 30 to 34 years, with 96.4% or 1,192 individuals in the labor force. Within the labor force, the 20 to 24 years age range has the highest percentage of unemployed individuals, with 24.8% or 132 of them being unemployed.
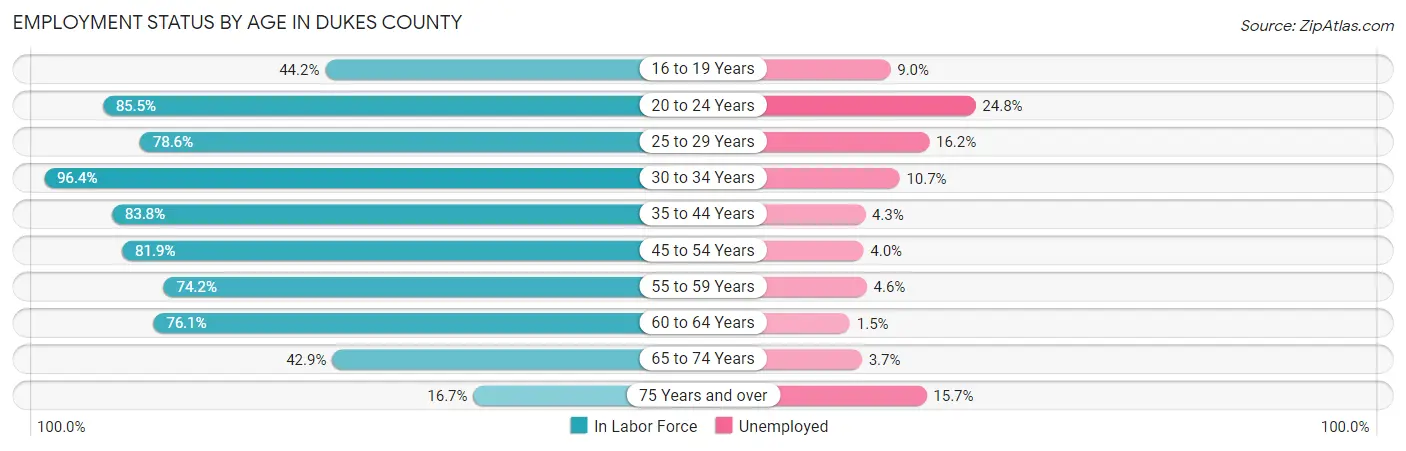
| Age Bracket | In Labor Force | Unemployed |
| 16 to 19 Years | 456 (44.2%) | 41 (9.0%) |
| 20 to 24 Years | 532 (85.5%) | 132 (24.8%) |
| 25 to 29 Years | 949 (78.6%) | 154 (16.2%) |
| 30 to 34 Years | 1,192 (96.4%) | 128 (10.7%) |
| 35 to 44 Years | 1,842 (83.8%) | 79 (4.3%) |
| 45 to 54 Years | 2,019 (81.9%) | 81 (4.0%) |
| 55 to 59 Years | 1,239 (74.2%) | 57 (4.6%) |
| 60 to 64 Years | 1,367 (76.1%) | 21 (1.5%) |
| 65 to 74 Years | 1,345 (42.9%) | 50 (3.7%) |
| 75 Years and over | 337 (16.7%) | 53 (15.7%) |
| Total | 11,279 (64.9%) | 790 (7.0%) |
Employment Status by Educational Attainment in Dukes County
According to labor force statistics for Dukes County, 81.4% of individuals (8,606) out of the total population between 25 and 64 years of age (10,573) are in the labor force, with 6.0% or 516 of them being unemployed. The group with the highest labor force participation rate are those with the educational attainment of bachelor's degree or higher, with 89.1% or 3,577 individuals in the labor force. Within the labor force, individuals with college / associate degree education have the highest percentage of unemployment, with 10.7% or 228 of them being unemployed.
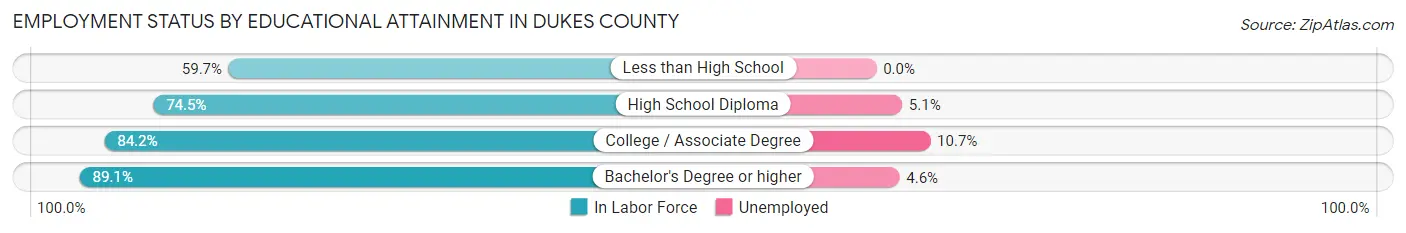
| Educational Attainment | In Labor Force | Unemployed |
| Less than High School | 411 (59.7%) | 0 (0.0%) |
| High School Diploma | 2,488 (74.5%) | 170 (5.1%) |
| College / Associate Degree | 2,130 (84.2%) | 271 (10.7%) |
| Bachelor's Degree or higher | 3,577 (89.1%) | 185 (4.6%) |
| Total | 8,606 (81.4%) | 634 (6.0%) |
Employment Occupations by Sex in Dukes County
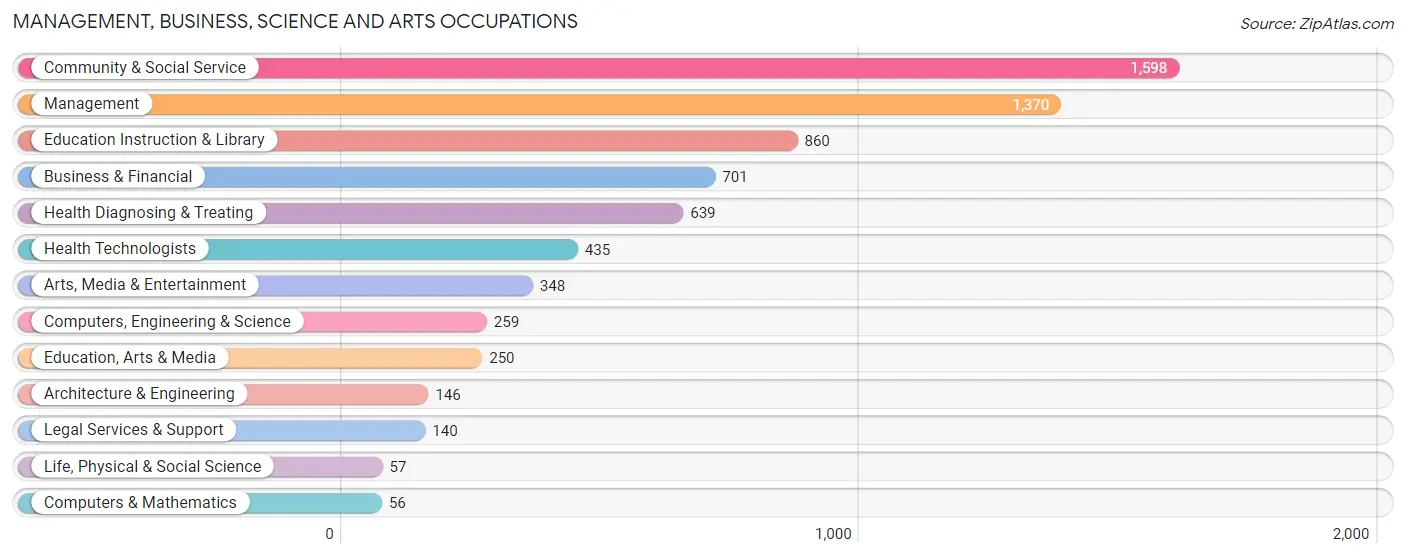
Management, Business, Science and Arts Occupations
The most common Management, Business, Science and Arts occupations in Dukes County are Community & Social Service (1,598 | 15.3%), Management (1,370 | 13.1%), Education Instruction & Library (860 | 8.2%), Business & Financial (701 | 6.7%), and Health Diagnosing & Treating (639 | 6.1%).
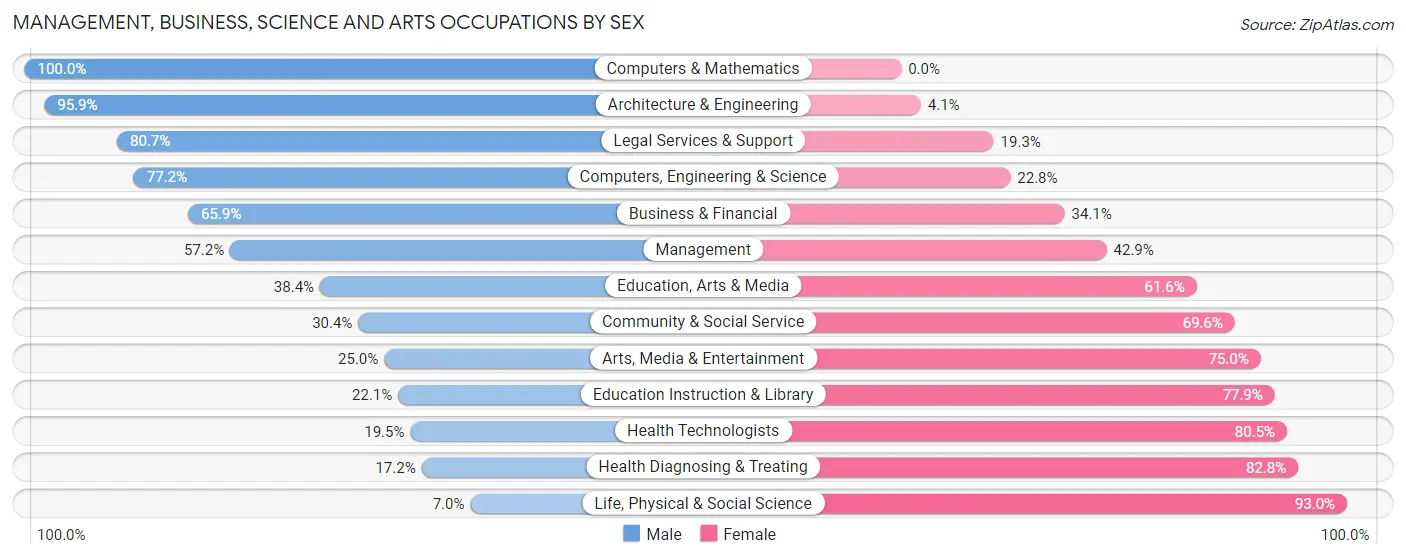
Management, Business, Science and Arts Occupations by Sex
Within the Management, Business, Science and Arts occupations in Dukes County, the most male-oriented occupations are Computers & Mathematics (100.0%), Architecture & Engineering (95.9%), and Legal Services & Support (80.7%), while the most female-oriented occupations are Life, Physical & Social Science (93.0%), Health Diagnosing & Treating (82.8%), and Health Technologists (80.5%).
| Occupation | Male | Female |
| Management | 783 (57.2%) | 587 (42.8%) |
| Business & Financial | 462 (65.9%) | 239 (34.1%) |
| Computers, Engineering & Science | 200 (77.2%) | 59 (22.8%) |
| Computers & Mathematics | 56 (100.0%) | 0 (0.0%) |
| Architecture & Engineering | 140 (95.9%) | 6 (4.1%) |
| Life, Physical & Social Science | 4 (7.0%) | 53 (93.0%) |
| Community & Social Service | 486 (30.4%) | 1,112 (69.6%) |
| Education, Arts & Media | 96 (38.4%) | 154 (61.6%) |
| Legal Services & Support | 113 (80.7%) | 27 (19.3%) |
| Education Instruction & Library | 190 (22.1%) | 670 (77.9%) |
| Arts, Media & Entertainment | 87 (25.0%) | 261 (75.0%) |
| Health Diagnosing & Treating | 110 (17.2%) | 529 (82.8%) |
| Health Technologists | 85 (19.5%) | 350 (80.5%) |
| Total (Category) | 2,041 (44.7%) | 2,526 (55.3%) |
| Total (Overall) | 5,635 (53.8%) | 4,839 (46.2%) |
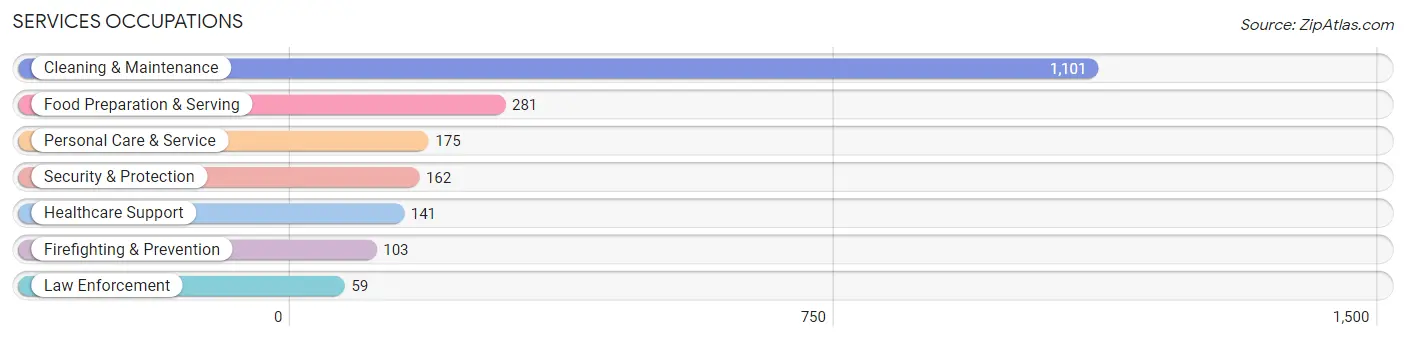
Services Occupations
The most common Services occupations in Dukes County are Cleaning & Maintenance (1,101 | 10.5%), Food Preparation & Serving (281 | 2.7%), Personal Care & Service (175 | 1.7%), Security & Protection (162 | 1.5%), and Healthcare Support (141 | 1.3%).
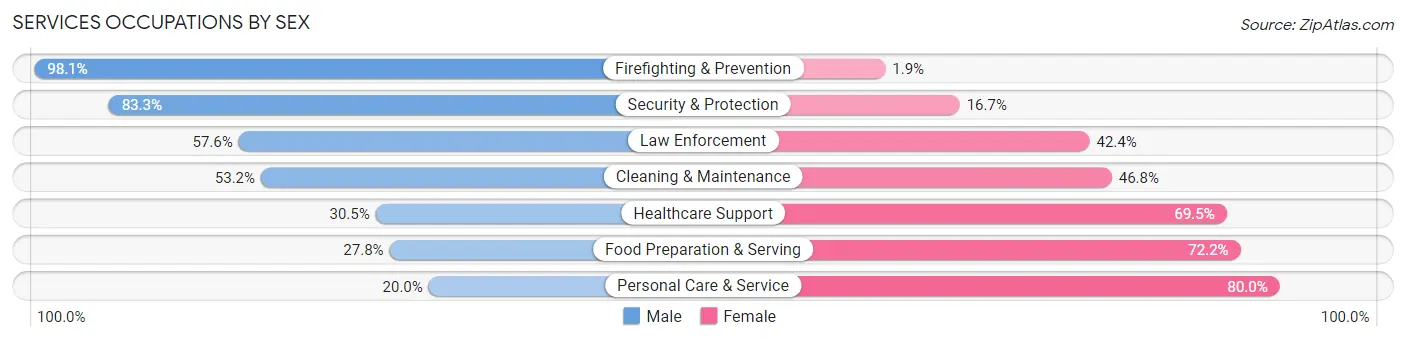
Services Occupations by Sex
Within the Services occupations in Dukes County, the most male-oriented occupations are Firefighting & Prevention (98.1%), Security & Protection (83.3%), and Law Enforcement (57.6%), while the most female-oriented occupations are Personal Care & Service (80.0%), Food Preparation & Serving (72.2%), and Healthcare Support (69.5%).
| Occupation | Male | Female |
| Healthcare Support | 43 (30.5%) | 98 (69.5%) |
| Security & Protection | 135 (83.3%) | 27 (16.7%) |
| Firefighting & Prevention | 101 (98.1%) | 2 (1.9%) |
| Law Enforcement | 34 (57.6%) | 25 (42.4%) |
| Food Preparation & Serving | 78 (27.8%) | 203 (72.2%) |
| Cleaning & Maintenance | 586 (53.2%) | 515 (46.8%) |
| Personal Care & Service | 35 (20.0%) | 140 (80.0%) |
| Total (Category) | 877 (47.1%) | 983 (52.8%) |
| Total (Overall) | 5,635 (53.8%) | 4,839 (46.2%) |
Sales and Office Occupations
The most common Sales and Office occupations in Dukes County are Sales & Related (990 | 9.5%), and Office & Administration (648 | 6.2%).
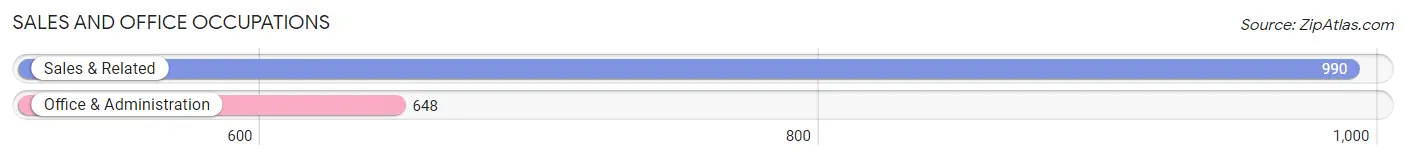
Sales and Office Occupations by Sex

| Occupation | Male | Female |
| Sales & Related | 454 (45.9%) | 536 (54.1%) |
| Office & Administration | 68 (10.5%) | 580 (89.5%) |
| Total (Category) | 522 (31.9%) | 1,116 (68.1%) |
| Total (Overall) | 5,635 (53.8%) | 4,839 (46.2%) |
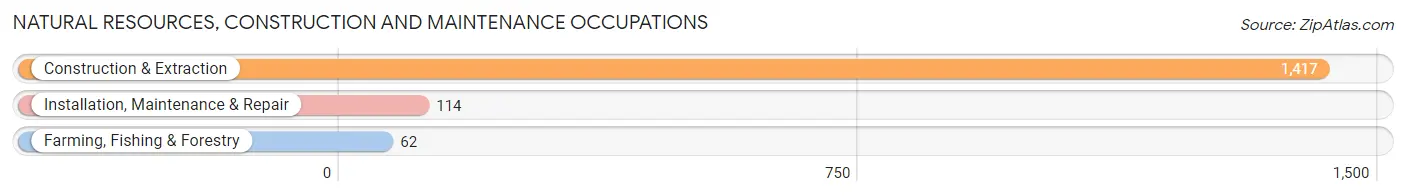
Natural Resources, Construction and Maintenance Occupations
The most common Natural Resources, Construction and Maintenance occupations in Dukes County are Construction & Extraction (1,417 | 13.5%), Installation, Maintenance & Repair (114 | 1.1%), and Farming, Fishing & Forestry (62 | 0.6%).
Natural Resources, Construction and Maintenance Occupations by Sex
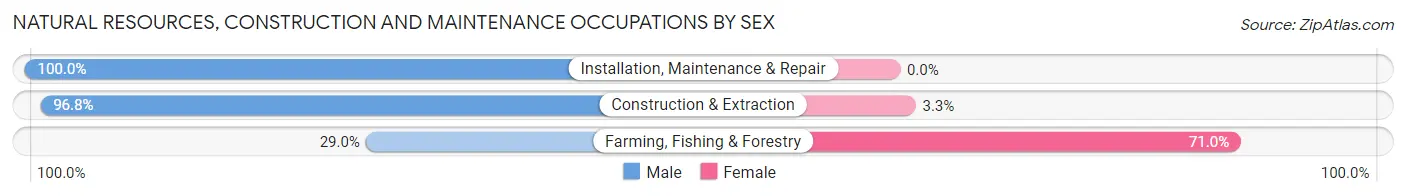
| Occupation | Male | Female |
| Farming, Fishing & Forestry | 18 (29.0%) | 44 (71.0%) |
| Construction & Extraction | 1,371 (96.8%) | 46 (3.3%) |
| Installation, Maintenance & Repair | 114 (100.0%) | 0 (0.0%) |
| Total (Category) | 1,503 (94.4%) | 90 (5.7%) |
| Total (Overall) | 5,635 (53.8%) | 4,839 (46.2%) |
Production, Transportation and Moving Occupations
The most common Production, Transportation and Moving occupations in Dukes County are Transportation (360 | 3.4%), Production (338 | 3.2%), and Material Moving (118 | 1.1%).
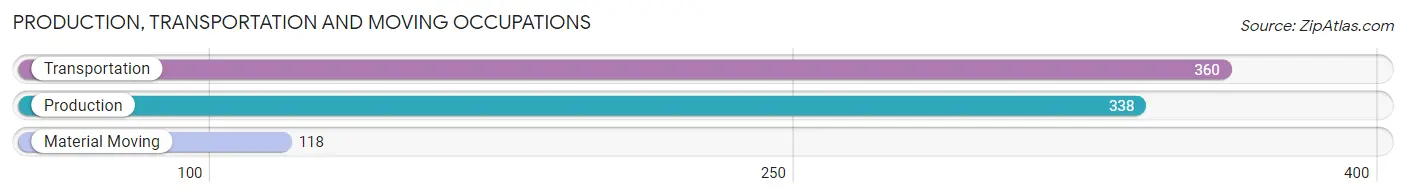
Production, Transportation and Moving Occupations by Sex
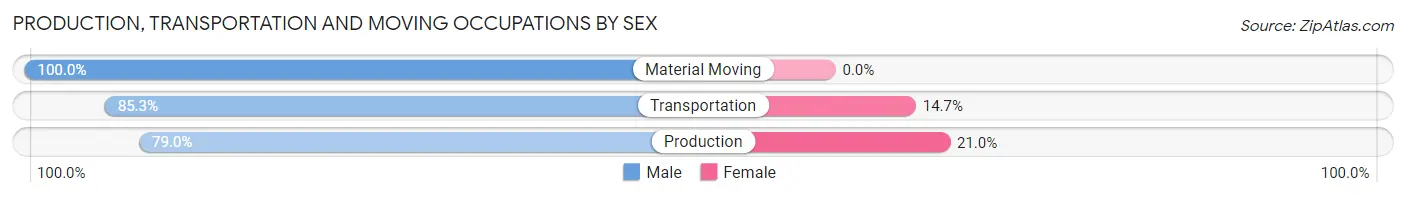
| Occupation | Male | Female |
| Production | 267 (79.0%) | 71 (21.0%) |
| Transportation | 307 (85.3%) | 53 (14.7%) |
| Material Moving | 118 (100.0%) | 0 (0.0%) |
| Total (Category) | 692 (84.8%) | 124 (15.2%) |
| Total (Overall) | 5,635 (53.8%) | 4,839 (46.2%) |
Employment Industries by Sex in Dukes County
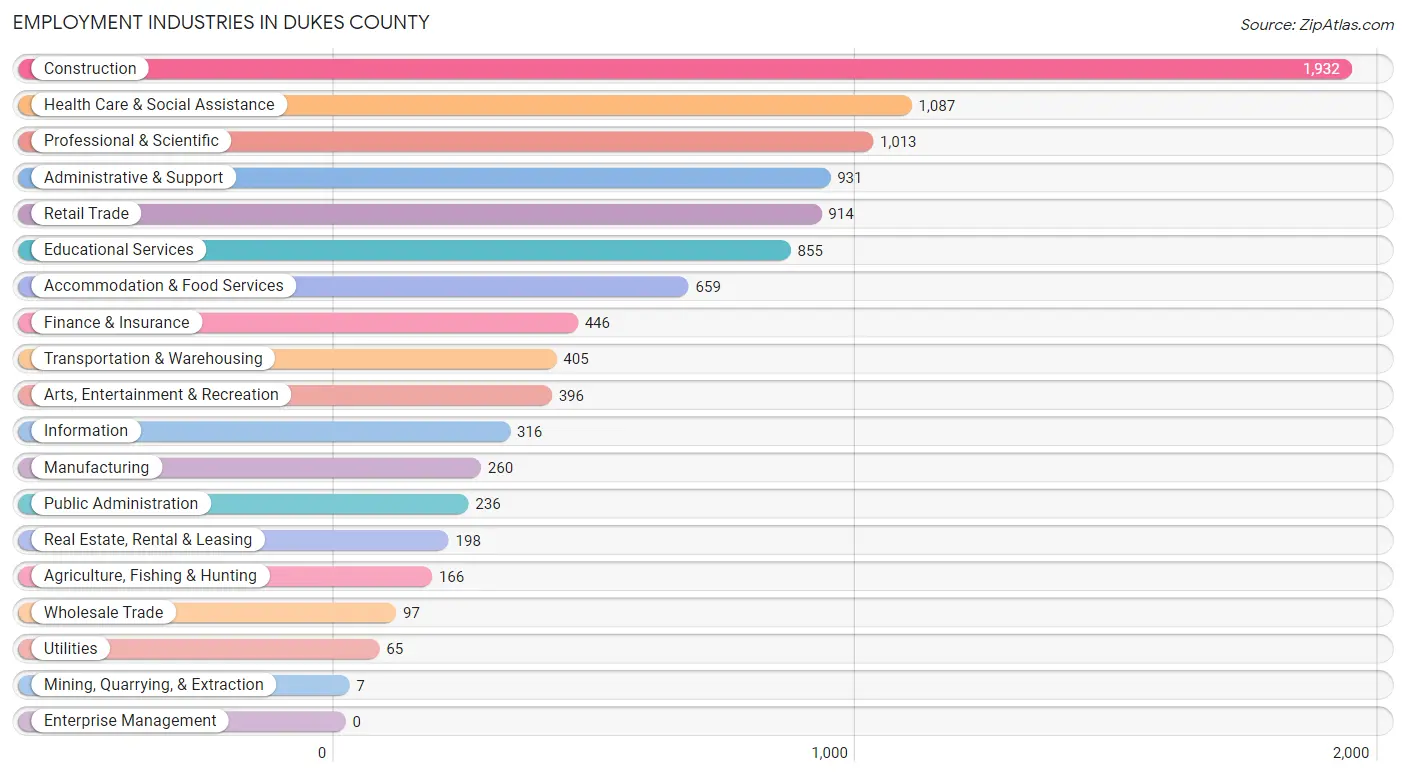
Employment Industries in Dukes County
The major employment industries in Dukes County include Construction (1,932 | 18.4%), Health Care & Social Assistance (1,087 | 10.4%), Professional & Scientific (1,013 | 9.7%), Administrative & Support (931 | 8.9%), and Retail Trade (914 | 8.7%).
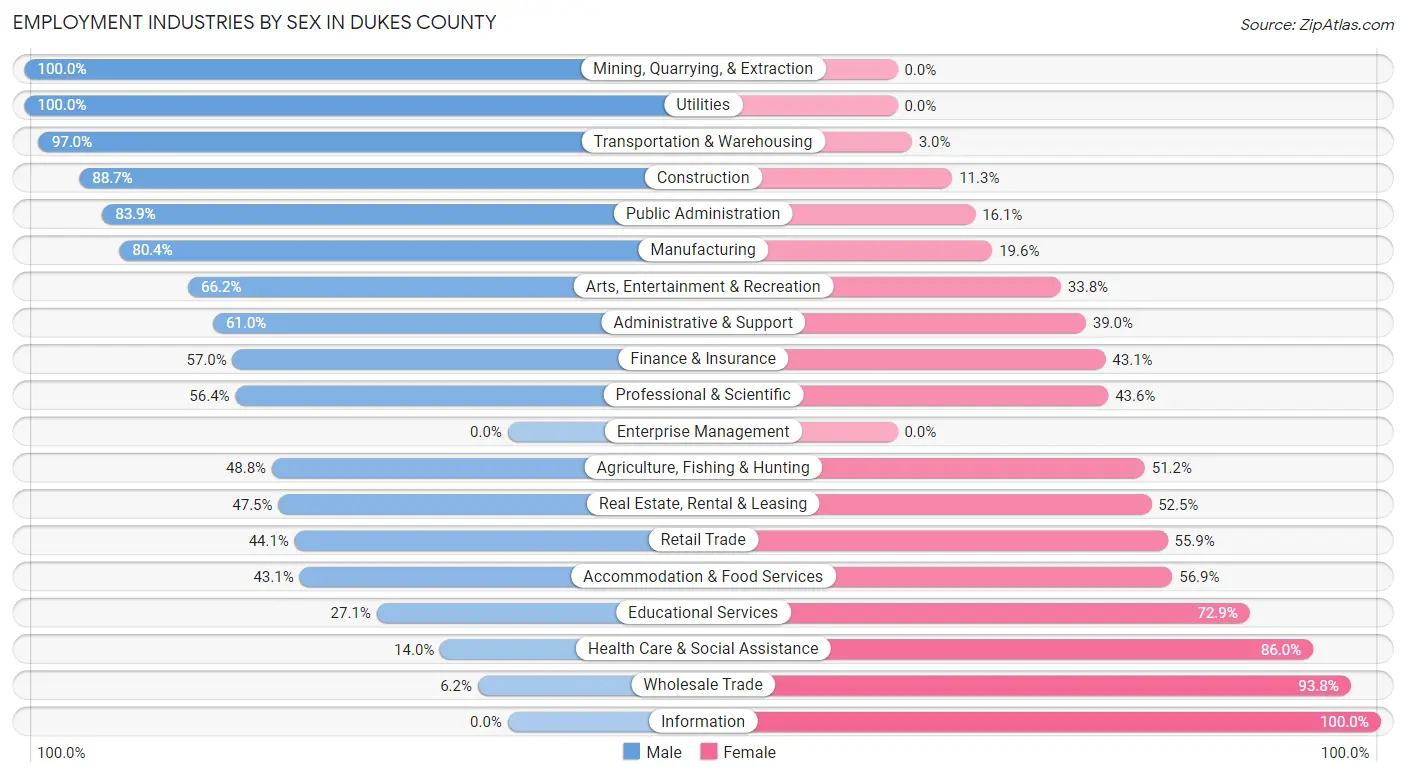
Employment Industries by Sex in Dukes County
The Dukes County industries that see more men than women are Mining, Quarrying, & Extraction (100.0%), Utilities (100.0%), and Transportation & Warehousing (97.0%), whereas the industries that tend to have a higher number of women are Information (100.0%), Wholesale Trade (93.8%), and Health Care & Social Assistance (86.0%).
| Industry | Male | Female |
| Agriculture, Fishing & Hunting | 81 (48.8%) | 85 (51.2%) |
| Mining, Quarrying, & Extraction | 7 (100.0%) | 0 (0.0%) |
| Construction | 1,713 (88.7%) | 219 (11.3%) |
| Manufacturing | 209 (80.4%) | 51 (19.6%) |
| Wholesale Trade | 6 (6.2%) | 91 (93.8%) |
| Retail Trade | 403 (44.1%) | 511 (55.9%) |
| Transportation & Warehousing | 393 (97.0%) | 12 (3.0%) |
| Utilities | 65 (100.0%) | 0 (0.0%) |
| Information | 0 (0.0%) | 316 (100.0%) |
| Finance & Insurance | 254 (57.0%) | 192 (43.0%) |
| Real Estate, Rental & Leasing | 94 (47.5%) | 104 (52.5%) |
| Professional & Scientific | 571 (56.4%) | 442 (43.6%) |
| Enterprise Management | 0 (0.0%) | 0 (0.0%) |
| Administrative & Support | 568 (61.0%) | 363 (39.0%) |
| Educational Services | 232 (27.1%) | 623 (72.9%) |
| Health Care & Social Assistance | 152 (14.0%) | 935 (86.0%) |
| Arts, Entertainment & Recreation | 262 (66.2%) | 134 (33.8%) |
| Accommodation & Food Services | 284 (43.1%) | 375 (56.9%) |
| Public Administration | 198 (83.9%) | 38 (16.1%) |
| Total | 5,635 (53.8%) | 4,839 (46.2%) |
Education in Dukes County
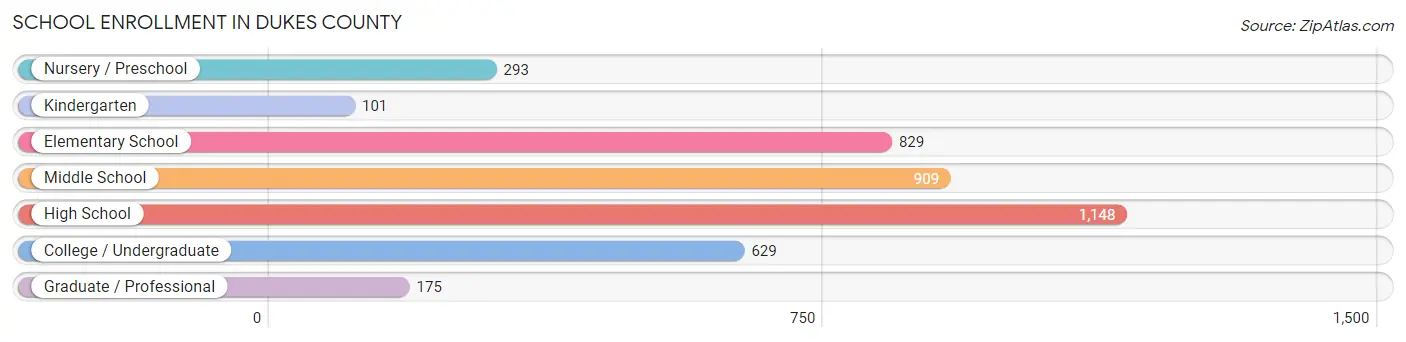
School Enrollment in Dukes County
The most common levels of schooling among the 4,084 students in Dukes County are high school (1,148 | 28.1%), middle school (909 | 22.3%), and elementary school (829 | 20.3%).
| School Level | # Students | % Students |
| Nursery / Preschool | 293 | 7.2% |
| Kindergarten | 101 | 2.5% |
| Elementary School | 829 | 20.3% |
| Middle School | 909 | 22.3% |
| High School | 1,148 | 28.1% |
| College / Undergraduate | 629 | 15.4% |
| Graduate / Professional | 175 | 4.3% |
| Total | 4,084 | 100.0% |
School Enrollment by Age by Funding Source in Dukes County
Out of a total of 4,084 students who are enrolled in schools in Dukes County, 898 (22.0%) attend a private institution, while the remaining 3,186 (78.0%) are enrolled in public schools. The age group of 3 to 4 year olds has the highest likelihood of being enrolled in private schools, with 173 (68.4% in the age bracket) enrolled. Conversely, the age group of 5 to 9 year old has the lowest likelihood of being enrolled in a private school, with 735 (96.8% in the age bracket) attending a public institution.
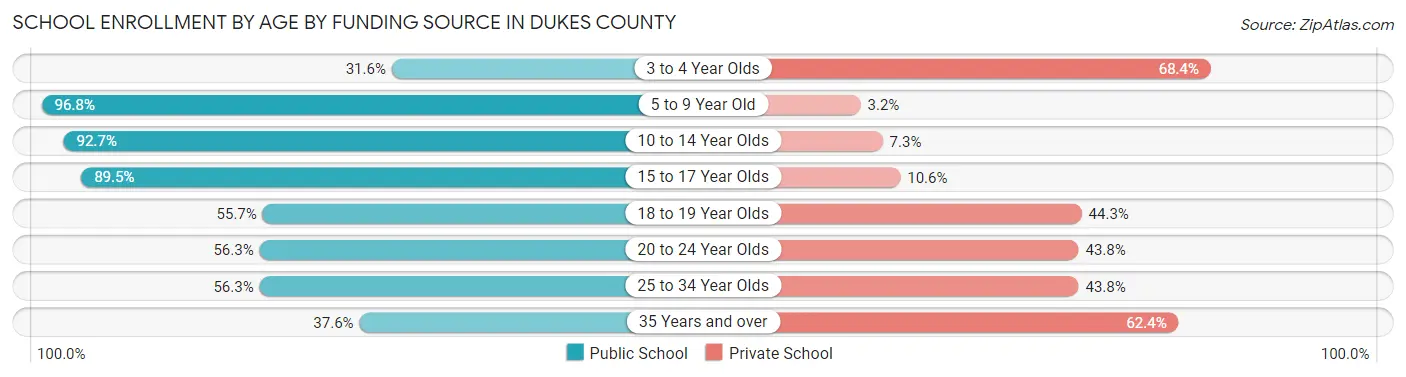
| Age Bracket | Public School | Private School |
| 3 to 4 Year Olds | 80 (31.6%) | 173 (68.4%) |
| 5 to 9 Year Old | 735 (96.8%) | 24 (3.2%) |
| 10 to 14 Year Olds | 1,124 (92.7%) | 88 (7.3%) |
| 15 to 17 Year Olds | 678 (89.4%) | 80 (10.5%) |
| 18 to 19 Year Olds | 280 (55.7%) | 223 (44.3%) |
| 20 to 24 Year Olds | 153 (56.2%) | 119 (43.8%) |
| 25 to 34 Year Olds | 36 (56.2%) | 28 (43.8%) |
| 35 Years and over | 99 (37.6%) | 164 (62.4%) |
| Total | 3,186 (78.0%) | 898 (22.0%) |
Educational Attainment by Field of Study in Dukes County
Social sciences (1,099 | 14.7%), business (1,012 | 13.5%), education (929 | 12.4%), literature & languages (849 | 11.4%), and science & technology (592 | 7.9%) are the most common fields of study among 7,473 individuals in Dukes County who have obtained a bachelor's degree or higher.
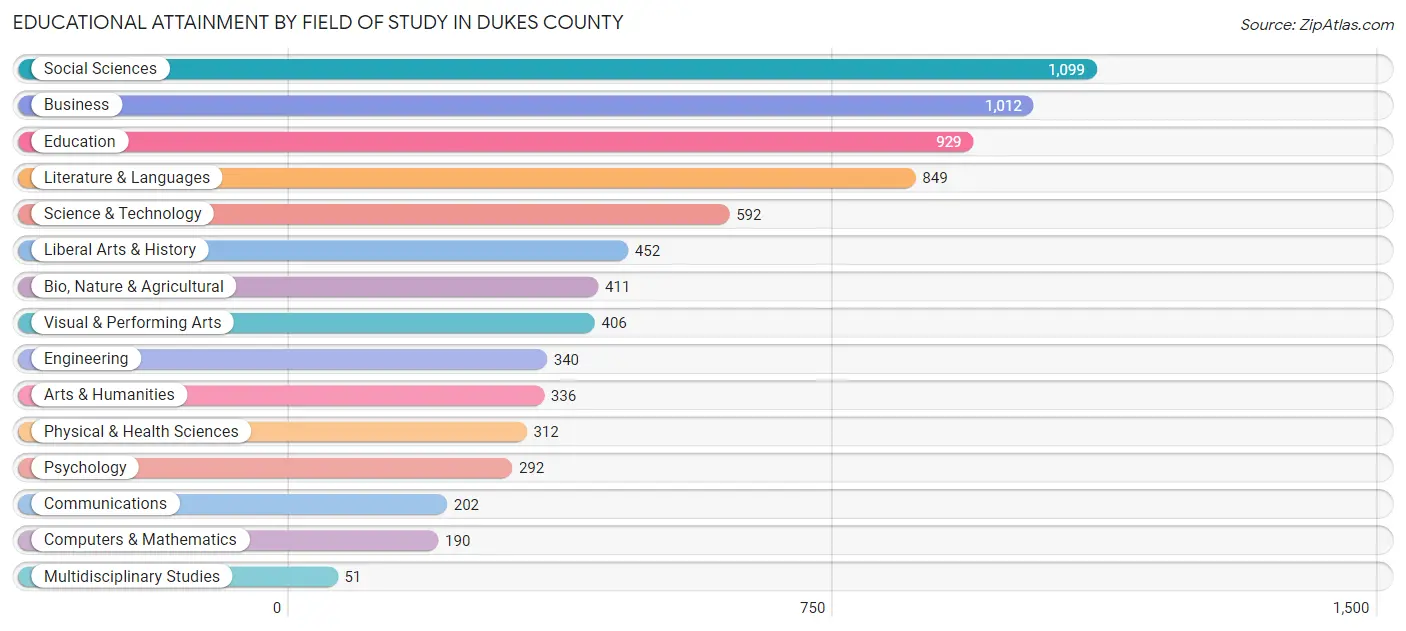
| Field of Study | # Graduates | % Graduates |
| Computers & Mathematics | 190 | 2.5% |
| Bio, Nature & Agricultural | 411 | 5.5% |
| Physical & Health Sciences | 312 | 4.2% |
| Psychology | 292 | 3.9% |
| Social Sciences | 1,099 | 14.7% |
| Engineering | 340 | 4.5% |
| Multidisciplinary Studies | 51 | 0.7% |
| Science & Technology | 592 | 7.9% |
| Business | 1,012 | 13.5% |
| Education | 929 | 12.4% |
| Literature & Languages | 849 | 11.4% |
| Liberal Arts & History | 452 | 6.0% |
| Visual & Performing Arts | 406 | 5.4% |
| Communications | 202 | 2.7% |
| Arts & Humanities | 336 | 4.5% |
| Total | 7,473 | 100.0% |
Transportation & Commute in Dukes County
Vehicle Availability by Sex in Dukes County
The most prevalent vehicle ownership categories in Dukes County are males with 2 vehicles (1,466, accounting for 27.2%) and females with 2 vehicles (1,638, making up 31.6%).
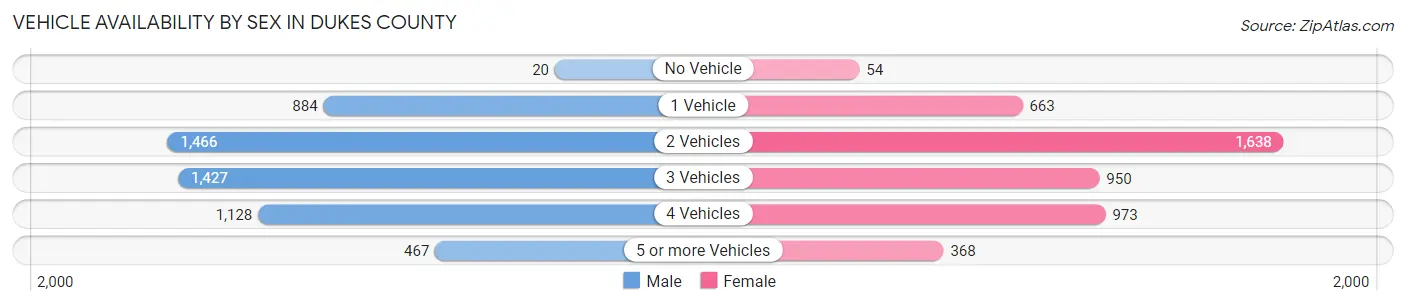
| Vehicles Available | Male | Female |
| No Vehicle | 20 (0.4%) | 54 (1.2%) |
| 1 Vehicle | 884 (16.4%) | 663 (14.3%) |
| 2 Vehicles | 1,466 (27.2%) | 1,638 (35.3%) |
| 3 Vehicles | 1,427 (26.5%) | 950 (20.4%) |
| 4 Vehicles | 1,128 (20.9%) | 973 (20.9%) |
| 5 or more Vehicles | 467 (8.7%) | 368 (7.9%) |
| Total | 5,392 (100.0%) | 4,646 (100.0%) |
Commute Time in Dukes County
The most frequently occuring commute durations in Dukes County are 10 to 14 minutes (1,929 commuters, 23.3%), 15 to 19 minutes (1,749 commuters, 21.1%), and 5 to 9 minutes (1,528 commuters, 18.4%).
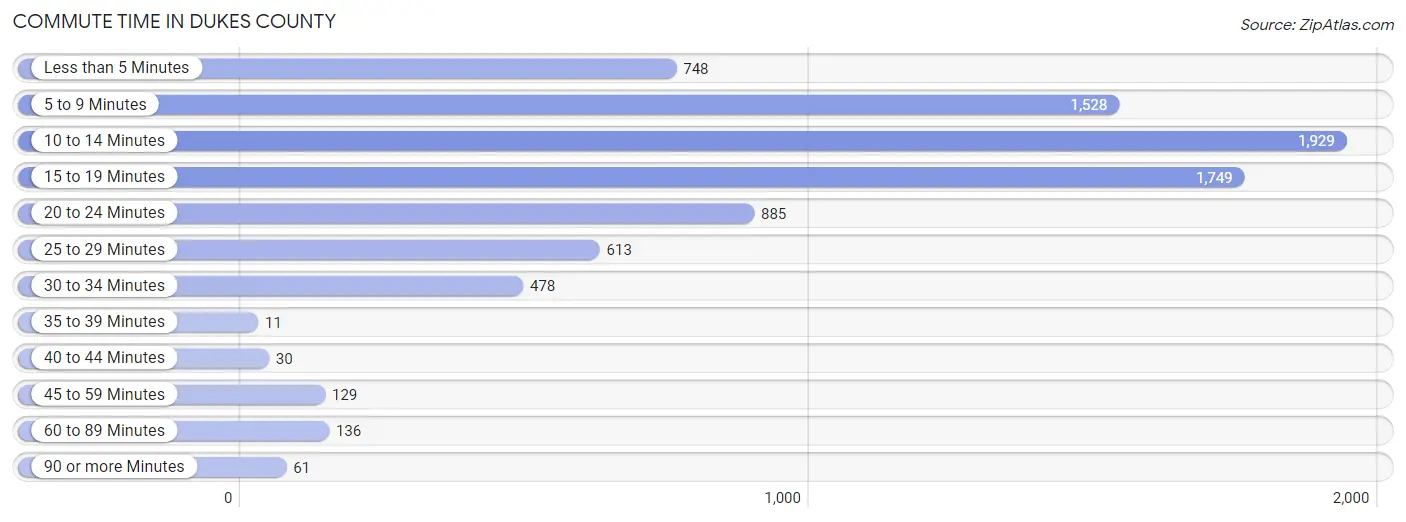
| Commute Time | # Commuters | % Commuters |
| Less than 5 Minutes | 748 | 9.0% |
| 5 to 9 Minutes | 1,528 | 18.4% |
| 10 to 14 Minutes | 1,929 | 23.3% |
| 15 to 19 Minutes | 1,749 | 21.1% |
| 20 to 24 Minutes | 885 | 10.7% |
| 25 to 29 Minutes | 613 | 7.4% |
| 30 to 34 Minutes | 478 | 5.8% |
| 35 to 39 Minutes | 11 | 0.1% |
| 40 to 44 Minutes | 30 | 0.4% |
| 45 to 59 Minutes | 129 | 1.5% |
| 60 to 89 Minutes | 136 | 1.6% |
| 90 or more Minutes | 61 | 0.7% |
Commute Time by Sex in Dukes County
The most common commute times in Dukes County are 10 to 14 minutes (1,092 commuters, 24.4%) for males and 15 to 19 minutes (870 commuters, 22.8%) for females.

| Commute Time | Male | Female |
| Less than 5 Minutes | 363 (8.1%) | 385 (10.1%) |
| 5 to 9 Minutes | 722 (16.1%) | 806 (21.1%) |
| 10 to 14 Minutes | 1,092 (24.4%) | 837 (21.9%) |
| 15 to 19 Minutes | 879 (19.7%) | 870 (22.8%) |
| 20 to 24 Minutes | 432 (9.7%) | 453 (11.8%) |
| 25 to 29 Minutes | 403 (9.0%) | 210 (5.5%) |
| 30 to 34 Minutes | 291 (6.5%) | 187 (4.9%) |
| 35 to 39 Minutes | 0 (0.0%) | 11 (0.3%) |
| 40 to 44 Minutes | 26 (0.6%) | 4 (0.1%) |
| 45 to 59 Minutes | 124 (2.8%) | 5 (0.1%) |
| 60 to 89 Minutes | 79 (1.8%) | 57 (1.5%) |
| 90 or more Minutes | 61 (1.4%) | 0 (0.0%) |
Time of Departure to Work by Sex in Dukes County
The most frequent times of departure to work in Dukes County are 7:00 AM to 7:29 AM (1,185, 26.5%) for males and 7:30 AM to 7:59 AM (1,083, 28.3%) for females.
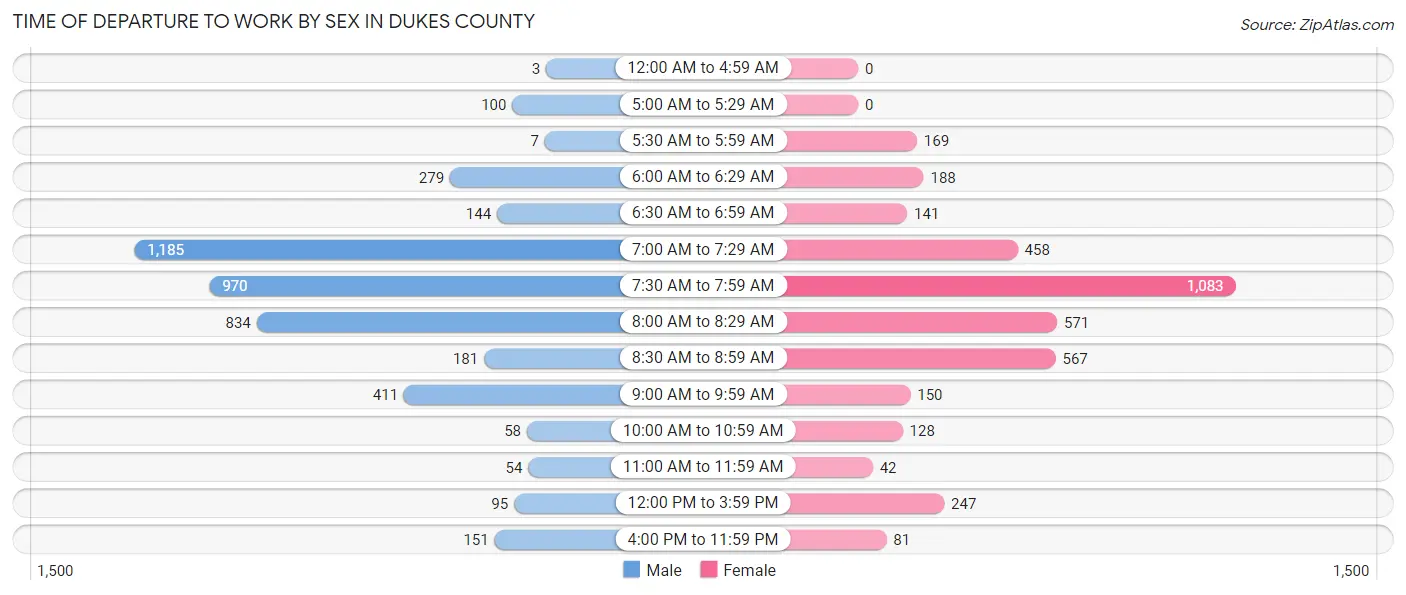
| Time of Departure | Male | Female |
| 12:00 AM to 4:59 AM | 3 (0.1%) | 0 (0.0%) |
| 5:00 AM to 5:29 AM | 100 (2.2%) | 0 (0.0%) |
| 5:30 AM to 5:59 AM | 7 (0.2%) | 169 (4.4%) |
| 6:00 AM to 6:29 AM | 279 (6.2%) | 188 (4.9%) |
| 6:30 AM to 6:59 AM | 144 (3.2%) | 141 (3.7%) |
| 7:00 AM to 7:29 AM | 1,185 (26.5%) | 458 (12.0%) |
| 7:30 AM to 7:59 AM | 970 (21.7%) | 1,083 (28.3%) |
| 8:00 AM to 8:29 AM | 834 (18.6%) | 571 (14.9%) |
| 8:30 AM to 8:59 AM | 181 (4.1%) | 567 (14.8%) |
| 9:00 AM to 9:59 AM | 411 (9.2%) | 150 (3.9%) |
| 10:00 AM to 10:59 AM | 58 (1.3%) | 128 (3.4%) |
| 11:00 AM to 11:59 AM | 54 (1.2%) | 42 (1.1%) |
| 12:00 PM to 3:59 PM | 95 (2.1%) | 247 (6.5%) |
| 4:00 PM to 11:59 PM | 151 (3.4%) | 81 (2.1%) |
| Total | 4,472 (100.0%) | 3,825 (100.0%) |
Housing Occupancy in Dukes County
Occupancy by Ownership in Dukes County
Of the total 6,899 dwellings in Dukes County, owner-occupied units account for 5,285 (76.6%), while renter-occupied units make up 1,614 (23.4%).
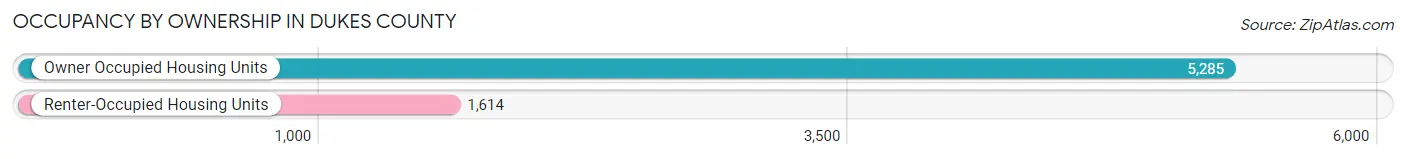
| Occupancy | # Housing Units | % Housing Units |
| Owner Occupied Housing Units | 5,285 | 76.6% |
| Renter-Occupied Housing Units | 1,614 | 23.4% |
| Total Occupied Housing Units | 6,899 | 100.0% |
Occupancy by Household Size in Dukes County

| Household Size | # Housing Units | % Housing Units |
| 1-Person Household | 2,285 | 33.1% |
| 2-Person Household | 2,616 | 37.9% |
| 3-Person Household | 867 | 12.6% |
| 4+ Person Household | 1,131 | 16.4% |
| Total Housing Units | 6,899 | 100.0% |
Occupancy by Ownership by Household Size in Dukes County

| Household Size | Owner-occupied | Renter-occupied |
| 1-Person Household | 1,440 (63.0%) | 845 (37.0%) |
| 2-Person Household | 2,199 (84.1%) | 417 (15.9%) |
| 3-Person Household | 780 (90.0%) | 87 (10.0%) |
| 4+ Person Household | 866 (76.6%) | 265 (23.4%) |
| Total Housing Units | 5,285 (76.6%) | 1,614 (23.4%) |
Occupancy by Educational Attainment in Dukes County
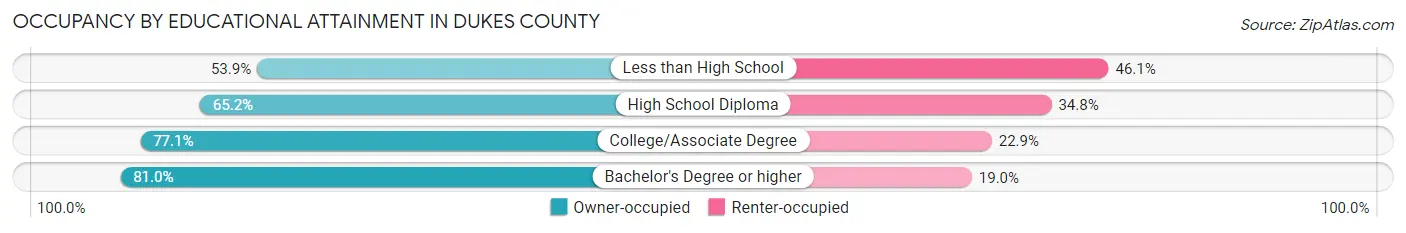
| Household Size | Owner-occupied | Renter-occupied |
| Less than High School | 144 (53.9%) | 123 (46.1%) |
| High School Diploma | 610 (65.2%) | 325 (34.8%) |
| College/Associate Degree | 1,660 (77.1%) | 494 (22.9%) |
| Bachelor's Degree or higher | 2,871 (81.0%) | 672 (19.0%) |
Occupancy by Age of Householder in Dukes County
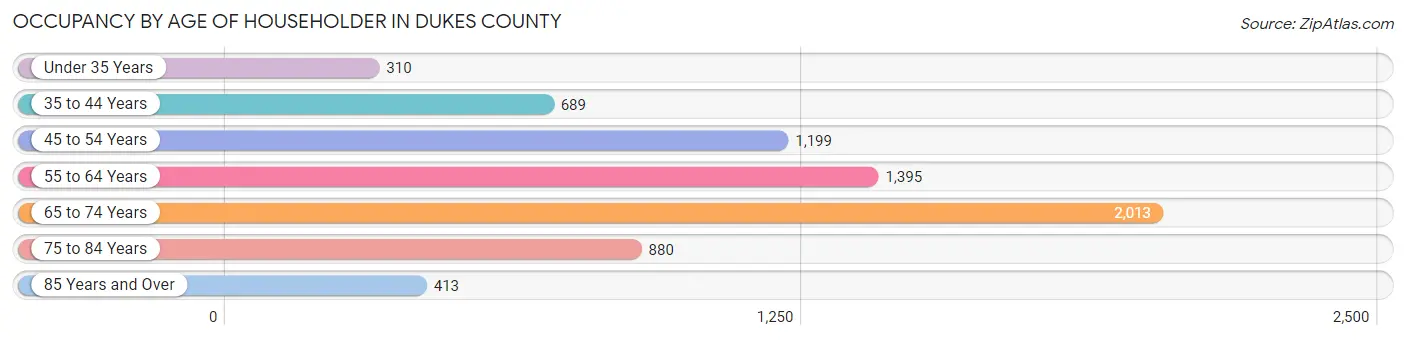
| Age Bracket | # Households | % Households |
| Under 35 Years | 310 | 4.5% |
| 35 to 44 Years | 689 | 10.0% |
| 45 to 54 Years | 1,199 | 17.4% |
| 55 to 64 Years | 1,395 | 20.2% |
| 65 to 74 Years | 2,013 | 29.2% |
| 75 to 84 Years | 880 | 12.8% |
| 85 Years and Over | 413 | 6.0% |
| Total | 6,899 | 100.0% |
Housing Finances in Dukes County
Median Income by Occupancy in Dukes County
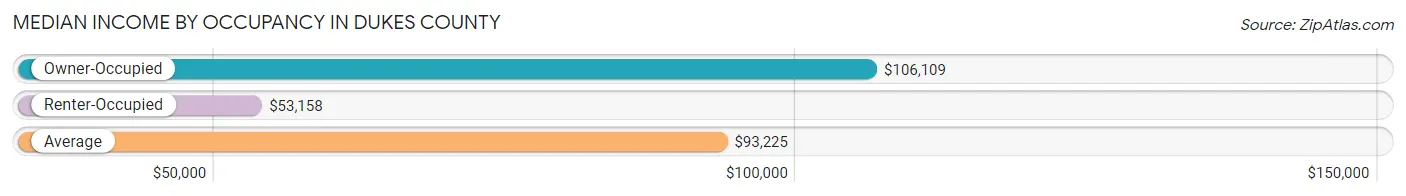
| Occupancy Type | # Households | Median Income |
| Owner-Occupied | 5,285 (76.6%) | $106,109 |
| Renter-Occupied | 1,614 (23.4%) | $53,158 |
| Average | 6,899 (100.0%) | $93,225 |
Occupancy by Householder Income Bracket in Dukes County
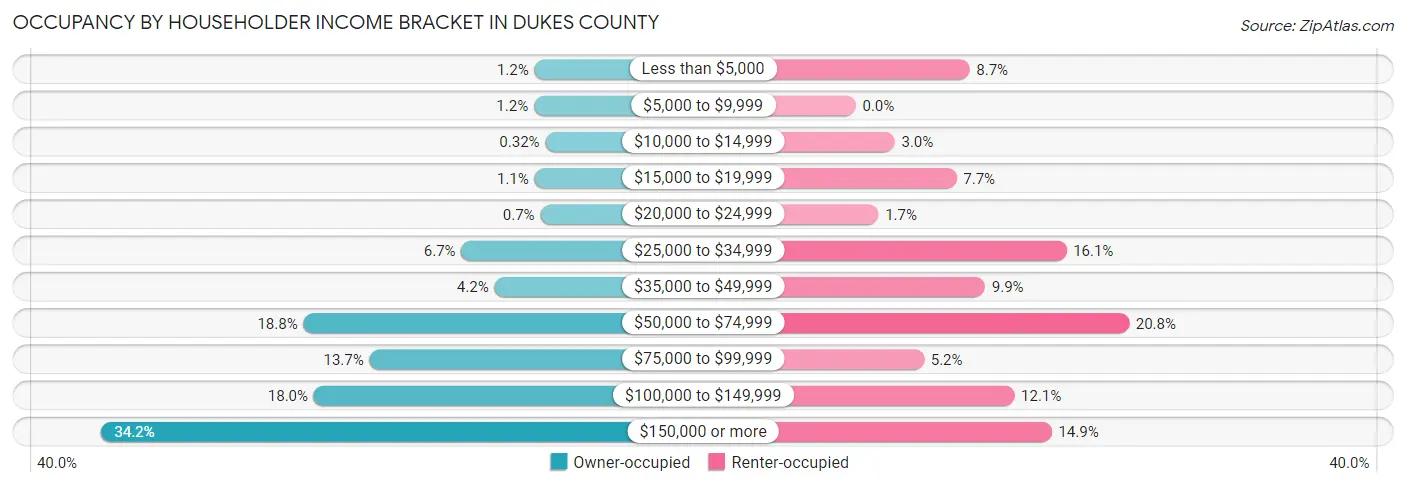
| Income Bracket | Owner-occupied | Renter-occupied |
| Less than $5,000 | 61 (1.1%) | 140 (8.7%) |
| $5,000 to $9,999 | 63 (1.2%) | 0 (0.0%) |
| $10,000 to $14,999 | 17 (0.3%) | 48 (3.0%) |
| $15,000 to $19,999 | 60 (1.1%) | 124 (7.7%) |
| $20,000 to $24,999 | 37 (0.7%) | 28 (1.7%) |
| $25,000 to $34,999 | 355 (6.7%) | 259 (16.1%) |
| $35,000 to $49,999 | 222 (4.2%) | 159 (9.9%) |
| $50,000 to $74,999 | 991 (18.8%) | 336 (20.8%) |
| $75,000 to $99,999 | 725 (13.7%) | 84 (5.2%) |
| $100,000 to $149,999 | 949 (18.0%) | 195 (12.1%) |
| $150,000 or more | 1,805 (34.2%) | 241 (14.9%) |
| Total | 5,285 (100.0%) | 1,614 (100.0%) |
Monthly Housing Cost Tiers in Dukes County
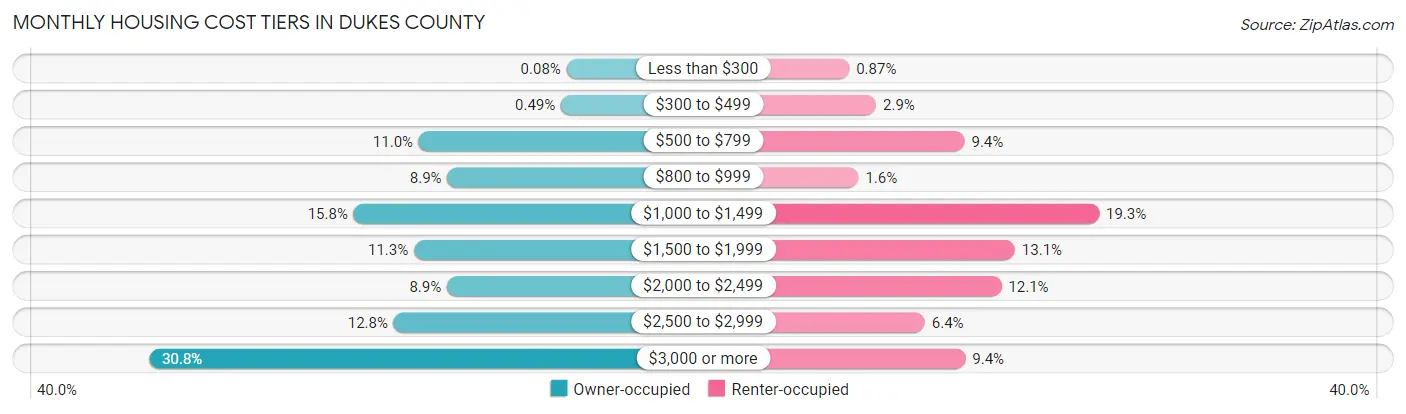
| Monthly Cost | Owner-occupied | Renter-occupied |
| Less than $300 | 4 (0.1%) | 14 (0.9%) |
| $300 to $499 | 26 (0.5%) | 46 (2.9%) |
| $500 to $799 | 579 (11.0%) | 151 (9.4%) |
| $800 to $999 | 468 (8.9%) | 25 (1.5%) |
| $1,000 to $1,499 | 833 (15.8%) | 311 (19.3%) |
| $1,500 to $1,999 | 598 (11.3%) | 211 (13.1%) |
| $2,000 to $2,499 | 470 (8.9%) | 195 (12.1%) |
| $2,500 to $2,999 | 677 (12.8%) | 104 (6.4%) |
| $3,000 or more | 1,630 (30.8%) | 152 (9.4%) |
| Total | 5,285 (100.0%) | 1,614 (100.0%) |
Physical Housing Characteristics in Dukes County
Housing Structures in Dukes County
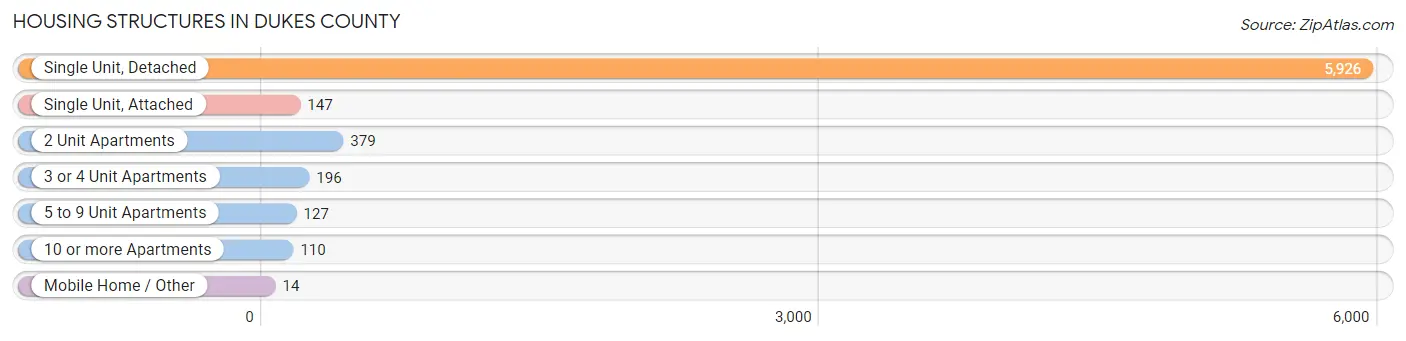
| Structure Type | # Housing Units | % Housing Units |
| Single Unit, Detached | 5,926 | 85.9% |
| Single Unit, Attached | 147 | 2.1% |
| 2 Unit Apartments | 379 | 5.5% |
| 3 or 4 Unit Apartments | 196 | 2.8% |
| 5 to 9 Unit Apartments | 127 | 1.8% |
| 10 or more Apartments | 110 | 1.6% |
| Mobile Home / Other | 14 | 0.2% |
| Total | 6,899 | 100.0% |
Housing Structures by Occupancy in Dukes County
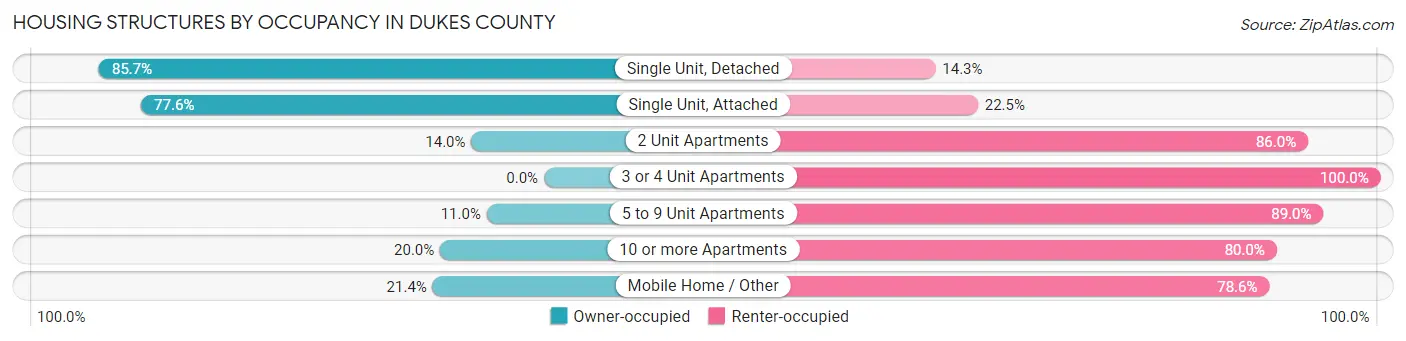
| Structure Type | Owner-occupied | Renter-occupied |
| Single Unit, Detached | 5,079 (85.7%) | 847 (14.3%) |
| Single Unit, Attached | 114 (77.5%) | 33 (22.5%) |
| 2 Unit Apartments | 53 (14.0%) | 326 (86.0%) |
| 3 or 4 Unit Apartments | 0 (0.0%) | 196 (100.0%) |
| 5 to 9 Unit Apartments | 14 (11.0%) | 113 (89.0%) |
| 10 or more Apartments | 22 (20.0%) | 88 (80.0%) |
| Mobile Home / Other | 3 (21.4%) | 11 (78.6%) |
| Total | 5,285 (76.6%) | 1,614 (23.4%) |
Housing Structures by Number of Rooms in Dukes County
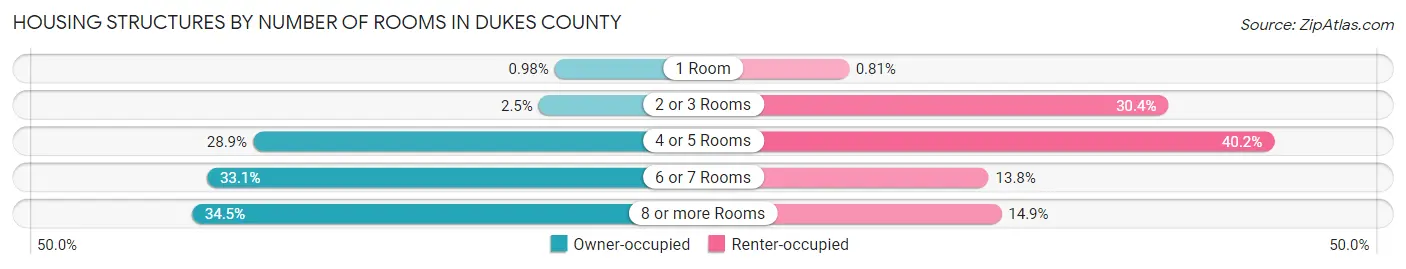
| Number of Rooms | Owner-occupied | Renter-occupied |
| 1 Room | 52 (1.0%) | 13 (0.8%) |
| 2 or 3 Rooms | 130 (2.5%) | 490 (30.4%) |
| 4 or 5 Rooms | 1,527 (28.9%) | 648 (40.2%) |
| 6 or 7 Rooms | 1,751 (33.1%) | 222 (13.8%) |
| 8 or more Rooms | 1,825 (34.5%) | 241 (14.9%) |
| Total | 5,285 (100.0%) | 1,614 (100.0%) |
Housing Structure by Heating Type in Dukes County
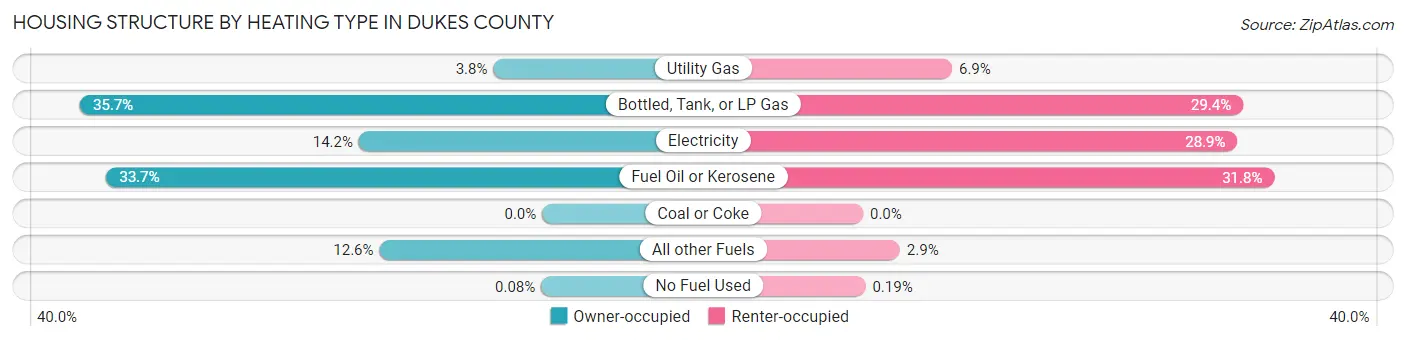
| Heating Type | Owner-occupied | Renter-occupied |
| Utility Gas | 199 (3.8%) | 111 (6.9%) |
| Bottled, Tank, or LP Gas | 1,888 (35.7%) | 474 (29.4%) |
| Electricity | 749 (14.2%) | 467 (28.9%) |
| Fuel Oil or Kerosene | 1,780 (33.7%) | 513 (31.8%) |
| Coal or Coke | 0 (0.0%) | 0 (0.0%) |
| All other Fuels | 665 (12.6%) | 46 (2.9%) |
| No Fuel Used | 4 (0.1%) | 3 (0.2%) |
| Total | 5,285 (100.0%) | 1,614 (100.0%) |
Household Vehicle Usage in Dukes County
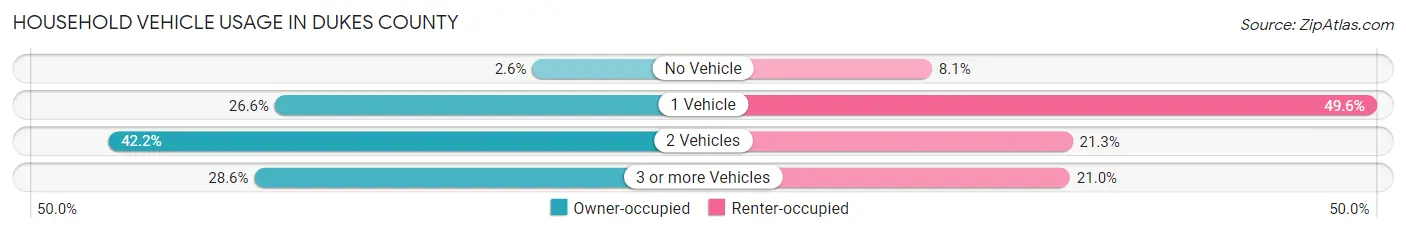
| Vehicles per Household | Owner-occupied | Renter-occupied |
| No Vehicle | 138 (2.6%) | 131 (8.1%) |
| 1 Vehicle | 1,408 (26.6%) | 801 (49.6%) |
| 2 Vehicles | 2,230 (42.2%) | 343 (21.2%) |
| 3 or more Vehicles | 1,509 (28.5%) | 339 (21.0%) |
| Total | 5,285 (100.0%) | 1,614 (100.0%) |
Real Estate & Mortgages in Dukes County
Real Estate and Mortgage Overview in Dukes County
| Characteristic | Without Mortgage | With Mortgage |
| Housing Units | 2,571 | 2,714 |
| Median Property Value | $1,041,500 | $965,900 |
| Median Household Income | $89,523 | $931 |
| Monthly Housing Costs | $1,208 | $1,517 |
| Real Estate Taxes | $5,660 | $0 |
Property Value by Mortgage Status in Dukes County
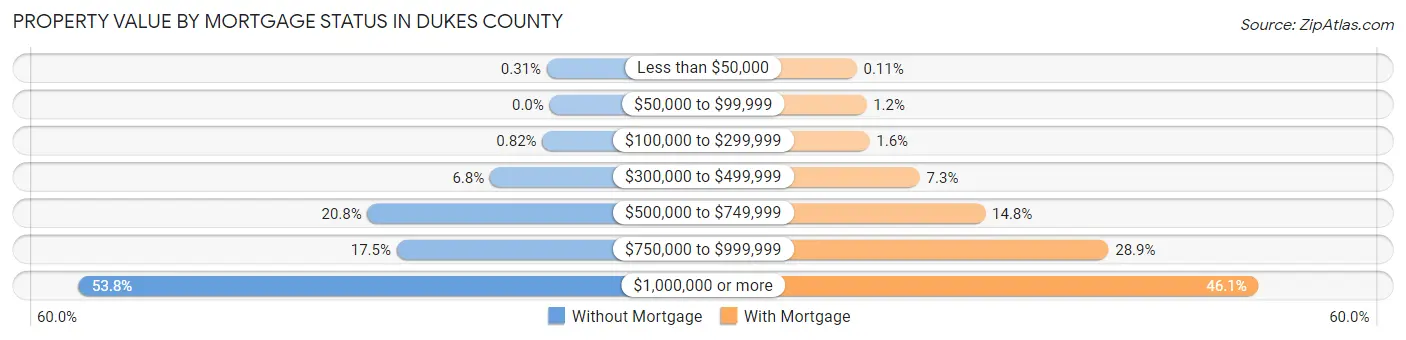
| Property Value | Without Mortgage | With Mortgage |
| Less than $50,000 | 8 (0.3%) | 3 (0.1%) |
| $50,000 to $99,999 | 0 (0.0%) | 33 (1.2%) |
| $100,000 to $299,999 | 21 (0.8%) | 43 (1.6%) |
| $300,000 to $499,999 | 175 (6.8%) | 199 (7.3%) |
| $500,000 to $749,999 | 535 (20.8%) | 402 (14.8%) |
| $750,000 to $999,999 | 449 (17.5%) | 784 (28.9%) |
| $1,000,000 or more | 1,383 (53.8%) | 1,250 (46.1%) |
| Total | 2,571 (100.0%) | 2,714 (100.0%) |
Household Income by Mortgage Status in Dukes County
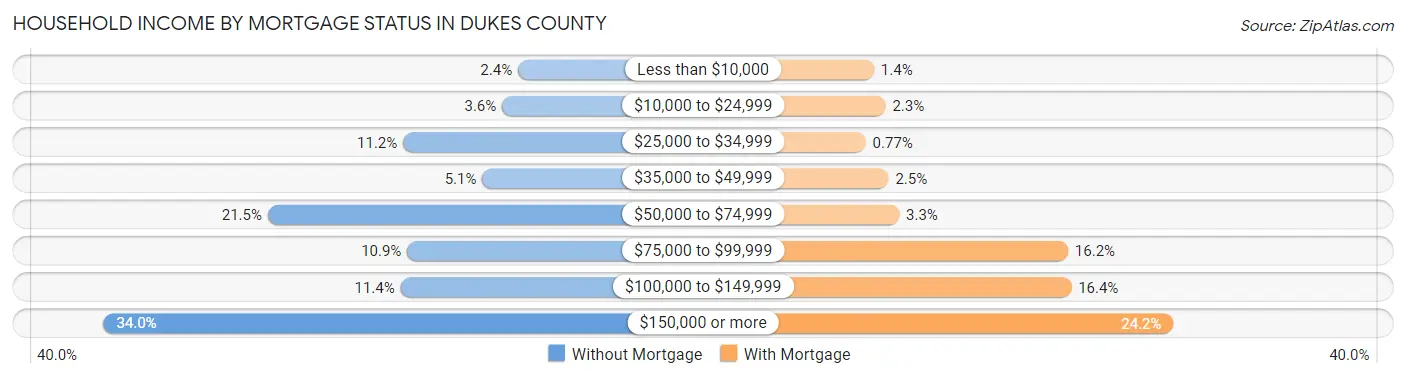
| Household Income | Without Mortgage | With Mortgage |
| Less than $10,000 | 62 (2.4%) | 38 (1.4%) |
| $10,000 to $24,999 | 93 (3.6%) | 62 (2.3%) |
| $25,000 to $34,999 | 287 (11.2%) | 21 (0.8%) |
| $35,000 to $49,999 | 132 (5.1%) | 68 (2.5%) |
| $50,000 to $74,999 | 552 (21.5%) | 90 (3.3%) |
| $75,000 to $99,999 | 279 (10.8%) | 439 (16.2%) |
| $100,000 to $149,999 | 292 (11.4%) | 446 (16.4%) |
| $150,000 or more | 874 (34.0%) | 657 (24.2%) |
| Total | 2,571 (100.0%) | 2,714 (100.0%) |
Property Value to Household Income Ratio in Dukes County
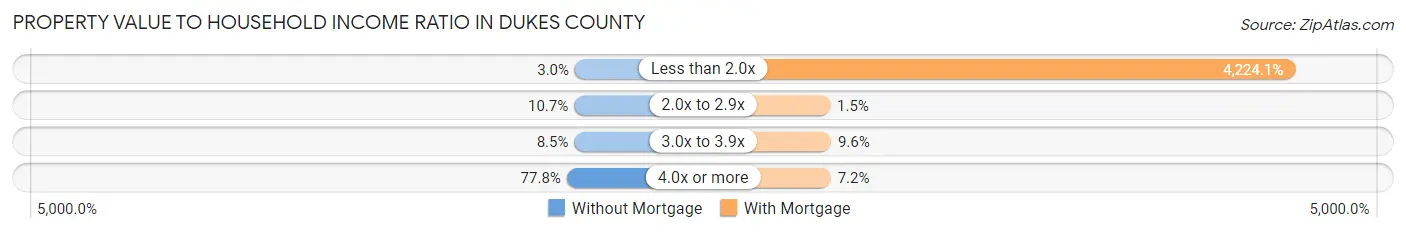
| Value-to-Income Ratio | Without Mortgage | With Mortgage |
| Less than 2.0x | 78 (3.0%) | 114,643 (4,224.1%) |
| 2.0x to 2.9x | 274 (10.7%) | 41 (1.5%) |
| 3.0x to 3.9x | 218 (8.5%) | 261 (9.6%) |
| 4.0x or more | 2,001 (77.8%) | 194 (7.1%) |
| Total | 2,571 (100.0%) | 2,714 (100.0%) |
Real Estate Taxes by Mortgage Status in Dukes County
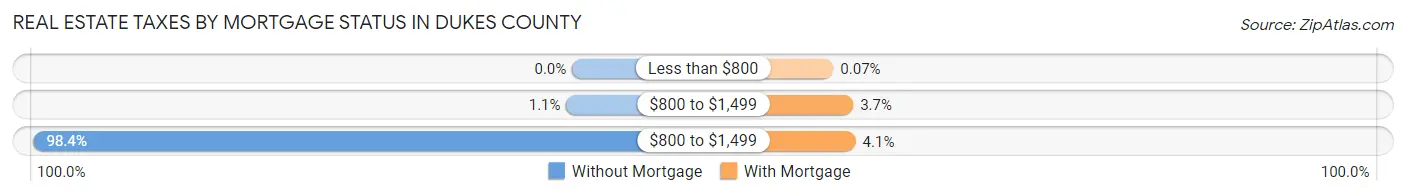
| Property Taxes | Without Mortgage | With Mortgage |
| Less than $800 | 0 (0.0%) | 2 (0.1%) |
| $800 to $1,499 | 27 (1.1%) | 100 (3.7%) |
| $800 to $1,499 | 2,529 (98.4%) | 112 (4.1%) |
| Total | 2,571 (100.0%) | 2,714 (100.0%) |
Health & Disability in Dukes County
Health Insurance Coverage by Age in Dukes County
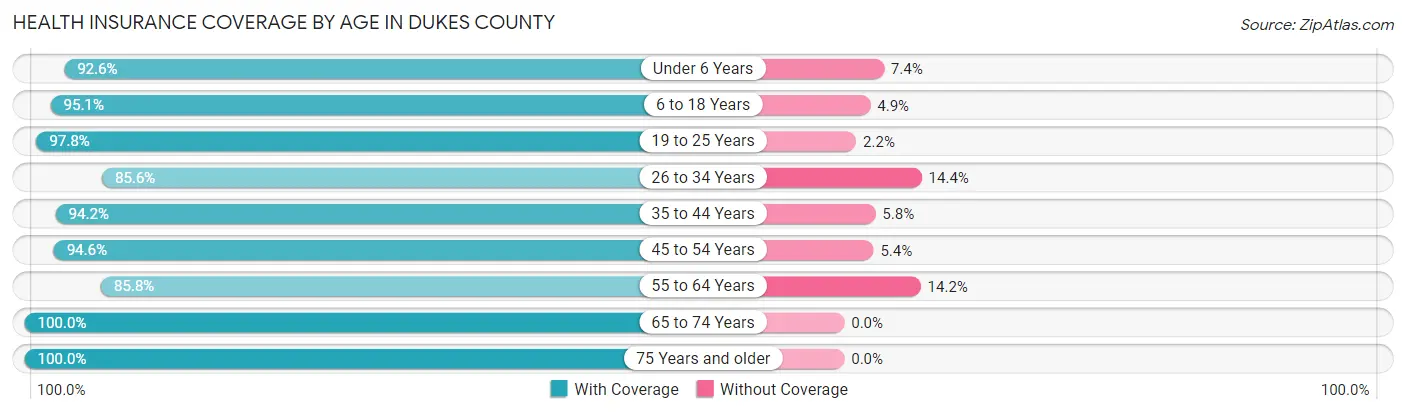
| Age Bracket | With Coverage | Without Coverage |
| Under 6 Years | 802 (92.6%) | 64 (7.4%) |
| 6 to 18 Years | 2,957 (95.1%) | 151 (4.9%) |
| 19 to 25 Years | 887 (97.8%) | 20 (2.2%) |
| 26 to 34 Years | 2,004 (85.6%) | 338 (14.4%) |
| 35 to 44 Years | 2,064 (94.2%) | 127 (5.8%) |
| 45 to 54 Years | 2,331 (94.6%) | 134 (5.4%) |
| 55 to 64 Years | 2,944 (85.8%) | 489 (14.2%) |
| 65 to 74 Years | 3,135 (100.0%) | 0 (0.0%) |
| 75 Years and older | 1,999 (100.0%) | 0 (0.0%) |
| Total | 19,123 (93.5%) | 1,323 (6.5%) |
Health Insurance Coverage by Citizenship Status in Dukes County
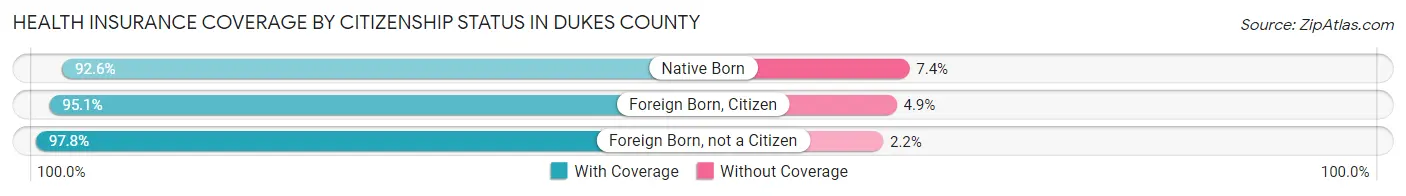
| Citizenship Status | With Coverage | Without Coverage |
| Native Born | 802 (92.6%) | 64 (7.4%) |
| Foreign Born, Citizen | 2,957 (95.1%) | 151 (4.9%) |
| Foreign Born, not a Citizen | 887 (97.8%) | 20 (2.2%) |
Health Insurance Coverage by Household Income in Dukes County
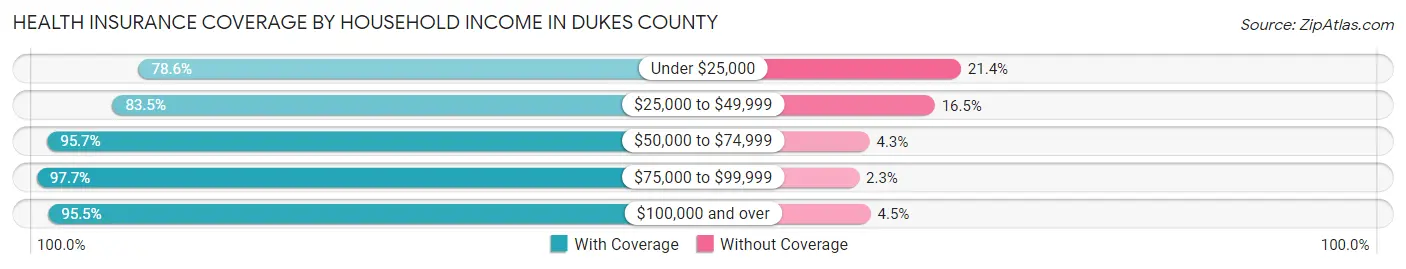
| Household Income | With Coverage | Without Coverage |
| Under $25,000 | 846 (78.6%) | 230 (21.4%) |
| $25,000 to $49,999 | 1,867 (83.5%) | 368 (16.5%) |
| $50,000 to $74,999 | 2,874 (95.7%) | 128 (4.3%) |
| $75,000 to $99,999 | 2,245 (97.7%) | 53 (2.3%) |
| $100,000 and over | 11,151 (95.5%) | 521 (4.5%) |
Public vs Private Health Insurance Coverage by Age in Dukes County
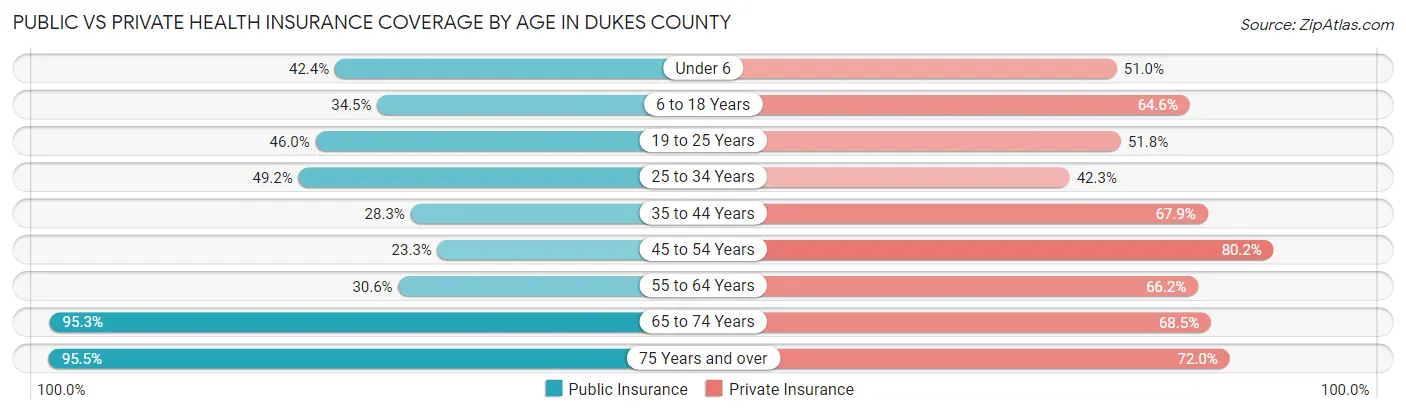
| Age Bracket | Public Insurance | Private Insurance |
| Under 6 | 367 (42.4%) | 442 (51.0%) |
| 6 to 18 Years | 1,073 (34.5%) | 2,007 (64.6%) |
| 19 to 25 Years | 417 (46.0%) | 470 (51.8%) |
| 25 to 34 Years | 1,151 (49.1%) | 991 (42.3%) |
| 35 to 44 Years | 621 (28.3%) | 1,488 (67.9%) |
| 45 to 54 Years | 575 (23.3%) | 1,976 (80.2%) |
| 55 to 64 Years | 1,051 (30.6%) | 2,271 (66.1%) |
| 65 to 74 Years | 2,989 (95.3%) | 2,148 (68.5%) |
| 75 Years and over | 1,909 (95.5%) | 1,439 (72.0%) |
| Total | 10,153 (49.7%) | 13,232 (64.7%) |
Disability Status by Sex by Age in Dukes County
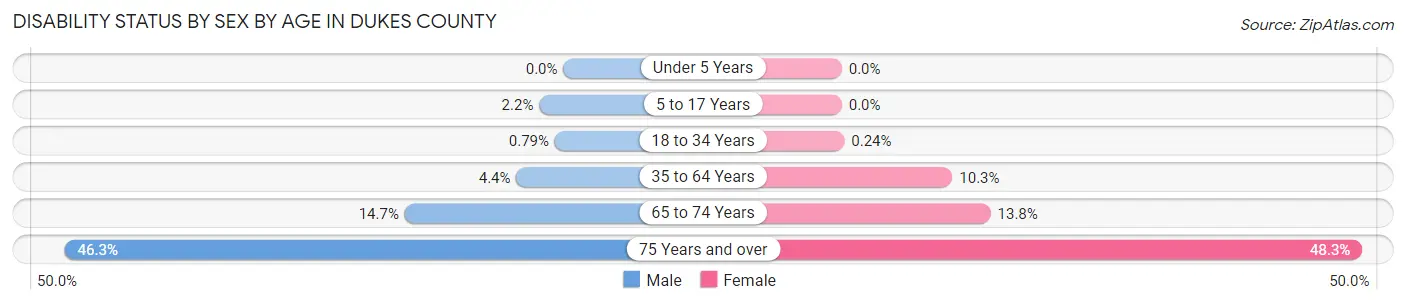
| Age Bracket | Male | Female |
| Under 5 Years | 0 (0.0%) | 0 (0.0%) |
| 5 to 17 Years | 32 (2.2%) | 0 (0.0%) |
| 18 to 34 Years | 15 (0.8%) | 4 (0.2%) |
| 35 to 64 Years | 175 (4.4%) | 418 (10.3%) |
| 65 to 74 Years | 212 (14.7%) | 234 (13.8%) |
| 75 Years and over | 398 (46.3%) | 550 (48.3%) |
Disability Class by Sex by Age in Dukes County
Disability Class: Hearing Difficulty
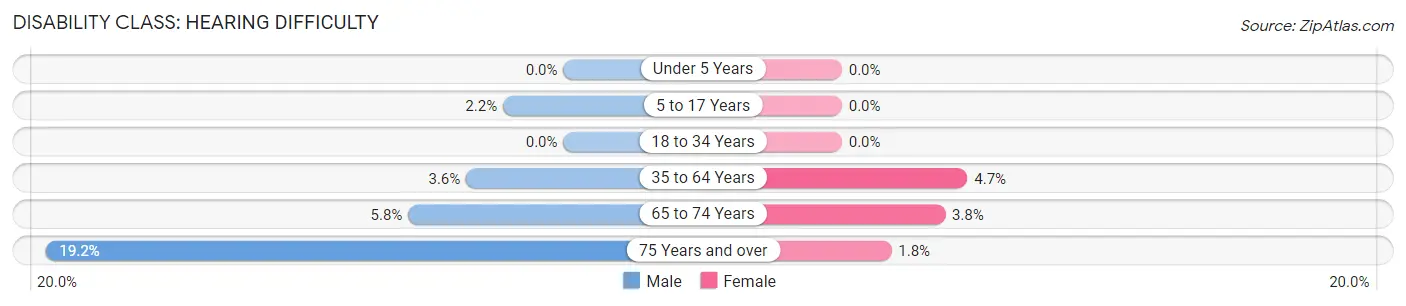
| Age Bracket | Male | Female |
| Under 5 Years | 0 (0.0%) | 0 (0.0%) |
| 5 to 17 Years | 32 (2.2%) | 0 (0.0%) |
| 18 to 34 Years | 0 (0.0%) | 0 (0.0%) |
| 35 to 64 Years | 145 (3.6%) | 190 (4.7%) |
| 65 to 74 Years | 83 (5.8%) | 65 (3.8%) |
| 75 Years and over | 165 (19.2%) | 21 (1.8%) |
Disability Class: Vision Difficulty
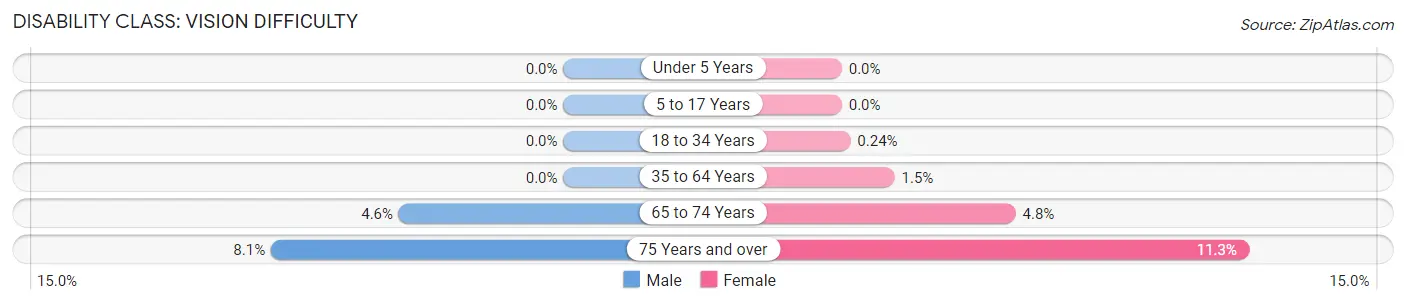
| Age Bracket | Male | Female |
| Under 5 Years | 0 (0.0%) | 0 (0.0%) |
| 5 to 17 Years | 0 (0.0%) | 0 (0.0%) |
| 18 to 34 Years | 0 (0.0%) | 4 (0.2%) |
| 35 to 64 Years | 0 (0.0%) | 60 (1.5%) |
| 65 to 74 Years | 66 (4.6%) | 82 (4.8%) |
| 75 Years and over | 70 (8.1%) | 129 (11.3%) |
Disability Class: Cognitive Difficulty
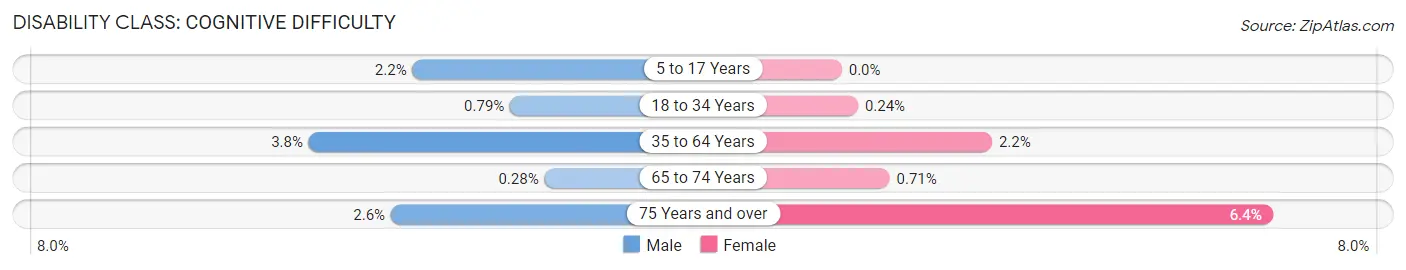
| Age Bracket | Male | Female |
| 5 to 17 Years | 32 (2.2%) | 0 (0.0%) |
| 18 to 34 Years | 15 (0.8%) | 4 (0.2%) |
| 35 to 64 Years | 152 (3.8%) | 91 (2.2%) |
| 65 to 74 Years | 4 (0.3%) | 12 (0.7%) |
| 75 Years and over | 22 (2.6%) | 73 (6.4%) |
Disability Class: Ambulatory Difficulty
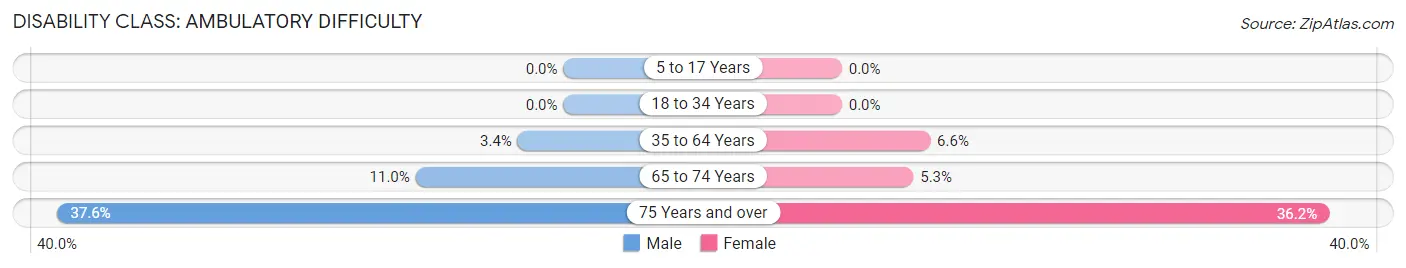
| Age Bracket | Male | Female |
| 5 to 17 Years | 0 (0.0%) | 0 (0.0%) |
| 18 to 34 Years | 0 (0.0%) | 0 (0.0%) |
| 35 to 64 Years | 136 (3.4%) | 267 (6.6%) |
| 65 to 74 Years | 158 (11.0%) | 90 (5.3%) |
| 75 Years and over | 323 (37.6%) | 412 (36.2%) |
Disability Class: Self-Care Difficulty
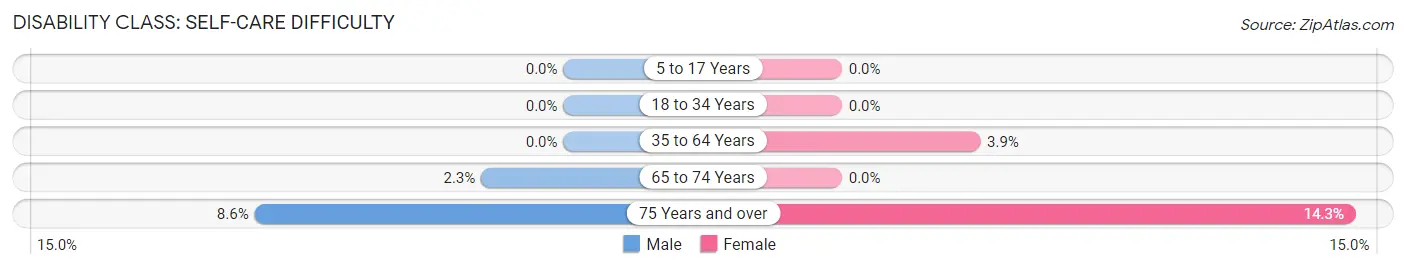
| Age Bracket | Male | Female |
| 5 to 17 Years | 0 (0.0%) | 0 (0.0%) |
| 18 to 34 Years | 0 (0.0%) | 0 (0.0%) |
| 35 to 64 Years | 0 (0.0%) | 157 (3.8%) |
| 65 to 74 Years | 33 (2.3%) | 0 (0.0%) |
| 75 Years and over | 74 (8.6%) | 163 (14.3%) |
Technology Access in Dukes County
Computing Device Access in Dukes County
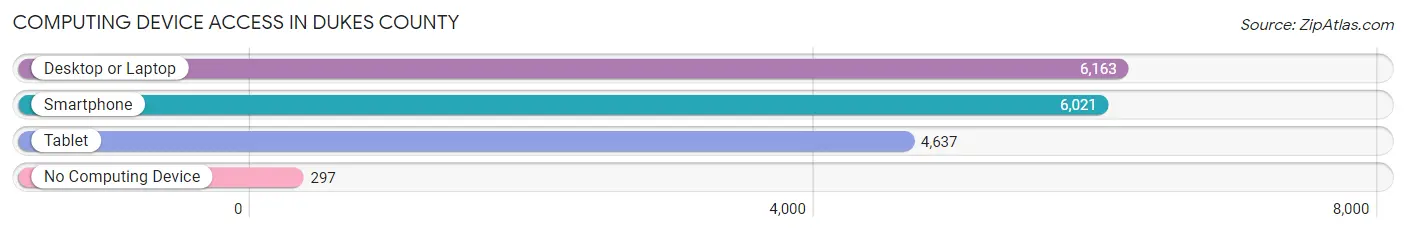
| Device Type | # Households | % Households |
| Desktop or Laptop | 6,163 | 89.3% |
| Smartphone | 6,021 | 87.3% |
| Tablet | 4,637 | 67.2% |
| No Computing Device | 297 | 4.3% |
| Total | 6,899 | 100.0% |
Internet Access in Dukes County
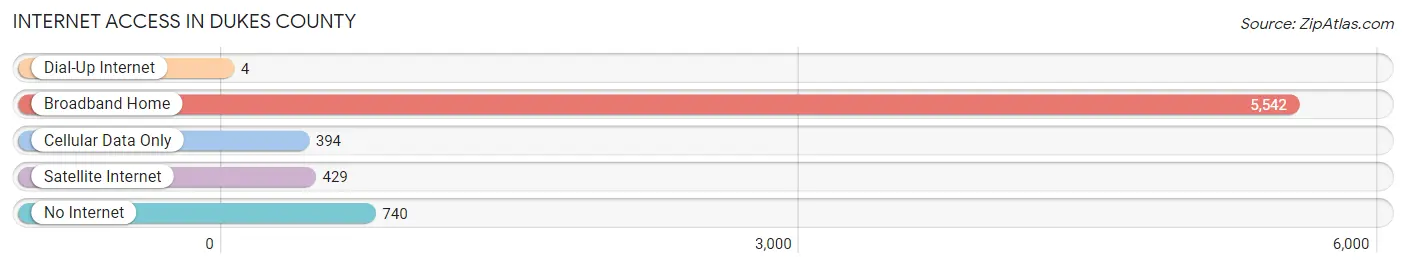
| Internet Type | # Households | % Households |
| Dial-Up Internet | 4 | 0.1% |
| Broadband Home | 5,542 | 80.3% |
| Cellular Data Only | 394 | 5.7% |
| Satellite Internet | 429 | 6.2% |
| No Internet | 740 | 10.7% |
| Total | 6,899 | 100.0% |
Dukes County Summary
Dukes County is a county located in the U.S. state of Massachusetts. It is composed of the islands of Martha's Vineyard and Nantucket, and several smaller islands. As of the 2010 census, the population was 16,535. The county seat is Edgartown.
History
Dukes County was created in 1695, when the Massachusetts Bay Colony annexed Martha's Vineyard and Nantucket. The county was named for James II of England, who was also Duke of York. The county was originally part of Suffolk County, but was transferred to Nantucket County in 1803. In 1812, Nantucket County was abolished, and Dukes County was re-established.
Geography
Dukes County is located in southeastern Massachusetts, and is composed of the islands of Martha's Vineyard and Nantucket, and several smaller islands. The county has a total area of 497 square miles, of which 441 square miles is land and 56 square miles is water.
Economy
The economy of Dukes County is largely based on tourism. The county is home to several popular vacation destinations, including Martha's Vineyard and Nantucket. The county also has a thriving fishing industry, and is home to several wineries and breweries.
Demographics
As of the 2010 census, there were 16,535 people, 7,845 households, and 4,845 families residing in the county. The population density was 37.3 people per square mile. The racial makeup of the county was 92.3% White, 2.2% African American, 0.3% Native American, 1.2% Asian, 0.1% Pacific Islander, 1.2% from other races, and 2.7% from two or more races. Hispanic or Latino of any race were 3.3% of the population.
The median income for a household in the county was $60,872, and the median income for a family was $76,945. The per capita income for the county was $37,845. About 5.2% of families and 8.2% of the population were below the poverty line, including 10.2% of those under age 18 and 5.2% of those age 65 or over.
Common Questions
What is the Total Population of Dukes County?
Total Population of Dukes County is 20,543.
What is the Total Male Population of Dukes County?
Total Male Population of Dukes County is 10,091.
What is the Total Female Population of Dukes County?
Total Female Population of Dukes County is 10,452.
What is the Ratio of Males per 100 Females in Dukes County?
There are 96.55 Males per 100 Females in Dukes County.
What is the Ratio of Females per 100 Males in Dukes County?
There are 103.58 Females per 100 Males in Dukes County.
What is the Median Population Age in Dukes County?
Median Population Age in Dukes County is 49.2 Years.
What is the Average Family Size in Dukes County
Average Family Size in Dukes County is 3.7 People.
What is the Average Household Size in Dukes County
Average Household Size in Dukes County is 2.9 People.
What is Per Capita Income in Dukes County?
Per Capita income in Dukes County is $60,845.
What is the Median Family Income in Dukes County?
Median Family Income in Dukes County is $121,417.
What is the Median Household income in Dukes County?
Median Household Income in Dukes County is $93,225.
What is Income or Wage Gap in Dukes County?
Income or Wage Gap in Dukes County is 27.3%.
Women in Dukes County earn 72.7 cents for every dollar earned by a man.
What is Inequality or Gini Index in Dukes County?
Inequality or Gini Index in Dukes County is 0.54.
How Large is the Labor Force in Dukes County?
There are 11,279 People in the Labor Forcein in Dukes County.
What is the Percentage of People in the Labor Force in Dukes County?
64.9% of People are in the Labor Force in Dukes County.
What is the Unemployment Rate in Dukes County?
Unemployment Rate in Dukes County is 7.0%.