Bristol County, MA
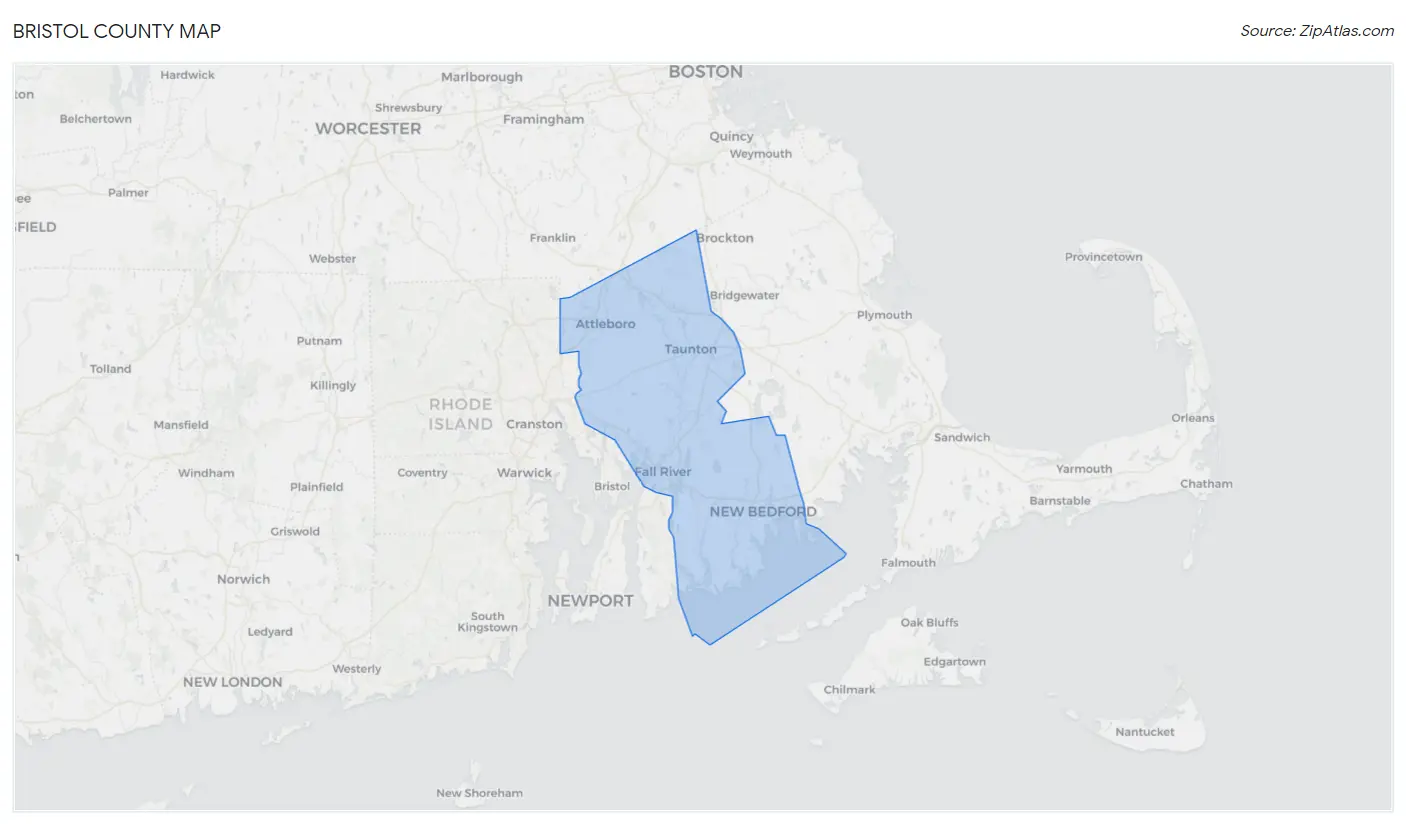
Bristol County Map
Bristol County Overview
576,699
TOTAL POPULATION
281,769
MALE POPULATION
294,930
FEMALE POPULATION
95.54
MALES / 100 FEMALES
104.67
FEMALES / 100 MALES
41.0
MEDIAN AGE
3.0
AVG FAMILY SIZE
2.5
AVG HOUSEHOLD SIZE
$42,006
PER CAPITA INCOME
$103,265
AVG FAMILY INCOME
$80,628
AVG HOUSEHOLD INCOME
29.7%
WAGE / INCOME GAP [ % ]
70.3¢/ $1
WAGE / INCOME GAP [ $ ]
$10,739
FAMILY INCOME DEFICIT
0.46
INEQUALITY / GINI INDEX
308,753
LABOR FORCE [ PEOPLE ]
65.3%
PERCENT IN LABOR FORCE
5.7%
UNEMPLOYMENT RATE
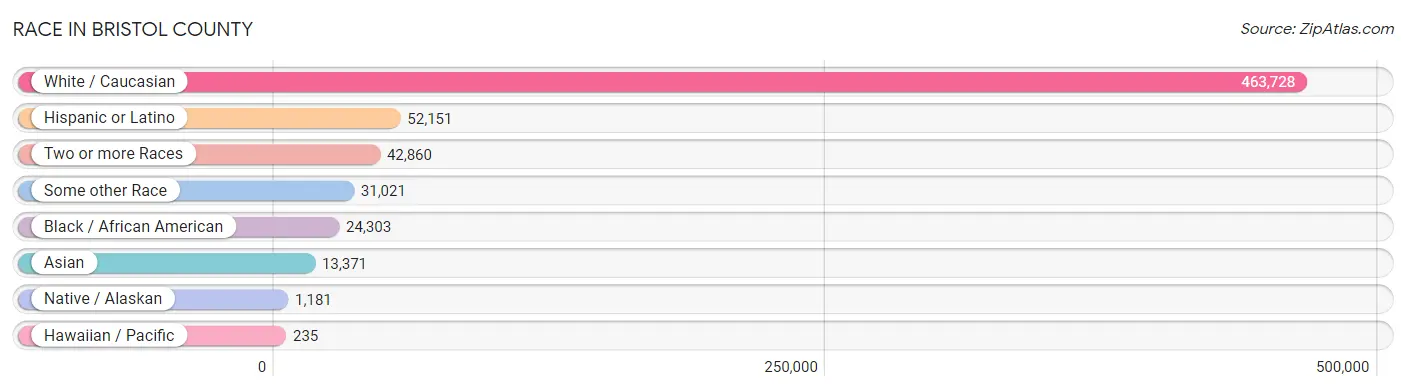
Race in Bristol County
The most populous races in Bristol County are White / Caucasian (463,728 | 80.4%), Hispanic or Latino (52,151 | 9.0%), and Two or more Races (42,860 | 7.4%).
| Race | # Population | % Population |
| Asian | 13,371 | 2.3% |
| Black / African American | 24,303 | 4.2% |
| Hawaiian / Pacific | 235 | 0.0% |
| Hispanic or Latino | 52,151 | 9.0% |
| Native / Alaskan | 1,181 | 0.2% |
| White / Caucasian | 463,728 | 80.4% |
| Two or more Races | 42,860 | 7.4% |
| Some other Race | 31,021 | 5.4% |
| Total | 576,699 | 100.0% |
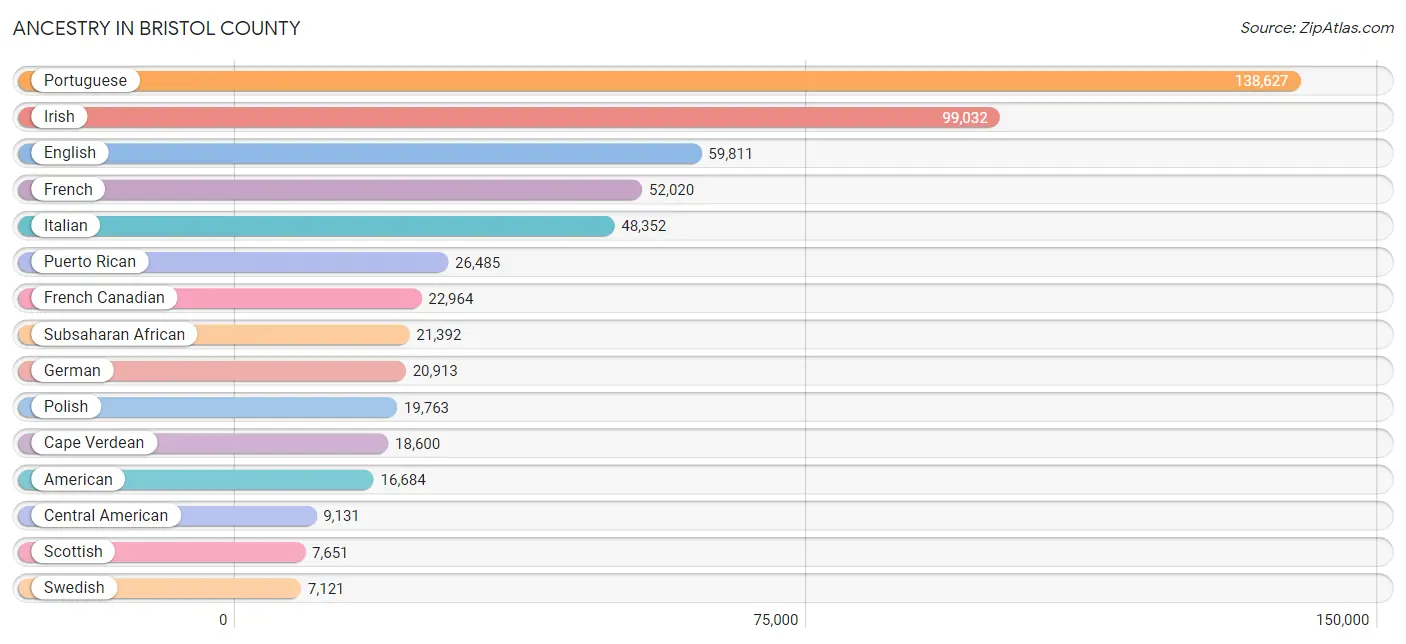
Ancestry in Bristol County
The most populous ancestries reported in Bristol County are Portuguese (138,627 | 24.0%), Irish (99,032 | 17.2%), English (59,811 | 10.4%), French (52,020 | 9.0%), and Italian (48,352 | 8.4%), together accounting for 69.0% of all Bristol County residents.
| Ancestry | # Population | % Population |
| African | 1,421 | 0.3% |
| Albanian | 706 | 0.1% |
| American | 16,684 | 2.9% |
| Apache | 40 | 0.0% |
| Arab | 5,212 | 0.9% |
| Argentinean | 159 | 0.0% |
| Armenian | 1,156 | 0.2% |
| Australian | 9 | 0.0% |
| Austrian | 510 | 0.1% |
| Bahamian | 108 | 0.0% |
| Bangladeshi | 25 | 0.0% |
| Barbadian | 332 | 0.1% |
| Basque | 72 | 0.0% |
| Belgian | 428 | 0.1% |
| Belizean | 11 | 0.0% |
| Bhutanese | 805 | 0.1% |
| Blackfeet | 555 | 0.1% |
| Bolivian | 30 | 0.0% |
| Brazilian | 5,408 | 0.9% |
| British | 1,166 | 0.2% |
| British West Indian | 92 | 0.0% |
| Bulgarian | 224 | 0.0% |
| Burmese | 452 | 0.1% |
| Cajun | 43 | 0.0% |
| Cambodian | 282 | 0.1% |
| Canadian | 1,993 | 0.4% |
| Cape Verdean | 18,600 | 3.2% |
| Celtic | 5 | 0.0% |
| Central American | 9,131 | 1.6% |
| Central American Indian | 919 | 0.2% |
| Cherokee | 307 | 0.1% |
| Chilean | 126 | 0.0% |
| Chippewa | 55 | 0.0% |
| Choctaw | 69 | 0.0% |
| Colombian | 1,494 | 0.3% |
| Comanche | 7 | 0.0% |
| Costa Rican | 301 | 0.1% |
| Cree | 26 | 0.0% |
| Creek | 69 | 0.0% |
| Croatian | 63 | 0.0% |
| Cuban | 579 | 0.1% |
| Cypriot | 8 | 0.0% |
| Czech | 529 | 0.1% |
| Czechoslovakian | 164 | 0.0% |
| Danish | 488 | 0.1% |
| Dominican | 5,053 | 0.9% |
| Dutch | 1,486 | 0.3% |
| Dutch West Indian | 6 | 0.0% |
| Eastern European | 1,047 | 0.2% |
| Ecuadorian | 1,079 | 0.2% |
| Egyptian | 772 | 0.1% |
| English | 59,811 | 10.4% |
| Estonian | 60 | 0.0% |
| Ethiopian | 11 | 0.0% |
| European | 3,246 | 0.6% |
| Filipino | 116 | 0.0% |
| Finnish | 939 | 0.2% |
| French | 52,020 | 9.0% |
| French American Indian | 95 | 0.0% |
| French Canadian | 22,964 | 4.0% |
| German | 20,913 | 3.6% |
| Ghanaian | 97 | 0.0% |
| Greek | 2,999 | 0.5% |
| Guamanian / Chamorro | 224 | 0.0% |
| Guatemalan | 4,101 | 0.7% |
| Guyanese | 92 | 0.0% |
| Haitian | 4,213 | 0.7% |
| Honduran | 2,058 | 0.4% |
| Hungarian | 680 | 0.1% |
| Icelander | 77 | 0.0% |
| Indian (Asian) | 3,868 | 0.7% |
| Indonesian | 116 | 0.0% |
| Iranian | 297 | 0.1% |
| Iraqi | 44 | 0.0% |
| Irish | 99,032 | 17.2% |
| Iroquois | 35 | 0.0% |
| Israeli | 260 | 0.1% |
| Italian | 48,352 | 8.4% |
| Jamaican | 1,373 | 0.2% |
| Japanese | 1,771 | 0.3% |
| Jordanian | 117 | 0.0% |
| Kenyan | 107 | 0.0% |
| Kiowa | 39 | 0.0% |
| Korean | 1,790 | 0.3% |
| Laotian | 63 | 0.0% |
| Latvian | 46 | 0.0% |
| Lebanese | 3,191 | 0.5% |
| Liberian | 27 | 0.0% |
| Lithuanian | 1,448 | 0.3% |
| Macedonian | 34 | 0.0% |
| Malaysian | 53 | 0.0% |
| Maltese | 13 | 0.0% |
| Menominee | 18 | 0.0% |
| Mexican | 3,035 | 0.5% |
| Mexican American Indian | 22 | 0.0% |
| Mongolian | 52 | 0.0% |
| Moroccan | 188 | 0.0% |
| Native Hawaiian | 352 | 0.1% |
| Navajo | 20 | 0.0% |
| New Zealander | 10 | 0.0% |
| Nicaraguan | 32 | 0.0% |
| Nigerian | 573 | 0.1% |
| Northern European | 325 | 0.1% |
| Norwegian | 2,267 | 0.4% |
| Okinawan | 2 | 0.0% |
| Pakistani | 375 | 0.1% |
| Palestinian | 34 | 0.0% |
| Panamanian | 144 | 0.0% |
| Paraguayan | 15 | 0.0% |
| Pennsylvania German | 11 | 0.0% |
| Peruvian | 633 | 0.1% |
| Polish | 19,763 | 3.4% |
| Portuguese | 138,627 | 24.0% |
| Potawatomi | 9 | 0.0% |
| Pueblo | 14 | 0.0% |
| Puerto Rican | 26,485 | 4.6% |
| Romanian | 252 | 0.0% |
| Russian | 3,118 | 0.5% |
| Salvadoran | 2,495 | 0.4% |
| Samoan | 115 | 0.0% |
| Scandinavian | 525 | 0.1% |
| Scotch-Irish | 1,625 | 0.3% |
| Scottish | 7,651 | 1.3% |
| Seminole | 88 | 0.0% |
| Senegalese | 150 | 0.0% |
| Serbian | 58 | 0.0% |
| Sioux | 68 | 0.0% |
| Slavic | 47 | 0.0% |
| Slovak | 145 | 0.0% |
| Slovene | 91 | 0.0% |
| South African | 29 | 0.0% |
| South American | 3,889 | 0.7% |
| South American Indian | 99 | 0.0% |
| Spaniard | 906 | 0.2% |
| Spanish | 830 | 0.1% |
| Sri Lankan | 2,513 | 0.4% |
| Subsaharan African | 21,392 | 3.7% |
| Swedish | 7,121 | 1.2% |
| Swiss | 234 | 0.0% |
| Syrian | 488 | 0.1% |
| Thai | 3,863 | 0.7% |
| Trinidadian and Tobagonian | 221 | 0.0% |
| Turkish | 110 | 0.0% |
| U.S. Virgin Islander | 44 | 0.0% |
| Ugandan | 43 | 0.0% |
| Ukrainian | 1,030 | 0.2% |
| Uruguayan | 12 | 0.0% |
| Ute | 15 | 0.0% |
| Venezuelan | 306 | 0.1% |
| Vietnamese | 144 | 0.0% |
| Welsh | 994 | 0.2% |
| West Indian | 326 | 0.1% |
| Yugoslavian | 124 | 0.0% |
| Zimbabwean | 24 | 0.0% | View All 154 Rows |
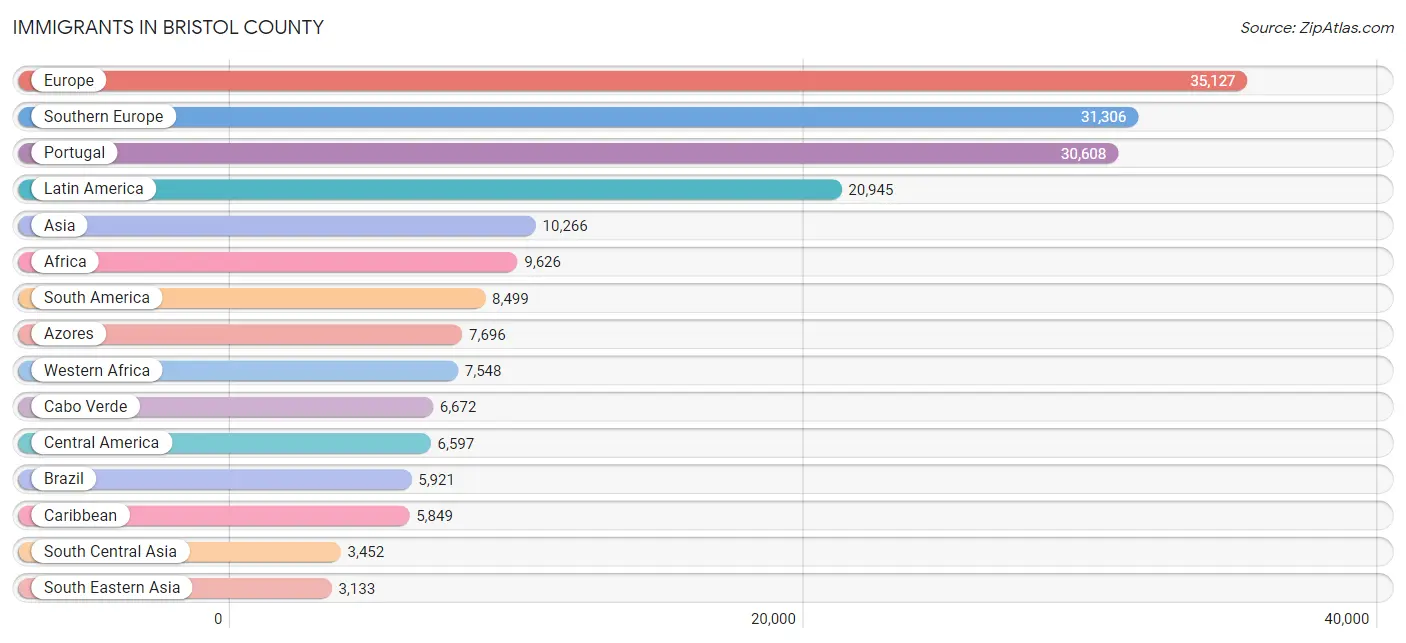
Immigrants in Bristol County
The most numerous immigrant groups reported in Bristol County came from Europe (35,127 | 6.1%), Southern Europe (31,306 | 5.4%), Portugal (30,608 | 5.3%), Latin America (20,945 | 3.6%), and Asia (10,266 | 1.8%), together accounting for 22.2% of all Bristol County residents.
| Immigration Origin | # Population | % Population |
| Africa | 9,626 | 1.7% |
| Albania | 358 | 0.1% |
| Argentina | 59 | 0.0% |
| Armenia | 126 | 0.0% |
| Asia | 10,266 | 1.8% |
| Australia | 48 | 0.0% |
| Austria | 62 | 0.0% |
| Azores | 7,696 | 1.3% |
| Bahamas | 164 | 0.0% |
| Bangladesh | 164 | 0.0% |
| Barbados | 56 | 0.0% |
| Belgium | 10 | 0.0% |
| Belize | 11 | 0.0% |
| Bolivia | 31 | 0.0% |
| Brazil | 5,921 | 1.0% |
| Bulgaria | 157 | 0.0% |
| Cabo Verde | 6,672 | 1.2% |
| Cambodia | 736 | 0.1% |
| Cameroon | 191 | 0.0% |
| Canada | 950 | 0.2% |
| Caribbean | 5,849 | 1.0% |
| Central America | 6,597 | 1.1% |
| Chile | 27 | 0.0% |
| China | 2,292 | 0.4% |
| Colombia | 703 | 0.1% |
| Congo | 32 | 0.0% |
| Costa Rica | 87 | 0.0% |
| Cuba | 135 | 0.0% |
| Czechoslovakia | 65 | 0.0% |
| Denmark | 40 | 0.0% |
| Dominica | 220 | 0.0% |
| Dominican Republic | 2,051 | 0.4% |
| Eastern Africa | 420 | 0.1% |
| Eastern Asia | 2,700 | 0.5% |
| Eastern Europe | 1,858 | 0.3% |
| Ecuador | 1,088 | 0.2% |
| Egypt | 647 | 0.1% |
| El Salvador | 1,397 | 0.2% |
| England | 268 | 0.1% |
| Eritrea | 28 | 0.0% |
| Ethiopia | 19 | 0.0% |
| Europe | 35,127 | 6.1% |
| France | 179 | 0.0% |
| Germany | 572 | 0.1% |
| Ghana | 158 | 0.0% |
| Greece | 228 | 0.0% |
| Grenada | 20 | 0.0% |
| Guatemala | 2,807 | 0.5% |
| Guyana | 77 | 0.0% |
| Haiti | 2,556 | 0.4% |
| Honduras | 1,523 | 0.3% |
| Hong Kong | 56 | 0.0% |
| Hungary | 25 | 0.0% |
| India | 2,502 | 0.4% |
| Indonesia | 18 | 0.0% |
| Iran | 123 | 0.0% |
| Ireland | 237 | 0.0% |
| Israel | 96 | 0.0% |
| Italy | 352 | 0.1% |
| Jamaica | 287 | 0.1% |
| Japan | 115 | 0.0% |
| Jordan | 33 | 0.0% |
| Kazakhstan | 40 | 0.0% |
| Kenya | 223 | 0.0% |
| Korea | 293 | 0.1% |
| Laos | 67 | 0.0% |
| Latin America | 20,945 | 3.6% |
| Lebanon | 300 | 0.1% |
| Liberia | 48 | 0.0% |
| Lithuania | 50 | 0.0% |
| Malaysia | 143 | 0.0% |
| Mexico | 686 | 0.1% |
| Middle Africa | 527 | 0.1% |
| Moldova | 11 | 0.0% |
| Morocco | 176 | 0.0% |
| Nepal | 31 | 0.0% |
| Netherlands | 124 | 0.0% |
| Nicaragua | 10 | 0.0% |
| Nigeria | 331 | 0.1% |
| Northern Africa | 883 | 0.2% |
| Northern Europe | 1,004 | 0.2% |
| Norway | 52 | 0.0% |
| Oceania | 126 | 0.0% |
| Pakistan | 535 | 0.1% |
| Panama | 45 | 0.0% |
| Peru | 320 | 0.1% |
| Philippines | 476 | 0.1% |
| Poland | 349 | 0.1% |
| Portugal | 30,608 | 5.3% |
| Romania | 213 | 0.0% |
| Russia | 414 | 0.1% |
| Saudi Arabia | 37 | 0.0% |
| Scotland | 117 | 0.0% |
| Senegal | 215 | 0.0% |
| Sierra Leone | 50 | 0.0% |
| Singapore | 20 | 0.0% |
| South Africa | 77 | 0.0% |
| South America | 8,499 | 1.5% |
| South Central Asia | 3,452 | 0.6% |
| South Eastern Asia | 3,133 | 0.5% |
| Southern Europe | 31,306 | 5.4% |
| Spain | 118 | 0.0% |
| Sri Lanka | 43 | 0.0% |
| Sweden | 51 | 0.0% |
| Switzerland | 12 | 0.0% |
| Syria | 217 | 0.0% |
| Taiwan | 133 | 0.0% |
| Thailand | 315 | 0.1% |
| Trinidad and Tobago | 191 | 0.0% |
| Turkey | 70 | 0.0% |
| Uganda | 37 | 0.0% |
| Ukraine | 190 | 0.0% |
| Uruguay | 23 | 0.0% |
| Uzbekistan | 14 | 0.0% |
| Venezuela | 181 | 0.0% |
| Vietnam | 1,236 | 0.2% |
| Western Africa | 7,548 | 1.3% |
| Western Asia | 913 | 0.2% |
| Western Europe | 959 | 0.2% |
| Zaire | 86 | 0.0% |
| Zimbabwe | 47 | 0.0% | View All 121 Rows |
Sex and Age in Bristol County
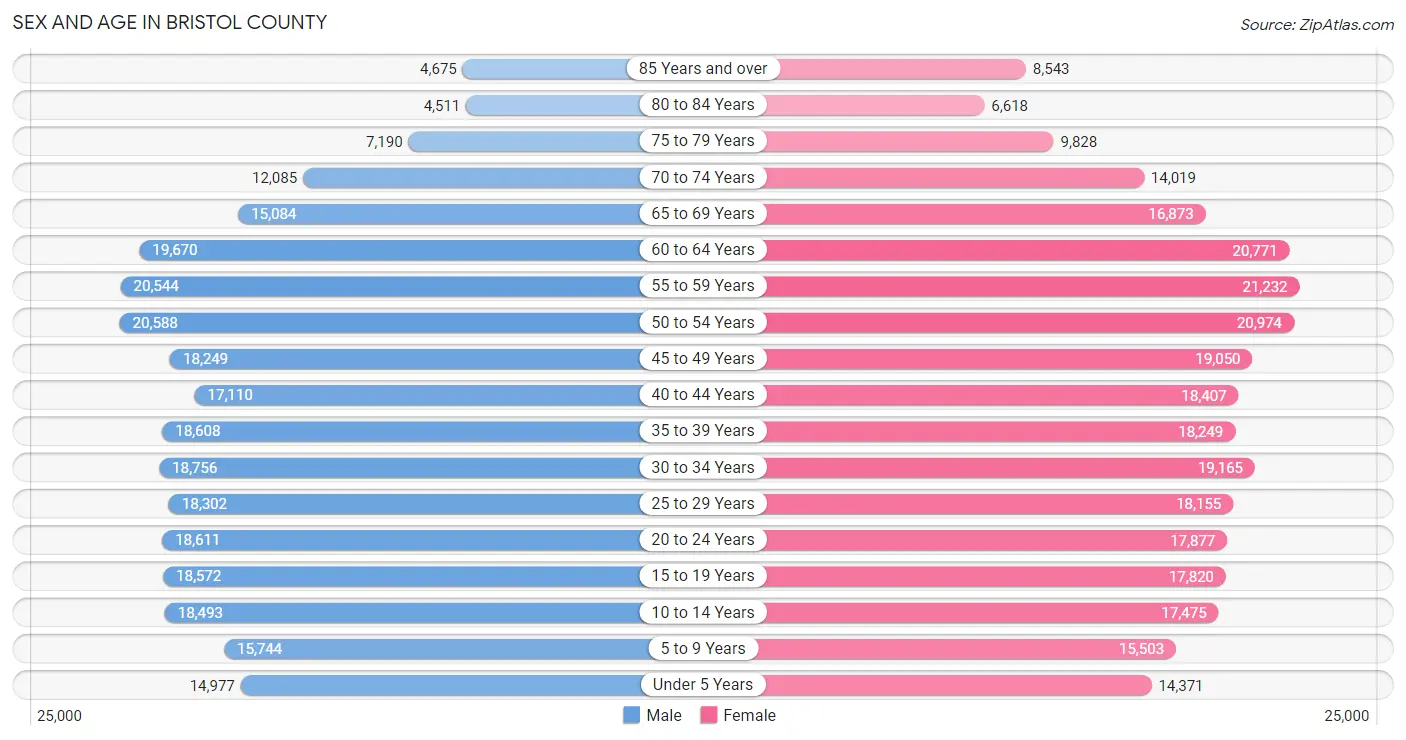
Sex and Age in Bristol County
The most populous age groups in Bristol County are 50 to 54 Years (20,588 | 7.3%) for men and 55 to 59 Years (21,232 | 7.2%) for women.
| Age Bracket | Male | Female |
| Under 5 Years | 14,977 (5.3%) | 14,371 (4.9%) |
| 5 to 9 Years | 15,744 (5.6%) | 15,503 (5.3%) |
| 10 to 14 Years | 18,493 (6.6%) | 17,475 (5.9%) |
| 15 to 19 Years | 18,572 (6.6%) | 17,820 (6.0%) |
| 20 to 24 Years | 18,611 (6.6%) | 17,877 (6.1%) |
| 25 to 29 Years | 18,302 (6.5%) | 18,155 (6.2%) |
| 30 to 34 Years | 18,756 (6.7%) | 19,165 (6.5%) |
| 35 to 39 Years | 18,608 (6.6%) | 18,249 (6.2%) |
| 40 to 44 Years | 17,110 (6.1%) | 18,407 (6.2%) |
| 45 to 49 Years | 18,249 (6.5%) | 19,050 (6.5%) |
| 50 to 54 Years | 20,588 (7.3%) | 20,974 (7.1%) |
| 55 to 59 Years | 20,544 (7.3%) | 21,232 (7.2%) |
| 60 to 64 Years | 19,670 (7.0%) | 20,771 (7.0%) |
| 65 to 69 Years | 15,084 (5.3%) | 16,873 (5.7%) |
| 70 to 74 Years | 12,085 (4.3%) | 14,019 (4.8%) |
| 75 to 79 Years | 7,190 (2.5%) | 9,828 (3.3%) |
| 80 to 84 Years | 4,511 (1.6%) | 6,618 (2.2%) |
| 85 Years and over | 4,675 (1.7%) | 8,543 (2.9%) |
| Total | 281,769 (100.0%) | 294,930 (100.0%) |
Families and Households in Bristol County
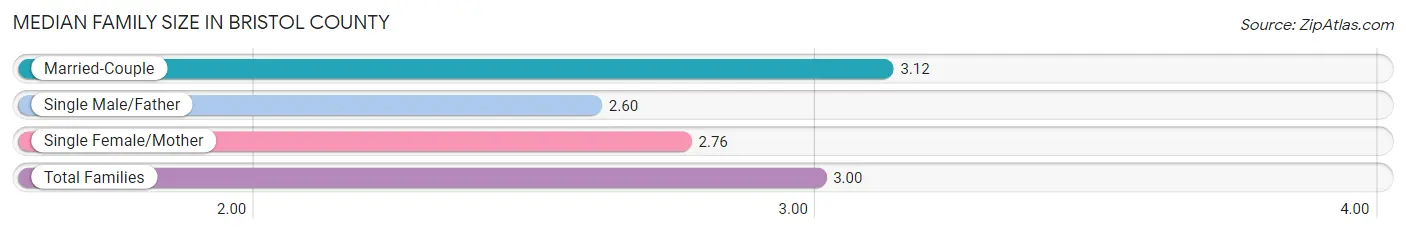
Median Family Size in Bristol County
The median family size in Bristol County is 3.00 persons per family, with married-couple families (103,410 | 69.1%) accounting for the largest median family size of 3.12 persons per family. On the other hand, single male/father families (12,564 | 8.4%) represent the smallest median family size with 2.60 persons per family.
| Family Type | # Families | Family Size |
| Married-Couple | 103,410 (69.1%) | 3.12 |
| Single Male/Father | 12,564 (8.4%) | 2.60 |
| Single Female/Mother | 33,648 (22.5%) | 2.76 |
| Total Families | 149,622 (100.0%) | 3.00 |
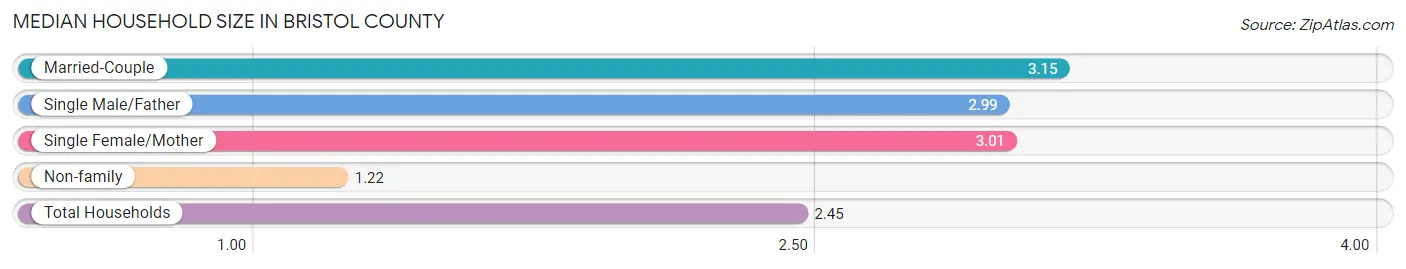
Median Household Size in Bristol County
The median household size in Bristol County is 2.45 persons per household, with married-couple households (103,410 | 45.0%) accounting for the largest median household size of 3.15 persons per household. non-family households (80,239 | 34.9%) represent the smallest median household size with 1.22 persons per household.
| Household Type | # Households | Household Size |
| Married-Couple | 103,410 (45.0%) | 3.15 |
| Single Male/Father | 12,564 (5.5%) | 2.99 |
| Single Female/Mother | 33,648 (14.6%) | 3.01 |
| Non-family | 80,239 (34.9%) | 1.22 |
| Total Households | 229,861 (100.0%) | 2.45 |
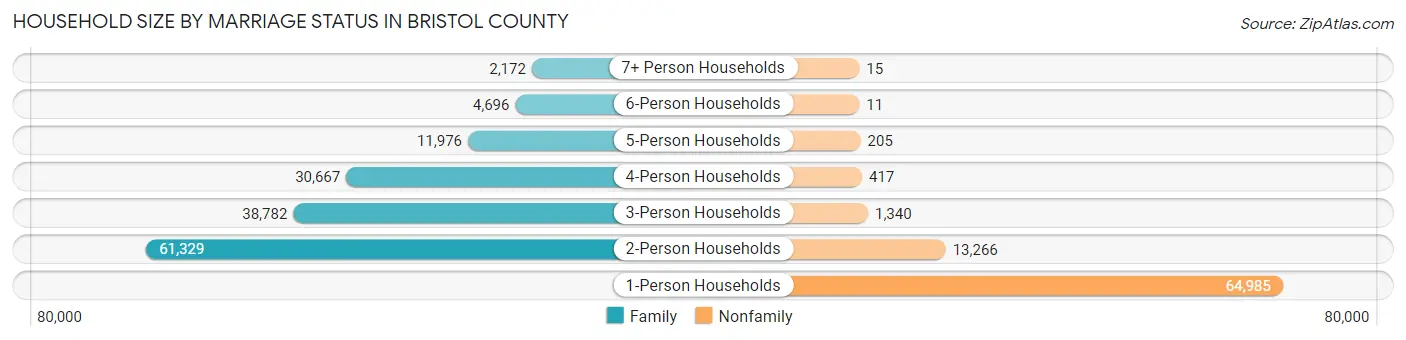
Household Size by Marriage Status in Bristol County
Out of a total of 229,861 households in Bristol County, 149,622 (65.1%) are family households, while 80,239 (34.9%) are nonfamily households. The most numerous type of family households are 2-person households, comprising 61,329, and the most common type of nonfamily households are 1-person households, comprising 64,985.
| Household Size | Family Households | Nonfamily Households |
| 1-Person Households | - | 64,985 (28.3%) |
| 2-Person Households | 61,329 (26.7%) | 13,266 (5.8%) |
| 3-Person Households | 38,782 (16.9%) | 1,340 (0.6%) |
| 4-Person Households | 30,667 (13.3%) | 417 (0.2%) |
| 5-Person Households | 11,976 (5.2%) | 205 (0.1%) |
| 6-Person Households | 4,696 (2.0%) | 11 (0.0%) |
| 7+ Person Households | 2,172 (0.9%) | 15 (0.0%) |
| Total | 149,622 (65.1%) | 80,239 (34.9%) |
Female Fertility in Bristol County
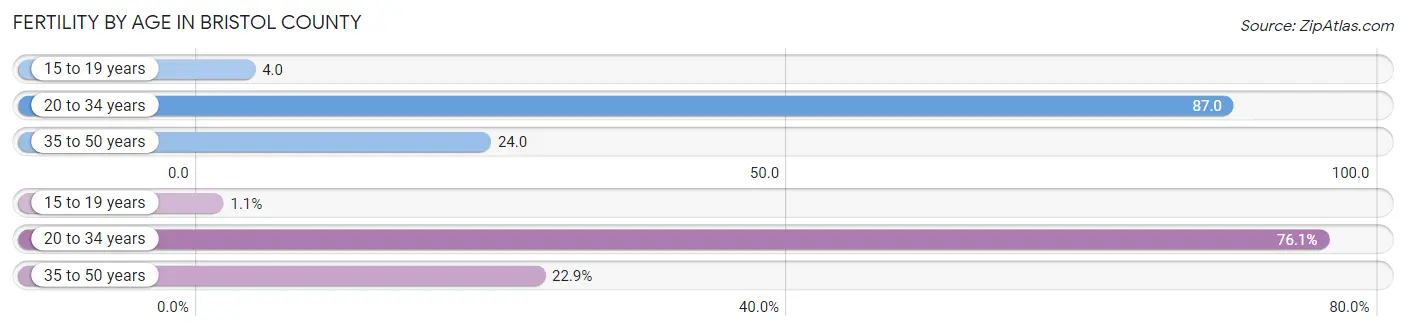
Fertility by Age in Bristol County
Average fertility rate in Bristol County is 47.0 births per 1,000 women. Women in the age bracket of 20 to 34 years have the highest fertility rate with 87.0 births per 1,000 women. Women in the age bracket of 20 to 34 years acount for 76.1% of all women with births.
| Age Bracket | Women with Births | Births / 1,000 Women |
| 15 to 19 years | 66 (1.1%) | 4.0 |
| 20 to 34 years | 4,777 (76.1%) | 87.0 |
| 35 to 50 years | 1,436 (22.9%) | 24.0 |
| Total | 6,279 (100.0%) | 47.0 |
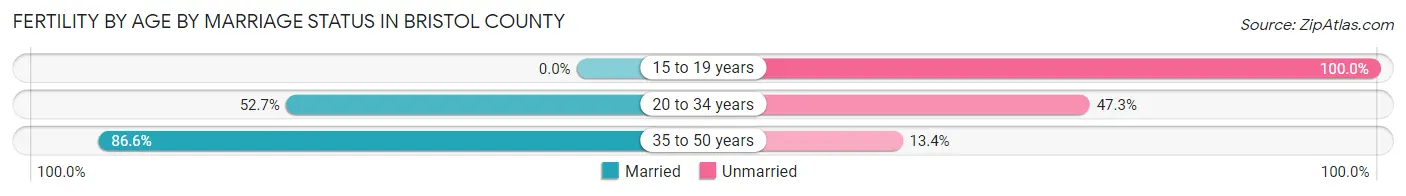
Fertility by Age by Marriage Status in Bristol County
59.9% of women with births (6,279) in Bristol County are married. The highest percentage of unmarried women with births falls into 15 to 19 years age bracket with 100.0% of them unmarried at the time of birth, while the lowest percentage of unmarried women with births belong to 35 to 50 years age bracket with 13.4% of them unmarried.
| Age Bracket | Married | Unmarried |
| 15 to 19 years | 0 (0.0%) | 66 (100.0%) |
| 20 to 34 years | 2,517 (52.7%) | 2,260 (47.3%) |
| 35 to 50 years | 1,244 (86.6%) | 192 (13.4%) |
| Total | 3,761 (59.9%) | 2,518 (40.1%) |
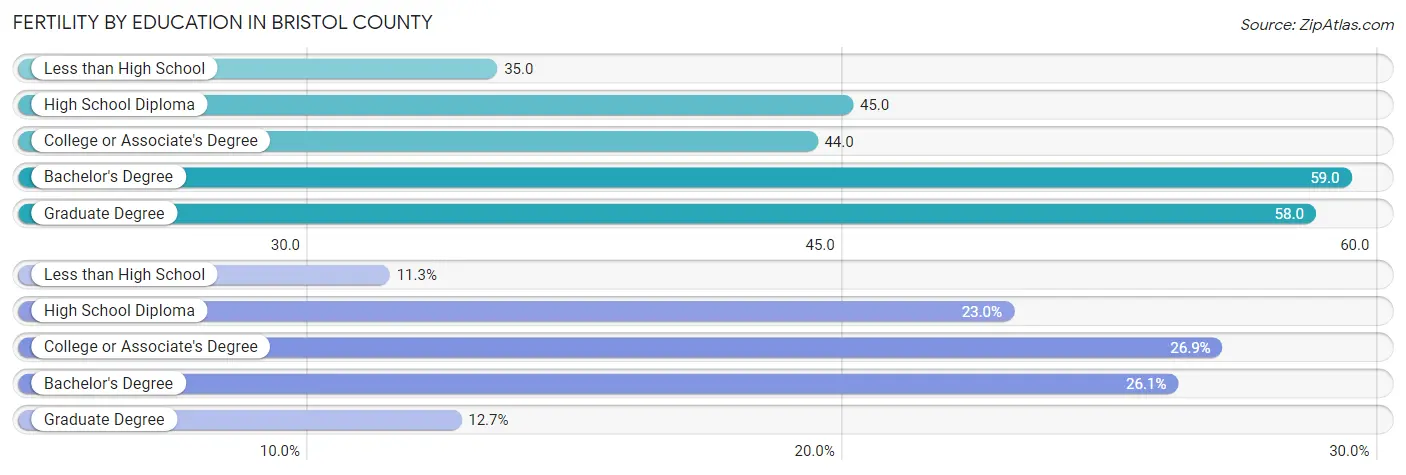
Fertility by Education in Bristol County
Average fertility rate in Bristol County is 47.0 births per 1,000 women. Women with the education attainment of bachelor's degree have the highest fertility rate of 59.0 births per 1,000 women, while women with the education attainment of less than high school have the lowest fertility at 35.0 births per 1,000 women. Women with the education attainment of college or associate's degree represent 26.9% of all women with births.
| Educational Attainment | Women with Births | Births / 1,000 Women |
| Less than High School | 711 (11.3%) | 35.0 |
| High School Diploma | 1,445 (23.0%) | 45.0 |
| College or Associate's Degree | 1,690 (26.9%) | 44.0 |
| Bachelor's Degree | 1,638 (26.1%) | 59.0 |
| Graduate Degree | 795 (12.7%) | 58.0 |
| Total | 6,279 (100.0%) | 47.0 |
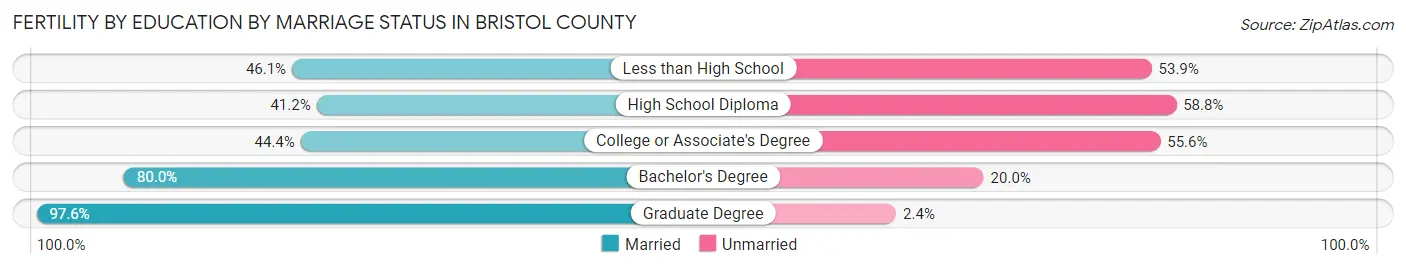
Fertility by Education by Marriage Status in Bristol County
40.1% of women with births in Bristol County are unmarried. Women with the educational attainment of graduate degree are most likely to be married with 97.6% of them married at childbirth, while women with the educational attainment of high school diploma are least likely to be married with 58.8% of them unmarried at childbirth.
| Educational Attainment | Married | Unmarried |
| Less than High School | 328 (46.1%) | 383 (53.9%) |
| High School Diploma | 595 (41.2%) | 850 (58.8%) |
| College or Associate's Degree | 750 (44.4%) | 940 (55.6%) |
| Bachelor's Degree | 1,310 (80.0%) | 328 (20.0%) |
| Graduate Degree | 776 (97.6%) | 19 (2.4%) |
| Total | 3,761 (59.9%) | 2,518 (40.1%) |
Income in Bristol County
Income Overview in Bristol County
Per Capita Income in Bristol County is $42,006, while median incomes of families and households are $103,265 and $80,628 respectively.
| Characteristic | Number | Measure |
| Per Capita Income | 576,699 | $42,006 |
| Median Family Income | 149,622 | $103,265 |
| Mean Family Income | 149,622 | $125,257 |
| Median Household Income | 229,861 | $80,628 |
| Mean Household Income | 229,861 | $104,738 |
| Income Deficit | 149,622 | $10,739 |
| Wage / Income Gap (%) | 576,699 | 29.65% |
| Wage / Income Gap ($) | 576,699 | 70.35¢ per $1 |
| Gini / Inequality Index | 576,699 | 0.46 |
Earnings by Sex in Bristol County
Average Earnings in Bristol County are $47,057, $56,598 for men and $39,816 for women, a difference of 29.6%.
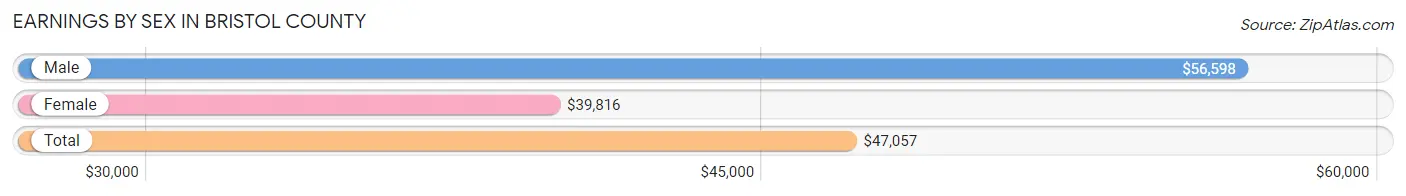
| Sex | Number | Average Earnings |
| Male | 164,480 (51.4%) | $56,598 |
| Female | 155,735 (48.6%) | $39,816 |
| Total | 320,215 (100.0%) | $47,057 |
Earnings by Sex by Income Bracket in Bristol County
The most common earnings brackets in Bristol County are $100,000+ for men (33,882 | 20.6%) and $75,000 to $99,999 for women (15,918 | 10.2%).
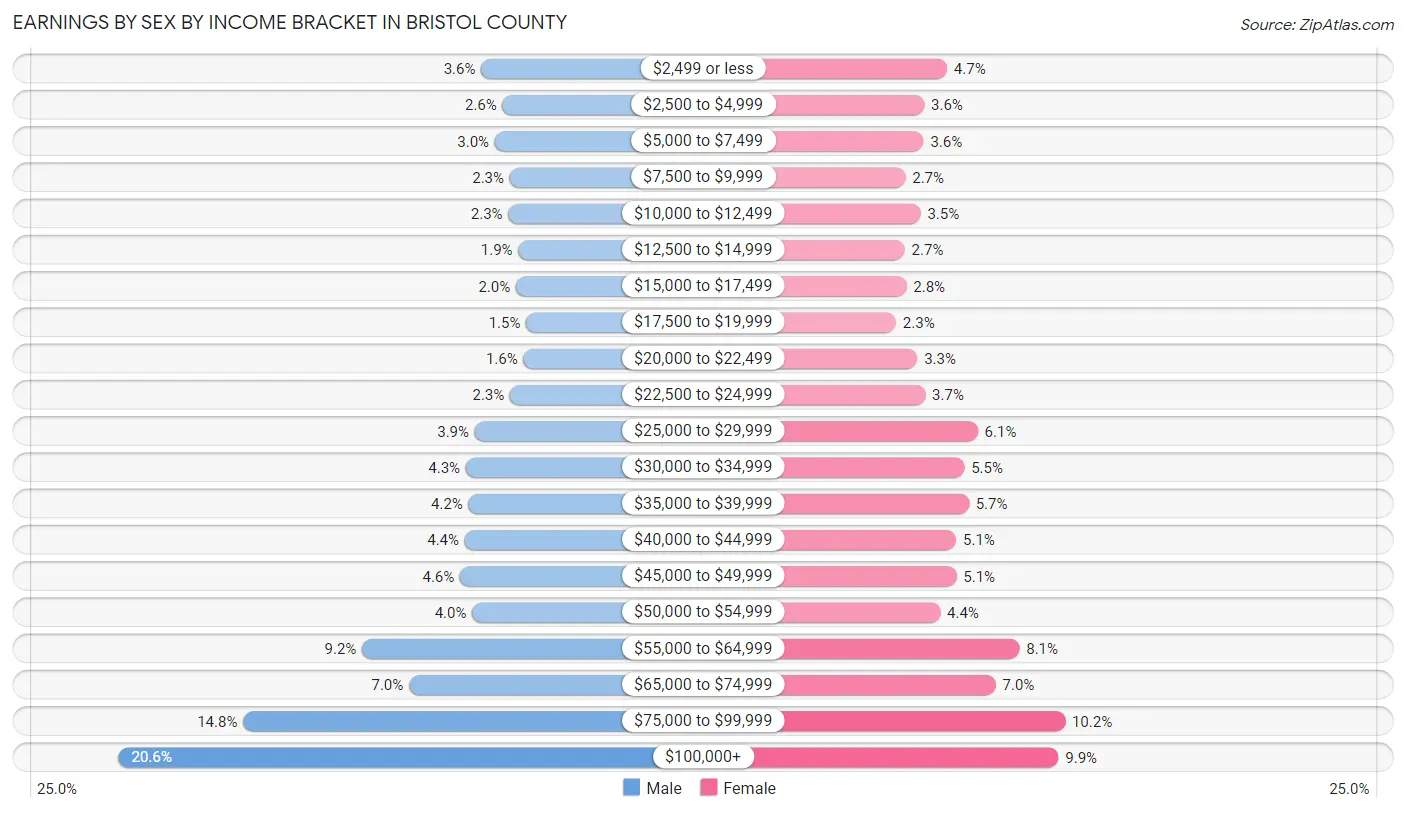
| Income | Male | Female |
| $2,499 or less | 5,932 (3.6%) | 7,308 (4.7%) |
| $2,500 to $4,999 | 4,292 (2.6%) | 5,639 (3.6%) |
| $5,000 to $7,499 | 4,884 (3.0%) | 5,593 (3.6%) |
| $7,500 to $9,999 | 3,732 (2.3%) | 4,274 (2.7%) |
| $10,000 to $12,499 | 3,847 (2.3%) | 5,367 (3.5%) |
| $12,500 to $14,999 | 3,069 (1.9%) | 4,213 (2.7%) |
| $15,000 to $17,499 | 3,253 (2.0%) | 4,352 (2.8%) |
| $17,500 to $19,999 | 2,461 (1.5%) | 3,581 (2.3%) |
| $20,000 to $22,499 | 2,685 (1.6%) | 5,141 (3.3%) |
| $22,500 to $24,999 | 3,711 (2.3%) | 5,715 (3.7%) |
| $25,000 to $29,999 | 6,428 (3.9%) | 9,541 (6.1%) |
| $30,000 to $34,999 | 7,117 (4.3%) | 8,563 (5.5%) |
| $35,000 to $39,999 | 6,902 (4.2%) | 8,895 (5.7%) |
| $40,000 to $44,999 | 7,209 (4.4%) | 7,970 (5.1%) |
| $45,000 to $49,999 | 7,562 (4.6%) | 7,984 (5.1%) |
| $50,000 to $54,999 | 6,626 (4.0%) | 6,808 (4.4%) |
| $55,000 to $64,999 | 15,123 (9.2%) | 12,583 (8.1%) |
| $65,000 to $74,999 | 11,492 (7.0%) | 10,849 (7.0%) |
| $75,000 to $99,999 | 24,273 (14.8%) | 15,918 (10.2%) |
| $100,000+ | 33,882 (20.6%) | 15,441 (9.9%) |
| Total | 164,480 (100.0%) | 155,735 (100.0%) |
Earnings by Sex by Educational Attainment in Bristol County
Average earnings in Bristol County are $63,979 for men and $45,958 for women, a difference of 28.2%. Men with an educational attainment of graduate degree enjoy the highest average annual earnings of $105,560, while those with less than high school education earn the least with $45,780. Women with an educational attainment of graduate degree earn the most with the average annual earnings of $81,852, while those with less than high school education have the smallest earnings of $28,969.
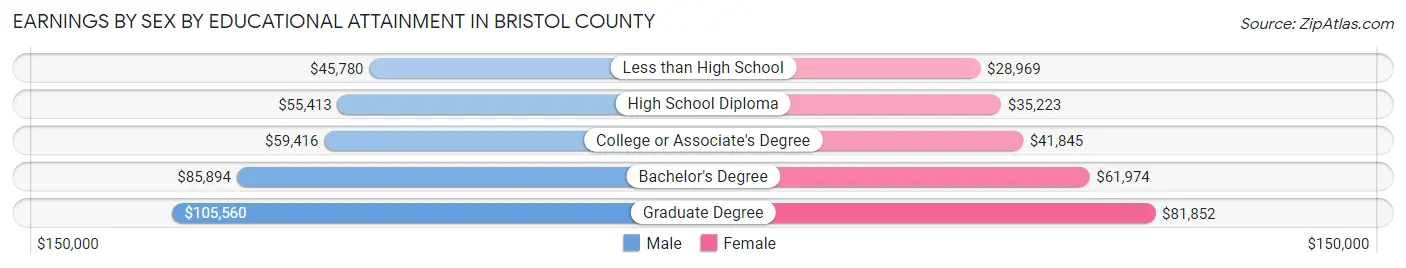
| Educational Attainment | Male Income | Female Income |
| Less than High School | $45,780 | $28,969 |
| High School Diploma | $55,413 | $35,223 |
| College or Associate's Degree | $59,416 | $41,845 |
| Bachelor's Degree | $85,894 | $61,974 |
| Graduate Degree | $105,560 | $81,852 |
| Total | $63,979 | $45,958 |
Family Income in Bristol County
Family Income Brackets in Bristol County
According to the Bristol County family income data, there are 32,019 families falling into the $100,000 to $149,999 income range, which is the most common income bracket and makes up 21.4% of all families. Conversely, the $10,000 to $14,999 income bracket is the least frequent group with only 2,544 families (1.7%) belonging to this category.
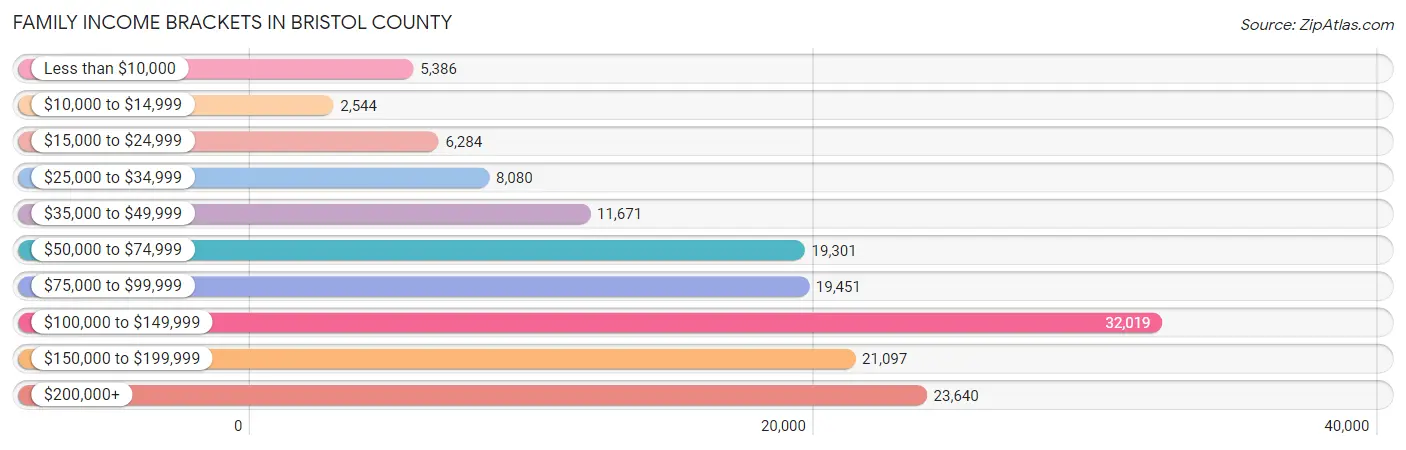
| Income Bracket | # Families | % Families |
| Less than $10,000 | 5,386 | 3.6% |
| $10,000 to $14,999 | 2,544 | 1.7% |
| $15,000 to $24,999 | 6,284 | 4.2% |
| $25,000 to $34,999 | 8,080 | 5.4% |
| $35,000 to $49,999 | 11,671 | 7.8% |
| $50,000 to $74,999 | 19,301 | 12.9% |
| $75,000 to $99,999 | 19,451 | 13.0% |
| $100,000 to $149,999 | 32,019 | 21.4% |
| $150,000 to $199,999 | 21,097 | 14.1% |
| $200,000+ | 23,640 | 15.8% |
Family Income by Famaliy Size in Bristol County
6-person families (3,726 | 2.5%) account for the highest median family income in Bristol County with $152,031 per family, while 2-person families (67,502 | 45.1%) have the highest median income of $41,051 per family member.
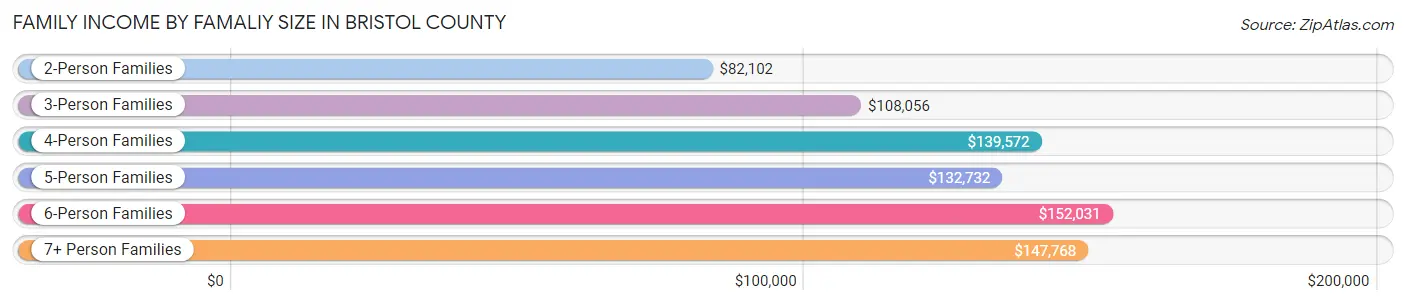
| Income Bracket | # Families | Median Income |
| 2-Person Families | 67,502 (45.1%) | $82,102 |
| 3-Person Families | 37,780 (25.3%) | $108,056 |
| 4-Person Families | 28,074 (18.8%) | $139,572 |
| 5-Person Families | 10,739 (7.2%) | $132,732 |
| 6-Person Families | 3,726 (2.5%) | $152,031 |
| 7+ Person Families | 1,801 (1.2%) | $147,768 |
| Total | 149,622 (100.0%) | $103,265 |
Family Income by Number of Earners in Bristol County
The median family income in Bristol County is $103,265, with families comprising 3+ earners (23,917) having the highest median family income of $171,758, while families with no earners (21,355) have the lowest median family income of $41,631, accounting for 16.0% and 14.3% of families, respectively.
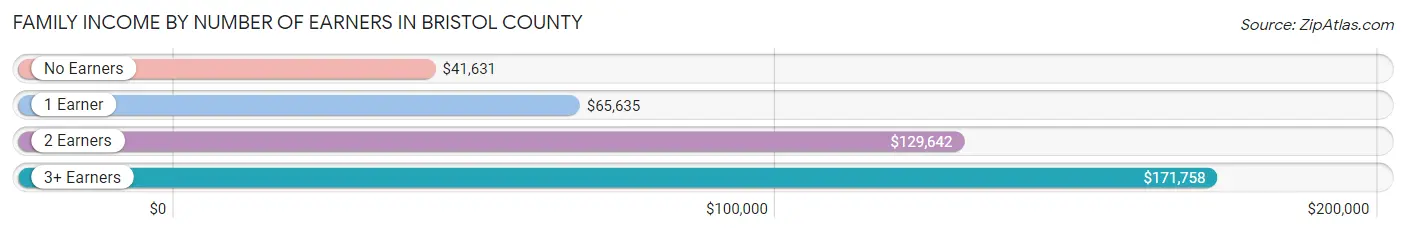
| Number of Earners | # Families | Median Income |
| No Earners | 21,355 (14.3%) | $41,631 |
| 1 Earner | 44,821 (30.0%) | $65,635 |
| 2 Earners | 59,529 (39.8%) | $129,642 |
| 3+ Earners | 23,917 (16.0%) | $171,758 |
| Total | 149,622 (100.0%) | $103,265 |
Household Income in Bristol County
Household Income Brackets in Bristol County
With 41,605 households falling in the category, the $100,000 to $149,999 income range is the most frequent in Bristol County, accounting for 18.1% of all households. In contrast, only 9,654 households (4.2%) fall into the $10,000 to $14,999 income bracket, making it the least populous group.
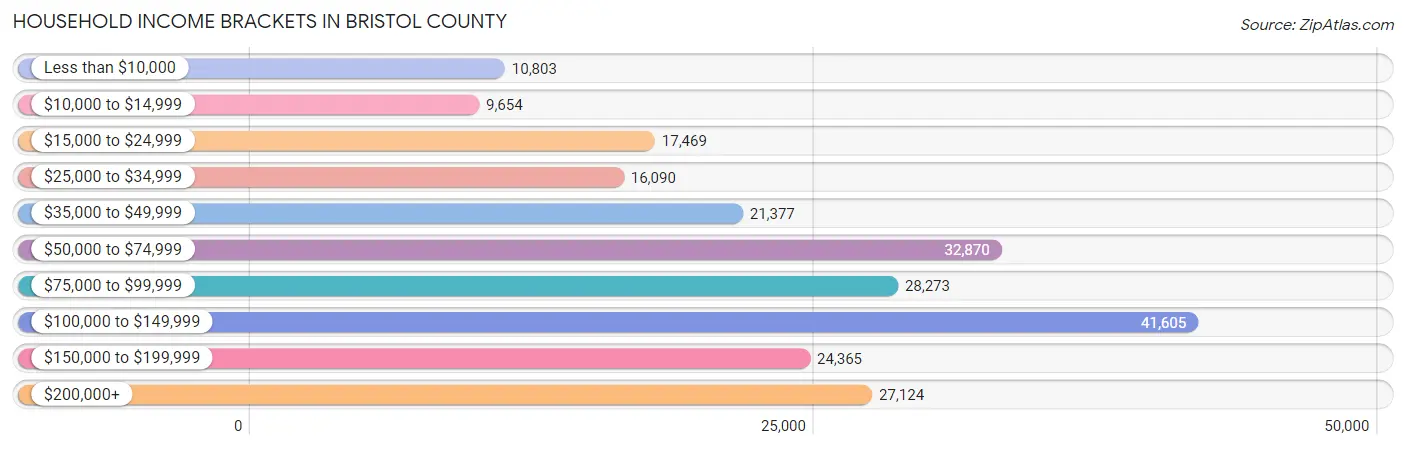
| Income Bracket | # Households | % Households |
| Less than $10,000 | 10,803 | 4.7% |
| $10,000 to $14,999 | 9,654 | 4.2% |
| $15,000 to $24,999 | 17,469 | 7.6% |
| $25,000 to $34,999 | 16,090 | 7.0% |
| $35,000 to $49,999 | 21,377 | 9.3% |
| $50,000 to $74,999 | 32,870 | 14.3% |
| $75,000 to $99,999 | 28,273 | 12.3% |
| $100,000 to $149,999 | 41,605 | 18.1% |
| $150,000 to $199,999 | 24,365 | 10.6% |
| $200,000+ | 27,124 | 11.8% |
Household Income by Householder Age in Bristol County
The median household income in Bristol County is $80,628, with the highest median household income of $102,507 found in the 45 to 64 years age bracket for the primary householder. A total of 92,682 households (40.3%) fall into this category. Meanwhile, the 15 to 24 years age bracket for the primary householder has the lowest median household income of $50,462, with 5,335 households (2.3%) in this group.
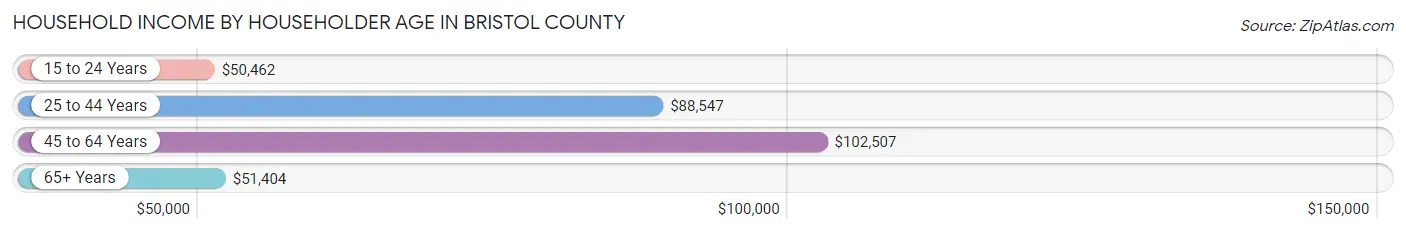
| Income Bracket | # Households | Median Income |
| 15 to 24 Years | 5,335 (2.3%) | $50,462 |
| 25 to 44 Years | 68,127 (29.6%) | $88,547 |
| 45 to 64 Years | 92,682 (40.3%) | $102,507 |
| 65+ Years | 63,717 (27.7%) | $51,404 |
| Total | 229,861 (100.0%) | $80,628 |
Poverty in Bristol County
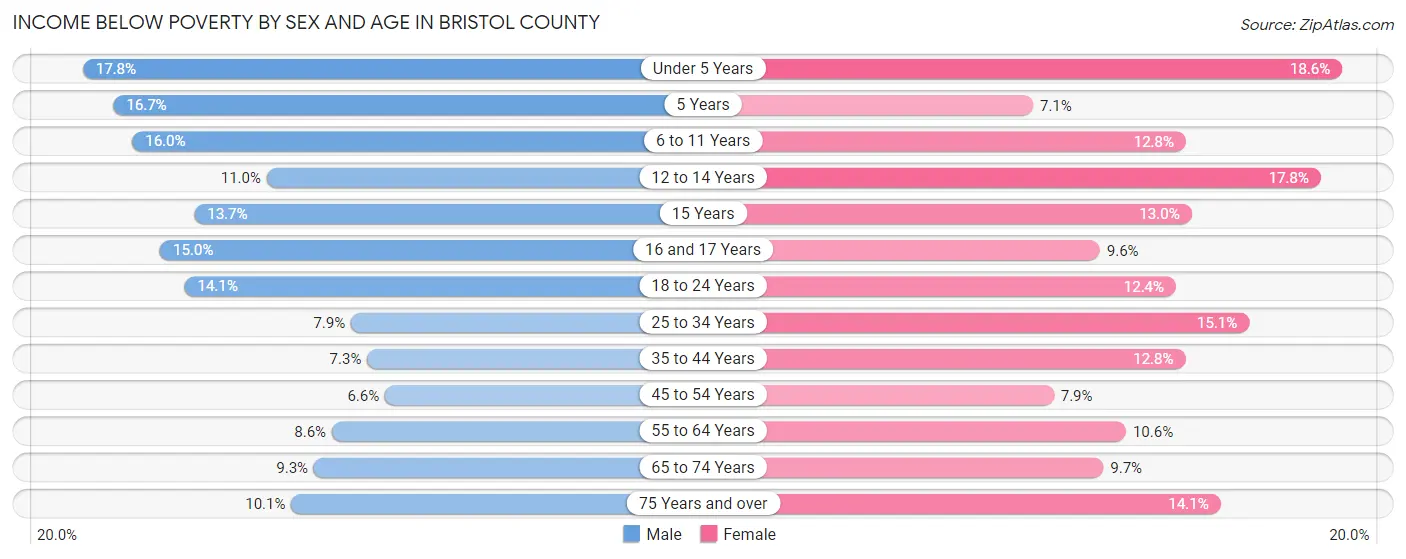
Income Below Poverty by Sex and Age in Bristol County
With 10.1% poverty level for males and 12.1% for females among the residents of Bristol County, under 5 year old males and under 5 year old females are the most vulnerable to poverty, with 2,612 males (17.8%) and 2,613 females (18.6%) in their respective age groups living below the poverty level.
| Age Bracket | Male | Female |
| Under 5 Years | 2,612 (17.8%) | 2,613 (18.6%) |
| 5 Years | 518 (16.7%) | 210 (7.1%) |
| 6 to 11 Years | 3,084 (16.0%) | 2,414 (12.8%) |
| 12 to 14 Years | 1,241 (11.0%) | 1,858 (17.8%) |
| 15 Years | 528 (13.7%) | 444 (13.0%) |
| 16 and 17 Years | 1,085 (15.0%) | 696 (9.6%) |
| 18 to 24 Years | 3,219 (14.1%) | 2,678 (12.4%) |
| 25 to 34 Years | 2,907 (7.9%) | 5,624 (15.1%) |
| 35 to 44 Years | 2,585 (7.3%) | 4,665 (12.8%) |
| 45 to 54 Years | 2,563 (6.6%) | 3,144 (7.9%) |
| 55 to 64 Years | 3,435 (8.6%) | 4,399 (10.5%) |
| 65 to 74 Years | 2,493 (9.3%) | 2,964 (9.7%) |
| 75 Years and over | 1,562 (10.1%) | 3,260 (14.1%) |
| Total | 27,832 (10.1%) | 34,969 (12.1%) |
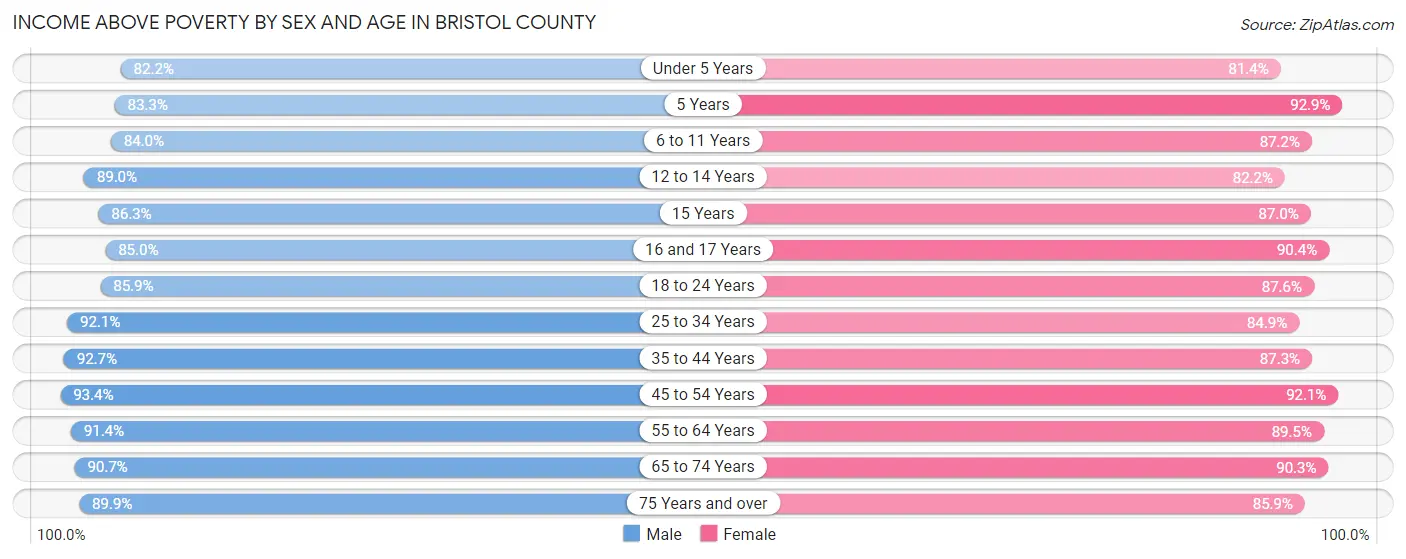
Income Above Poverty by Sex and Age in Bristol County
According to the poverty statistics in Bristol County, males aged 45 to 54 years and females aged 5 years are the age groups that are most secure financially, with 93.4% of males and 92.9% of females in these age groups living above the poverty line.
| Age Bracket | Male | Female |
| Under 5 Years | 12,030 (82.2%) | 11,455 (81.4%) |
| 5 Years | 2,584 (83.3%) | 2,749 (92.9%) |
| 6 to 11 Years | 16,187 (84.0%) | 16,488 (87.2%) |
| 12 to 14 Years | 10,027 (89.0%) | 8,591 (82.2%) |
| 15 Years | 3,327 (86.3%) | 2,977 (87.0%) |
| 16 and 17 Years | 6,162 (85.0%) | 6,570 (90.4%) |
| 18 to 24 Years | 19,677 (85.9%) | 18,911 (87.6%) |
| 25 to 34 Years | 33,975 (92.1%) | 31,579 (84.9%) |
| 35 to 44 Years | 32,909 (92.7%) | 31,925 (87.3%) |
| 45 to 54 Years | 36,165 (93.4%) | 36,816 (92.1%) |
| 55 to 64 Years | 36,561 (91.4%) | 37,303 (89.4%) |
| 65 to 74 Years | 24,415 (90.7%) | 27,576 (90.3%) |
| 75 Years and over | 13,902 (89.9%) | 19,924 (85.9%) |
| Total | 247,921 (89.9%) | 252,864 (87.8%) |
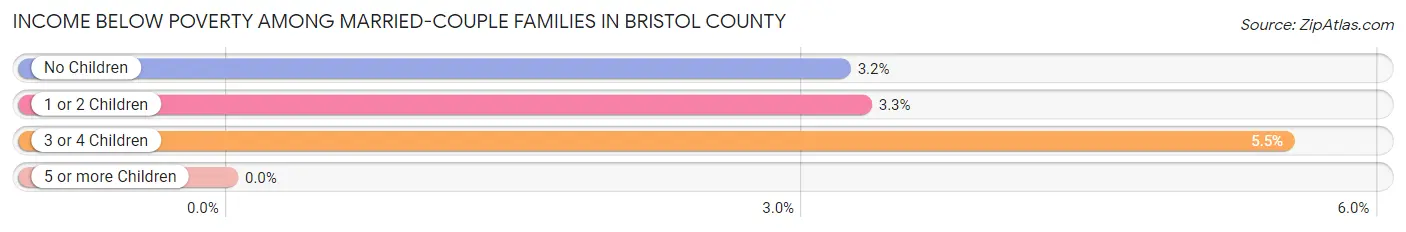
Income Below Poverty Among Married-Couple Families in Bristol County
The poverty statistics for married-couple families in Bristol County show that 3.4% or 3,468 of the total 103,410 families live below the poverty line. Families with 3 or 4 children have the highest poverty rate of 5.5%, comprising of 316 families. On the other hand, families with 5 or more children have the lowest poverty rate of 0.0%, which includes 0 families.
| Children | Above Poverty | Below Poverty |
| No Children | 60,184 (96.8%) | 1,987 (3.2%) |
| 1 or 2 Children | 34,037 (96.7%) | 1,165 (3.3%) |
| 3 or 4 Children | 5,411 (94.5%) | 316 (5.5%) |
| 5 or more Children | 310 (100.0%) | 0 (0.0%) |
| Total | 99,942 (96.7%) | 3,468 (3.4%) |
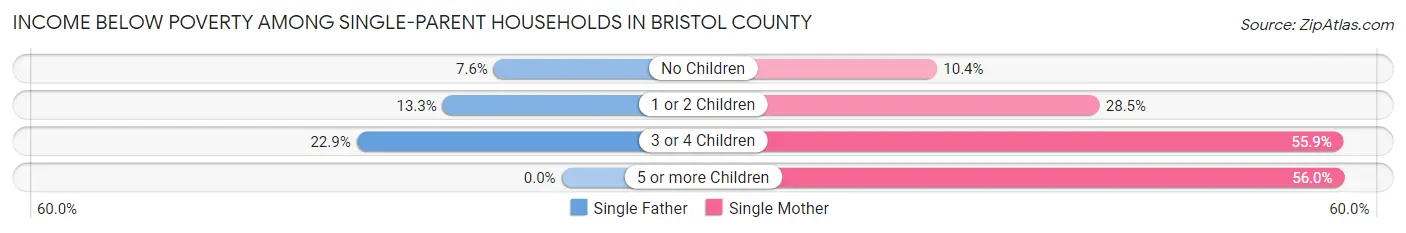
Income Below Poverty Among Single-Parent Households in Bristol County
According to the poverty data in Bristol County, 11.4% or 1,431 single-father households and 23.4% or 7,879 single-mother households are living below the poverty line. Among single-father households, those with 3 or 4 children have the highest poverty rate, with 206 households (22.9%) experiencing poverty. Likewise, among single-mother households, those with 5 or more children have the highest poverty rate, with 94 households (55.9%) falling below the poverty line.
| Children | Single Father | Single Mother |
| No Children | 425 (7.6%) | 1,415 (10.4%) |
| 1 or 2 Children | 800 (13.3%) | 4,909 (28.5%) |
| 3 or 4 Children | 206 (22.9%) | 1,461 (55.9%) |
| 5 or more Children | 0 (0.0%) | 94 (55.9%) |
| Total | 1,431 (11.4%) | 7,879 (23.4%) |
Income Below Poverty Among Married-Couple vs Single-Parent Households in Bristol County
The poverty data for Bristol County shows that 3,468 of the married-couple family households (3.4%) and 9,310 of the single-parent households (20.2%) are living below the poverty level. Within the married-couple family households, those with 3 or 4 children have the highest poverty rate, with 316 households (5.5%) falling below the poverty line. Among the single-parent households, those with 3 or 4 children have the highest poverty rate, with 1,667 household (47.4%) living below poverty.
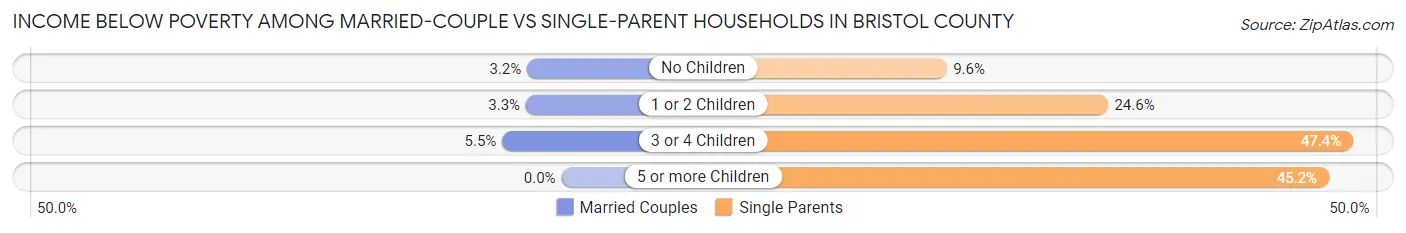
| Children | Married-Couple Families | Single-Parent Households |
| No Children | 1,987 (3.2%) | 1,840 (9.6%) |
| 1 or 2 Children | 1,165 (3.3%) | 5,709 (24.6%) |
| 3 or 4 Children | 316 (5.5%) | 1,667 (47.4%) |
| 5 or more Children | 0 (0.0%) | 94 (45.2%) |
| Total | 3,468 (3.4%) | 9,310 (20.2%) |
Employment Characteristics in Bristol County
Employment by Class of Employer in Bristol County
Among the 285,132 employed individuals in Bristol County, private company employees (199,105 | 69.8%), not-for-profit organizations (27,147 | 9.5%), and local government employees (20,251 | 7.1%) make up the most common classes of employment.
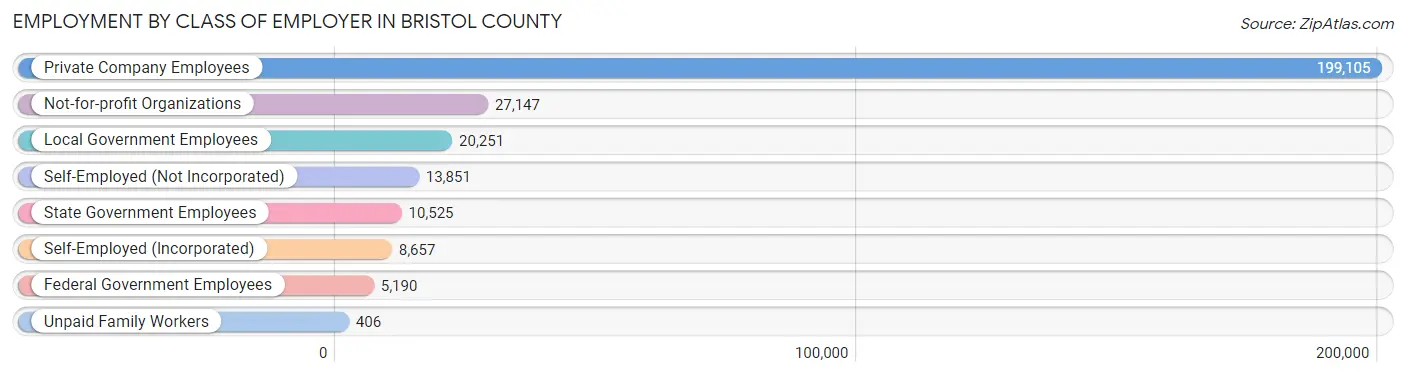
| Employer Class | # Employees | % Employees |
| Private Company Employees | 199,105 | 69.8% |
| Self-Employed (Incorporated) | 8,657 | 3.0% |
| Self-Employed (Not Incorporated) | 13,851 | 4.9% |
| Not-for-profit Organizations | 27,147 | 9.5% |
| Local Government Employees | 20,251 | 7.1% |
| State Government Employees | 10,525 | 3.7% |
| Federal Government Employees | 5,190 | 1.8% |
| Unpaid Family Workers | 406 | 0.1% |
| Total | 285,132 | 100.0% |
Employment Status by Age in Bristol County
According to the labor force statistics for Bristol County, out of the total population over 16 years of age (472,822), 65.3% or 308,753 individuals are in the labor force, with 5.7% or 17,599 of them unemployed. The age group with the highest labor force participation rate is 25 to 29 years, with 85.6% or 31,207 individuals in the labor force. Within the labor force, the 16 to 19 years age range has the highest percentage of unemployed individuals, with 17.8% or 2,505 of them being unemployed.
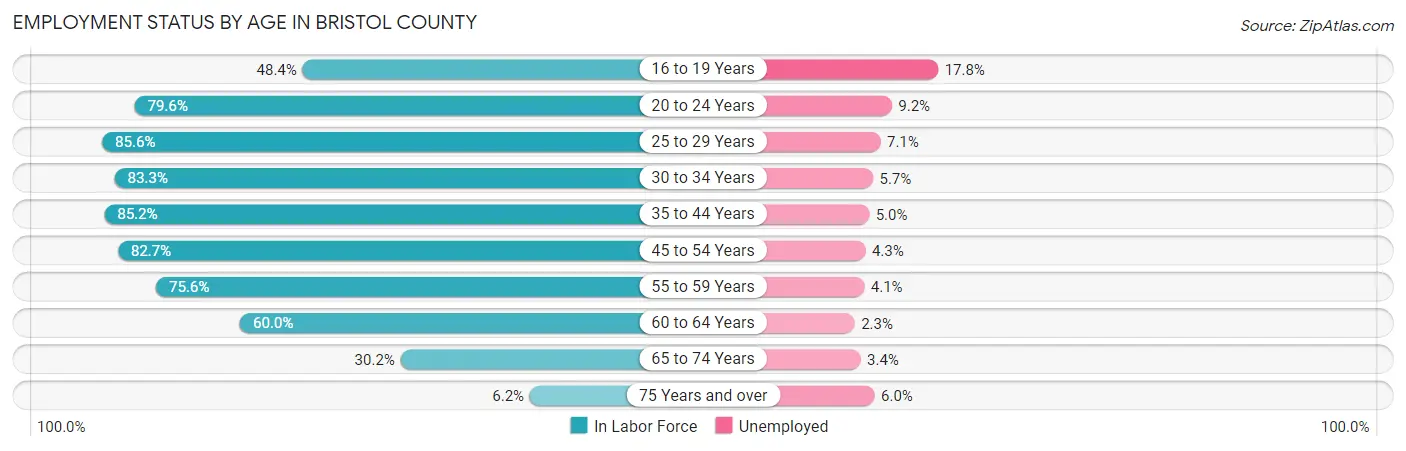
| Age Bracket | In Labor Force | Unemployed |
| 16 to 19 Years | 14,074 (48.4%) | 2,505 (17.8%) |
| 20 to 24 Years | 29,044 (79.6%) | 2,672 (9.2%) |
| 25 to 29 Years | 31,207 (85.6%) | 2,216 (7.1%) |
| 30 to 34 Years | 31,588 (83.3%) | 1,801 (5.7%) |
| 35 to 44 Years | 61,663 (85.2%) | 3,083 (5.0%) |
| 45 to 54 Years | 65,218 (82.7%) | 2,804 (4.3%) |
| 55 to 59 Years | 31,583 (75.6%) | 1,295 (4.1%) |
| 60 to 64 Years | 24,265 (60.0%) | 558 (2.3%) |
| 65 to 74 Years | 17,534 (30.2%) | 596 (3.4%) |
| 75 Years and over | 2,565 (6.2%) | 154 (6.0%) |
| Total | 308,753 (65.3%) | 17,599 (5.7%) |
Employment Status by Educational Attainment in Bristol County
According to labor force statistics for Bristol County, 79.7% of individuals (245,341) out of the total population between 25 and 64 years of age (307,830) are in the labor force, with 4.8% or 11,776 of them being unemployed. The group with the highest labor force participation rate are those with the educational attainment of bachelor's degree or higher, with 89.6% or 86,608 individuals in the labor force. Within the labor force, individuals with less than high school education have the highest percentage of unemployment, with 8.9% or 1,832 of them being unemployed.
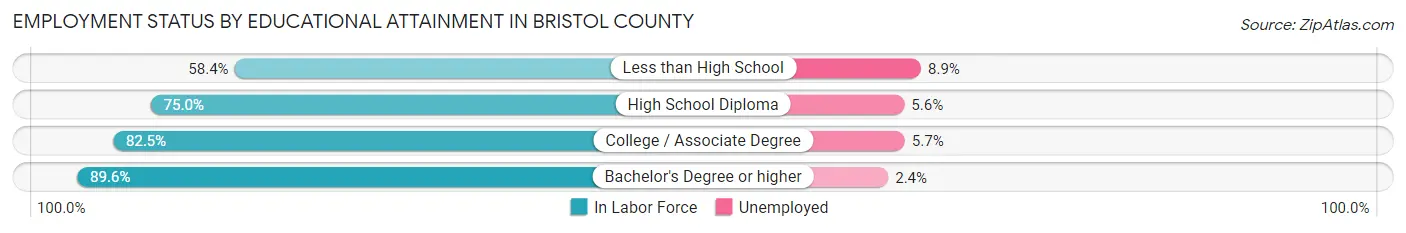
| Educational Attainment | In Labor Force | Unemployed |
| Less than High School | 20,582 (58.4%) | 3,137 (8.9%) |
| High School Diploma | 68,807 (75.0%) | 5,138 (5.6%) |
| College / Associate Degree | 69,451 (82.5%) | 4,798 (5.7%) |
| Bachelor's Degree or higher | 86,608 (89.6%) | 2,320 (2.4%) |
| Total | 245,341 (79.7%) | 14,776 (4.8%) |
Employment Occupations by Sex in Bristol County
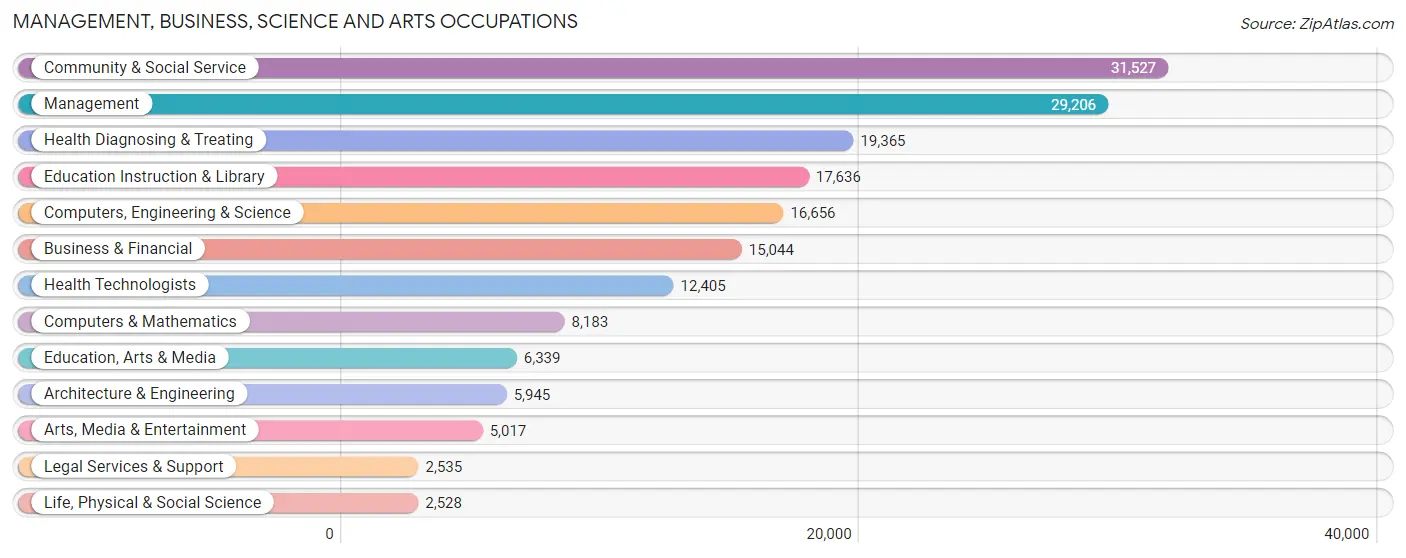
Management, Business, Science and Arts Occupations
The most common Management, Business, Science and Arts occupations in Bristol County are Community & Social Service (31,527 | 10.8%), Management (29,206 | 10.0%), Health Diagnosing & Treating (19,365 | 6.7%), Education Instruction & Library (17,636 | 6.1%), and Computers, Engineering & Science (16,656 | 5.7%).
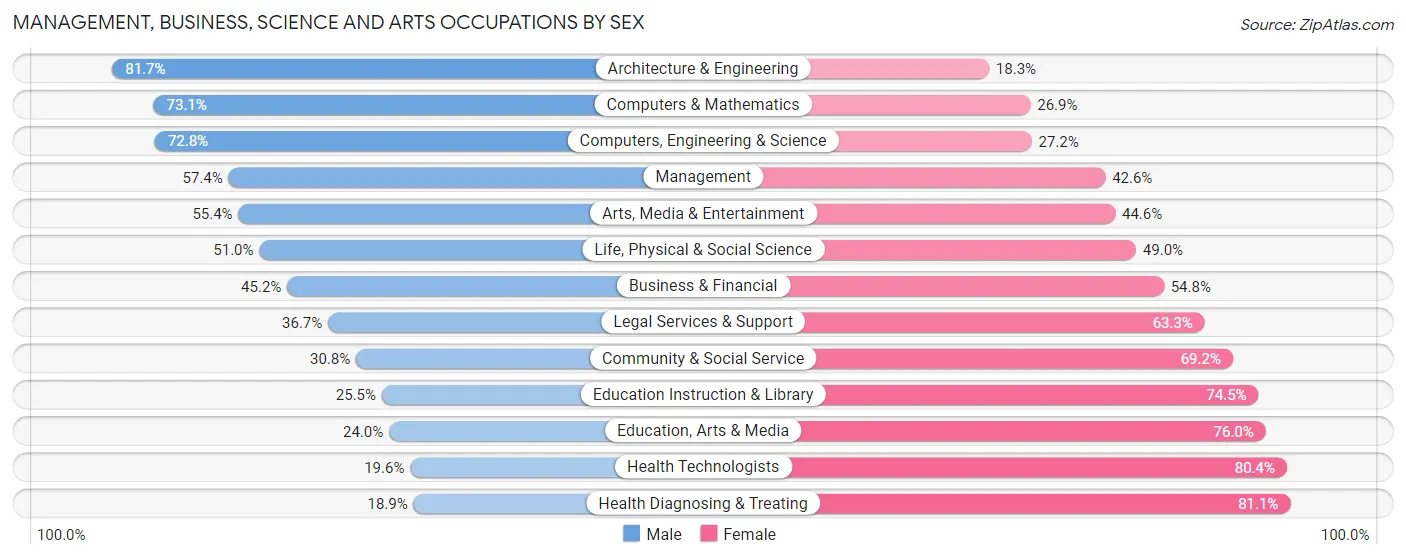
Management, Business, Science and Arts Occupations by Sex
Within the Management, Business, Science and Arts occupations in Bristol County, the most male-oriented occupations are Architecture & Engineering (81.7%), Computers & Mathematics (73.1%), and Computers, Engineering & Science (72.8%), while the most female-oriented occupations are Health Diagnosing & Treating (81.1%), Health Technologists (80.4%), and Education, Arts & Media (76.0%).
| Occupation | Male | Female |
| Management | 16,777 (57.4%) | 12,429 (42.6%) |
| Business & Financial | 6,805 (45.2%) | 8,239 (54.8%) |
| Computers, Engineering & Science | 12,126 (72.8%) | 4,530 (27.2%) |
| Computers & Mathematics | 5,979 (73.1%) | 2,204 (26.9%) |
| Architecture & Engineering | 4,857 (81.7%) | 1,088 (18.3%) |
| Life, Physical & Social Science | 1,290 (51.0%) | 1,238 (49.0%) |
| Community & Social Service | 9,722 (30.8%) | 21,805 (69.2%) |
| Education, Arts & Media | 1,520 (24.0%) | 4,819 (76.0%) |
| Legal Services & Support | 930 (36.7%) | 1,605 (63.3%) |
| Education Instruction & Library | 4,493 (25.5%) | 13,143 (74.5%) |
| Arts, Media & Entertainment | 2,779 (55.4%) | 2,238 (44.6%) |
| Health Diagnosing & Treating | 3,652 (18.9%) | 15,713 (81.1%) |
| Health Technologists | 2,427 (19.6%) | 9,978 (80.4%) |
| Total (Category) | 49,082 (43.9%) | 62,716 (56.1%) |
| Total (Overall) | 148,809 (51.2%) | 142,045 (48.8%) |
Services Occupations
The most common Services occupations in Bristol County are Food Preparation & Serving (14,165 | 4.9%), Healthcare Support (13,053 | 4.5%), Cleaning & Maintenance (9,002 | 3.1%), Personal Care & Service (8,417 | 2.9%), and Security & Protection (6,889 | 2.4%).

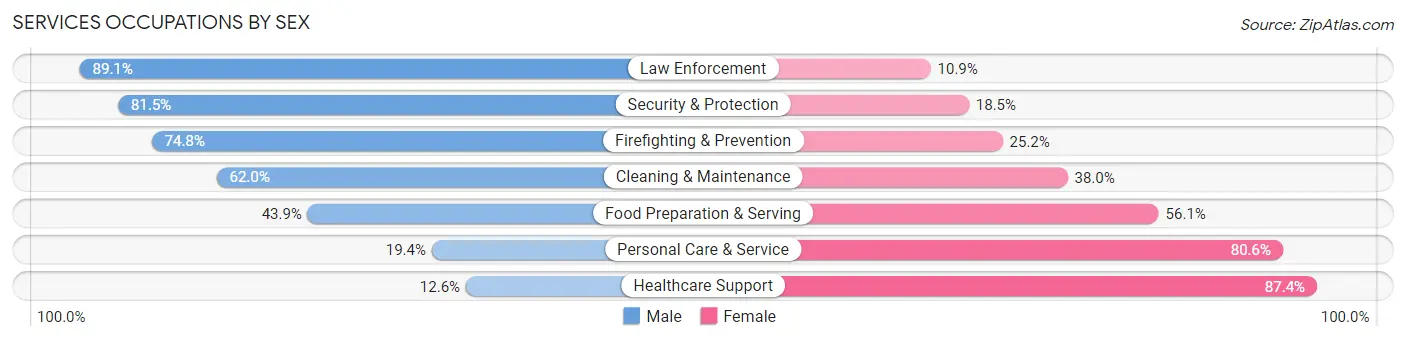
Services Occupations by Sex
Within the Services occupations in Bristol County, the most male-oriented occupations are Law Enforcement (89.1%), Security & Protection (81.5%), and Firefighting & Prevention (74.8%), while the most female-oriented occupations are Healthcare Support (87.4%), Personal Care & Service (80.6%), and Food Preparation & Serving (56.1%).
| Occupation | Male | Female |
| Healthcare Support | 1,646 (12.6%) | 11,407 (87.4%) |
| Security & Protection | 5,616 (81.5%) | 1,273 (18.5%) |
| Firefighting & Prevention | 2,740 (74.8%) | 921 (25.2%) |
| Law Enforcement | 2,876 (89.1%) | 352 (10.9%) |
| Food Preparation & Serving | 6,224 (43.9%) | 7,941 (56.1%) |
| Cleaning & Maintenance | 5,579 (62.0%) | 3,423 (38.0%) |
| Personal Care & Service | 1,630 (19.4%) | 6,787 (80.6%) |
| Total (Category) | 20,695 (40.2%) | 30,831 (59.8%) |
| Total (Overall) | 148,809 (51.2%) | 142,045 (48.8%) |
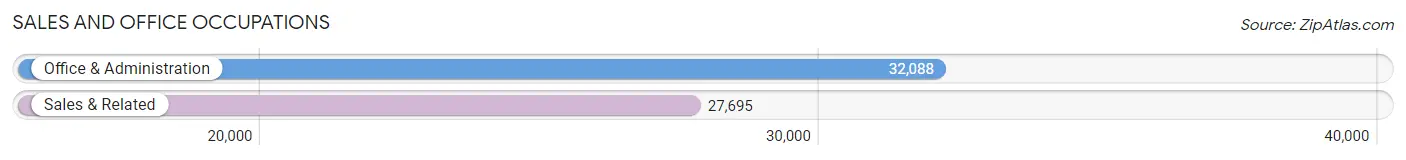
Sales and Office Occupations
The most common Sales and Office occupations in Bristol County are Office & Administration (32,088 | 11.0%), and Sales & Related (27,695 | 9.5%).
Sales and Office Occupations by Sex
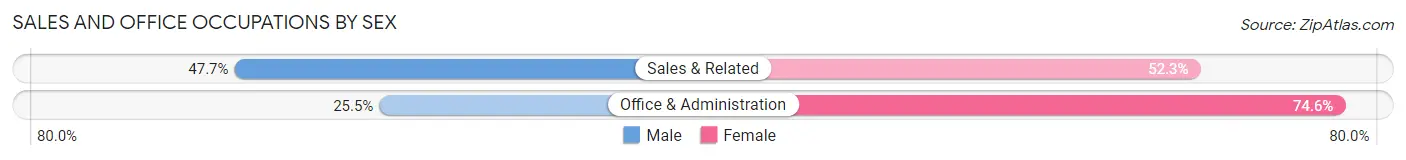
| Occupation | Male | Female |
| Sales & Related | 13,219 (47.7%) | 14,476 (52.3%) |
| Office & Administration | 8,165 (25.5%) | 23,923 (74.6%) |
| Total (Category) | 21,384 (35.8%) | 38,399 (64.2%) |
| Total (Overall) | 148,809 (51.2%) | 142,045 (48.8%) |
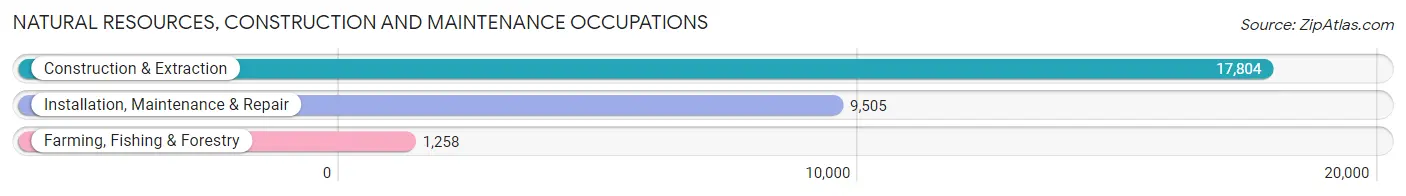
Natural Resources, Construction and Maintenance Occupations
The most common Natural Resources, Construction and Maintenance occupations in Bristol County are Construction & Extraction (17,804 | 6.1%), Installation, Maintenance & Repair (9,505 | 3.3%), and Farming, Fishing & Forestry (1,258 | 0.4%).
Natural Resources, Construction and Maintenance Occupations by Sex
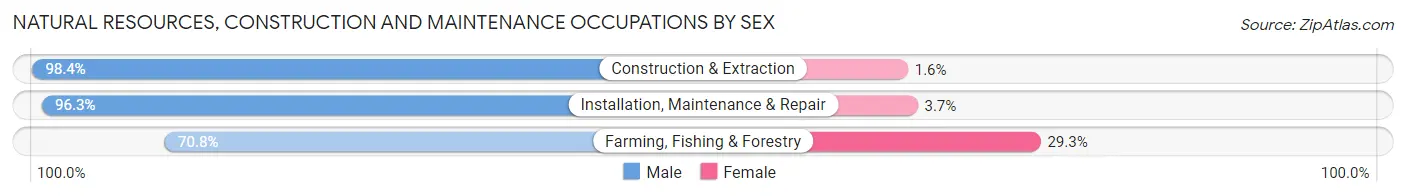
| Occupation | Male | Female |
| Farming, Fishing & Forestry | 890 (70.8%) | 368 (29.2%) |
| Construction & Extraction | 17,512 (98.4%) | 292 (1.6%) |
| Installation, Maintenance & Repair | 9,157 (96.3%) | 348 (3.7%) |
| Total (Category) | 27,559 (96.5%) | 1,008 (3.5%) |
| Total (Overall) | 148,809 (51.2%) | 142,045 (48.8%) |
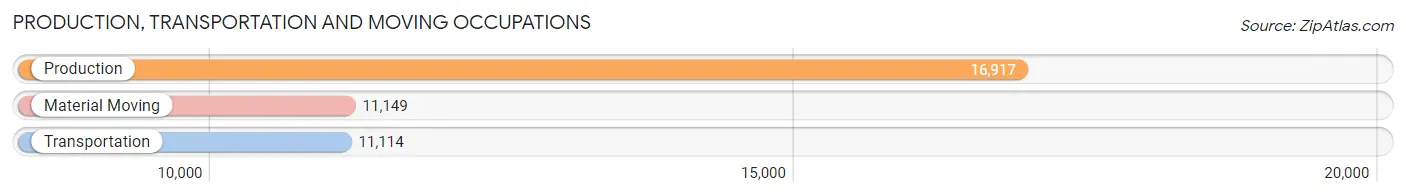
Production, Transportation and Moving Occupations
The most common Production, Transportation and Moving occupations in Bristol County are Production (16,917 | 5.8%), Material Moving (11,149 | 3.8%), and Transportation (11,114 | 3.8%).
Production, Transportation and Moving Occupations by Sex
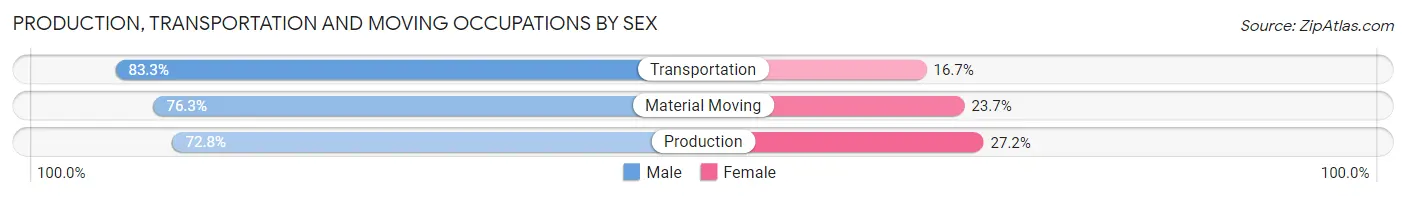
| Occupation | Male | Female |
| Production | 12,320 (72.8%) | 4,597 (27.2%) |
| Transportation | 9,258 (83.3%) | 1,856 (16.7%) |
| Material Moving | 8,511 (76.3%) | 2,638 (23.7%) |
| Total (Category) | 30,089 (76.8%) | 9,091 (23.2%) |
| Total (Overall) | 148,809 (51.2%) | 142,045 (48.8%) |
Employment Industries by Sex in Bristol County
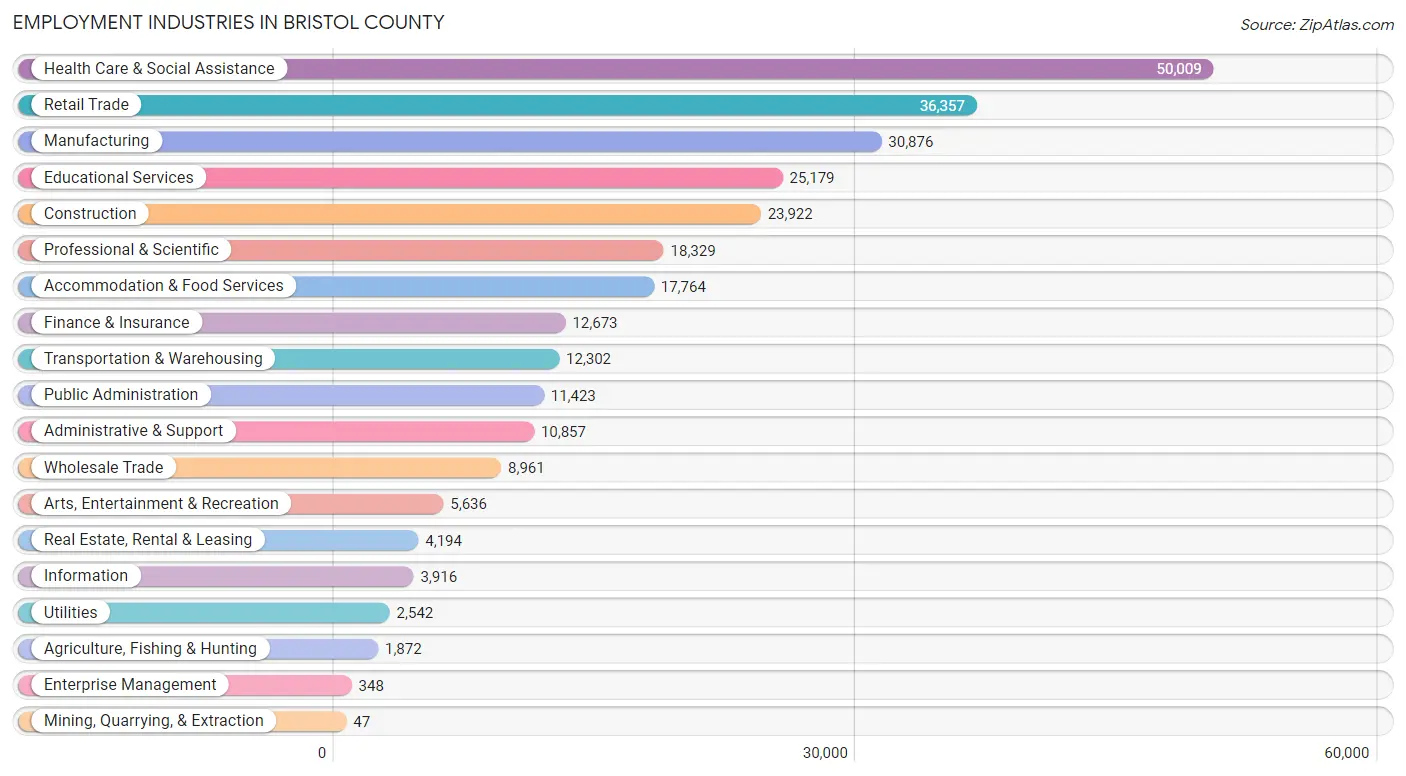
Employment Industries in Bristol County
The major employment industries in Bristol County include Health Care & Social Assistance (50,009 | 17.2%), Retail Trade (36,357 | 12.5%), Manufacturing (30,876 | 10.6%), Educational Services (25,179 | 8.7%), and Construction (23,922 | 8.2%).
Employment Industries by Sex in Bristol County
The Bristol County industries that see more men than women are Mining, Quarrying, & Extraction (100.0%), Construction (92.1%), and Utilities (76.5%), whereas the industries that tend to have a higher number of women are Health Care & Social Assistance (82.4%), Educational Services (70.4%), and Accommodation & Food Services (54.8%).
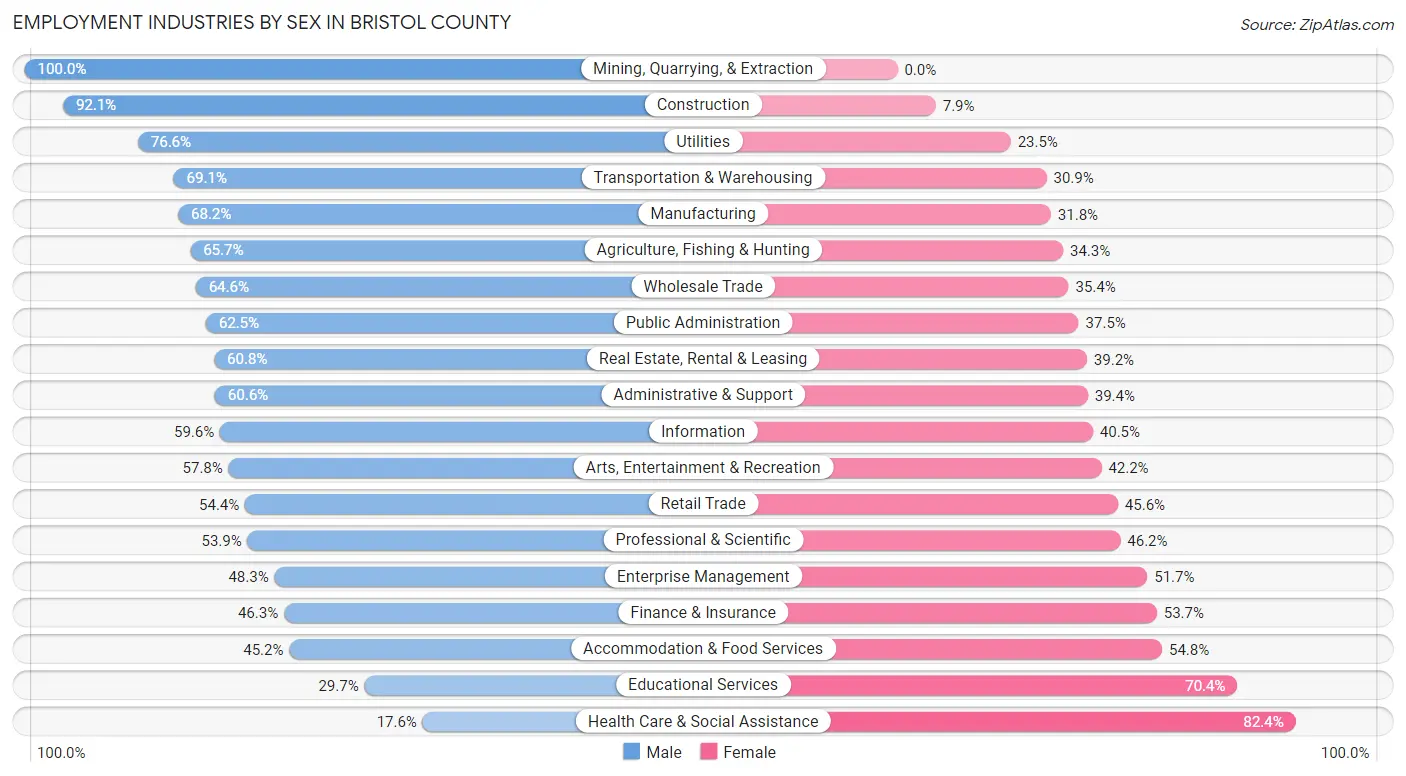
| Industry | Male | Female |
| Agriculture, Fishing & Hunting | 1,230 (65.7%) | 642 (34.3%) |
| Mining, Quarrying, & Extraction | 47 (100.0%) | 0 (0.0%) |
| Construction | 22,022 (92.1%) | 1,900 (7.9%) |
| Manufacturing | 21,068 (68.2%) | 9,808 (31.8%) |
| Wholesale Trade | 5,786 (64.6%) | 3,175 (35.4%) |
| Retail Trade | 19,765 (54.4%) | 16,592 (45.6%) |
| Transportation & Warehousing | 8,506 (69.1%) | 3,796 (30.9%) |
| Utilities | 1,946 (76.5%) | 596 (23.4%) |
| Information | 2,332 (59.6%) | 1,584 (40.5%) |
| Finance & Insurance | 5,869 (46.3%) | 6,804 (53.7%) |
| Real Estate, Rental & Leasing | 2,549 (60.8%) | 1,645 (39.2%) |
| Professional & Scientific | 9,871 (53.8%) | 8,458 (46.2%) |
| Enterprise Management | 168 (48.3%) | 180 (51.7%) |
| Administrative & Support | 6,579 (60.6%) | 4,278 (39.4%) |
| Educational Services | 7,465 (29.6%) | 17,714 (70.4%) |
| Health Care & Social Assistance | 8,801 (17.6%) | 41,208 (82.4%) |
| Arts, Entertainment & Recreation | 3,256 (57.8%) | 2,380 (42.2%) |
| Accommodation & Food Services | 8,032 (45.2%) | 9,732 (54.8%) |
| Public Administration | 7,138 (62.5%) | 4,285 (37.5%) |
| Total | 148,809 (51.2%) | 142,045 (48.8%) |
Education in Bristol County
School Enrollment in Bristol County
The most common levels of schooling among the 129,234 students in Bristol County are middle school (29,498 | 22.8%), high school (29,491 | 22.8%), and college / undergraduate (27,268 | 21.1%).
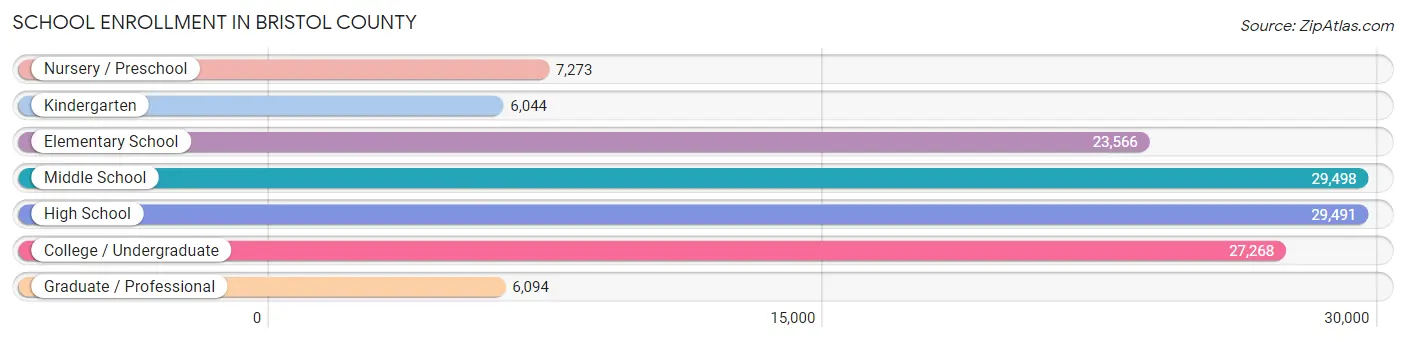
| School Level | # Students | % Students |
| Nursery / Preschool | 7,273 | 5.6% |
| Kindergarten | 6,044 | 4.7% |
| Elementary School | 23,566 | 18.2% |
| Middle School | 29,498 | 22.8% |
| High School | 29,491 | 22.8% |
| College / Undergraduate | 27,268 | 21.1% |
| Graduate / Professional | 6,094 | 4.7% |
| Total | 129,234 | 100.0% |
School Enrollment by Age by Funding Source in Bristol County
Out of a total of 129,234 students who are enrolled in schools in Bristol County, 21,841 (16.9%) attend a private institution, while the remaining 107,393 (83.1%) are enrolled in public schools. The age group of 3 to 4 year olds has the highest likelihood of being enrolled in private schools, with 2,428 (45.1% in the age bracket) enrolled. Conversely, the age group of 10 to 14 year olds has the lowest likelihood of being enrolled in a private school, with 32,527 (92.4% in the age bracket) attending a public institution.
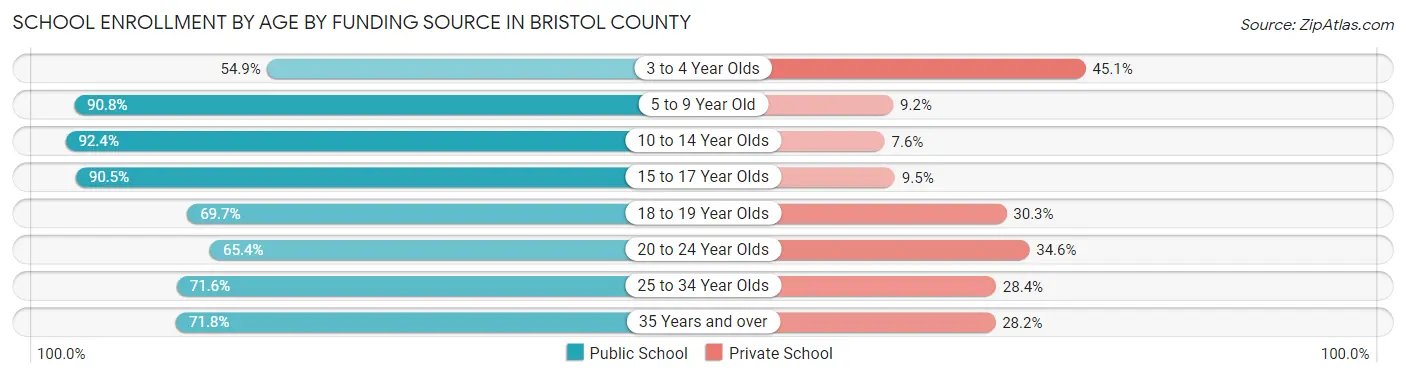
| Age Bracket | Public School | Private School |
| 3 to 4 Year Olds | 2,959 (54.9%) | 2,428 (45.1%) |
| 5 to 9 Year Old | 26,156 (90.8%) | 2,658 (9.2%) |
| 10 to 14 Year Olds | 32,527 (92.4%) | 2,682 (7.6%) |
| 15 to 17 Year Olds | 19,049 (90.5%) | 2,009 (9.5%) |
| 18 to 19 Year Olds | 7,132 (69.7%) | 3,101 (30.3%) |
| 20 to 24 Year Olds | 9,529 (65.4%) | 5,034 (34.6%) |
| 25 to 34 Year Olds | 5,509 (71.6%) | 2,181 (28.4%) |
| 35 Years and over | 4,507 (71.8%) | 1,773 (28.2%) |
| Total | 107,393 (83.1%) | 21,841 (16.9%) |
Educational Attainment by Field of Study in Bristol County
Business (25,146 | 19.3%), education (15,285 | 11.7%), science & technology (14,861 | 11.4%), social sciences (11,205 | 8.6%), and engineering (9,404 | 7.2%) are the most common fields of study among 130,613 individuals in Bristol County who have obtained a bachelor's degree or higher.
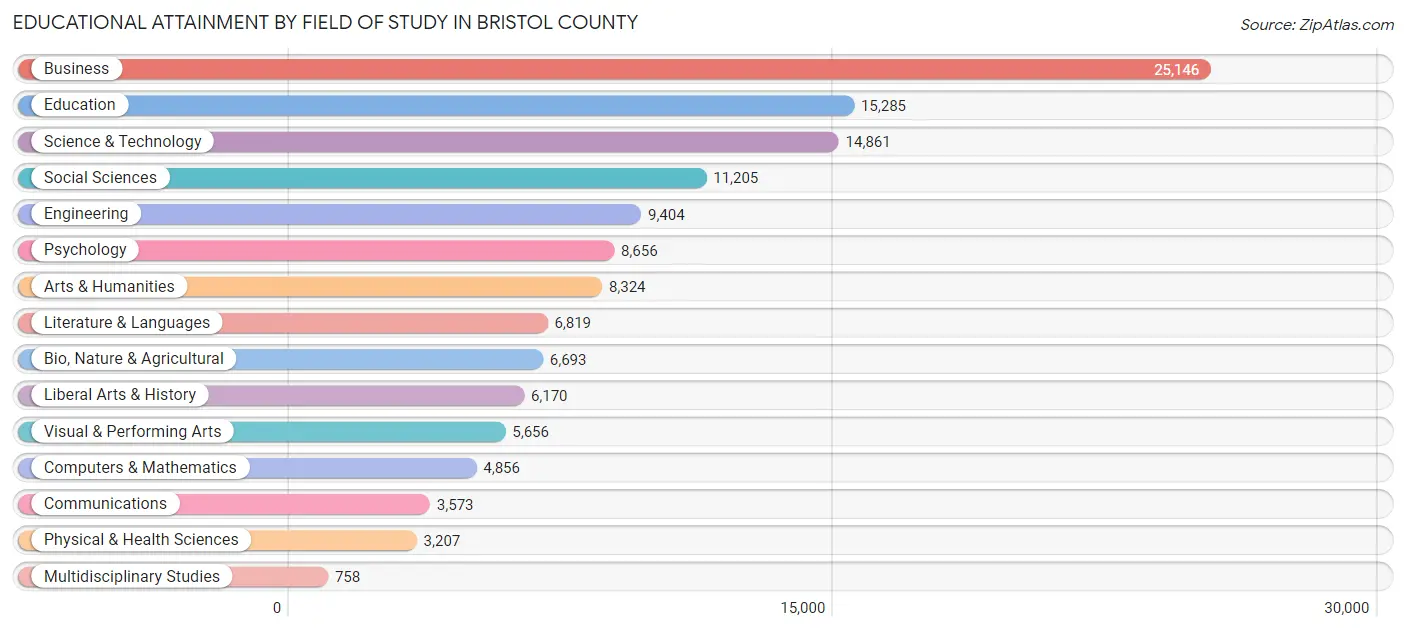
| Field of Study | # Graduates | % Graduates |
| Computers & Mathematics | 4,856 | 3.7% |
| Bio, Nature & Agricultural | 6,693 | 5.1% |
| Physical & Health Sciences | 3,207 | 2.5% |
| Psychology | 8,656 | 6.6% |
| Social Sciences | 11,205 | 8.6% |
| Engineering | 9,404 | 7.2% |
| Multidisciplinary Studies | 758 | 0.6% |
| Science & Technology | 14,861 | 11.4% |
| Business | 25,146 | 19.3% |
| Education | 15,285 | 11.7% |
| Literature & Languages | 6,819 | 5.2% |
| Liberal Arts & History | 6,170 | 4.7% |
| Visual & Performing Arts | 5,656 | 4.3% |
| Communications | 3,573 | 2.7% |
| Arts & Humanities | 8,324 | 6.4% |
| Total | 130,613 | 100.0% |
Transportation & Commute in Bristol County
Vehicle Availability by Sex in Bristol County
The most prevalent vehicle ownership categories in Bristol County are males with 2 vehicles (60,579, accounting for 41.7%) and females with 2 vehicles (56,522, making up 44.1%).
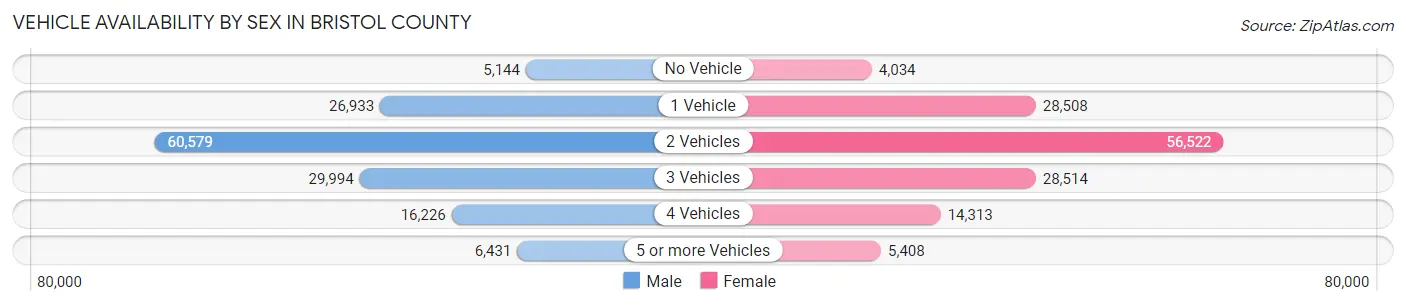
| Vehicles Available | Male | Female |
| No Vehicle | 5,144 (3.5%) | 4,034 (2.9%) |
| 1 Vehicle | 26,933 (18.5%) | 28,508 (20.8%) |
| 2 Vehicles | 60,579 (41.7%) | 56,522 (41.2%) |
| 3 Vehicles | 29,994 (20.6%) | 28,514 (20.8%) |
| 4 Vehicles | 16,226 (11.2%) | 14,313 (10.4%) |
| 5 or more Vehicles | 6,431 (4.4%) | 5,408 (3.9%) |
| Total | 145,307 (100.0%) | 137,299 (100.0%) |
Commute Time in Bristol County
The most frequently occuring commute durations in Bristol County are 15 to 19 minutes (39,379 commuters, 15.1%), 10 to 14 minutes (37,744 commuters, 14.5%), and 20 to 24 minutes (32,732 commuters, 12.6%).
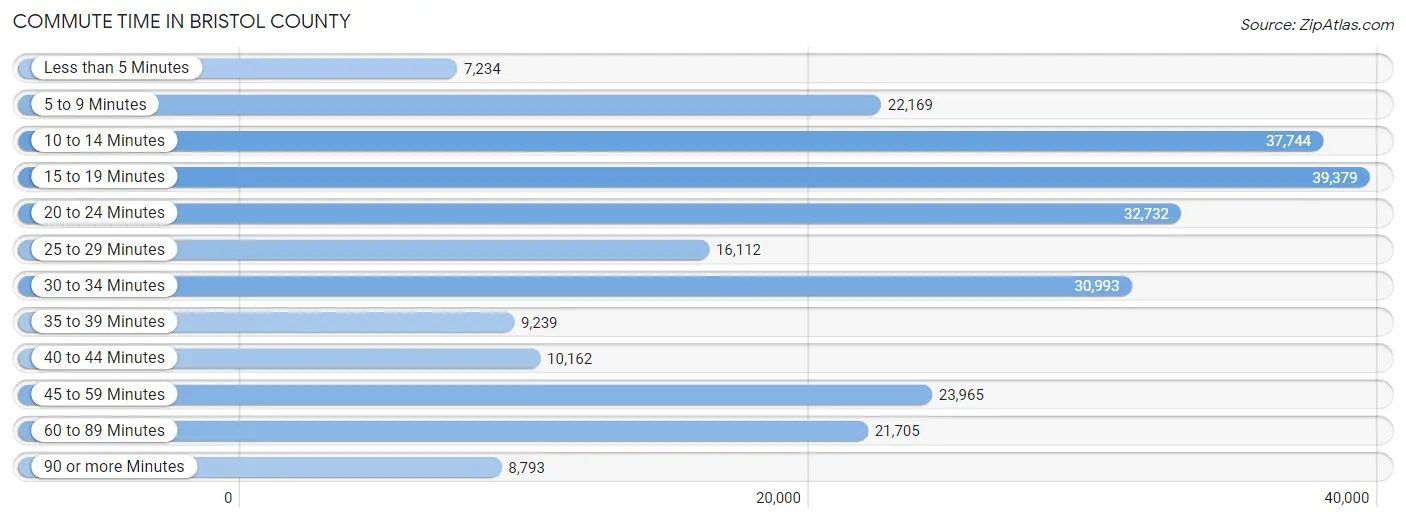
| Commute Time | # Commuters | % Commuters |
| Less than 5 Minutes | 7,234 | 2.8% |
| 5 to 9 Minutes | 22,169 | 8.5% |
| 10 to 14 Minutes | 37,744 | 14.5% |
| 15 to 19 Minutes | 39,379 | 15.1% |
| 20 to 24 Minutes | 32,732 | 12.6% |
| 25 to 29 Minutes | 16,112 | 6.2% |
| 30 to 34 Minutes | 30,993 | 11.9% |
| 35 to 39 Minutes | 9,239 | 3.5% |
| 40 to 44 Minutes | 10,162 | 3.9% |
| 45 to 59 Minutes | 23,965 | 9.2% |
| 60 to 89 Minutes | 21,705 | 8.3% |
| 90 or more Minutes | 8,793 | 3.4% |
Commute Time by Sex in Bristol County
The most common commute times in Bristol County are 15 to 19 minutes (18,279 commuters, 13.6%) for males and 15 to 19 minutes (21,100 commuters, 16.8%) for females.
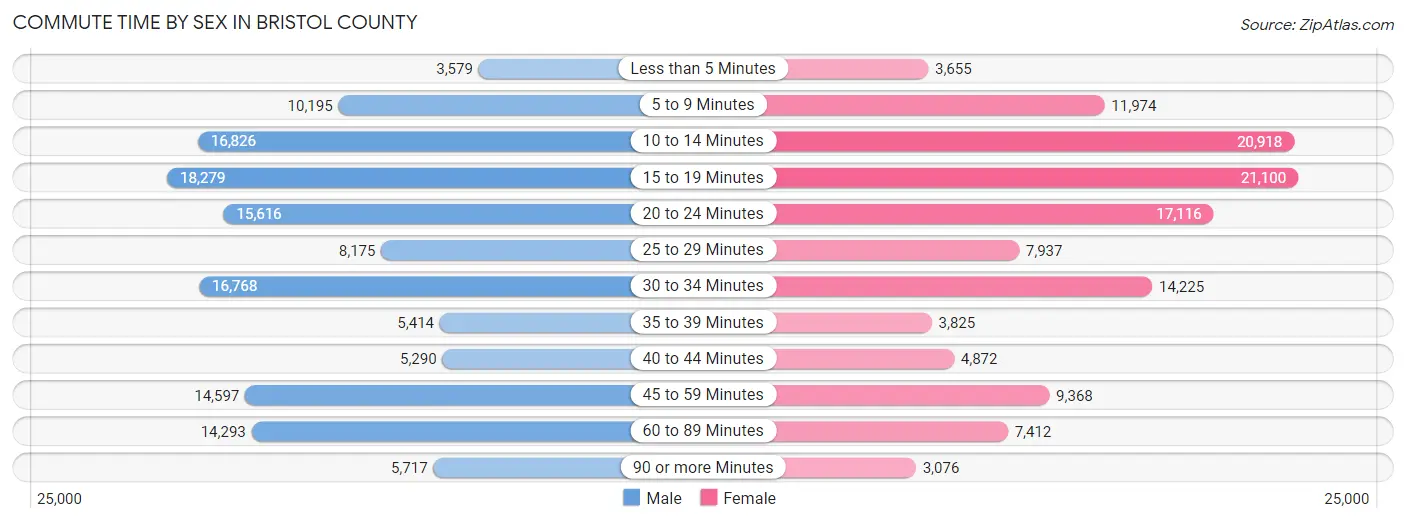
| Commute Time | Male | Female |
| Less than 5 Minutes | 3,579 (2.7%) | 3,655 (2.9%) |
| 5 to 9 Minutes | 10,195 (7.6%) | 11,974 (9.5%) |
| 10 to 14 Minutes | 16,826 (12.5%) | 20,918 (16.7%) |
| 15 to 19 Minutes | 18,279 (13.6%) | 21,100 (16.8%) |
| 20 to 24 Minutes | 15,616 (11.6%) | 17,116 (13.6%) |
| 25 to 29 Minutes | 8,175 (6.1%) | 7,937 (6.3%) |
| 30 to 34 Minutes | 16,768 (12.4%) | 14,225 (11.3%) |
| 35 to 39 Minutes | 5,414 (4.0%) | 3,825 (3.0%) |
| 40 to 44 Minutes | 5,290 (3.9%) | 4,872 (3.9%) |
| 45 to 59 Minutes | 14,597 (10.8%) | 9,368 (7.5%) |
| 60 to 89 Minutes | 14,293 (10.6%) | 7,412 (5.9%) |
| 90 or more Minutes | 5,717 (4.2%) | 3,076 (2.5%) |
Time of Departure to Work by Sex in Bristol County
The most frequent times of departure to work in Bristol County are 7:00 AM to 7:29 AM (18,842, 14.0%) for males and 7:00 AM to 7:29 AM (18,251, 14.5%) for females.
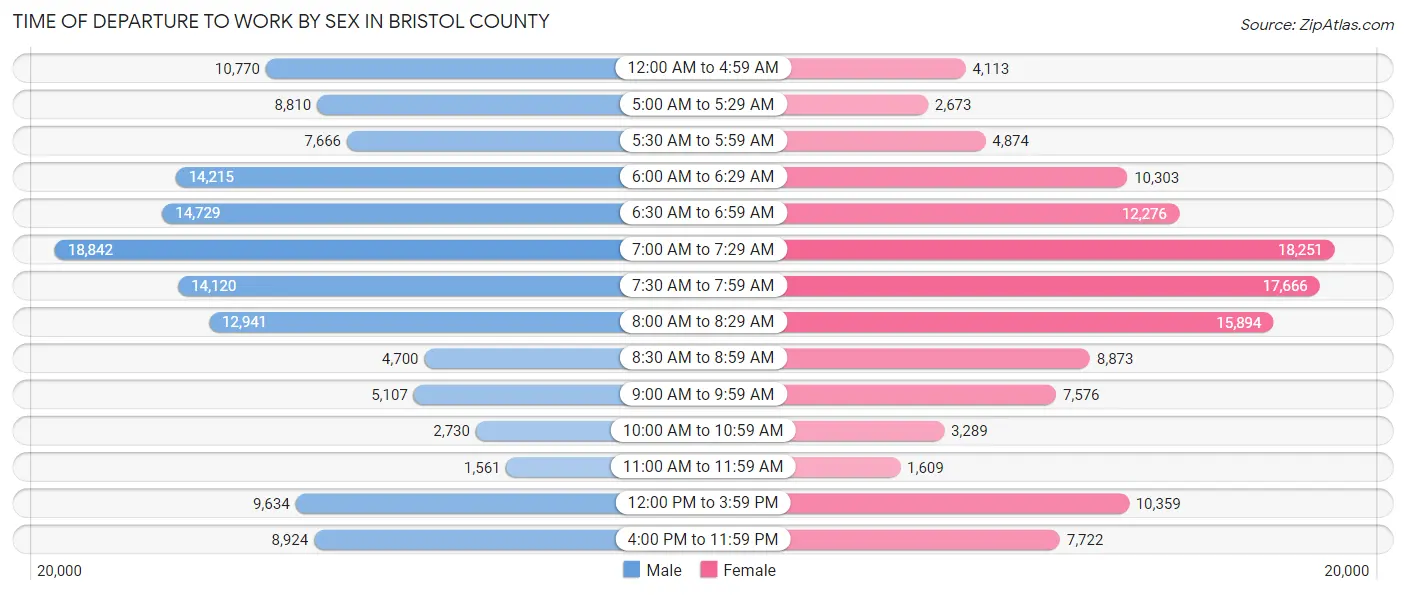
| Time of Departure | Male | Female |
| 12:00 AM to 4:59 AM | 10,770 (8.0%) | 4,113 (3.3%) |
| 5:00 AM to 5:29 AM | 8,810 (6.5%) | 2,673 (2.1%) |
| 5:30 AM to 5:59 AM | 7,666 (5.7%) | 4,874 (3.9%) |
| 6:00 AM to 6:29 AM | 14,215 (10.5%) | 10,303 (8.2%) |
| 6:30 AM to 6:59 AM | 14,729 (10.9%) | 12,276 (9.8%) |
| 7:00 AM to 7:29 AM | 18,842 (14.0%) | 18,251 (14.5%) |
| 7:30 AM to 7:59 AM | 14,120 (10.5%) | 17,666 (14.1%) |
| 8:00 AM to 8:29 AM | 12,941 (9.6%) | 15,894 (12.7%) |
| 8:30 AM to 8:59 AM | 4,700 (3.5%) | 8,873 (7.1%) |
| 9:00 AM to 9:59 AM | 5,107 (3.8%) | 7,576 (6.0%) |
| 10:00 AM to 10:59 AM | 2,730 (2.0%) | 3,289 (2.6%) |
| 11:00 AM to 11:59 AM | 1,561 (1.2%) | 1,609 (1.3%) |
| 12:00 PM to 3:59 PM | 9,634 (7.1%) | 10,359 (8.3%) |
| 4:00 PM to 11:59 PM | 8,924 (6.6%) | 7,722 (6.1%) |
| Total | 134,749 (100.0%) | 125,478 (100.0%) |
Housing Occupancy in Bristol County
Occupancy by Ownership in Bristol County
Of the total 229,861 dwellings in Bristol County, owner-occupied units account for 142,186 (61.9%), while renter-occupied units make up 87,675 (38.1%).
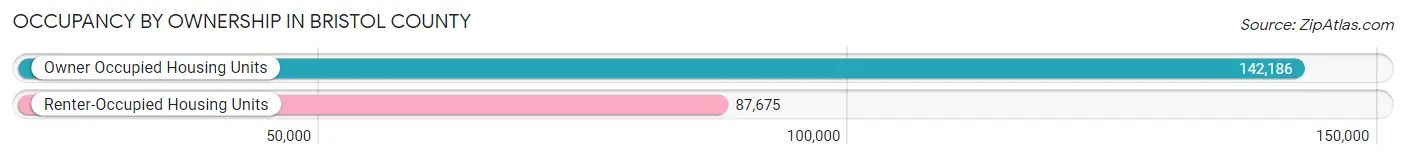
| Occupancy | # Housing Units | % Housing Units |
| Owner Occupied Housing Units | 142,186 | 61.9% |
| Renter-Occupied Housing Units | 87,675 | 38.1% |
| Total Occupied Housing Units | 229,861 | 100.0% |
Occupancy by Household Size in Bristol County
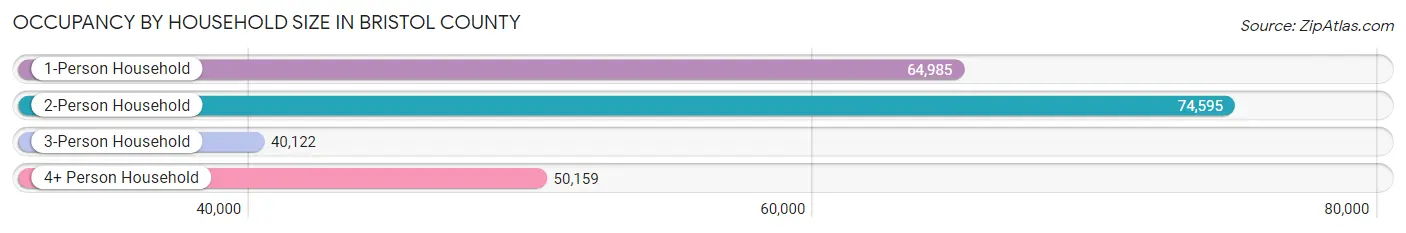
| Household Size | # Housing Units | % Housing Units |
| 1-Person Household | 64,985 | 28.3% |
| 2-Person Household | 74,595 | 32.5% |
| 3-Person Household | 40,122 | 17.4% |
| 4+ Person Household | 50,159 | 21.8% |
| Total Housing Units | 229,861 | 100.0% |
Occupancy by Ownership by Household Size in Bristol County
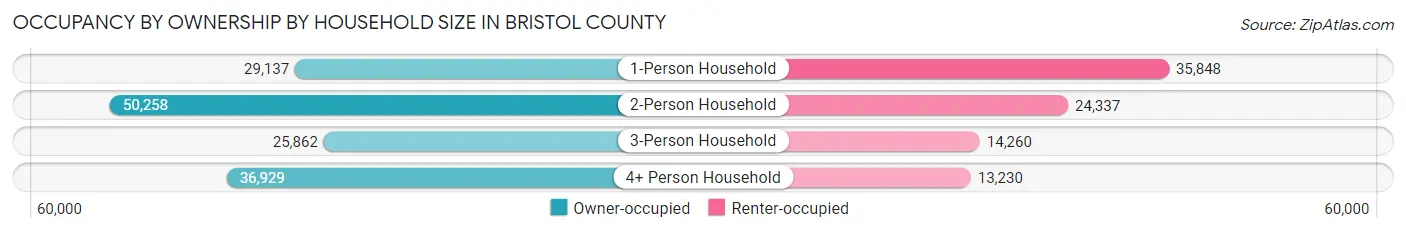
| Household Size | Owner-occupied | Renter-occupied |
| 1-Person Household | 29,137 (44.8%) | 35,848 (55.2%) |
| 2-Person Household | 50,258 (67.4%) | 24,337 (32.6%) |
| 3-Person Household | 25,862 (64.5%) | 14,260 (35.5%) |
| 4+ Person Household | 36,929 (73.6%) | 13,230 (26.4%) |
| Total Housing Units | 142,186 (61.9%) | 87,675 (38.1%) |
Occupancy by Educational Attainment in Bristol County
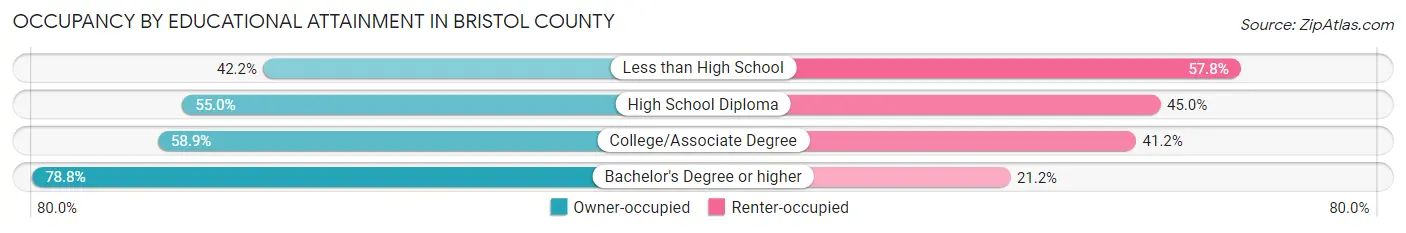
| Household Size | Owner-occupied | Renter-occupied |
| Less than High School | 12,631 (42.2%) | 17,288 (57.8%) |
| High School Diploma | 34,949 (55.0%) | 28,617 (45.0%) |
| College/Associate Degree | 37,904 (58.9%) | 26,499 (41.1%) |
| Bachelor's Degree or higher | 56,702 (78.8%) | 15,271 (21.2%) |
Occupancy by Age of Householder in Bristol County
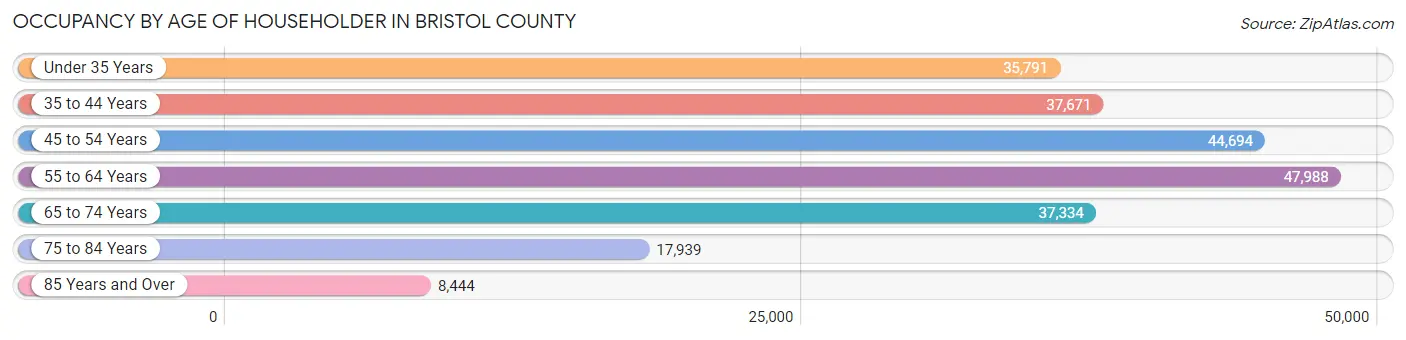
| Age Bracket | # Households | % Households |
| Under 35 Years | 35,791 | 15.6% |
| 35 to 44 Years | 37,671 | 16.4% |
| 45 to 54 Years | 44,694 | 19.4% |
| 55 to 64 Years | 47,988 | 20.9% |
| 65 to 74 Years | 37,334 | 16.2% |
| 75 to 84 Years | 17,939 | 7.8% |
| 85 Years and Over | 8,444 | 3.7% |
| Total | 229,861 | 100.0% |
Housing Finances in Bristol County
Median Income by Occupancy in Bristol County
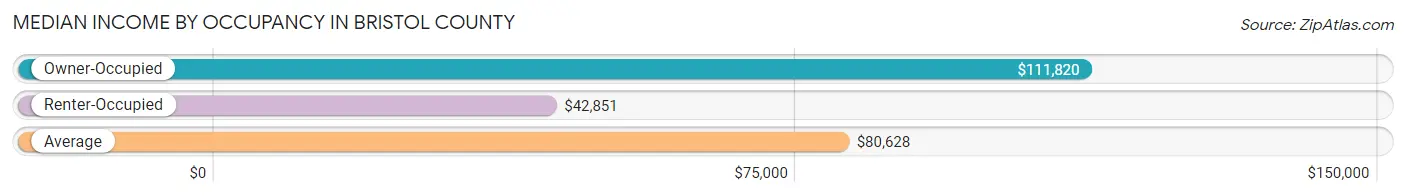
| Occupancy Type | # Households | Median Income |
| Owner-Occupied | 142,186 (61.9%) | $111,820 |
| Renter-Occupied | 87,675 (38.1%) | $42,851 |
| Average | 229,861 (100.0%) | $80,628 |
Occupancy by Householder Income Bracket in Bristol County
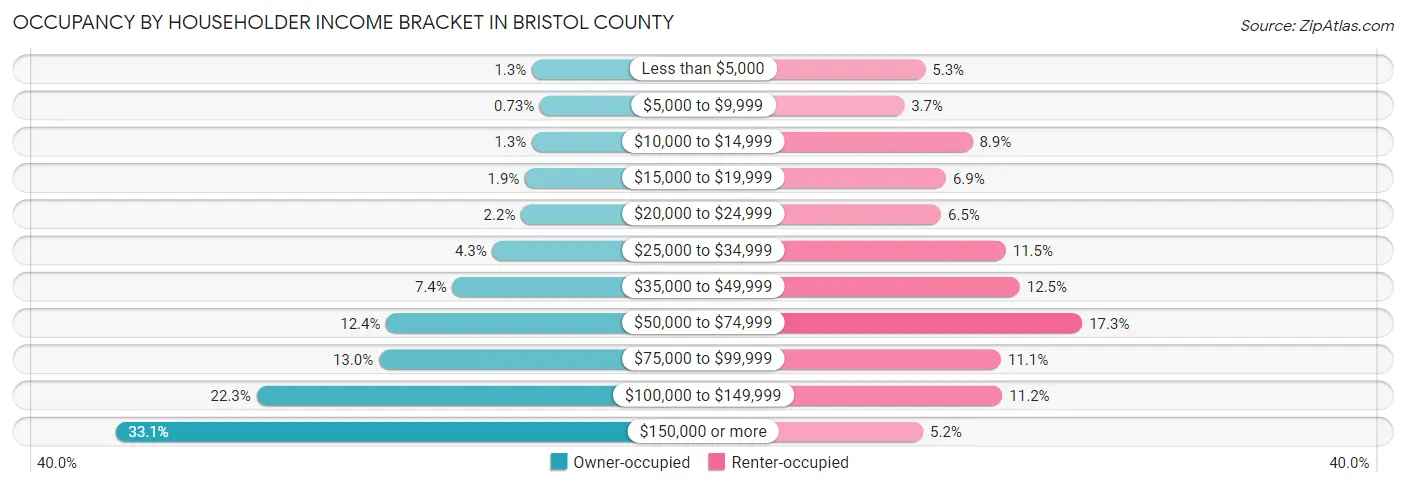
| Income Bracket | Owner-occupied | Renter-occupied |
| Less than $5,000 | 1,907 (1.3%) | 4,667 (5.3%) |
| $5,000 to $9,999 | 1,037 (0.7%) | 3,254 (3.7%) |
| $10,000 to $14,999 | 1,904 (1.3%) | 7,815 (8.9%) |
| $15,000 to $19,999 | 2,646 (1.9%) | 6,041 (6.9%) |
| $20,000 to $24,999 | 3,069 (2.2%) | 5,713 (6.5%) |
| $25,000 to $34,999 | 6,166 (4.3%) | 10,038 (11.5%) |
| $35,000 to $49,999 | 10,501 (7.4%) | 10,974 (12.5%) |
| $50,000 to $74,999 | 17,684 (12.4%) | 15,139 (17.3%) |
| $75,000 to $99,999 | 18,484 (13.0%) | 9,712 (11.1%) |
| $100,000 to $149,999 | 31,754 (22.3%) | 9,807 (11.2%) |
| $150,000 or more | 47,034 (33.1%) | 4,515 (5.1%) |
| Total | 142,186 (100.0%) | 87,675 (100.0%) |
Monthly Housing Cost Tiers in Bristol County
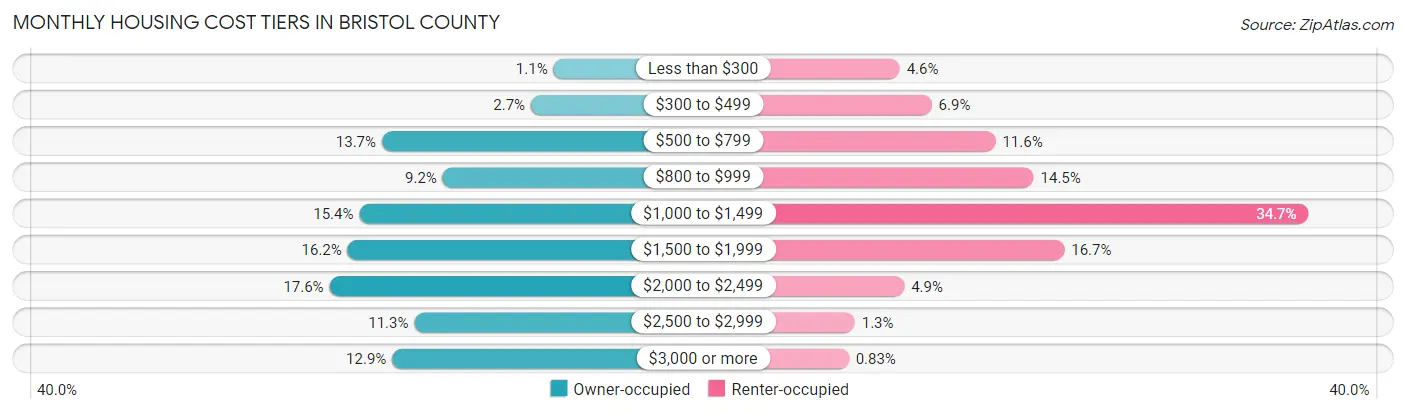
| Monthly Cost | Owner-occupied | Renter-occupied |
| Less than $300 | 1,496 (1.1%) | 4,023 (4.6%) |
| $300 to $499 | 3,851 (2.7%) | 6,082 (6.9%) |
| $500 to $799 | 19,464 (13.7%) | 10,209 (11.6%) |
| $800 to $999 | 13,092 (9.2%) | 12,665 (14.4%) |
| $1,000 to $1,499 | 21,830 (15.3%) | 30,410 (34.7%) |
| $1,500 to $1,999 | 23,045 (16.2%) | 14,648 (16.7%) |
| $2,000 to $2,499 | 24,959 (17.5%) | 4,316 (4.9%) |
| $2,500 to $2,999 | 16,069 (11.3%) | 1,124 (1.3%) |
| $3,000 or more | 18,380 (12.9%) | 726 (0.8%) |
| Total | 142,186 (100.0%) | 87,675 (100.0%) |
Physical Housing Characteristics in Bristol County
Housing Structures in Bristol County
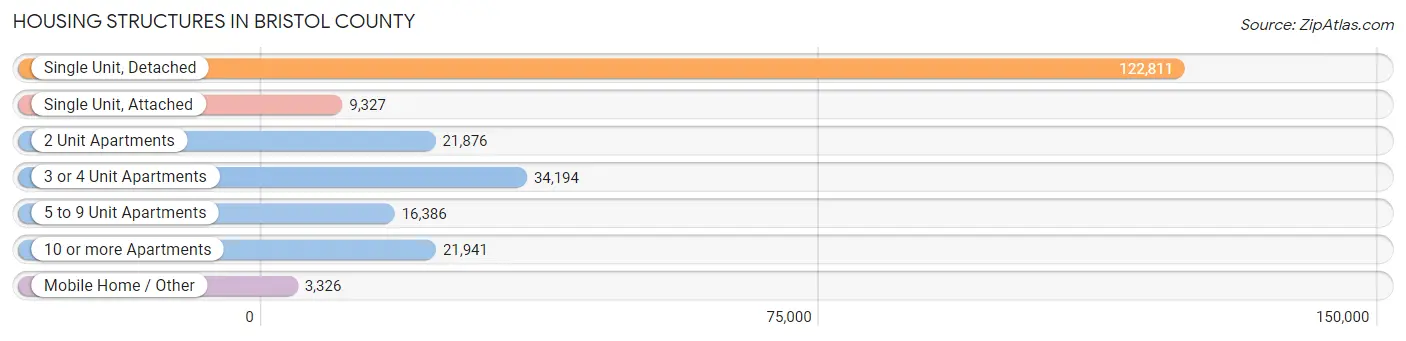
| Structure Type | # Housing Units | % Housing Units |
| Single Unit, Detached | 122,811 | 53.4% |
| Single Unit, Attached | 9,327 | 4.1% |
| 2 Unit Apartments | 21,876 | 9.5% |
| 3 or 4 Unit Apartments | 34,194 | 14.9% |
| 5 to 9 Unit Apartments | 16,386 | 7.1% |
| 10 or more Apartments | 21,941 | 9.6% |
| Mobile Home / Other | 3,326 | 1.5% |
| Total | 229,861 | 100.0% |
Housing Structures by Occupancy in Bristol County
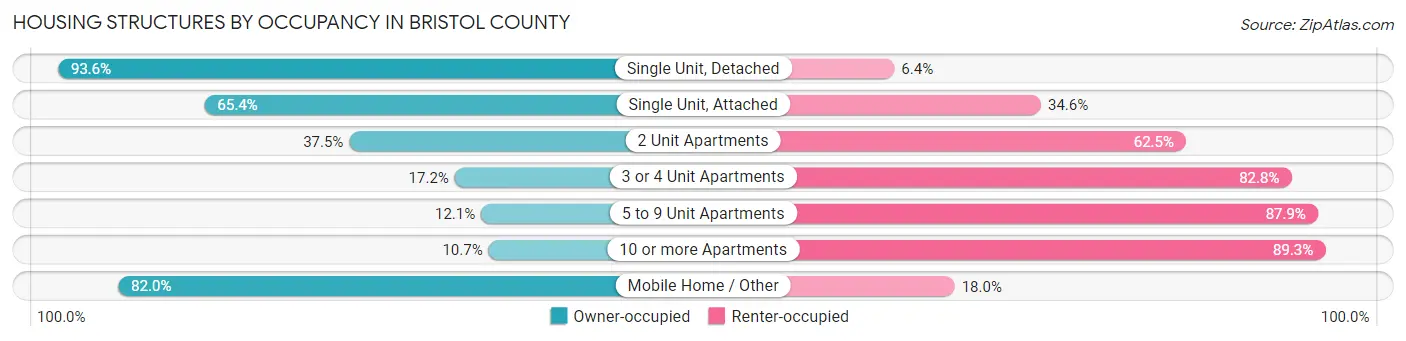
| Structure Type | Owner-occupied | Renter-occupied |
| Single Unit, Detached | 114,950 (93.6%) | 7,861 (6.4%) |
| Single Unit, Attached | 6,097 (65.4%) | 3,230 (34.6%) |
| 2 Unit Apartments | 8,204 (37.5%) | 13,672 (62.5%) |
| 3 or 4 Unit Apartments | 5,880 (17.2%) | 28,314 (82.8%) |
| 5 to 9 Unit Apartments | 1,984 (12.1%) | 14,402 (87.9%) |
| 10 or more Apartments | 2,344 (10.7%) | 19,597 (89.3%) |
| Mobile Home / Other | 2,727 (82.0%) | 599 (18.0%) |
| Total | 142,186 (61.9%) | 87,675 (38.1%) |
Housing Structures by Number of Rooms in Bristol County
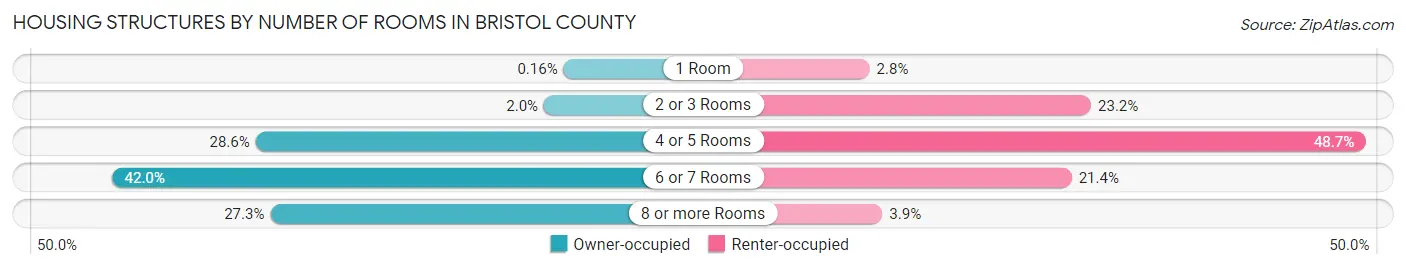
| Number of Rooms | Owner-occupied | Renter-occupied |
| 1 Room | 233 (0.2%) | 2,412 (2.8%) |
| 2 or 3 Rooms | 2,801 (2.0%) | 20,371 (23.2%) |
| 4 or 5 Rooms | 40,719 (28.6%) | 42,655 (48.6%) |
| 6 or 7 Rooms | 59,645 (41.9%) | 18,795 (21.4%) |
| 8 or more Rooms | 38,788 (27.3%) | 3,442 (3.9%) |
| Total | 142,186 (100.0%) | 87,675 (100.0%) |
Housing Structure by Heating Type in Bristol County
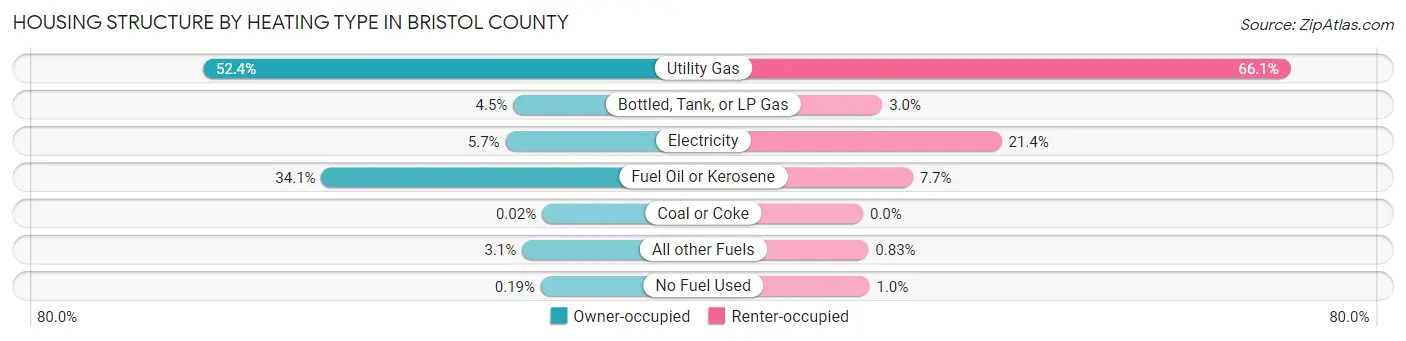
| Heating Type | Owner-occupied | Renter-occupied |
| Utility Gas | 74,567 (52.4%) | 57,940 (66.1%) |
| Bottled, Tank, or LP Gas | 6,349 (4.5%) | 2,604 (3.0%) |
| Electricity | 8,063 (5.7%) | 18,782 (21.4%) |
| Fuel Oil or Kerosene | 48,512 (34.1%) | 6,740 (7.7%) |
| Coal or Coke | 30 (0.0%) | 0 (0.0%) |
| All other Fuels | 4,399 (3.1%) | 730 (0.8%) |
| No Fuel Used | 266 (0.2%) | 879 (1.0%) |
| Total | 142,186 (100.0%) | 87,675 (100.0%) |
Household Vehicle Usage in Bristol County
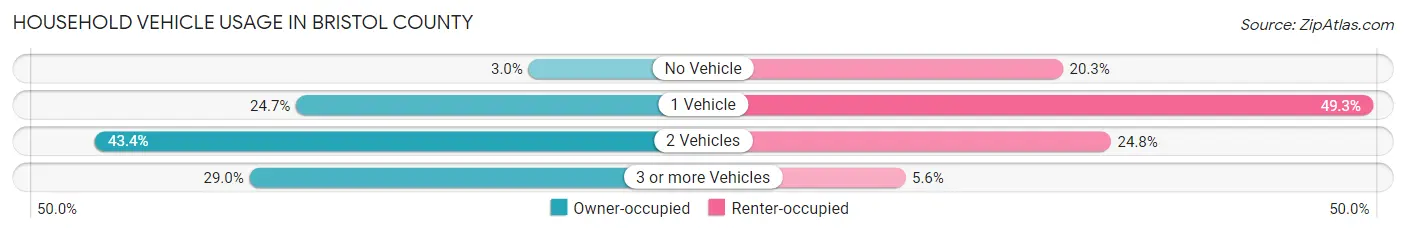
| Vehicles per Household | Owner-occupied | Renter-occupied |
| No Vehicle | 4,191 (2.9%) | 17,814 (20.3%) |
| 1 Vehicle | 35,046 (24.6%) | 43,201 (49.3%) |
| 2 Vehicles | 61,719 (43.4%) | 21,742 (24.8%) |
| 3 or more Vehicles | 41,230 (29.0%) | 4,918 (5.6%) |
| Total | 142,186 (100.0%) | 87,675 (100.0%) |
Real Estate & Mortgages in Bristol County
Real Estate and Mortgage Overview in Bristol County
| Characteristic | Without Mortgage | With Mortgage |
| Housing Units | 48,568 | 93,618 |
| Median Property Value | $362,000 | $397,000 |
| Median Household Income | $77,005 | $37,228 |
| Monthly Housing Costs | $816 | $18,230 |
| Real Estate Taxes | $4,481 | $1,513 |
Property Value by Mortgage Status in Bristol County
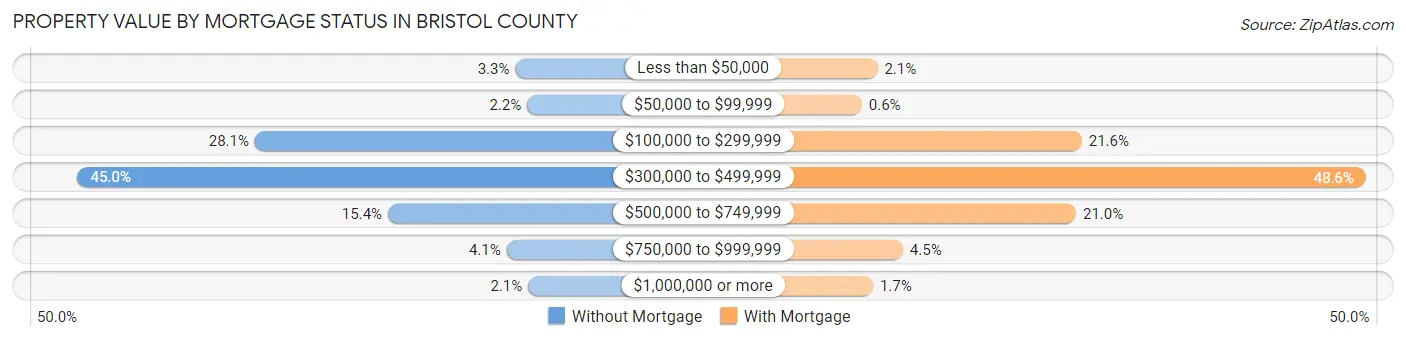
| Property Value | Without Mortgage | With Mortgage |
| Less than $50,000 | 1,589 (3.3%) | 1,956 (2.1%) |
| $50,000 to $99,999 | 1,042 (2.1%) | 558 (0.6%) |
| $100,000 to $299,999 | 13,637 (28.1%) | 20,172 (21.5%) |
| $300,000 to $499,999 | 21,831 (45.0%) | 45,497 (48.6%) |
| $500,000 to $749,999 | 7,479 (15.4%) | 19,659 (21.0%) |
| $750,000 to $999,999 | 1,993 (4.1%) | 4,223 (4.5%) |
| $1,000,000 or more | 997 (2.1%) | 1,553 (1.7%) |
| Total | 48,568 (100.0%) | 93,618 (100.0%) |
Household Income by Mortgage Status in Bristol County
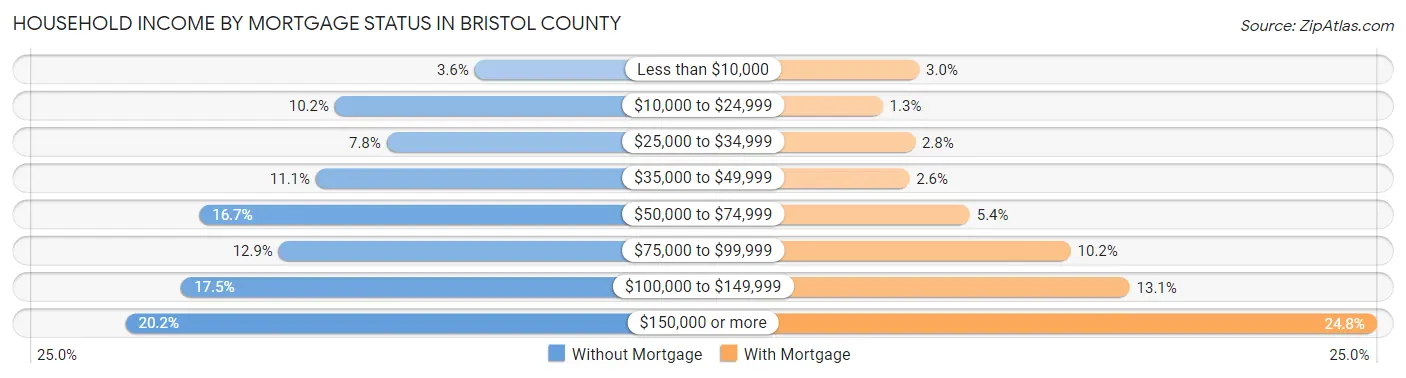
| Household Income | Without Mortgage | With Mortgage |
| Less than $10,000 | 1,734 (3.6%) | 2,833 (3.0%) |
| $10,000 to $24,999 | 4,968 (10.2%) | 1,210 (1.3%) |
| $25,000 to $34,999 | 3,768 (7.8%) | 2,651 (2.8%) |
| $35,000 to $49,999 | 5,404 (11.1%) | 2,398 (2.6%) |
| $50,000 to $74,999 | 8,102 (16.7%) | 5,097 (5.4%) |
| $75,000 to $99,999 | 6,267 (12.9%) | 9,582 (10.2%) |
| $100,000 to $149,999 | 8,519 (17.5%) | 12,217 (13.1%) |
| $150,000 or more | 9,806 (20.2%) | 23,235 (24.8%) |
| Total | 48,568 (100.0%) | 93,618 (100.0%) |
Property Value to Household Income Ratio in Bristol County
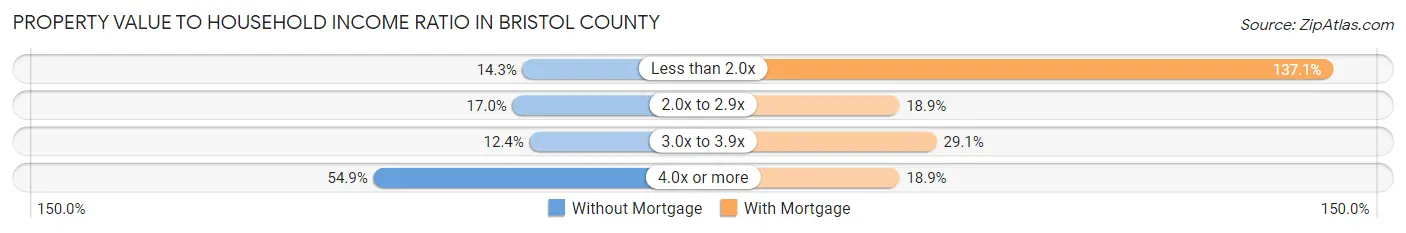
| Value-to-Income Ratio | Without Mortgage | With Mortgage |
| Less than 2.0x | 6,951 (14.3%) | 128,391 (137.1%) |
| 2.0x to 2.9x | 8,274 (17.0%) | 17,662 (18.9%) |
| 3.0x to 3.9x | 6,039 (12.4%) | 27,213 (29.1%) |
| 4.0x or more | 26,683 (54.9%) | 17,728 (18.9%) |
| Total | 48,568 (100.0%) | 93,618 (100.0%) |
Real Estate Taxes by Mortgage Status in Bristol County
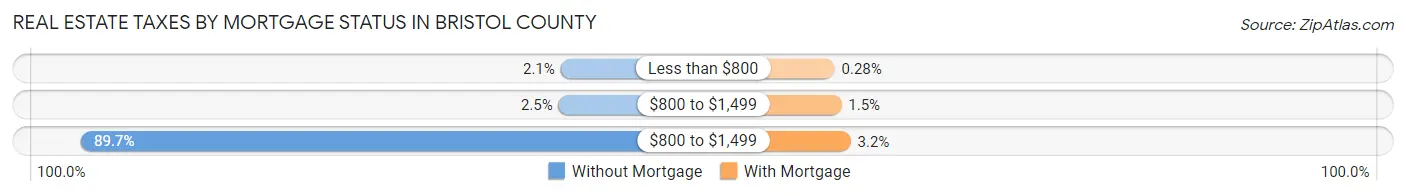
| Property Taxes | Without Mortgage | With Mortgage |
| Less than $800 | 1,019 (2.1%) | 266 (0.3%) |
| $800 to $1,499 | 1,204 (2.5%) | 1,410 (1.5%) |
| $800 to $1,499 | 43,552 (89.7%) | 2,998 (3.2%) |
| Total | 48,568 (100.0%) | 93,618 (100.0%) |
Health & Disability in Bristol County
Health Insurance Coverage by Age in Bristol County
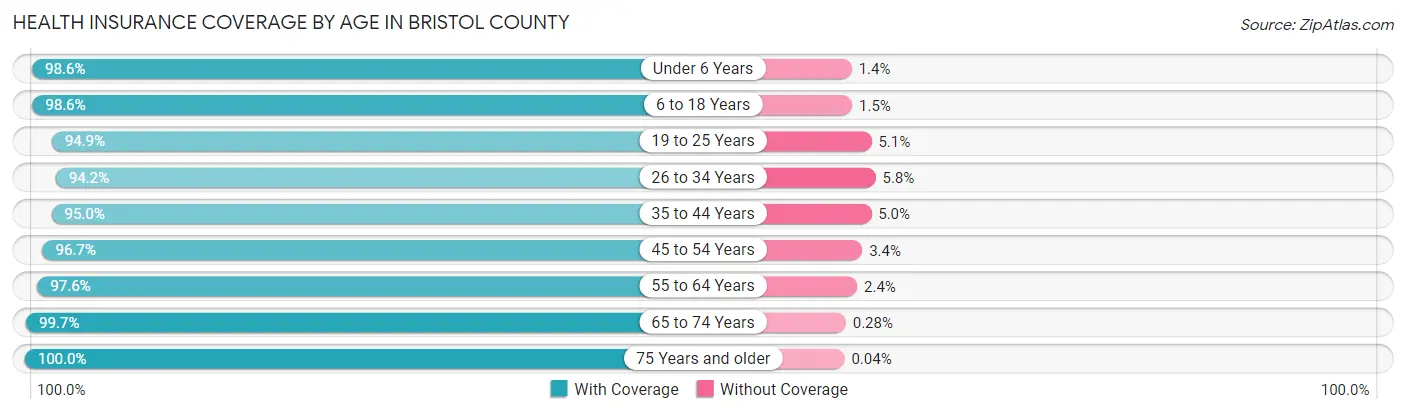
| Age Bracket | With Coverage | Without Coverage |
| Under 6 Years | 35,004 (98.6%) | 492 (1.4%) |
| 6 to 18 Years | 88,642 (98.6%) | 1,308 (1.5%) |
| 19 to 25 Years | 47,033 (94.9%) | 2,514 (5.1%) |
| 26 to 34 Years | 63,960 (94.2%) | 3,959 (5.8%) |
| 35 to 44 Years | 68,446 (95.0%) | 3,626 (5.0%) |
| 45 to 54 Years | 75,945 (96.7%) | 2,634 (3.4%) |
| 55 to 64 Years | 79,742 (97.6%) | 1,956 (2.4%) |
| 65 to 74 Years | 57,285 (99.7%) | 163 (0.3%) |
| 75 Years and older | 38,631 (100.0%) | 17 (0.0%) |
| Total | 554,688 (97.1%) | 16,669 (2.9%) |
Health Insurance Coverage by Citizenship Status in Bristol County
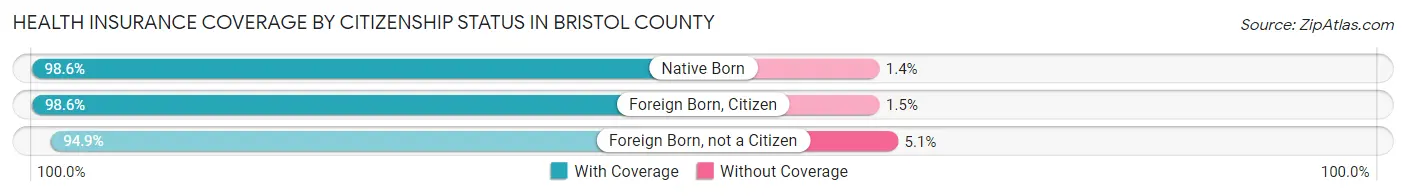
| Citizenship Status | With Coverage | Without Coverage |
| Native Born | 35,004 (98.6%) | 492 (1.4%) |
| Foreign Born, Citizen | 88,642 (98.6%) | 1,308 (1.5%) |
| Foreign Born, not a Citizen | 47,033 (94.9%) | 2,514 (5.1%) |
Health Insurance Coverage by Household Income in Bristol County
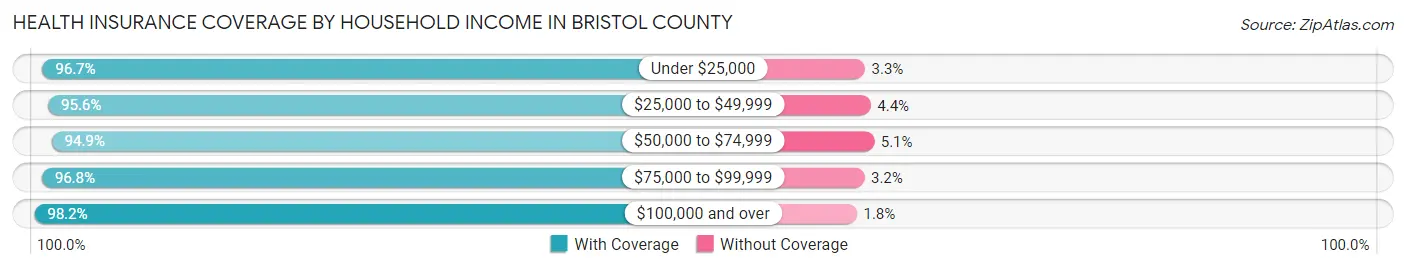
| Household Income | With Coverage | Without Coverage |
| Under $25,000 | 56,925 (96.7%) | 1,959 (3.3%) |
| $25,000 to $49,999 | 70,398 (95.6%) | 3,247 (4.4%) |
| $50,000 to $74,999 | 68,356 (94.9%) | 3,644 (5.1%) |
| $75,000 to $99,999 | 67,087 (96.8%) | 2,239 (3.2%) |
| $100,000 and over | 283,424 (98.2%) | 5,244 (1.8%) |
Public vs Private Health Insurance Coverage by Age in Bristol County
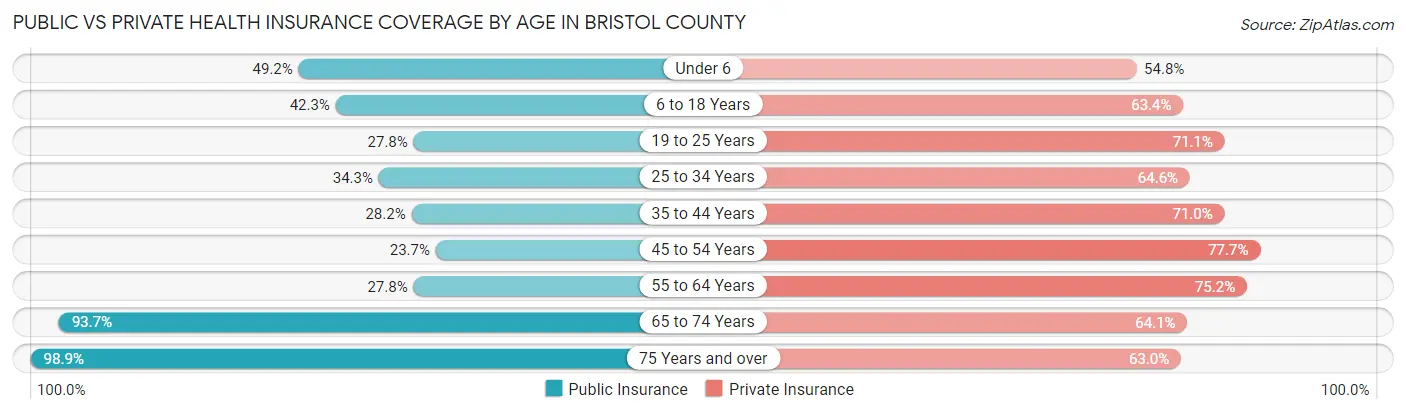
| Age Bracket | Public Insurance | Private Insurance |
| Under 6 | 17,448 (49.1%) | 19,460 (54.8%) |
| 6 to 18 Years | 38,016 (42.3%) | 57,019 (63.4%) |
| 19 to 25 Years | 13,768 (27.8%) | 35,219 (71.1%) |
| 25 to 34 Years | 23,270 (34.3%) | 43,885 (64.6%) |
| 35 to 44 Years | 20,317 (28.2%) | 51,201 (71.0%) |
| 45 to 54 Years | 18,596 (23.7%) | 61,024 (77.7%) |
| 55 to 64 Years | 22,732 (27.8%) | 61,439 (75.2%) |
| 65 to 74 Years | 53,808 (93.7%) | 36,850 (64.1%) |
| 75 Years and over | 38,211 (98.9%) | 24,331 (63.0%) |
| Total | 246,166 (43.1%) | 390,428 (68.3%) |
Disability Status by Sex by Age in Bristol County
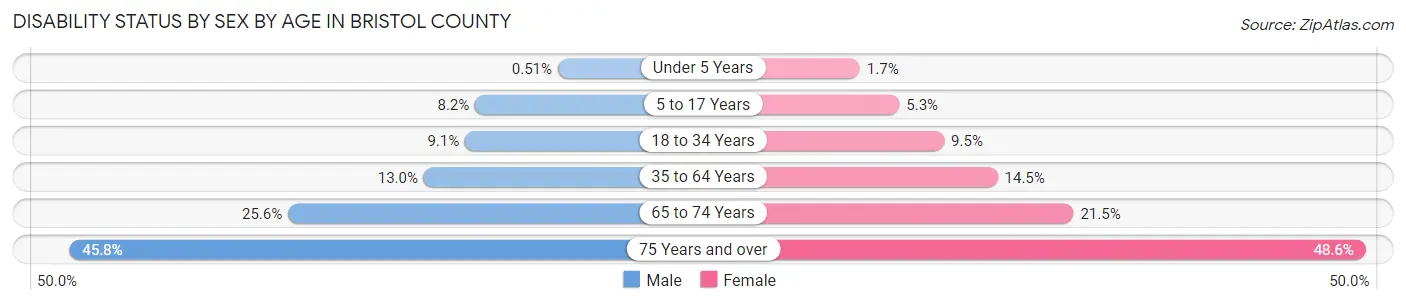
| Age Bracket | Male | Female |
| Under 5 Years | 77 (0.5%) | 242 (1.7%) |
| 5 to 17 Years | 3,706 (8.2%) | 2,331 (5.3%) |
| 18 to 34 Years | 5,706 (9.1%) | 5,896 (9.5%) |
| 35 to 64 Years | 14,774 (13.0%) | 17,099 (14.5%) |
| 65 to 74 Years | 6,876 (25.6%) | 6,566 (21.5%) |
| 75 Years and over | 7,088 (45.8%) | 11,273 (48.6%) |
Disability Class by Sex by Age in Bristol County
Disability Class: Hearing Difficulty
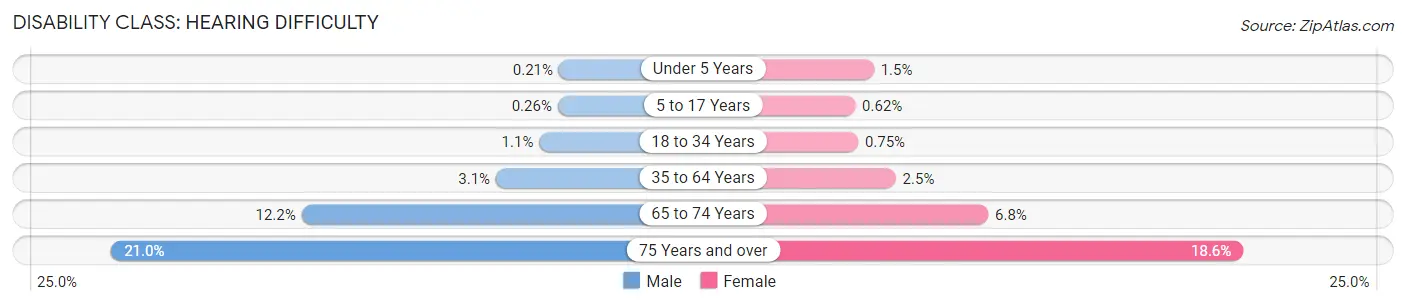
| Age Bracket | Male | Female |
| Under 5 Years | 31 (0.2%) | 213 (1.5%) |
| 5 to 17 Years | 119 (0.3%) | 269 (0.6%) |
| 18 to 34 Years | 704 (1.1%) | 468 (0.7%) |
| 35 to 64 Years | 3,567 (3.1%) | 2,959 (2.5%) |
| 65 to 74 Years | 3,268 (12.1%) | 2,073 (6.8%) |
| 75 Years and over | 3,245 (21.0%) | 4,316 (18.6%) |
Disability Class: Vision Difficulty
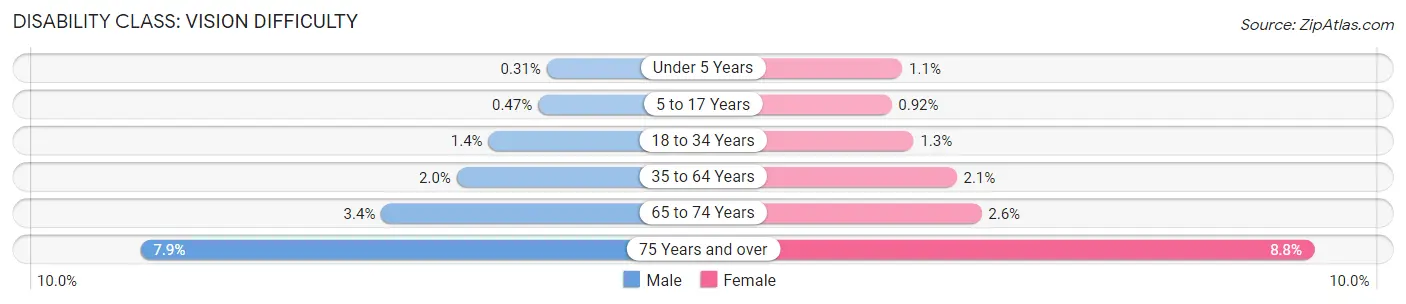
| Age Bracket | Male | Female |
| Under 5 Years | 46 (0.3%) | 161 (1.1%) |
| 5 to 17 Years | 211 (0.5%) | 400 (0.9%) |
| 18 to 34 Years | 869 (1.4%) | 827 (1.3%) |
| 35 to 64 Years | 2,262 (2.0%) | 2,519 (2.1%) |
| 65 to 74 Years | 910 (3.4%) | 792 (2.6%) |
| 75 Years and over | 1,214 (7.9%) | 2,031 (8.8%) |
Disability Class: Cognitive Difficulty
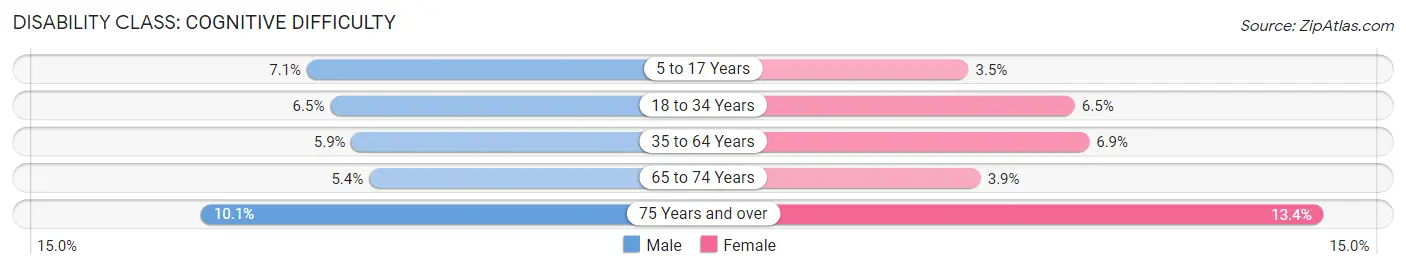
| Age Bracket | Male | Female |
| 5 to 17 Years | 3,229 (7.1%) | 1,540 (3.5%) |
| 18 to 34 Years | 4,065 (6.5%) | 4,028 (6.5%) |
| 35 to 64 Years | 6,734 (5.9%) | 8,148 (6.9%) |
| 65 to 74 Years | 1,455 (5.4%) | 1,183 (3.9%) |
| 75 Years and over | 1,560 (10.1%) | 3,110 (13.4%) |
Disability Class: Ambulatory Difficulty
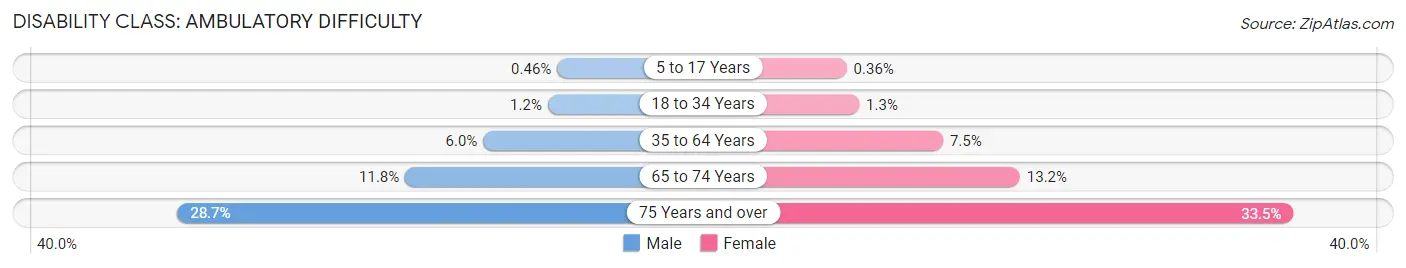
| Age Bracket | Male | Female |
| 5 to 17 Years | 206 (0.5%) | 159 (0.4%) |
| 18 to 34 Years | 728 (1.2%) | 800 (1.3%) |
| 35 to 64 Years | 6,788 (5.9%) | 8,876 (7.5%) |
| 65 to 74 Years | 3,163 (11.7%) | 4,036 (13.2%) |
| 75 Years and over | 4,432 (28.7%) | 7,771 (33.5%) |
Disability Class: Self-Care Difficulty
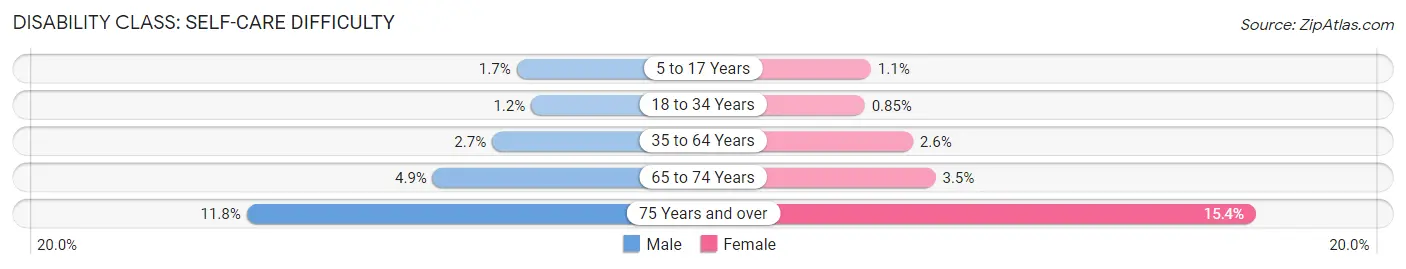
| Age Bracket | Male | Female |
| 5 to 17 Years | 786 (1.7%) | 471 (1.1%) |
| 18 to 34 Years | 754 (1.2%) | 529 (0.9%) |
| 35 to 64 Years | 3,020 (2.6%) | 3,117 (2.6%) |
| 65 to 74 Years | 1,305 (4.9%) | 1,063 (3.5%) |
| 75 Years and over | 1,819 (11.8%) | 3,563 (15.4%) |
Technology Access in Bristol County
Computing Device Access in Bristol County
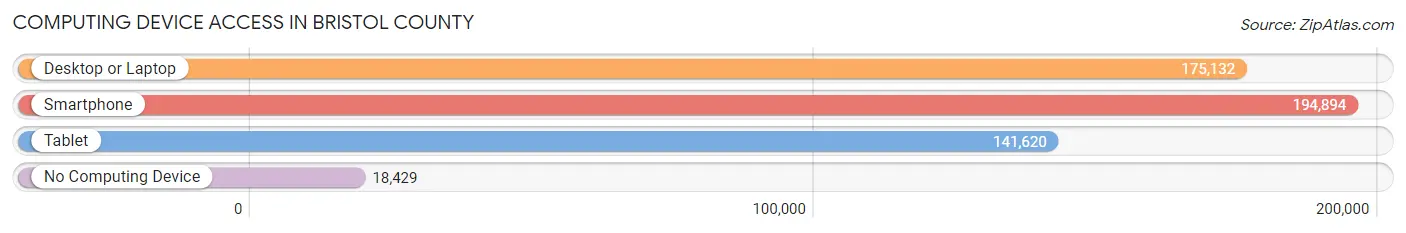
| Device Type | # Households | % Households |
| Desktop or Laptop | 175,132 | 76.2% |
| Smartphone | 194,894 | 84.8% |
| Tablet | 141,620 | 61.6% |
| No Computing Device | 18,429 | 8.0% |
| Total | 229,861 | 100.0% |
Internet Access in Bristol County
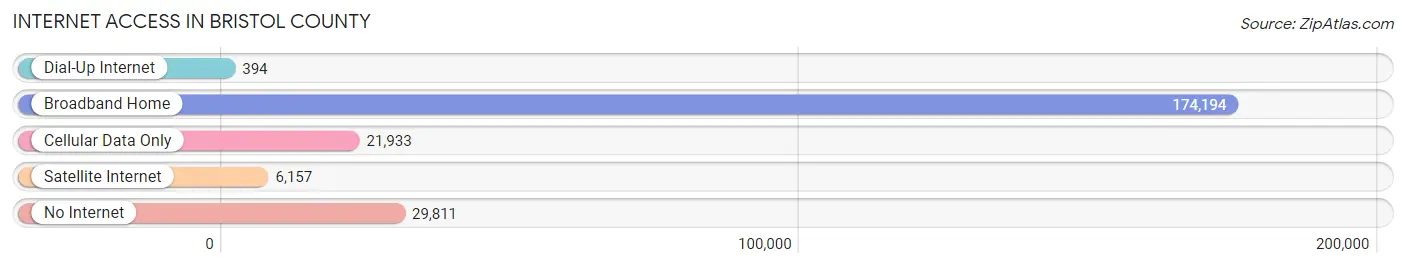
| Internet Type | # Households | % Households |
| Dial-Up Internet | 394 | 0.2% |
| Broadband Home | 174,194 | 75.8% |
| Cellular Data Only | 21,933 | 9.5% |
| Satellite Internet | 6,157 | 2.7% |
| No Internet | 29,811 | 13.0% |
| Total | 229,861 | 100.0% |
Bristol County Summary
Bristol County is a county located in the southeastern part of the Commonwealth of Massachusetts, in the United States. It is bordered by Rhode Island to the east, Plymouth County to the north, Norfolk County to the west, and the Atlantic Ocean to the south. As of the 2010 census, the population was 548,285, making it the third-most populous county in Massachusetts. The county seat is Taunton.
History
Bristol County was created by the Plymouth Colony in 1685, and was named after Bristol, England. It was originally part of Plymouth County, and was created as a separate county in 1746. The county was part of the original Plymouth Colony, and was later part of the Massachusetts Bay Colony.
The county was divided into three townships in 1685: Dartmouth, Taunton, and Rehoboth. These townships were later divided into smaller towns, and the county was further divided into Bristol, Plymouth, and Barnstable counties in 1790.
Geography
Bristol County is located in the southeastern part of Massachusetts, and is bordered by Rhode Island to the east, Plymouth County to the north, Norfolk County to the west, and the Atlantic Ocean to the south. The county has a total area of 621 square miles, of which 590 square miles is land and 31 square miles is water.
The county is divided into two distinct regions: the South Coast and the North Coast. The South Coast is characterized by its coastal plain, which is composed of low hills and marshes. The North Coast is characterized by its uplands, which are composed of rolling hills and woodlands.
Economy
Bristol County has a diverse economy, with a mix of manufacturing, service, and retail industries. The county is home to several large employers, including General Dynamics, Raytheon, and Hasbro.
The county is also home to several universities and colleges, including the University of Massachusetts Dartmouth, Bristol Community College, and Roger Williams University.
Demographics
As of the 2010 census, the population of Bristol County was 548,285, making it the third-most populous county in Massachusetts. The population density was 922 people per square mile. The racial makeup of the county was 81.3% White, 8.2% African American, 0.5% Native American, 3.2% Asian, 0.1% Pacific Islander, 4.2% from other races, and 2.7% from two or more races. Hispanic or Latino of any race were 8.7% of the population.
The median income for a household in the county was $60,879, and the median income for a family was $71,837. The per capita income for the county was $30,845. About 8.2% of families and 10.5% of the population were below the poverty line, including 14.3% of those under age 18 and 8.2% of those age 65 or over.
Common Questions
What is the Total Population of Bristol County?
Total Population of Bristol County is 576,699.
What is the Total Male Population of Bristol County?
Total Male Population of Bristol County is 281,769.
What is the Total Female Population of Bristol County?
Total Female Population of Bristol County is 294,930.
What is the Ratio of Males per 100 Females in Bristol County?
There are 95.54 Males per 100 Females in Bristol County.
What is the Ratio of Females per 100 Males in Bristol County?
There are 104.67 Females per 100 Males in Bristol County.
What is the Median Population Age in Bristol County?
Median Population Age in Bristol County is 41.0 Years.
What is the Average Family Size in Bristol County
Average Family Size in Bristol County is 3.0 People.
What is the Average Household Size in Bristol County
Average Household Size in Bristol County is 2.5 People.
What is Per Capita Income in Bristol County?
Per Capita income in Bristol County is $42,006.
What is the Median Family Income in Bristol County?
Median Family Income in Bristol County is $103,265.
What is the Median Household income in Bristol County?
Median Household Income in Bristol County is $80,628.
What is Income or Wage Gap in Bristol County?
Income or Wage Gap in Bristol County is 29.7%.
Women in Bristol County earn 70.3 cents for every dollar earned by a man.
What is Family Income Deficit in Bristol County?
Family Income Deficit in Bristol County is $10,739.
Families that are below poverty line in Bristol County earn $10,739 less on average than the poverty threshold level.
What is Inequality or Gini Index in Bristol County?
Inequality or Gini Index in Bristol County is 0.46.
How Large is the Labor Force in Bristol County?
There are 308,753 People in the Labor Forcein in Bristol County.
What is the Percentage of People in the Labor Force in Bristol County?
65.3% of People are in the Labor Force in Bristol County.
What is the Unemployment Rate in Bristol County?
Unemployment Rate in Bristol County is 5.7%.