Berkshire County, MA
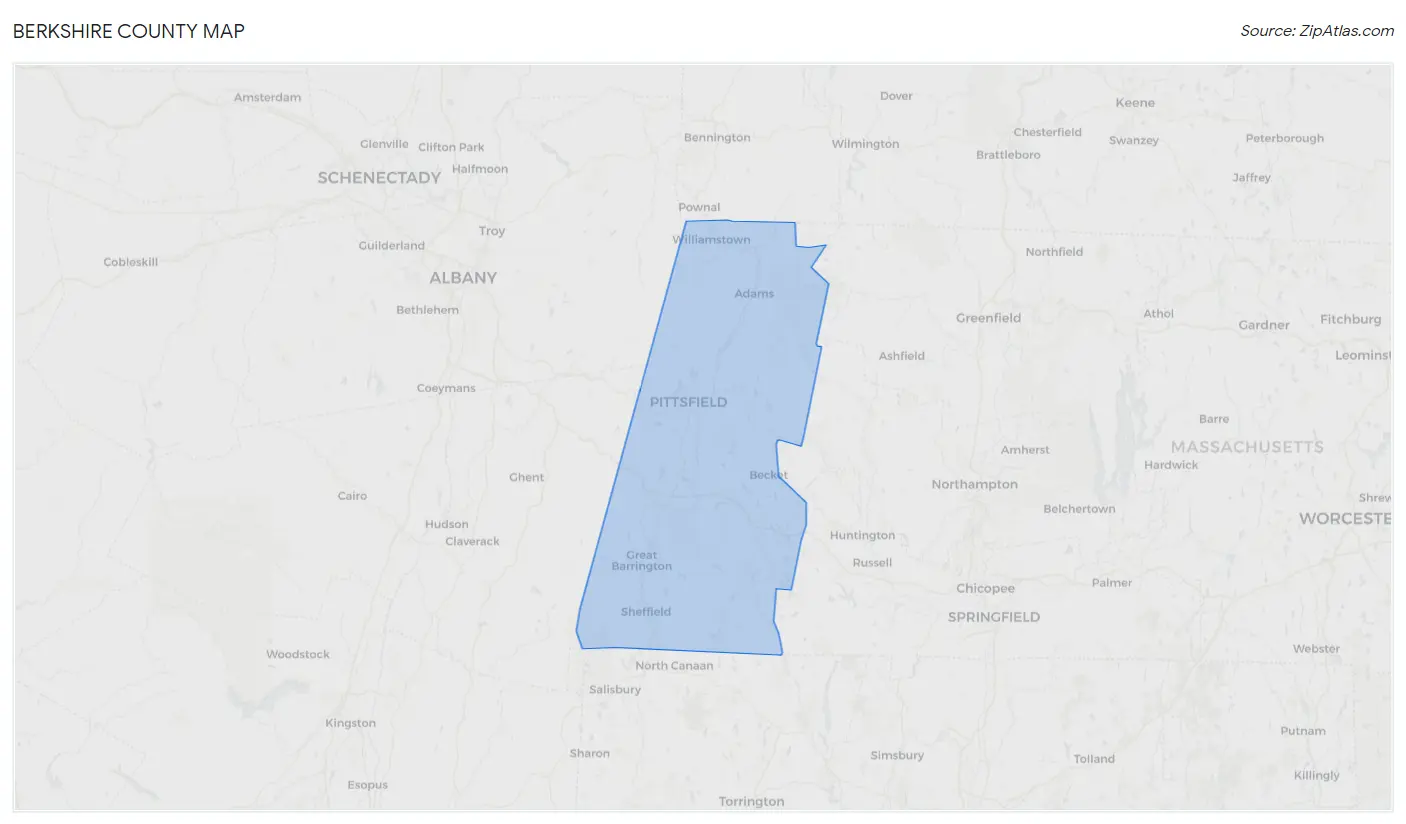
Berkshire County Map
Berkshire County Overview
128,763
TOTAL POPULATION
63,103
MALE POPULATION
65,660
FEMALE POPULATION
96.11
MALES / 100 FEMALES
104.05
FEMALES / 100 MALES
47.5
MEDIAN AGE
2.8
AVG FAMILY SIZE
2.2
AVG HOUSEHOLD SIZE
$45,300
PER CAPITA INCOME
$92,531
AVG FAMILY INCOME
$69,744
AVG HOUSEHOLD INCOME
27.9%
WAGE / INCOME GAP [ % ]
72.1¢/ $1
WAGE / INCOME GAP [ $ ]
$10,325
FAMILY INCOME DEFICIT
0.49
INEQUALITY / GINI INDEX
67,742
LABOR FORCE [ PEOPLE ]
61.4%
PERCENT IN LABOR FORCE
5.3%
UNEMPLOYMENT RATE
Berkshire County Area Codes
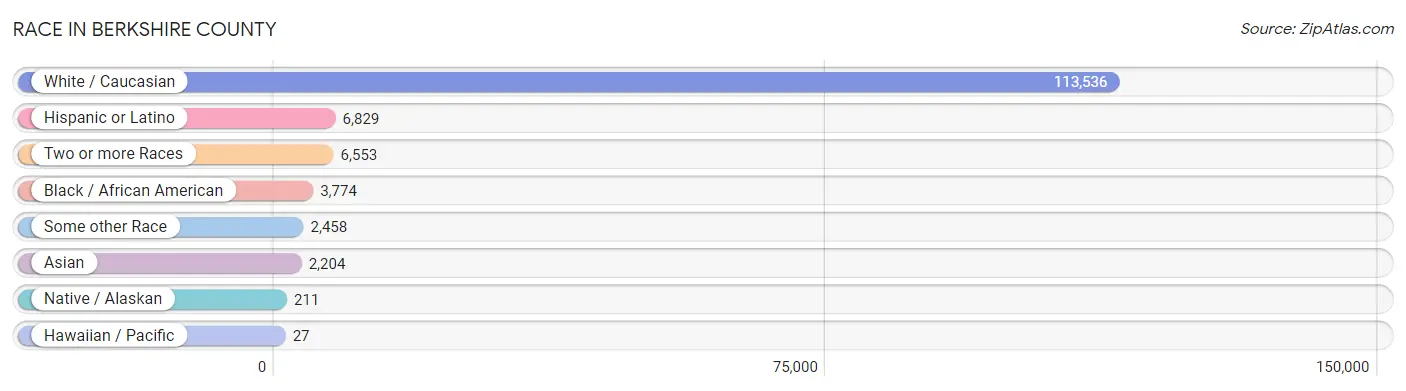
Race in Berkshire County
The most populous races in Berkshire County are White / Caucasian (113,536 | 88.2%), Hispanic or Latino (6,829 | 5.3%), and Two or more Races (6,553 | 5.1%).
| Race | # Population | % Population |
| Asian | 2,204 | 1.7% |
| Black / African American | 3,774 | 2.9% |
| Hawaiian / Pacific | 27 | 0.0% |
| Hispanic or Latino | 6,829 | 5.3% |
| Native / Alaskan | 211 | 0.2% |
| White / Caucasian | 113,536 | 88.2% |
| Two or more Races | 6,553 | 5.1% |
| Some other Race | 2,458 | 1.9% |
| Total | 128,763 | 100.0% |
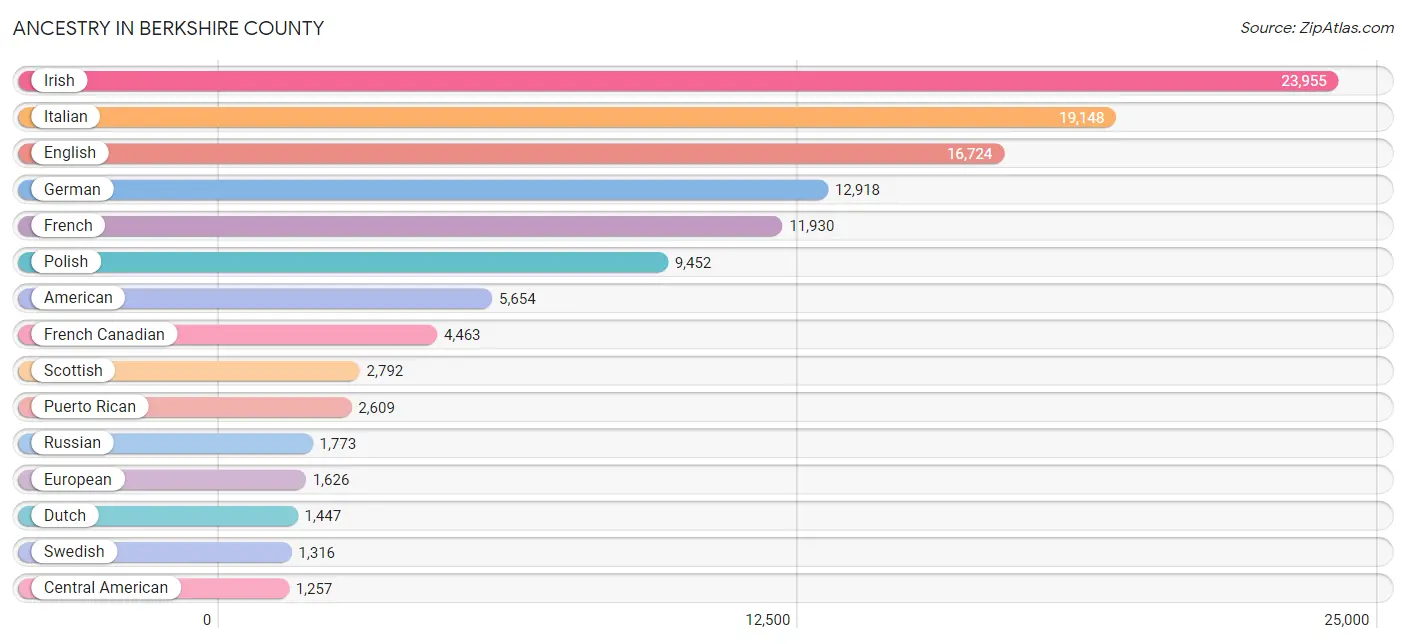
Ancestry in Berkshire County
The most populous ancestries reported in Berkshire County are Irish (23,955 | 18.6%), Italian (19,148 | 14.9%), English (16,724 | 13.0%), German (12,918 | 10.0%), and French (11,930 | 9.3%), together accounting for 65.8% of all Berkshire County residents.
| Ancestry | # Population | % Population |
| African | 403 | 0.3% |
| Albanian | 5 | 0.0% |
| Aleut | 5 | 0.0% |
| Alsatian | 28 | 0.0% |
| American | 5,654 | 4.4% |
| Apache | 7 | 0.0% |
| Arab | 654 | 0.5% |
| Argentinean | 33 | 0.0% |
| Armenian | 126 | 0.1% |
| Australian | 3 | 0.0% |
| Austrian | 609 | 0.5% |
| Basque | 18 | 0.0% |
| Belgian | 117 | 0.1% |
| Bhutanese | 284 | 0.2% |
| Blackfeet | 198 | 0.2% |
| Brazilian | 102 | 0.1% |
| British | 582 | 0.4% |
| British West Indian | 3 | 0.0% |
| Bulgarian | 2 | 0.0% |
| Burmese | 343 | 0.3% |
| Cajun | 15 | 0.0% |
| Cambodian | 5 | 0.0% |
| Canadian | 583 | 0.4% |
| Cape Verdean | 99 | 0.1% |
| Celtic | 21 | 0.0% |
| Central American | 1,257 | 1.0% |
| Central American Indian | 76 | 0.1% |
| Cherokee | 452 | 0.4% |
| Chilean | 65 | 0.1% |
| Chippewa | 1 | 0.0% |
| Choctaw | 94 | 0.1% |
| Colombian | 267 | 0.2% |
| Costa Rican | 21 | 0.0% |
| Creek | 105 | 0.1% |
| Croatian | 123 | 0.1% |
| Crow | 3 | 0.0% |
| Cuban | 274 | 0.2% |
| Czech | 342 | 0.3% |
| Czechoslovakian | 135 | 0.1% |
| Danish | 501 | 0.4% |
| Dominican | 174 | 0.1% |
| Dutch | 1,447 | 1.1% |
| Eastern European | 1,238 | 1.0% |
| Ecuadorian | 293 | 0.2% |
| Egyptian | 71 | 0.1% |
| English | 16,724 | 13.0% |
| Estonian | 25 | 0.0% |
| Ethiopian | 20 | 0.0% |
| European | 1,626 | 1.3% |
| Filipino | 37 | 0.0% |
| Finnish | 397 | 0.3% |
| French | 11,930 | 9.3% |
| French American Indian | 11 | 0.0% |
| French Canadian | 4,463 | 3.5% |
| German | 12,918 | 10.0% |
| Ghanaian | 195 | 0.2% |
| Greek | 654 | 0.5% |
| Guamanian / Chamorro | 15 | 0.0% |
| Guatemalan | 87 | 0.1% |
| Guyanese | 24 | 0.0% |
| Haitian | 197 | 0.2% |
| Honduran | 250 | 0.2% |
| Hungarian | 410 | 0.3% |
| Icelander | 35 | 0.0% |
| Indian (Asian) | 619 | 0.5% |
| Indonesian | 23 | 0.0% |
| Inupiat | 10 | 0.0% |
| Iranian | 64 | 0.1% |
| Irish | 23,955 | 18.6% |
| Iroquois | 36 | 0.0% |
| Israeli | 56 | 0.0% |
| Italian | 19,148 | 14.9% |
| Jamaican | 22 | 0.0% |
| Japanese | 46 | 0.0% |
| Korean | 218 | 0.2% |
| Laotian | 41 | 0.0% |
| Latvian | 18 | 0.0% |
| Lebanese | 478 | 0.4% |
| Lithuanian | 433 | 0.3% |
| Macedonian | 40 | 0.0% |
| Mexican | 830 | 0.6% |
| Mexican American Indian | 23 | 0.0% |
| Mongolian | 101 | 0.1% |
| Moroccan | 64 | 0.1% |
| Native Hawaiian | 17 | 0.0% |
| Navajo | 18 | 0.0% |
| New Zealander | 4 | 0.0% |
| Nicaraguan | 40 | 0.0% |
| Nigerian | 15 | 0.0% |
| Northern European | 312 | 0.2% |
| Norwegian | 695 | 0.5% |
| Pakistani | 104 | 0.1% |
| Palestinian | 17 | 0.0% |
| Panamanian | 119 | 0.1% |
| Pennsylvania German | 14 | 0.0% |
| Peruvian | 243 | 0.2% |
| Polish | 9,452 | 7.3% |
| Portuguese | 734 | 0.6% |
| Pueblo | 3 | 0.0% |
| Puerto Rican | 2,609 | 2.0% |
| Romanian | 274 | 0.2% |
| Russian | 1,773 | 1.4% |
| Salvadoran | 740 | 0.6% |
| Scandinavian | 443 | 0.3% |
| Scotch-Irish | 860 | 0.7% |
| Scottish | 2,792 | 2.2% |
| Serbian | 132 | 0.1% |
| Sierra Leonean | 1 | 0.0% |
| Sioux | 46 | 0.0% |
| Slavic | 39 | 0.0% |
| Slovak | 119 | 0.1% |
| Slovene | 14 | 0.0% |
| South African | 140 | 0.1% |
| South American | 911 | 0.7% |
| South American Indian | 5 | 0.0% |
| Spaniard | 128 | 0.1% |
| Spanish | 89 | 0.1% |
| Sri Lankan | 124 | 0.1% |
| Subsaharan African | 1,033 | 0.8% |
| Swedish | 1,316 | 1.0% |
| Swiss | 275 | 0.2% |
| Syrian | 20 | 0.0% |
| Thai | 646 | 0.5% |
| Trinidadian and Tobagonian | 28 | 0.0% |
| Turkish | 47 | 0.0% |
| Ukrainian | 510 | 0.4% |
| Uruguayan | 5 | 0.0% |
| Venezuelan | 5 | 0.0% |
| Vietnamese | 20 | 0.0% |
| Welsh | 618 | 0.5% |
| West Indian | 77 | 0.1% |
| Yugoslavian | 28 | 0.0% | View All 132 Rows |
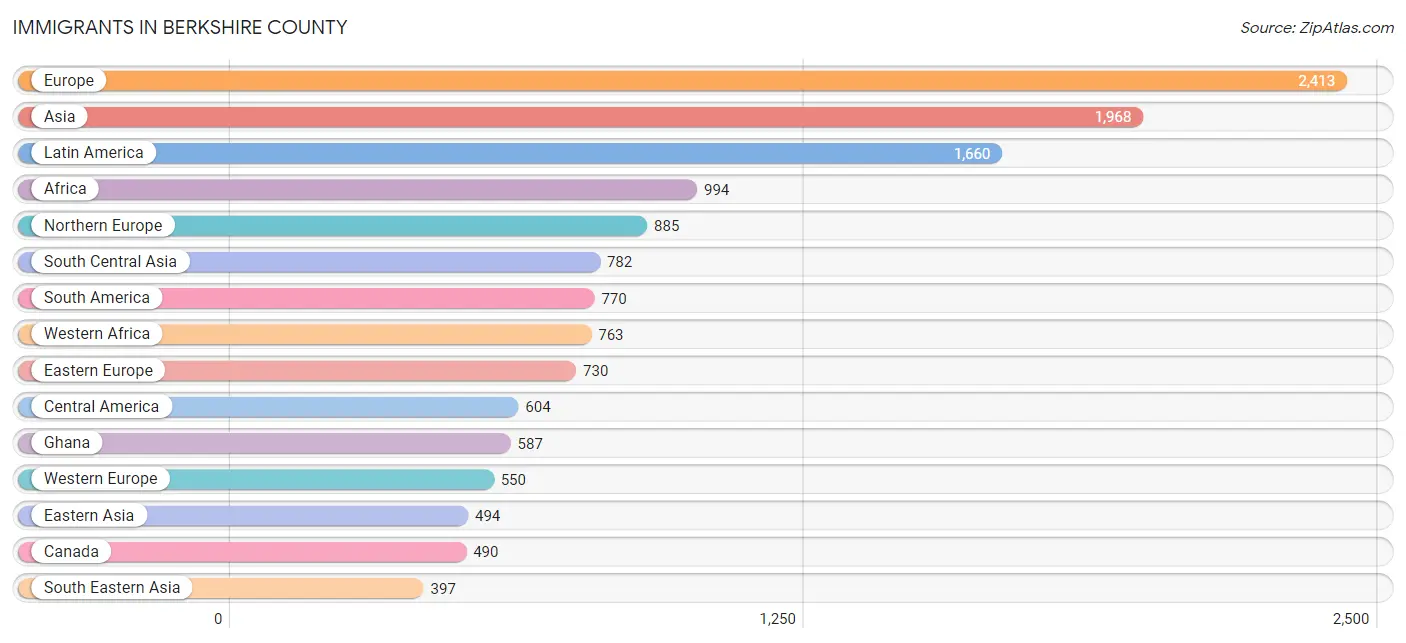
Immigrants in Berkshire County
The most numerous immigrant groups reported in Berkshire County came from Europe (2,413 | 1.9%), Asia (1,968 | 1.5%), Latin America (1,660 | 1.3%), Africa (994 | 0.8%), and Northern Europe (885 | 0.7%), together accounting for 6.1% of all Berkshire County residents.
| Immigration Origin | # Population | % Population |
| Africa | 994 | 0.8% |
| Albania | 3 | 0.0% |
| Argentina | 19 | 0.0% |
| Armenia | 95 | 0.1% |
| Asia | 1,968 | 1.5% |
| Australia | 32 | 0.0% |
| Austria | 3 | 0.0% |
| Bangladesh | 20 | 0.0% |
| Barbados | 21 | 0.0% |
| Belarus | 59 | 0.1% |
| Belgium | 75 | 0.1% |
| Bosnia and Herzegovina | 23 | 0.0% |
| Brazil | 120 | 0.1% |
| Bulgaria | 2 | 0.0% |
| Cabo Verde | 23 | 0.0% |
| Canada | 490 | 0.4% |
| Caribbean | 286 | 0.2% |
| Central America | 604 | 0.5% |
| Chile | 41 | 0.0% |
| China | 355 | 0.3% |
| Colombia | 264 | 0.2% |
| Costa Rica | 7 | 0.0% |
| Cuba | 44 | 0.0% |
| Czechoslovakia | 60 | 0.1% |
| Denmark | 29 | 0.0% |
| Dominican Republic | 128 | 0.1% |
| Eastern Africa | 51 | 0.0% |
| Eastern Asia | 494 | 0.4% |
| Eastern Europe | 730 | 0.6% |
| Ecuador | 77 | 0.1% |
| Egypt | 24 | 0.0% |
| El Salvador | 252 | 0.2% |
| England | 155 | 0.1% |
| Ethiopia | 4 | 0.0% |
| Europe | 2,413 | 1.9% |
| Fiji | 12 | 0.0% |
| France | 124 | 0.1% |
| Germany | 319 | 0.3% |
| Ghana | 587 | 0.5% |
| Greece | 95 | 0.1% |
| Guatemala | 50 | 0.0% |
| Guyana | 14 | 0.0% |
| Haiti | 21 | 0.0% |
| Honduras | 166 | 0.1% |
| Hong Kong | 7 | 0.0% |
| Hungary | 7 | 0.0% |
| India | 379 | 0.3% |
| Indonesia | 41 | 0.0% |
| Ireland | 108 | 0.1% |
| Israel | 3 | 0.0% |
| Italy | 104 | 0.1% |
| Jamaica | 37 | 0.0% |
| Japan | 37 | 0.0% |
| Jordan | 5 | 0.0% |
| Kazakhstan | 5 | 0.0% |
| Korea | 102 | 0.1% |
| Latin America | 1,660 | 1.3% |
| Lebanon | 31 | 0.0% |
| Malaysia | 101 | 0.1% |
| Mexico | 129 | 0.1% |
| Middle Africa | 27 | 0.0% |
| Moldova | 25 | 0.0% |
| Morocco | 99 | 0.1% |
| Nepal | 373 | 0.3% |
| Netherlands | 16 | 0.0% |
| Nigeria | 11 | 0.0% |
| Northern Africa | 123 | 0.1% |
| Northern Europe | 885 | 0.7% |
| Norway | 4 | 0.0% |
| Oceania | 44 | 0.0% |
| Peru | 230 | 0.2% |
| Philippines | 77 | 0.1% |
| Poland | 137 | 0.1% |
| Portugal | 49 | 0.0% |
| Romania | 41 | 0.0% |
| Russia | 145 | 0.1% |
| Scotland | 21 | 0.0% |
| Serbia | 52 | 0.0% |
| Sierra Leone | 14 | 0.0% |
| South Africa | 30 | 0.0% |
| South America | 770 | 0.6% |
| South Central Asia | 782 | 0.6% |
| South Eastern Asia | 397 | 0.3% |
| Southern Europe | 248 | 0.2% |
| St. Vincent and the Grenadines | 7 | 0.0% |
| Sweden | 110 | 0.1% |
| Switzerland | 13 | 0.0% |
| Taiwan | 37 | 0.0% |
| Thailand | 76 | 0.1% |
| Trinidad and Tobago | 28 | 0.0% |
| Turkey | 24 | 0.0% |
| Ukraine | 101 | 0.1% |
| Uzbekistan | 5 | 0.0% |
| Venezuela | 5 | 0.0% |
| Vietnam | 94 | 0.1% |
| Western Africa | 763 | 0.6% |
| Western Asia | 258 | 0.2% |
| Western Europe | 550 | 0.4% |
| Zaire | 27 | 0.0% | View All 99 Rows |
Sex and Age in Berkshire County
Sex and Age in Berkshire County
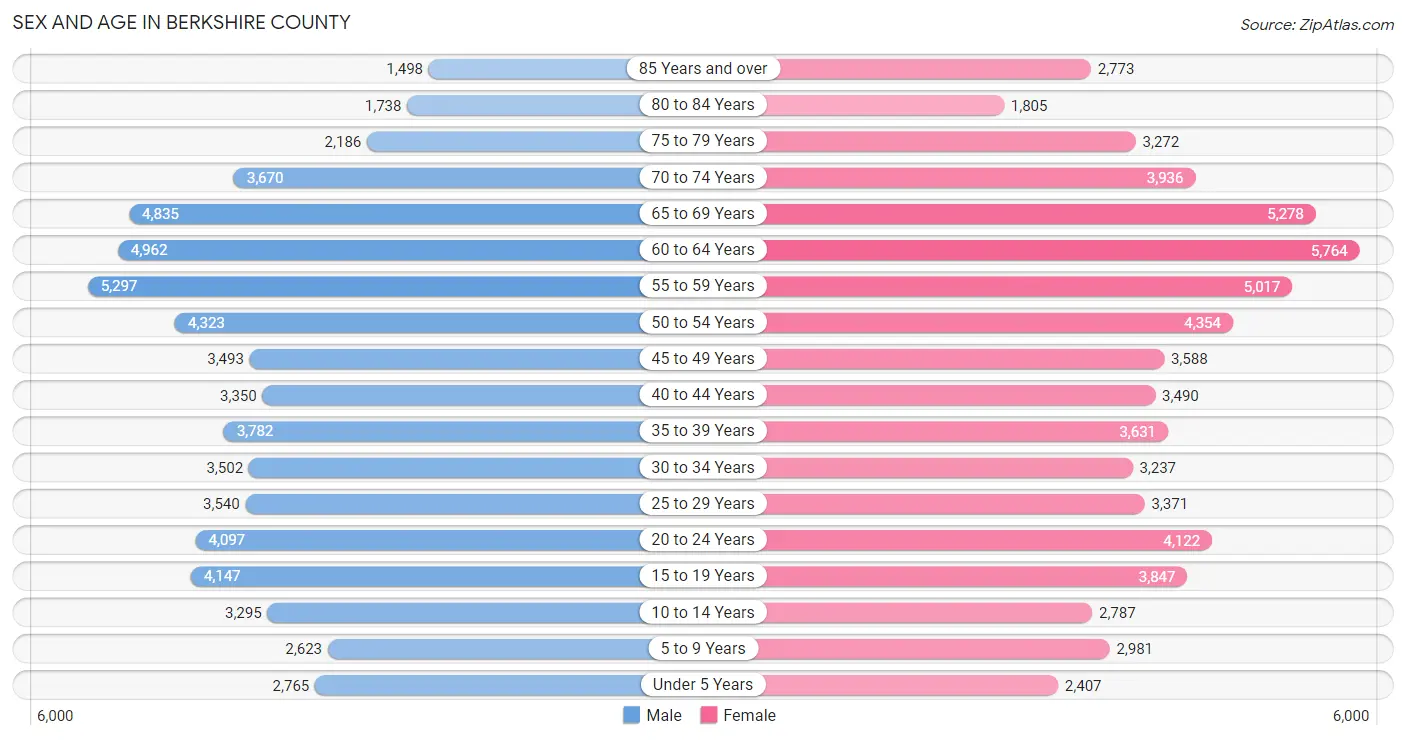
The most populous age groups in Berkshire County are 55 to 59 Years (5,297 | 8.4%) for men and 60 to 64 Years (5,764 | 8.8%) for women.
| Age Bracket | Male | Female |
| Under 5 Years | 2,765 (4.4%) | 2,407 (3.7%) |
| 5 to 9 Years | 2,623 (4.2%) | 2,981 (4.5%) |
| 10 to 14 Years | 3,295 (5.2%) | 2,787 (4.2%) |
| 15 to 19 Years | 4,147 (6.6%) | 3,847 (5.9%) |
| 20 to 24 Years | 4,097 (6.5%) | 4,122 (6.3%) |
| 25 to 29 Years | 3,540 (5.6%) | 3,371 (5.1%) |
| 30 to 34 Years | 3,502 (5.6%) | 3,237 (4.9%) |
| 35 to 39 Years | 3,782 (6.0%) | 3,631 (5.5%) |
| 40 to 44 Years | 3,350 (5.3%) | 3,490 (5.3%) |
| 45 to 49 Years | 3,493 (5.5%) | 3,588 (5.5%) |
| 50 to 54 Years | 4,323 (6.9%) | 4,354 (6.6%) |
| 55 to 59 Years | 5,297 (8.4%) | 5,017 (7.6%) |
| 60 to 64 Years | 4,962 (7.9%) | 5,764 (8.8%) |
| 65 to 69 Years | 4,835 (7.7%) | 5,278 (8.0%) |
| 70 to 74 Years | 3,670 (5.8%) | 3,936 (6.0%) |
| 75 to 79 Years | 2,186 (3.5%) | 3,272 (5.0%) |
| 80 to 84 Years | 1,738 (2.8%) | 1,805 (2.8%) |
| 85 Years and over | 1,498 (2.4%) | 2,773 (4.2%) |
| Total | 63,103 (100.0%) | 65,660 (100.0%) |
Families and Households in Berkshire County
Median Family Size in Berkshire County
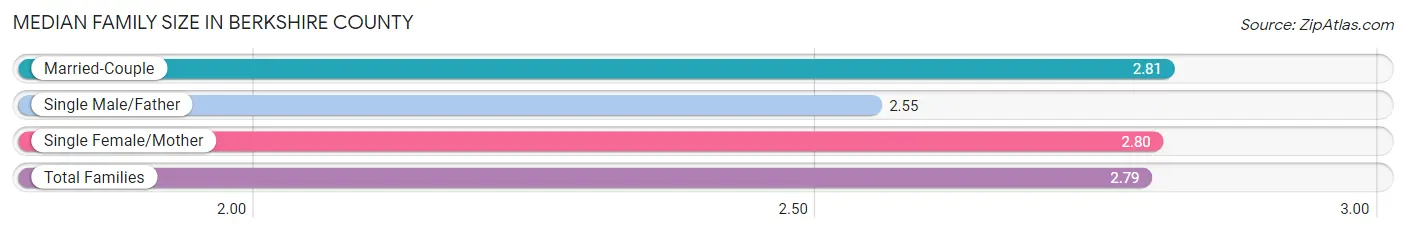
The median family size in Berkshire County is 2.79 persons per family, with married-couple families (24,339 | 74.3%) accounting for the largest median family size of 2.81 persons per family. On the other hand, single male/father families (2,423 | 7.4%) represent the smallest median family size with 2.55 persons per family.
| Family Type | # Families | Family Size |
| Married-Couple | 24,339 (74.3%) | 2.81 |
| Single Male/Father | 2,423 (7.4%) | 2.55 |
| Single Female/Mother | 5,988 (18.3%) | 2.80 |
| Total Families | 32,750 (100.0%) | 2.79 |
Median Household Size in Berkshire County
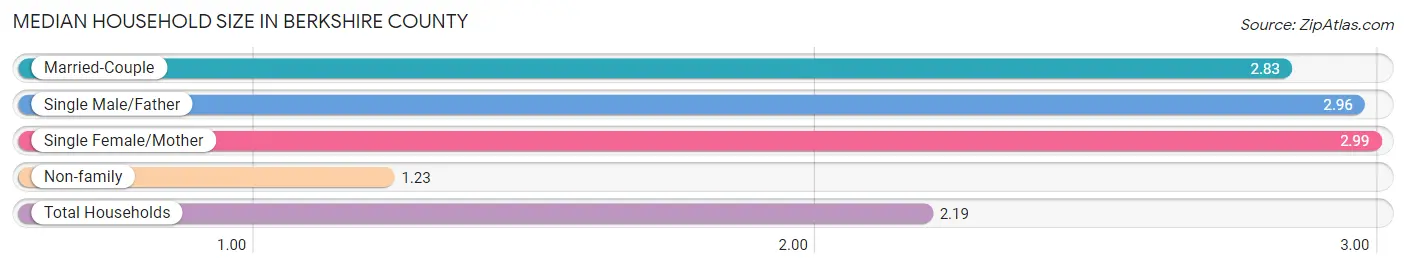
The median household size in Berkshire County is 2.19 persons per household, with single female/mother households (5,988 | 10.7%) accounting for the largest median household size of 2.99 persons per household. non-family households (23,328 | 41.6%) represent the smallest median household size with 1.23 persons per household.
| Household Type | # Households | Household Size |
| Married-Couple | 24,339 (43.4%) | 2.83 |
| Single Male/Father | 2,423 (4.3%) | 2.96 |
| Single Female/Mother | 5,988 (10.7%) | 2.99 |
| Non-family | 23,328 (41.6%) | 1.23 |
| Total Households | 56,078 (100.0%) | 2.19 |
Household Size by Marriage Status in Berkshire County
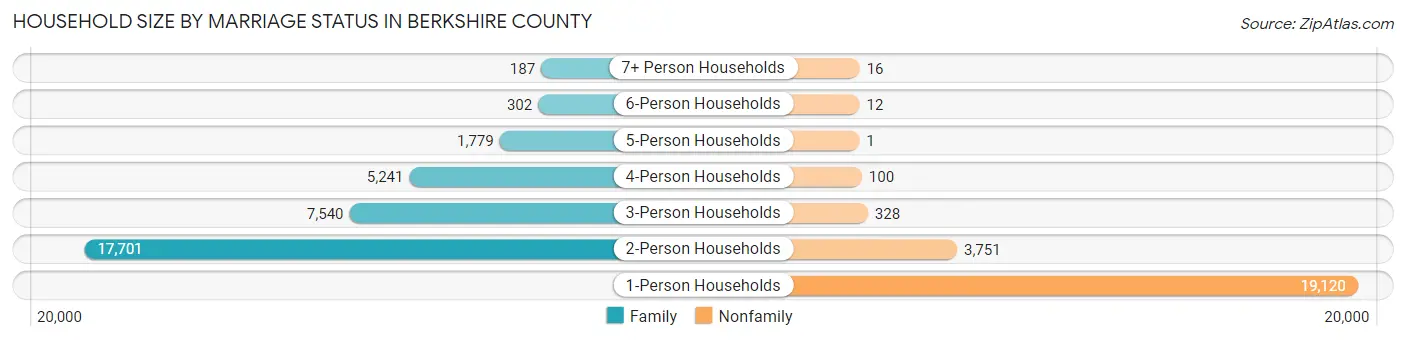
Out of a total of 56,078 households in Berkshire County, 32,750 (58.4%) are family households, while 23,328 (41.6%) are nonfamily households. The most numerous type of family households are 2-person households, comprising 17,701, and the most common type of nonfamily households are 1-person households, comprising 19,120.
| Household Size | Family Households | Nonfamily Households |
| 1-Person Households | - | 19,120 (34.1%) |
| 2-Person Households | 17,701 (31.6%) | 3,751 (6.7%) |
| 3-Person Households | 7,540 (13.5%) | 328 (0.6%) |
| 4-Person Households | 5,241 (9.3%) | 100 (0.2%) |
| 5-Person Households | 1,779 (3.2%) | 1 (0.0%) |
| 6-Person Households | 302 (0.5%) | 12 (0.0%) |
| 7+ Person Households | 187 (0.3%) | 16 (0.0%) |
| Total | 32,750 (58.4%) | 23,328 (41.6%) |
Female Fertility in Berkshire County
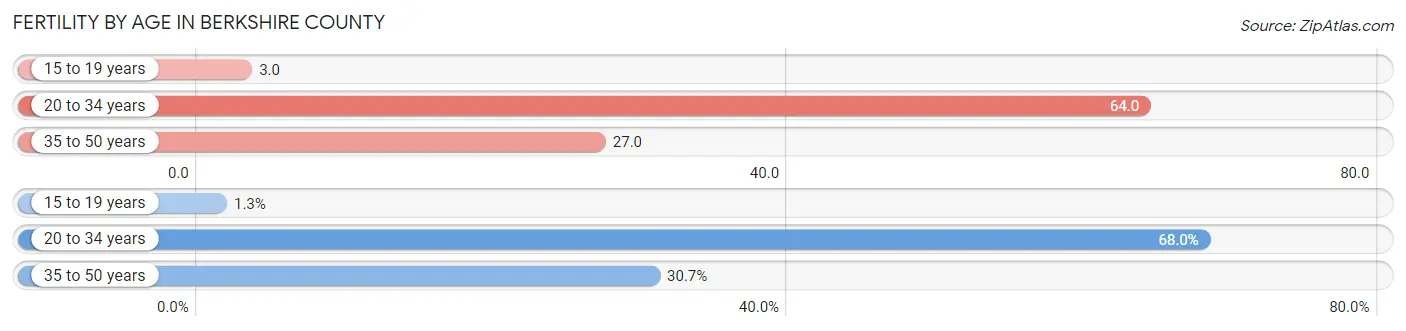
Fertility by Age in Berkshire County
Average fertility rate in Berkshire County is 39.0 births per 1,000 women. Women in the age bracket of 20 to 34 years have the highest fertility rate with 64.0 births per 1,000 women. Women in the age bracket of 20 to 34 years acount for 68.0% of all women with births.
| Age Bracket | Women with Births | Births / 1,000 Women |
| 15 to 19 years | 13 (1.3%) | 3.0 |
| 20 to 34 years | 683 (68.0%) | 64.0 |
| 35 to 50 years | 308 (30.7%) | 27.0 |
| Total | 1,004 (100.0%) | 39.0 |
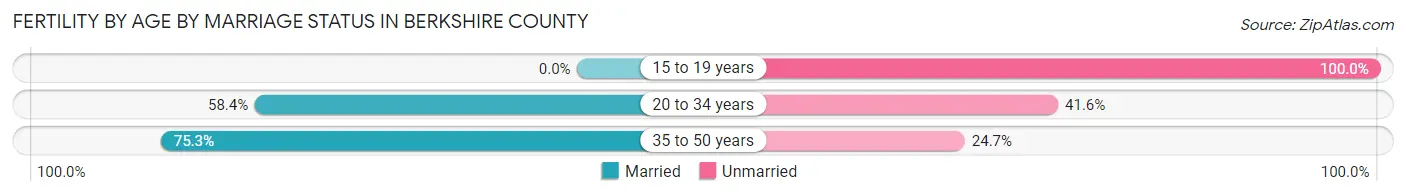
Fertility by Age by Marriage Status in Berkshire County
62.8% of women with births (1,004) in Berkshire County are married. The highest percentage of unmarried women with births falls into 15 to 19 years age bracket with 100.0% of them unmarried at the time of birth, while the lowest percentage of unmarried women with births belong to 35 to 50 years age bracket with 24.7% of them unmarried.
| Age Bracket | Married | Unmarried |
| 15 to 19 years | 0 (0.0%) | 13 (100.0%) |
| 20 to 34 years | 399 (58.4%) | 284 (41.6%) |
| 35 to 50 years | 232 (75.3%) | 76 (24.7%) |
| Total | 631 (62.8%) | 373 (37.1%) |
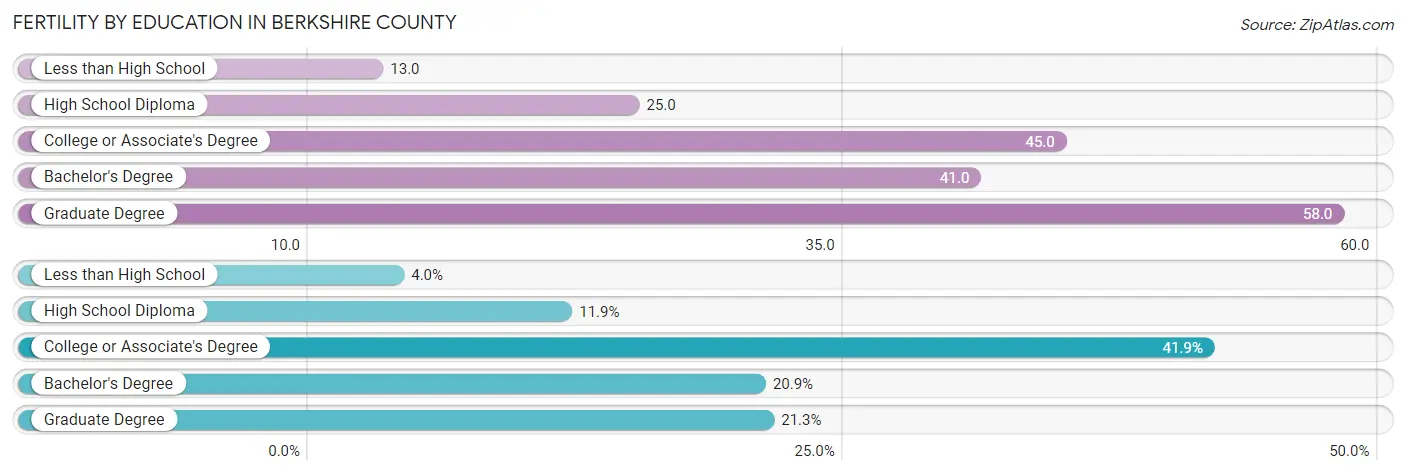
Fertility by Education in Berkshire County
Average fertility rate in Berkshire County is 39.0 births per 1,000 women. Women with the education attainment of graduate degree have the highest fertility rate of 58.0 births per 1,000 women, while women with the education attainment of less than high school have the lowest fertility at 13.0 births per 1,000 women. Women with the education attainment of college or associate's degree represent 41.9% of all women with births.
| Educational Attainment | Women with Births | Births / 1,000 Women |
| Less than High School | 40 (4.0%) | 13.0 |
| High School Diploma | 119 (11.8%) | 25.0 |
| College or Associate's Degree | 421 (41.9%) | 45.0 |
| Bachelor's Degree | 210 (20.9%) | 41.0 |
| Graduate Degree | 214 (21.3%) | 58.0 |
| Total | 1,004 (100.0%) | 39.0 |
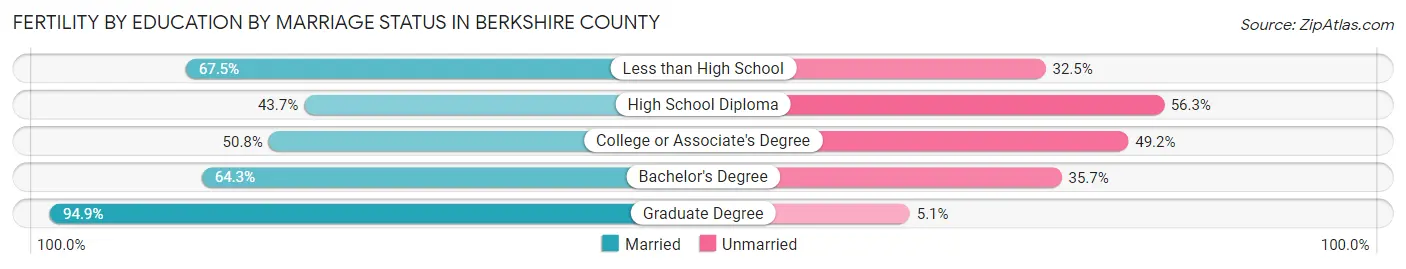
Fertility by Education by Marriage Status in Berkshire County
37.1% of women with births in Berkshire County are unmarried. Women with the educational attainment of graduate degree are most likely to be married with 94.9% of them married at childbirth, while women with the educational attainment of high school diploma are least likely to be married with 56.3% of them unmarried at childbirth.
| Educational Attainment | Married | Unmarried |
| Less than High School | 27 (67.5%) | 13 (32.5%) |
| High School Diploma | 52 (43.7%) | 67 (56.3%) |
| College or Associate's Degree | 214 (50.8%) | 207 (49.2%) |
| Bachelor's Degree | 135 (64.3%) | 75 (35.7%) |
| Graduate Degree | 203 (94.9%) | 11 (5.1%) |
| Total | 631 (62.8%) | 373 (37.1%) |
Income in Berkshire County
Income Overview in Berkshire County
Per Capita Income in Berkshire County is $45,300, while median incomes of families and households are $92,531 and $69,744 respectively.
| Characteristic | Number | Measure |
| Per Capita Income | 128,763 | $45,300 |
| Median Family Income | 32,750 | $92,531 |
| Mean Family Income | 32,750 | $127,733 |
| Median Household Income | 56,078 | $69,744 |
| Mean Household Income | 56,078 | $100,641 |
| Income Deficit | 32,750 | $10,325 |
| Wage / Income Gap (%) | 128,763 | 27.86% |
| Wage / Income Gap ($) | 128,763 | 72.14¢ per $1 |
| Gini / Inequality Index | 128,763 | 0.49 |
Earnings by Sex in Berkshire County
Average Earnings in Berkshire County are $40,817, $48,238 for men and $34,801 for women, a difference of 27.9%.
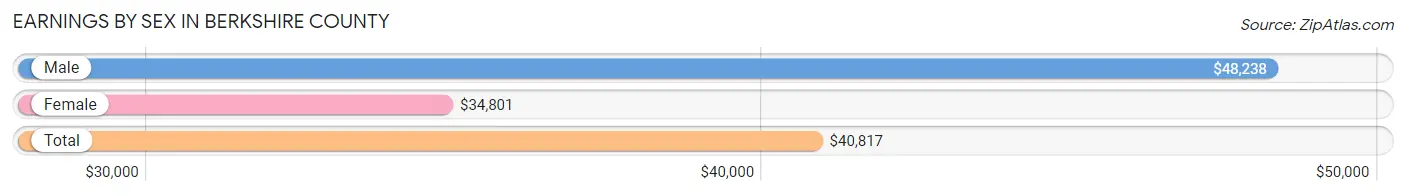
| Sex | Number | Average Earnings |
| Male | 35,933 (49.9%) | $48,238 |
| Female | 36,105 (50.1%) | $34,801 |
| Total | 72,038 (100.0%) | $40,817 |
Earnings by Sex by Income Bracket in Berkshire County
The most common earnings brackets in Berkshire County are $100,000+ for men (6,337 | 17.6%) and $75,000 to $99,999 for women (3,285 | 9.1%).
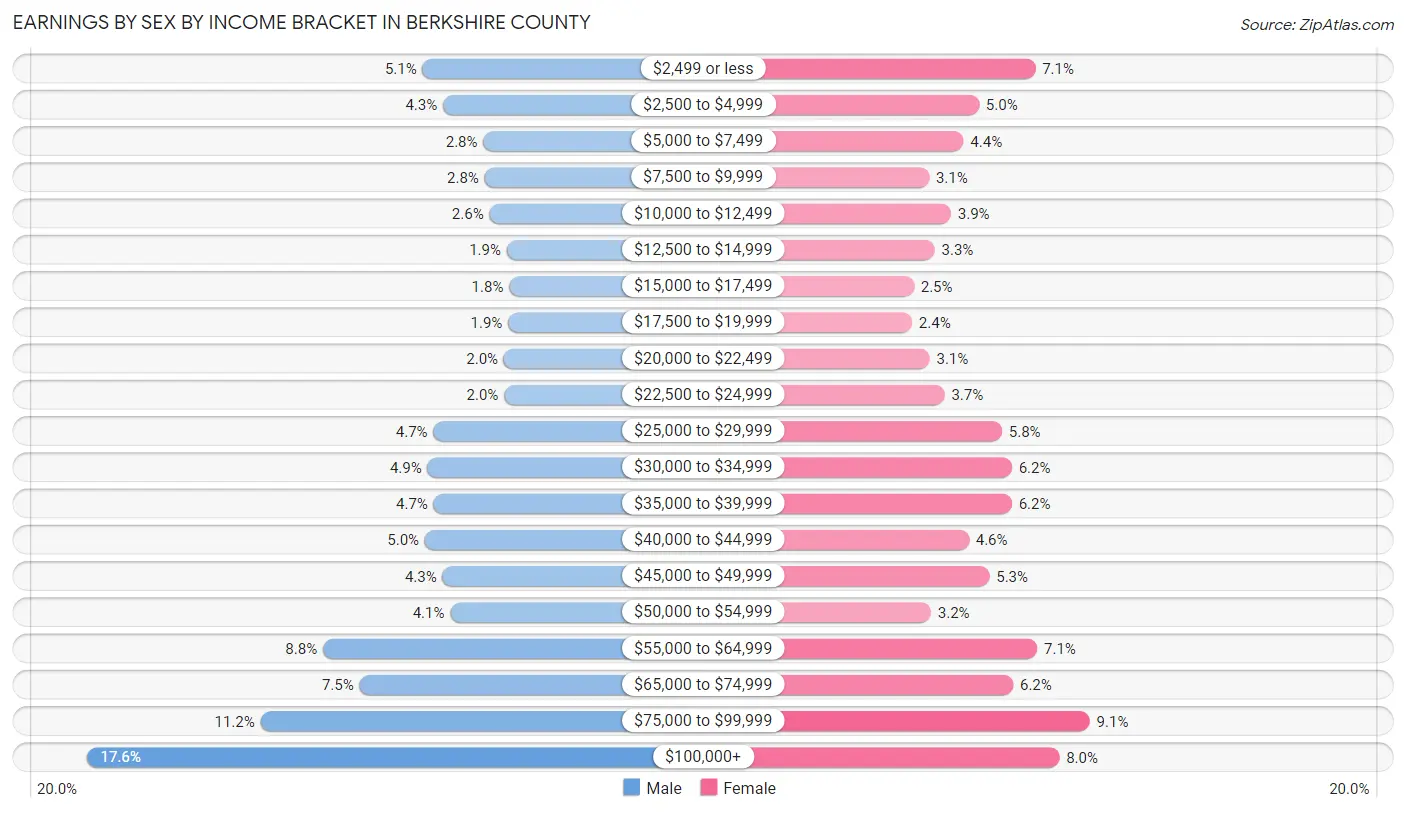
| Income | Male | Female |
| $2,499 or less | 1,829 (5.1%) | 2,548 (7.1%) |
| $2,500 to $4,999 | 1,554 (4.3%) | 1,786 (5.0%) |
| $5,000 to $7,499 | 1,008 (2.8%) | 1,577 (4.4%) |
| $7,500 to $9,999 | 993 (2.8%) | 1,112 (3.1%) |
| $10,000 to $12,499 | 927 (2.6%) | 1,409 (3.9%) |
| $12,500 to $14,999 | 694 (1.9%) | 1,189 (3.3%) |
| $15,000 to $17,499 | 662 (1.8%) | 905 (2.5%) |
| $17,500 to $19,999 | 677 (1.9%) | 882 (2.4%) |
| $20,000 to $22,499 | 734 (2.0%) | 1,121 (3.1%) |
| $22,500 to $24,999 | 731 (2.0%) | 1,323 (3.7%) |
| $25,000 to $29,999 | 1,680 (4.7%) | 2,096 (5.8%) |
| $30,000 to $34,999 | 1,760 (4.9%) | 2,232 (6.2%) |
| $35,000 to $39,999 | 1,678 (4.7%) | 2,230 (6.2%) |
| $40,000 to $44,999 | 1,797 (5.0%) | 1,649 (4.6%) |
| $45,000 to $49,999 | 1,559 (4.3%) | 1,927 (5.3%) |
| $50,000 to $54,999 | 1,456 (4.1%) | 1,136 (3.2%) |
| $55,000 to $64,999 | 3,170 (8.8%) | 2,574 (7.1%) |
| $65,000 to $74,999 | 2,676 (7.4%) | 2,249 (6.2%) |
| $75,000 to $99,999 | 4,011 (11.2%) | 3,285 (9.1%) |
| $100,000+ | 6,337 (17.6%) | 2,875 (8.0%) |
| Total | 35,933 (100.0%) | 36,105 (100.0%) |
Earnings by Sex by Educational Attainment in Berkshire County
Average earnings in Berkshire County are $56,278 for men and $40,260 for women, a difference of 28.5%. Men with an educational attainment of graduate degree enjoy the highest average annual earnings of $97,351, while those with less than high school education earn the least with $34,753. Women with an educational attainment of graduate degree earn the most with the average annual earnings of $68,048, while those with less than high school education have the smallest earnings of $23,734.
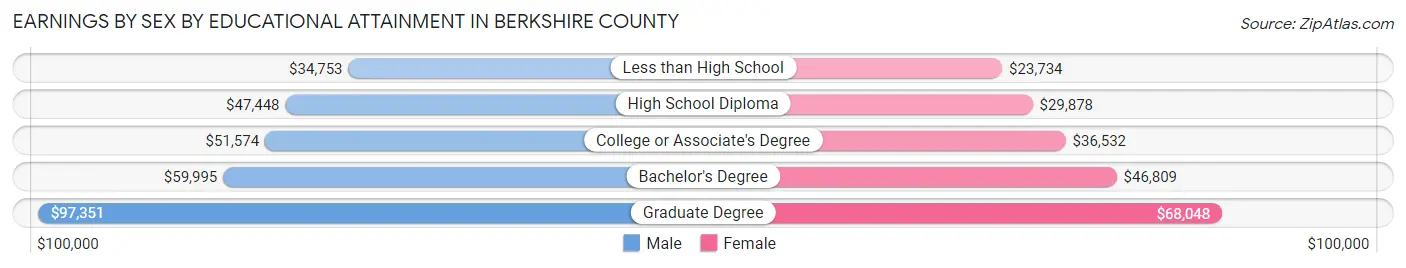
| Educational Attainment | Male Income | Female Income |
| Less than High School | $34,753 | $23,734 |
| High School Diploma | $47,448 | $29,878 |
| College or Associate's Degree | $51,574 | $36,532 |
| Bachelor's Degree | $59,995 | $46,809 |
| Graduate Degree | $97,351 | $68,048 |
| Total | $56,278 | $40,260 |
Family Income in Berkshire County
Family Income Brackets in Berkshire County
According to the Berkshire County family income data, there are 6,845 families falling into the $100,000 to $149,999 income range, which is the most common income bracket and makes up 20.9% of all families. Conversely, the $10,000 to $14,999 income bracket is the least frequent group with only 491 families (1.5%) belonging to this category.
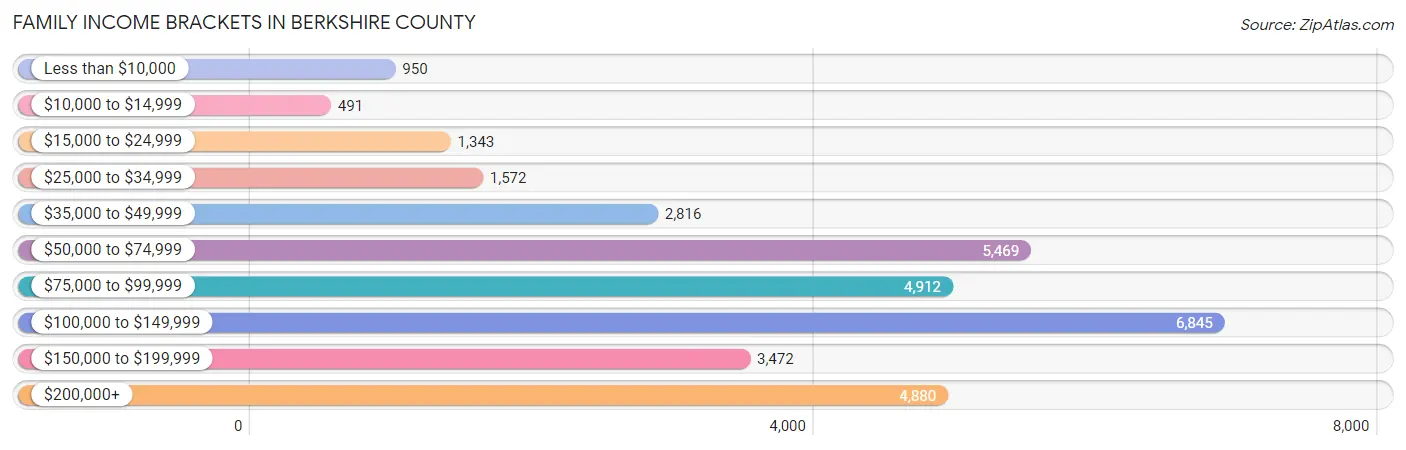
| Income Bracket | # Families | % Families |
| Less than $10,000 | 950 | 2.9% |
| $10,000 to $14,999 | 491 | 1.5% |
| $15,000 to $24,999 | 1,343 | 4.1% |
| $25,000 to $34,999 | 1,572 | 4.8% |
| $35,000 to $49,999 | 2,816 | 8.6% |
| $50,000 to $74,999 | 5,469 | 16.7% |
| $75,000 to $99,999 | 4,912 | 15.0% |
| $100,000 to $149,999 | 6,845 | 20.9% |
| $150,000 to $199,999 | 3,472 | 10.6% |
| $200,000+ | 4,880 | 14.9% |
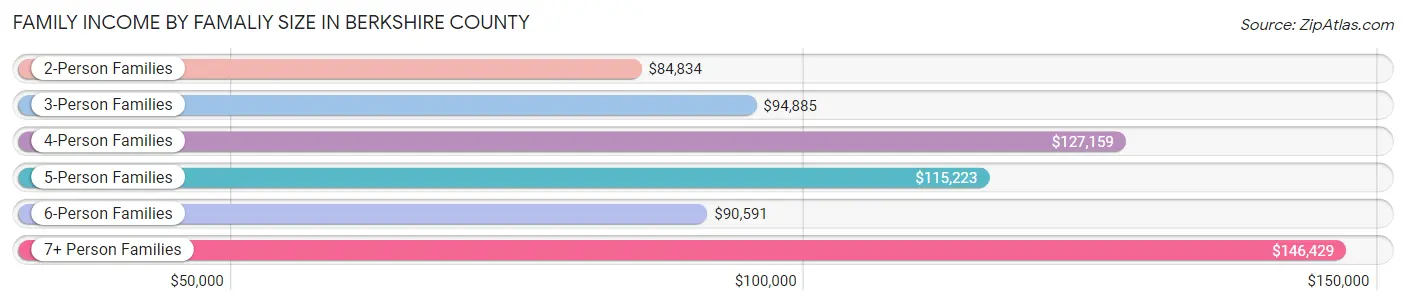
Family Income by Famaliy Size in Berkshire County
7+ person families (148 | 0.4%) account for the highest median family income in Berkshire County with $146,429 per family, while 2-person families (18,752 | 57.3%) have the highest median income of $42,417 per family member.
| Income Bracket | # Families | Median Income |
| 2-Person Families | 18,752 (57.3%) | $84,834 |
| 3-Person Families | 7,396 (22.6%) | $94,885 |
| 4-Person Families | 4,681 (14.3%) | $127,159 |
| 5-Person Families | 1,531 (4.7%) | $115,223 |
| 6-Person Families | 242 (0.7%) | $90,591 |
| 7+ Person Families | 148 (0.4%) | $146,429 |
| Total | 32,750 (100.0%) | $92,531 |
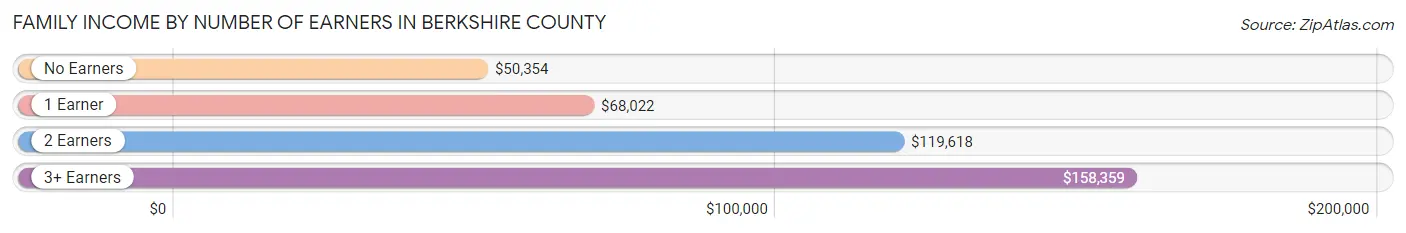
Family Income by Number of Earners in Berkshire County
The median family income in Berkshire County is $92,531, with families comprising 3+ earners (3,410) having the highest median family income of $158,359, while families with no earners (5,851) have the lowest median family income of $50,354, accounting for 10.4% and 17.9% of families, respectively.
| Number of Earners | # Families | Median Income |
| No Earners | 5,851 (17.9%) | $50,354 |
| 1 Earner | 9,848 (30.1%) | $68,022 |
| 2 Earners | 13,641 (41.6%) | $119,618 |
| 3+ Earners | 3,410 (10.4%) | $158,359 |
| Total | 32,750 (100.0%) | $92,531 |
Household Income in Berkshire County
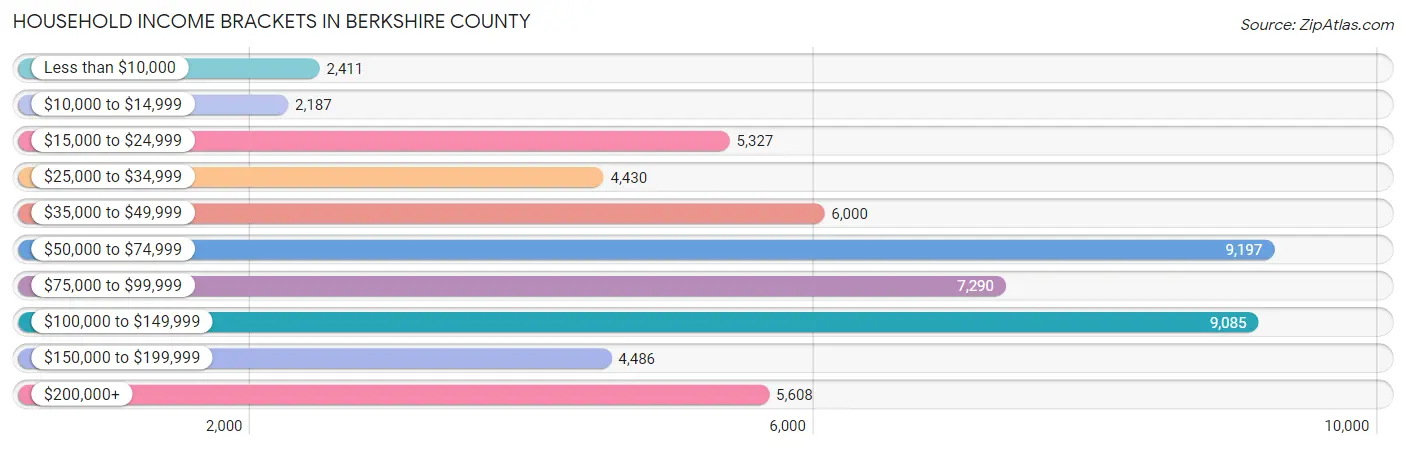
Household Income Brackets in Berkshire County
With 9,197 households falling in the category, the $50,000 to $74,999 income range is the most frequent in Berkshire County, accounting for 16.4% of all households. In contrast, only 2,187 households (3.9%) fall into the $10,000 to $14,999 income bracket, making it the least populous group.
| Income Bracket | # Households | % Households |
| Less than $10,000 | 2,411 | 4.3% |
| $10,000 to $14,999 | 2,187 | 3.9% |
| $15,000 to $24,999 | 5,327 | 9.5% |
| $25,000 to $34,999 | 4,430 | 7.9% |
| $35,000 to $49,999 | 6,000 | 10.7% |
| $50,000 to $74,999 | 9,197 | 16.4% |
| $75,000 to $99,999 | 7,290 | 13.0% |
| $100,000 to $149,999 | 9,085 | 16.2% |
| $150,000 to $199,999 | 4,486 | 8.0% |
| $200,000+ | 5,608 | 10.0% |
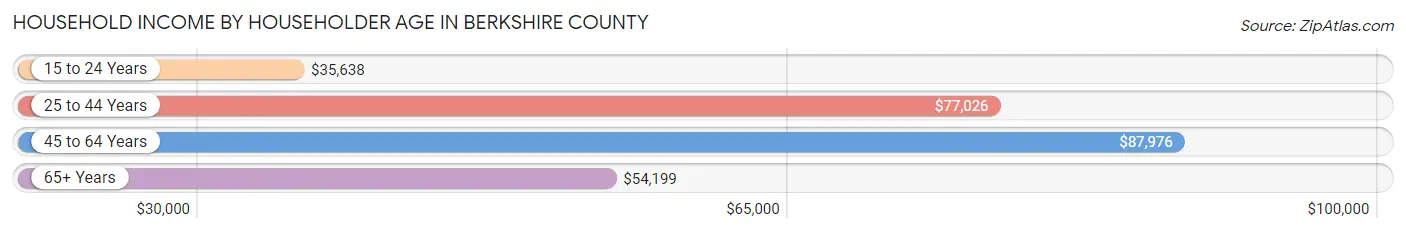
Household Income by Householder Age in Berkshire County
The median household income in Berkshire County is $69,744, with the highest median household income of $87,976 found in the 45 to 64 years age bracket for the primary householder. A total of 21,723 households (38.7%) fall into this category. Meanwhile, the 15 to 24 years age bracket for the primary householder has the lowest median household income of $35,638, with 1,335 households (2.4%) in this group.
| Income Bracket | # Households | Median Income |
| 15 to 24 Years | 1,335 (2.4%) | $35,638 |
| 25 to 44 Years | 13,154 (23.5%) | $77,026 |
| 45 to 64 Years | 21,723 (38.7%) | $87,976 |
| 65+ Years | 19,866 (35.4%) | $54,199 |
| Total | 56,078 (100.0%) | $69,744 |
Poverty in Berkshire County
Income Below Poverty by Sex and Age in Berkshire County
With 11.0% poverty level for males and 11.0% for females among the residents of Berkshire County, 12 to 14 year old males and 15 year old females are the most vulnerable to poverty, with 545 males (24.1%) and 142 females (17.4%) in their respective age groups living below the poverty level.
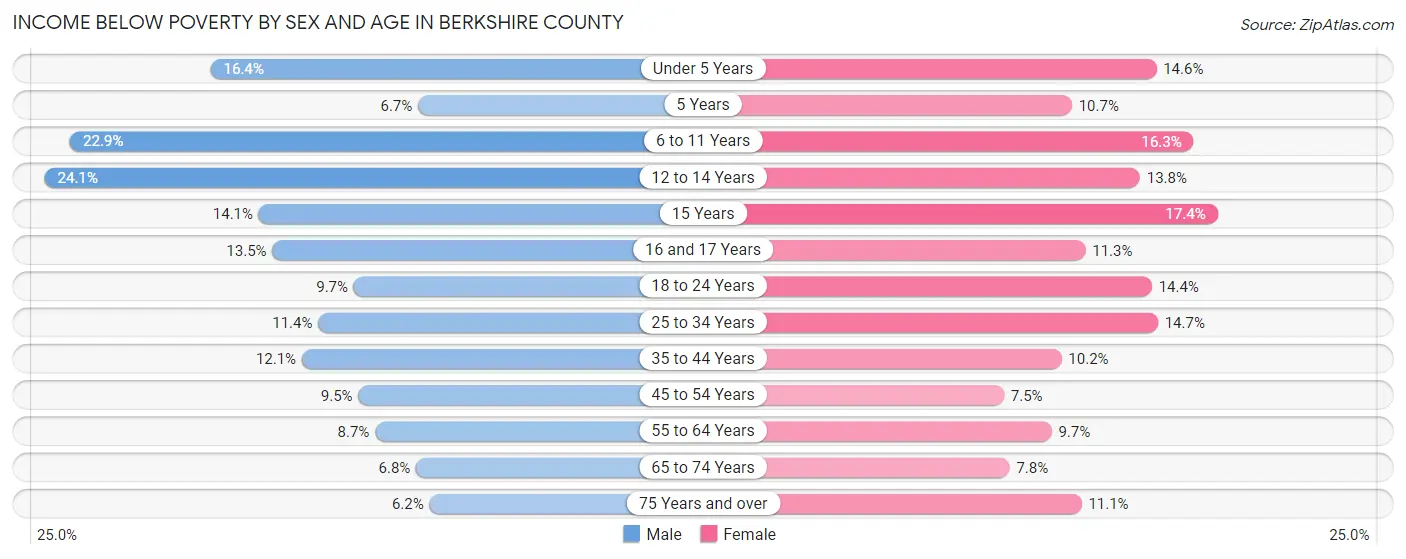
| Age Bracket | Male | Female |
| Under 5 Years | 436 (16.4%) | 346 (14.6%) |
| 5 Years | 24 (6.7%) | 65 (10.7%) |
| 6 to 11 Years | 732 (22.9%) | 549 (16.3%) |
| 12 to 14 Years | 545 (24.1%) | 222 (13.8%) |
| 15 Years | 104 (14.1%) | 142 (17.4%) |
| 16 and 17 Years | 177 (13.5%) | 119 (11.3%) |
| 18 to 24 Years | 439 (9.7%) | 598 (14.4%) |
| 25 to 34 Years | 792 (11.4%) | 968 (14.7%) |
| 35 to 44 Years | 858 (12.1%) | 725 (10.2%) |
| 45 to 54 Years | 733 (9.5%) | 594 (7.5%) |
| 55 to 64 Years | 886 (8.7%) | 1,037 (9.7%) |
| 65 to 74 Years | 568 (6.8%) | 710 (7.8%) |
| 75 Years and over | 317 (6.2%) | 832 (11.1%) |
| Total | 6,611 (11.0%) | 6,907 (11.0%) |
Income Above Poverty by Sex and Age in Berkshire County
According to the poverty statistics in Berkshire County, males aged 75 years and over and females aged 45 to 54 years are the age groups that are most secure financially, with 93.8% of males and 92.5% of females in these age groups living above the poverty line.
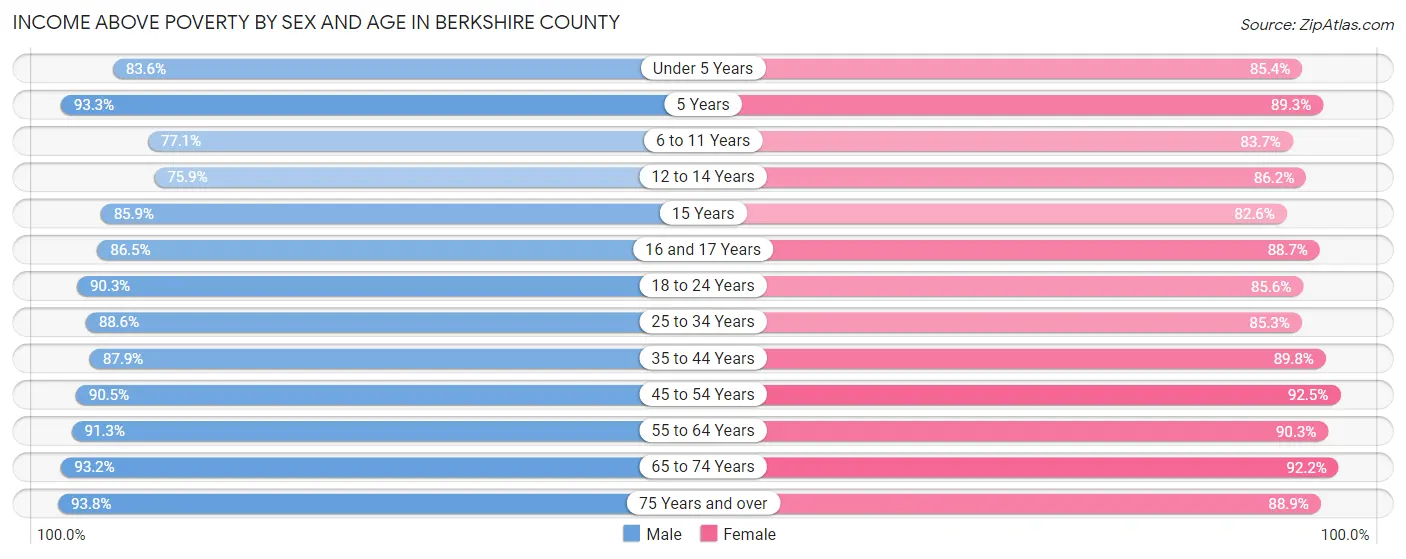
| Age Bracket | Male | Female |
| Under 5 Years | 2,227 (83.6%) | 2,026 (85.4%) |
| 5 Years | 332 (93.3%) | 544 (89.3%) |
| 6 to 11 Years | 2,466 (77.1%) | 2,815 (83.7%) |
| 12 to 14 Years | 1,719 (75.9%) | 1,383 (86.2%) |
| 15 Years | 632 (85.9%) | 672 (82.6%) |
| 16 and 17 Years | 1,134 (86.5%) | 934 (88.7%) |
| 18 to 24 Years | 4,079 (90.3%) | 3,560 (85.6%) |
| 25 to 34 Years | 6,175 (88.6%) | 5,637 (85.3%) |
| 35 to 44 Years | 6,216 (87.9%) | 6,393 (89.8%) |
| 45 to 54 Years | 6,974 (90.5%) | 7,304 (92.5%) |
| 55 to 64 Years | 9,262 (91.3%) | 9,626 (90.3%) |
| 65 to 74 Years | 7,752 (93.2%) | 8,420 (92.2%) |
| 75 Years and over | 4,791 (93.8%) | 6,653 (88.9%) |
| Total | 53,759 (89.0%) | 55,967 (89.0%) |
Income Below Poverty Among Married-Couple Families in Berkshire County
The poverty statistics for married-couple families in Berkshire County show that 2.5% or 621 of the total 24,339 families live below the poverty line. Families with 3 or 4 children have the highest poverty rate of 10.1%, comprising of 97 families. On the other hand, families with 5 or more children have the lowest poverty rate of 0.0%, which includes 0 families.
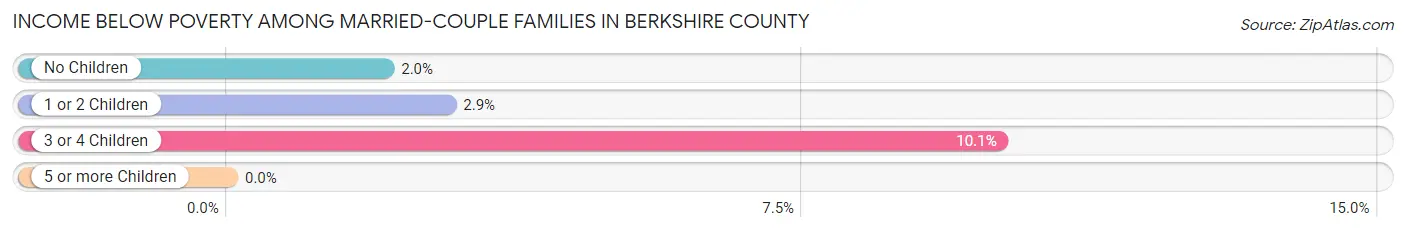
| Children | Above Poverty | Below Poverty |
| No Children | 16,891 (98.0%) | 351 (2.0%) |
| 1 or 2 Children | 5,897 (97.2%) | 173 (2.9%) |
| 3 or 4 Children | 867 (89.9%) | 97 (10.1%) |
| 5 or more Children | 63 (100.0%) | 0 (0.0%) |
| Total | 23,718 (97.5%) | 621 (2.5%) |
Income Below Poverty Among Single-Parent Households in Berkshire County
According to the poverty data in Berkshire County, 12.2% or 295 single-father households and 21.3% or 1,273 single-mother households are living below the poverty line. Among single-father households, those with 3 or 4 children have the highest poverty rate, with 20 households (32.3%) experiencing poverty. Likewise, among single-mother households, those with 3 or 4 children have the highest poverty rate, with 316 households (66.7%) falling below the poverty line.
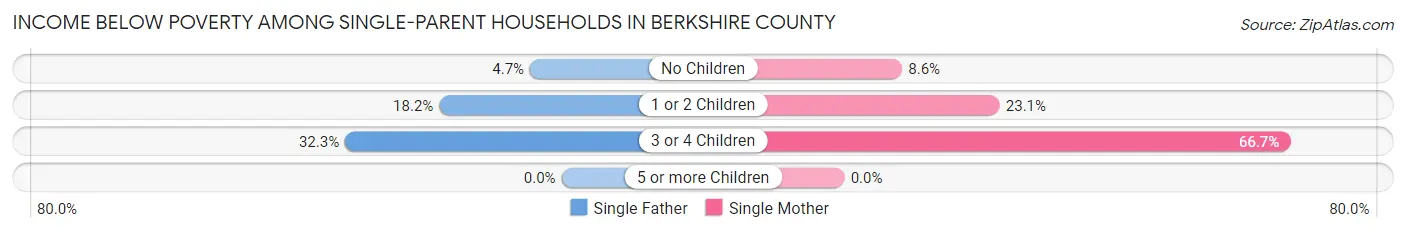
| Children | Single Father | Single Mother |
| No Children | 54 (4.7%) | 188 (8.6%) |
| 1 or 2 Children | 221 (18.2%) | 769 (23.1%) |
| 3 or 4 Children | 20 (32.3%) | 316 (66.7%) |
| 5 or more Children | 0 (0.0%) | 0 (0.0%) |
| Total | 295 (12.2%) | 1,273 (21.3%) |
Income Below Poverty Among Married-Couple vs Single-Parent Households in Berkshire County
The poverty data for Berkshire County shows that 621 of the married-couple family households (2.5%) and 1,568 of the single-parent households (18.6%) are living below the poverty level. Within the married-couple family households, those with 3 or 4 children have the highest poverty rate, with 97 households (10.1%) falling below the poverty line. Among the single-parent households, those with 3 or 4 children have the highest poverty rate, with 336 household (62.7%) living below poverty.
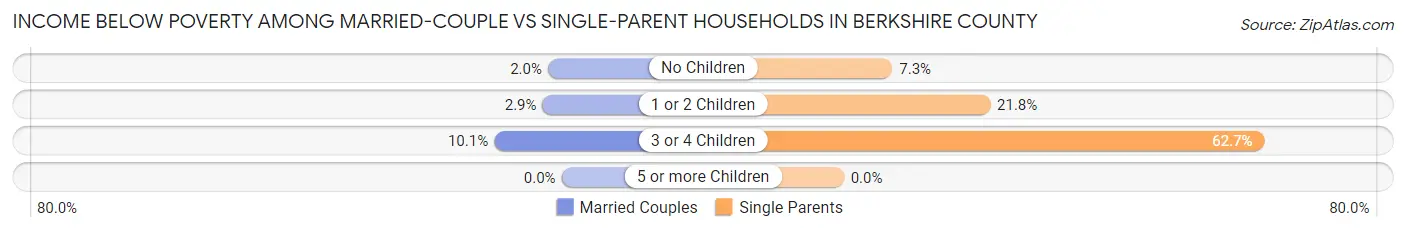
| Children | Married-Couple Families | Single-Parent Households |
| No Children | 351 (2.0%) | 242 (7.2%) |
| 1 or 2 Children | 173 (2.9%) | 990 (21.8%) |
| 3 or 4 Children | 97 (10.1%) | 336 (62.7%) |
| 5 or more Children | 0 (0.0%) | 0 (0.0%) |
| Total | 621 (2.5%) | 1,568 (18.6%) |
Employment Characteristics in Berkshire County
Employment by Class of Employer in Berkshire County
Among the 62,128 employed individuals in Berkshire County, private company employees (33,856 | 54.5%), not-for-profit organizations (11,905 | 19.2%), and self-employed (not incorporated) (5,313 | 8.6%) make up the most common classes of employment.
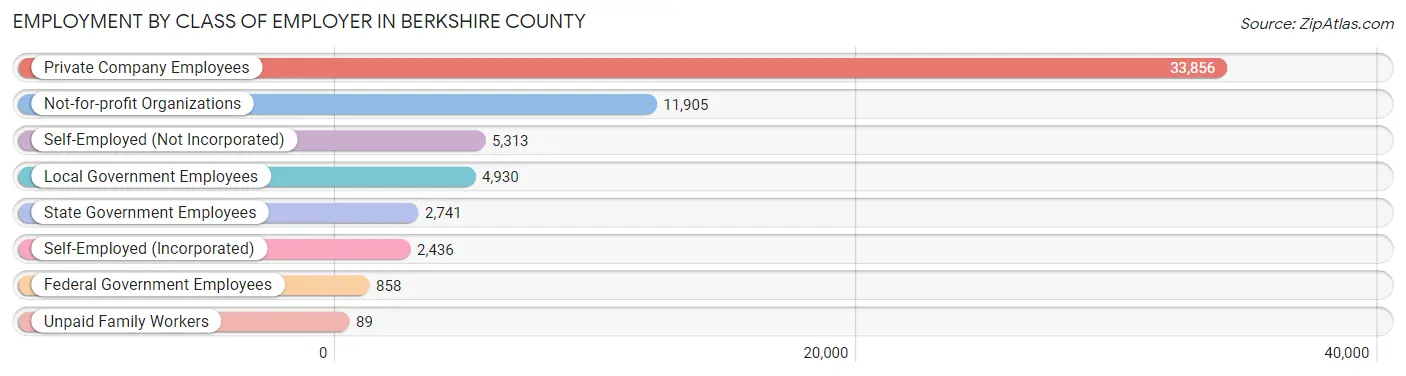
| Employer Class | # Employees | % Employees |
| Private Company Employees | 33,856 | 54.5% |
| Self-Employed (Incorporated) | 2,436 | 3.9% |
| Self-Employed (Not Incorporated) | 5,313 | 8.6% |
| Not-for-profit Organizations | 11,905 | 19.2% |
| Local Government Employees | 4,930 | 7.9% |
| State Government Employees | 2,741 | 4.4% |
| Federal Government Employees | 858 | 1.4% |
| Unpaid Family Workers | 89 | 0.1% |
| Total | 62,128 | 100.0% |
Employment Status by Age in Berkshire County
According to the labor force statistics for Berkshire County, out of the total population over 16 years of age (110,329), 61.4% or 67,742 individuals are in the labor force, with 5.3% or 3,590 of them unemployed. The age group with the highest labor force participation rate is 35 to 44 years, with 86.0% or 12,258 individuals in the labor force. Within the labor force, the 16 to 19 years age range has the highest percentage of unemployed individuals, with 14.2% or 407 of them being unemployed.
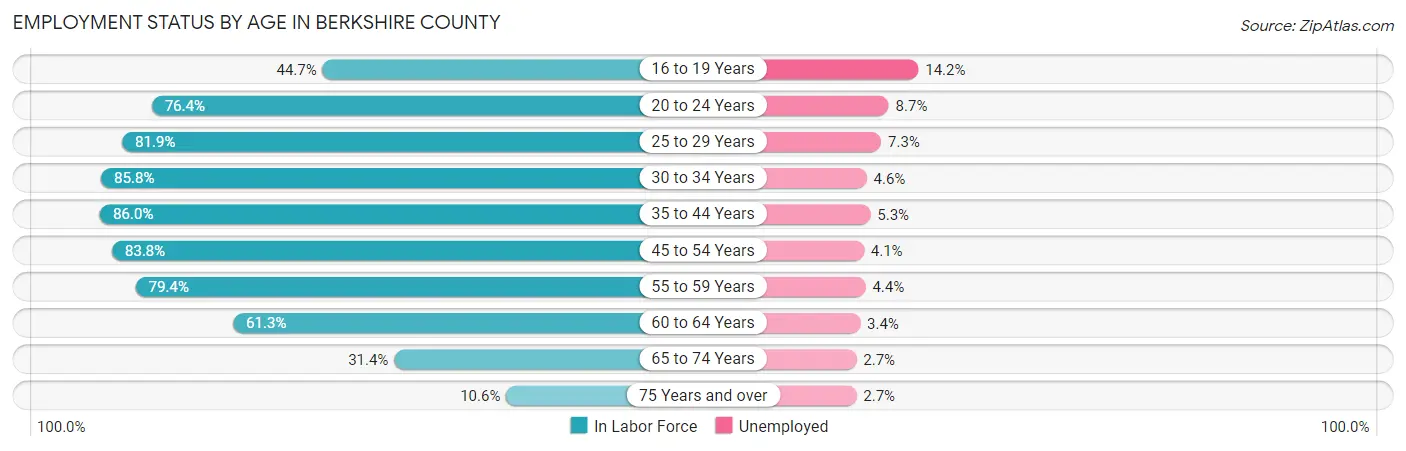
| Age Bracket | In Labor Force | Unemployed |
| 16 to 19 Years | 2,869 (44.7%) | 407 (14.2%) |
| 20 to 24 Years | 6,279 (76.4%) | 546 (8.7%) |
| 25 to 29 Years | 5,660 (81.9%) | 413 (7.3%) |
| 30 to 34 Years | 5,782 (85.8%) | 266 (4.6%) |
| 35 to 44 Years | 12,258 (86.0%) | 650 (5.3%) |
| 45 to 54 Years | 13,205 (83.8%) | 541 (4.1%) |
| 55 to 59 Years | 8,189 (79.4%) | 360 (4.4%) |
| 60 to 64 Years | 6,575 (61.3%) | 224 (3.4%) |
| 65 to 74 Years | 5,564 (31.4%) | 150 (2.7%) |
| 75 Years and over | 1,407 (10.6%) | 38 (2.7%) |
| Total | 67,742 (61.4%) | 3,590 (5.3%) |
Employment Status by Educational Attainment in Berkshire County
According to labor force statistics for Berkshire County, 79.9% of individuals (51,696) out of the total population between 25 and 64 years of age (64,701) are in the labor force, with 4.8% or 2,481 of them being unemployed. The group with the highest labor force participation rate are those with the educational attainment of bachelor's degree or higher, with 88.1% or 21,518 individuals in the labor force. Within the labor force, individuals with less than high school education have the highest percentage of unemployment, with 7.2% or 147 of them being unemployed.
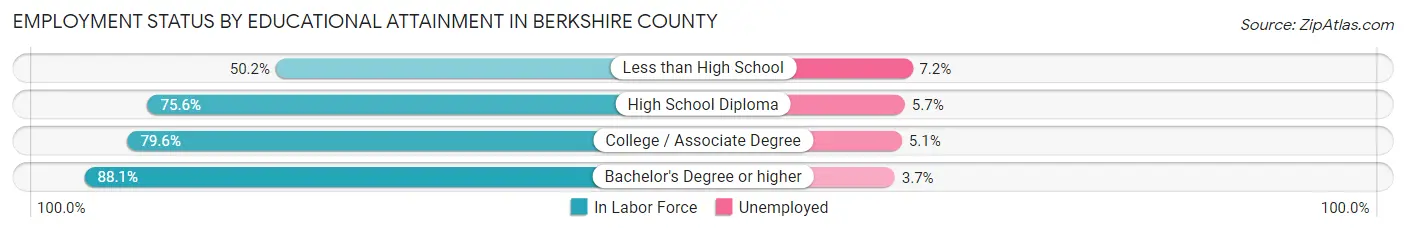
| Educational Attainment | In Labor Force | Unemployed |
| Less than High School | 2,040 (50.2%) | 293 (7.2%) |
| High School Diploma | 13,489 (75.6%) | 1,017 (5.7%) |
| College / Associate Degree | 14,623 (79.6%) | 937 (5.1%) |
| Bachelor's Degree or higher | 21,518 (88.1%) | 904 (3.7%) |
| Total | 51,696 (79.9%) | 3,106 (4.8%) |
Employment Occupations by Sex in Berkshire County
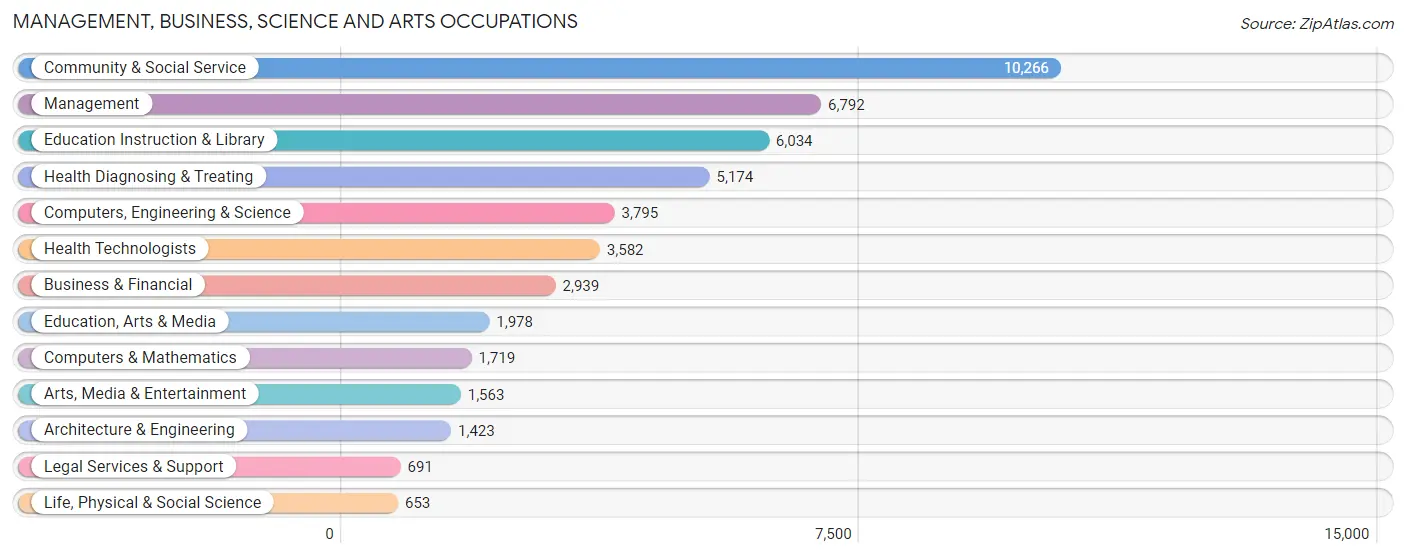
Management, Business, Science and Arts Occupations
The most common Management, Business, Science and Arts occupations in Berkshire County are Community & Social Service (10,266 | 16.0%), Management (6,792 | 10.6%), Education Instruction & Library (6,034 | 9.4%), Health Diagnosing & Treating (5,174 | 8.1%), and Computers, Engineering & Science (3,795 | 5.9%).
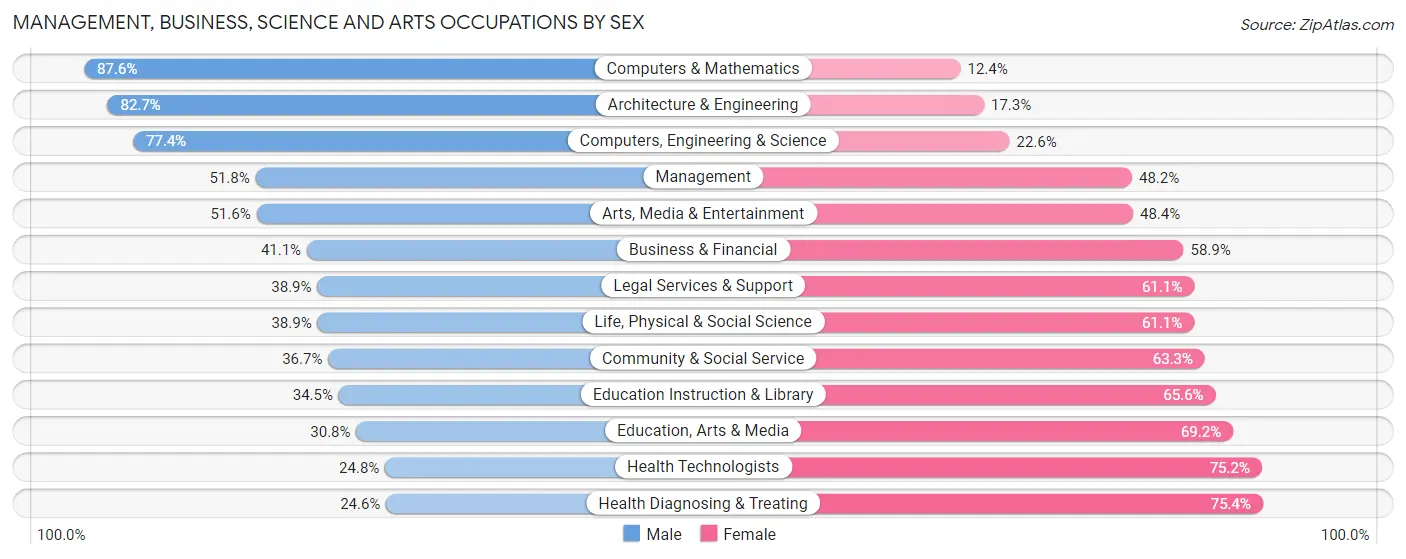
Management, Business, Science and Arts Occupations by Sex
Within the Management, Business, Science and Arts occupations in Berkshire County, the most male-oriented occupations are Computers & Mathematics (87.6%), Architecture & Engineering (82.7%), and Computers, Engineering & Science (77.4%), while the most female-oriented occupations are Health Diagnosing & Treating (75.4%), Health Technologists (75.2%), and Education, Arts & Media (69.2%).
| Occupation | Male | Female |
| Management | 3,520 (51.8%) | 3,272 (48.2%) |
| Business & Financial | 1,208 (41.1%) | 1,731 (58.9%) |
| Computers, Engineering & Science | 2,937 (77.4%) | 858 (22.6%) |
| Computers & Mathematics | 1,506 (87.6%) | 213 (12.4%) |
| Architecture & Engineering | 1,177 (82.7%) | 246 (17.3%) |
| Life, Physical & Social Science | 254 (38.9%) | 399 (61.1%) |
| Community & Social Service | 3,764 (36.7%) | 6,502 (63.3%) |
| Education, Arts & Media | 609 (30.8%) | 1,369 (69.2%) |
| Legal Services & Support | 269 (38.9%) | 422 (61.1%) |
| Education Instruction & Library | 2,079 (34.4%) | 3,955 (65.5%) |
| Arts, Media & Entertainment | 807 (51.6%) | 756 (48.4%) |
| Health Diagnosing & Treating | 1,271 (24.6%) | 3,903 (75.4%) |
| Health Technologists | 888 (24.8%) | 2,694 (75.2%) |
| Total (Category) | 12,700 (43.8%) | 16,266 (56.2%) |
| Total (Overall) | 32,053 (50.0%) | 32,097 (50.0%) |
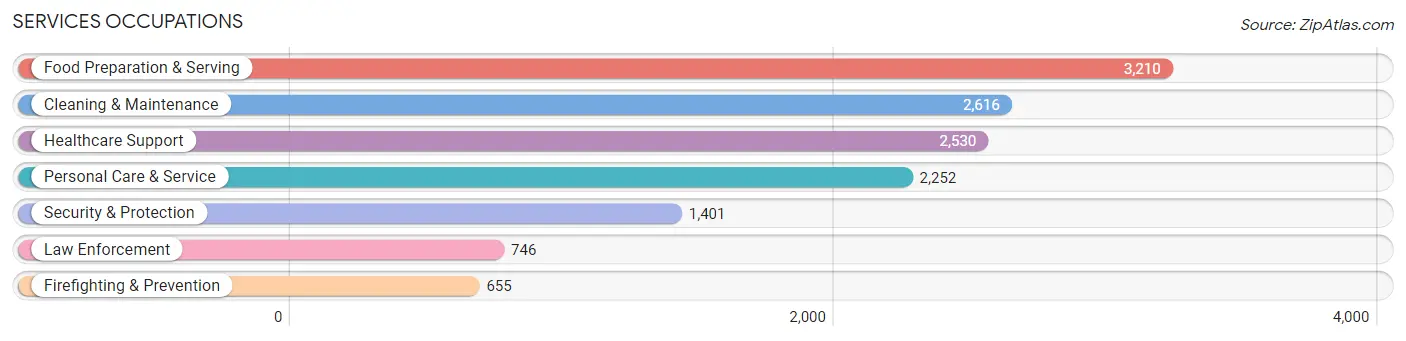
Services Occupations
The most common Services occupations in Berkshire County are Food Preparation & Serving (3,210 | 5.0%), Cleaning & Maintenance (2,616 | 4.1%), Healthcare Support (2,530 | 3.9%), Personal Care & Service (2,252 | 3.5%), and Security & Protection (1,401 | 2.2%).
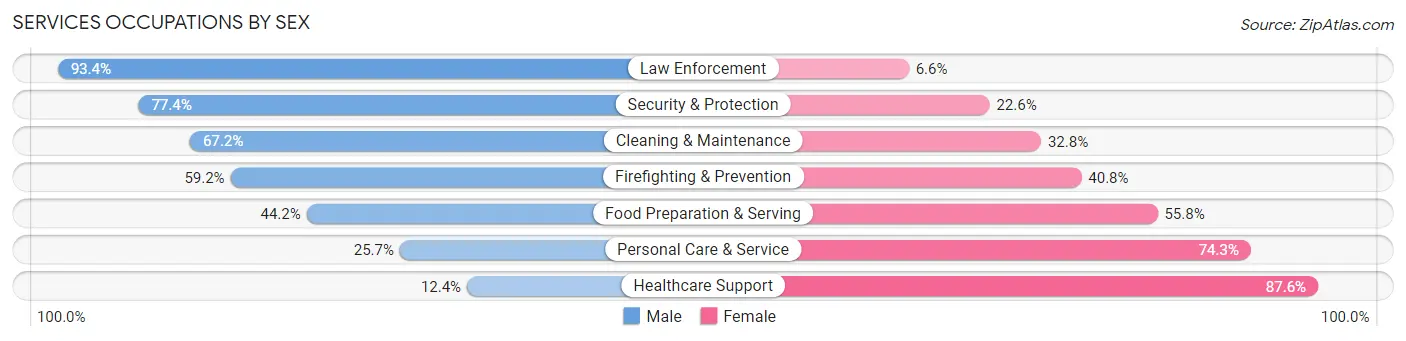
Services Occupations by Sex
Within the Services occupations in Berkshire County, the most male-oriented occupations are Law Enforcement (93.4%), Security & Protection (77.4%), and Cleaning & Maintenance (67.2%), while the most female-oriented occupations are Healthcare Support (87.6%), Personal Care & Service (74.3%), and Food Preparation & Serving (55.8%).
| Occupation | Male | Female |
| Healthcare Support | 314 (12.4%) | 2,216 (87.6%) |
| Security & Protection | 1,085 (77.4%) | 316 (22.6%) |
| Firefighting & Prevention | 388 (59.2%) | 267 (40.8%) |
| Law Enforcement | 697 (93.4%) | 49 (6.6%) |
| Food Preparation & Serving | 1,418 (44.2%) | 1,792 (55.8%) |
| Cleaning & Maintenance | 1,759 (67.2%) | 857 (32.8%) |
| Personal Care & Service | 579 (25.7%) | 1,673 (74.3%) |
| Total (Category) | 5,155 (42.9%) | 6,854 (57.1%) |
| Total (Overall) | 32,053 (50.0%) | 32,097 (50.0%) |
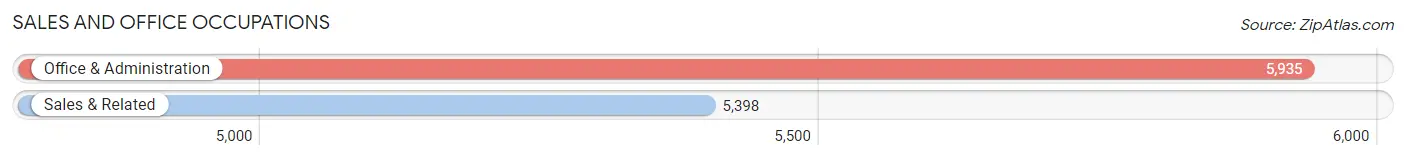
Sales and Office Occupations
The most common Sales and Office occupations in Berkshire County are Office & Administration (5,935 | 9.2%), and Sales & Related (5,398 | 8.4%).
Sales and Office Occupations by Sex
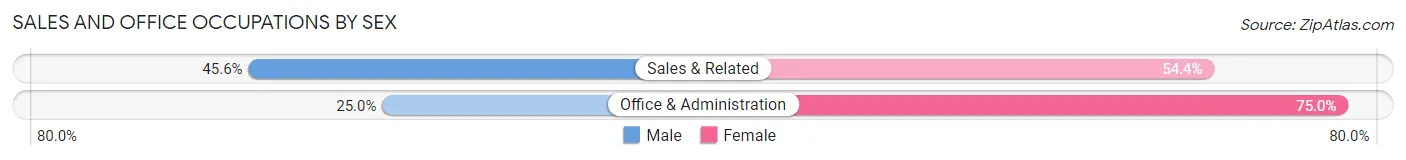
| Occupation | Male | Female |
| Sales & Related | 2,460 (45.6%) | 2,938 (54.4%) |
| Office & Administration | 1,482 (25.0%) | 4,453 (75.0%) |
| Total (Category) | 3,942 (34.8%) | 7,391 (65.2%) |
| Total (Overall) | 32,053 (50.0%) | 32,097 (50.0%) |
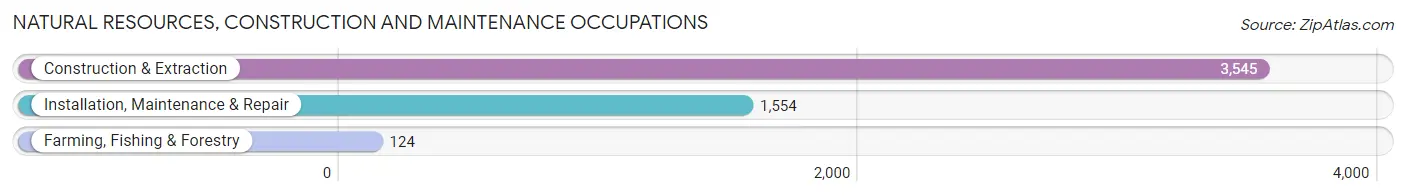
Natural Resources, Construction and Maintenance Occupations
The most common Natural Resources, Construction and Maintenance occupations in Berkshire County are Construction & Extraction (3,545 | 5.5%), Installation, Maintenance & Repair (1,554 | 2.4%), and Farming, Fishing & Forestry (124 | 0.2%).
Natural Resources, Construction and Maintenance Occupations by Sex
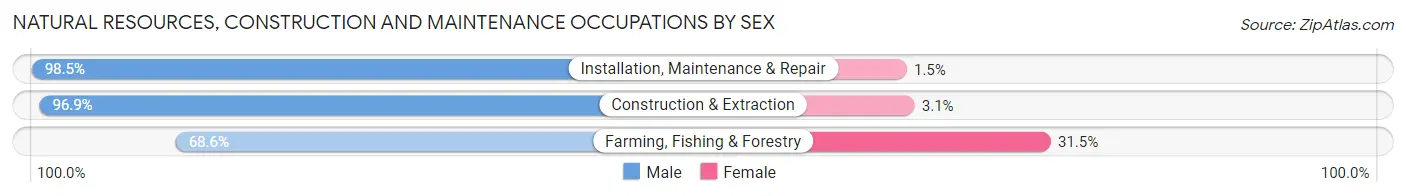
| Occupation | Male | Female |
| Farming, Fishing & Forestry | 85 (68.5%) | 39 (31.5%) |
| Construction & Extraction | 3,435 (96.9%) | 110 (3.1%) |
| Installation, Maintenance & Repair | 1,531 (98.5%) | 23 (1.5%) |
| Total (Category) | 5,051 (96.7%) | 172 (3.3%) |
| Total (Overall) | 32,053 (50.0%) | 32,097 (50.0%) |
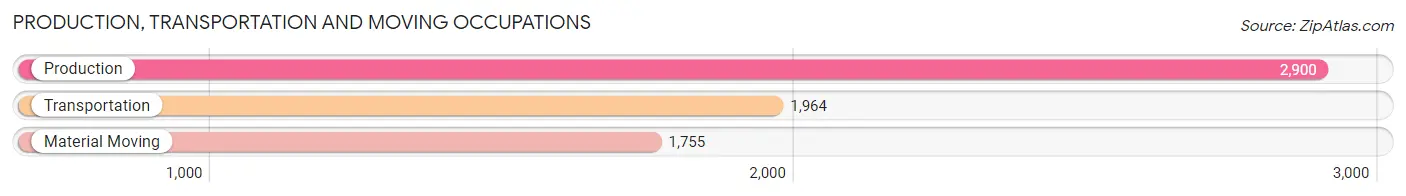
Production, Transportation and Moving Occupations
The most common Production, Transportation and Moving occupations in Berkshire County are Production (2,900 | 4.5%), Transportation (1,964 | 3.1%), and Material Moving (1,755 | 2.7%).
Production, Transportation and Moving Occupations by Sex
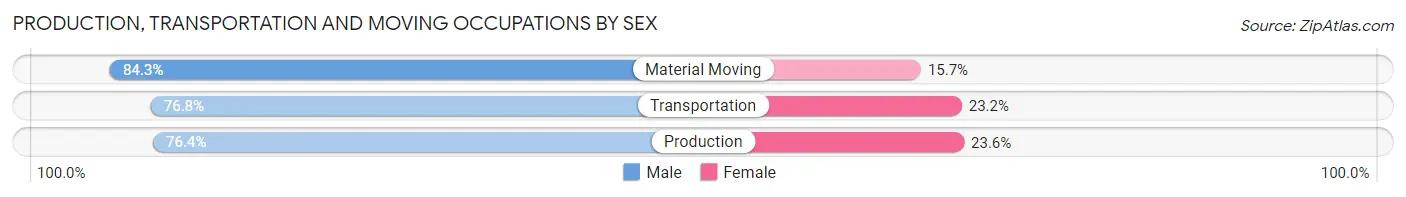
| Occupation | Male | Female |
| Production | 2,216 (76.4%) | 684 (23.6%) |
| Transportation | 1,509 (76.8%) | 455 (23.2%) |
| Material Moving | 1,480 (84.3%) | 275 (15.7%) |
| Total (Category) | 5,205 (78.6%) | 1,414 (21.4%) |
| Total (Overall) | 32,053 (50.0%) | 32,097 (50.0%) |
Employment Industries by Sex in Berkshire County
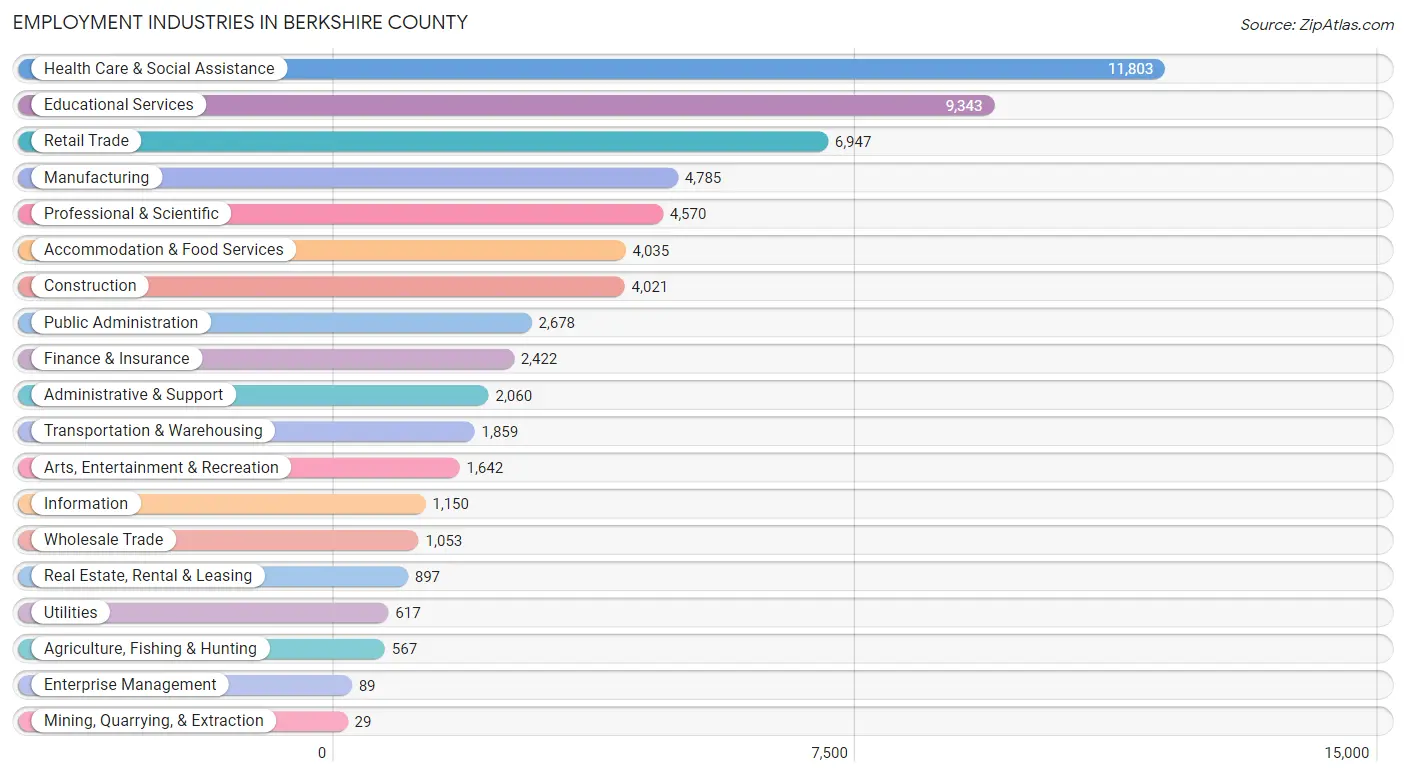
Employment Industries in Berkshire County
The major employment industries in Berkshire County include Health Care & Social Assistance (11,803 | 18.4%), Educational Services (9,343 | 14.6%), Retail Trade (6,947 | 10.8%), Manufacturing (4,785 | 7.5%), and Professional & Scientific (4,570 | 7.1%).
Employment Industries by Sex in Berkshire County
The Berkshire County industries that see more men than women are Mining, Quarrying, & Extraction (100.0%), Utilities (94.7%), and Construction (92.4%), whereas the industries that tend to have a higher number of women are Health Care & Social Assistance (77.5%), Educational Services (60.4%), and Finance & Insurance (59.2%).

| Industry | Male | Female |
| Agriculture, Fishing & Hunting | 275 (48.5%) | 292 (51.5%) |
| Mining, Quarrying, & Extraction | 29 (100.0%) | 0 (0.0%) |
| Construction | 3,714 (92.4%) | 307 (7.6%) |
| Manufacturing | 3,634 (75.9%) | 1,151 (24.0%) |
| Wholesale Trade | 621 (59.0%) | 432 (41.0%) |
| Retail Trade | 3,797 (54.7%) | 3,150 (45.3%) |
| Transportation & Warehousing | 1,181 (63.5%) | 678 (36.5%) |
| Utilities | 584 (94.7%) | 33 (5.3%) |
| Information | 675 (58.7%) | 475 (41.3%) |
| Finance & Insurance | 989 (40.8%) | 1,433 (59.2%) |
| Real Estate, Rental & Leasing | 572 (63.8%) | 325 (36.2%) |
| Professional & Scientific | 2,481 (54.3%) | 2,089 (45.7%) |
| Enterprise Management | 63 (70.8%) | 26 (29.2%) |
| Administrative & Support | 1,334 (64.8%) | 726 (35.2%) |
| Educational Services | 3,701 (39.6%) | 5,642 (60.4%) |
| Health Care & Social Assistance | 2,652 (22.5%) | 9,151 (77.5%) |
| Arts, Entertainment & Recreation | 841 (51.2%) | 801 (48.8%) |
| Accommodation & Food Services | 1,770 (43.9%) | 2,265 (56.1%) |
| Public Administration | 1,595 (59.6%) | 1,083 (40.4%) |
| Total | 32,053 (50.0%) | 32,097 (50.0%) |
Education in Berkshire County
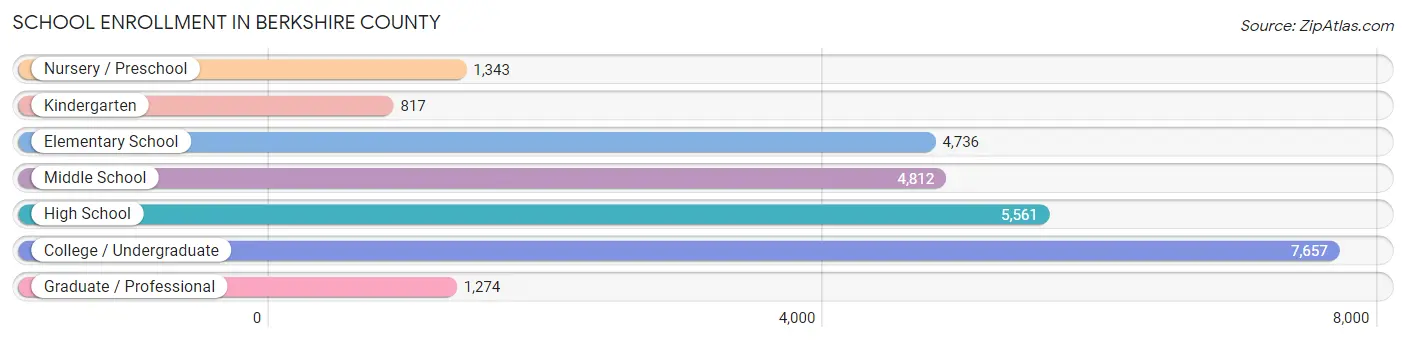
School Enrollment in Berkshire County
The most common levels of schooling among the 26,200 students in Berkshire County are college / undergraduate (7,657 | 29.2%), high school (5,561 | 21.2%), and middle school (4,812 | 18.4%).
| School Level | # Students | % Students |
| Nursery / Preschool | 1,343 | 5.1% |
| Kindergarten | 817 | 3.1% |
| Elementary School | 4,736 | 18.1% |
| Middle School | 4,812 | 18.4% |
| High School | 5,561 | 21.2% |
| College / Undergraduate | 7,657 | 29.2% |
| Graduate / Professional | 1,274 | 4.9% |
| Total | 26,200 | 100.0% |
School Enrollment by Age by Funding Source in Berkshire County
Out of a total of 26,200 students who are enrolled in schools in Berkshire County, 6,105 (23.3%) attend a private institution, while the remaining 20,095 (76.7%) are enrolled in public schools. The age group of 20 to 24 year olds has the highest likelihood of being enrolled in private schools, with 1,834 (49.8% in the age bracket) enrolled. Conversely, the age group of 10 to 14 year olds has the lowest likelihood of being enrolled in a private school, with 5,440 (90.6% in the age bracket) attending a public institution.
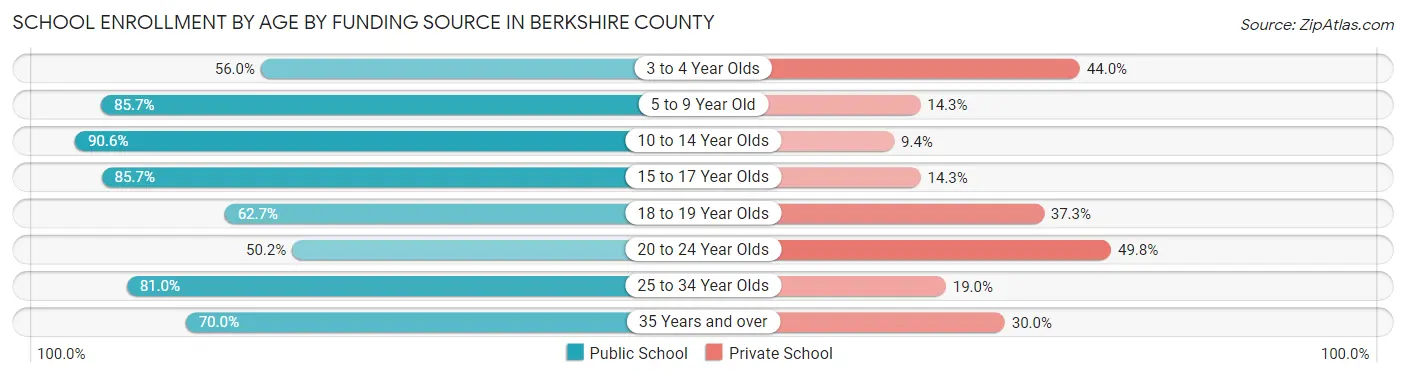
| Age Bracket | Public School | Private School |
| 3 to 4 Year Olds | 588 (56.0%) | 462 (44.0%) |
| 5 to 9 Year Old | 4,530 (85.7%) | 754 (14.3%) |
| 10 to 14 Year Olds | 5,440 (90.6%) | 564 (9.4%) |
| 15 to 17 Year Olds | 3,540 (85.7%) | 592 (14.3%) |
| 18 to 19 Year Olds | 1,933 (62.7%) | 1,149 (37.3%) |
| 20 to 24 Year Olds | 1,848 (50.2%) | 1,834 (49.8%) |
| 25 to 34 Year Olds | 1,056 (81.0%) | 248 (19.0%) |
| 35 Years and over | 1,163 (70.0%) | 499 (30.0%) |
| Total | 20,095 (76.7%) | 6,105 (23.3%) |
Educational Attainment by Field of Study in Berkshire County
Business (4,832 | 12.1%), education (4,313 | 10.8%), social sciences (4,094 | 10.2%), science & technology (3,563 | 8.9%), and liberal arts & history (3,264 | 8.2%) are the most common fields of study among 40,051 individuals in Berkshire County who have obtained a bachelor's degree or higher.
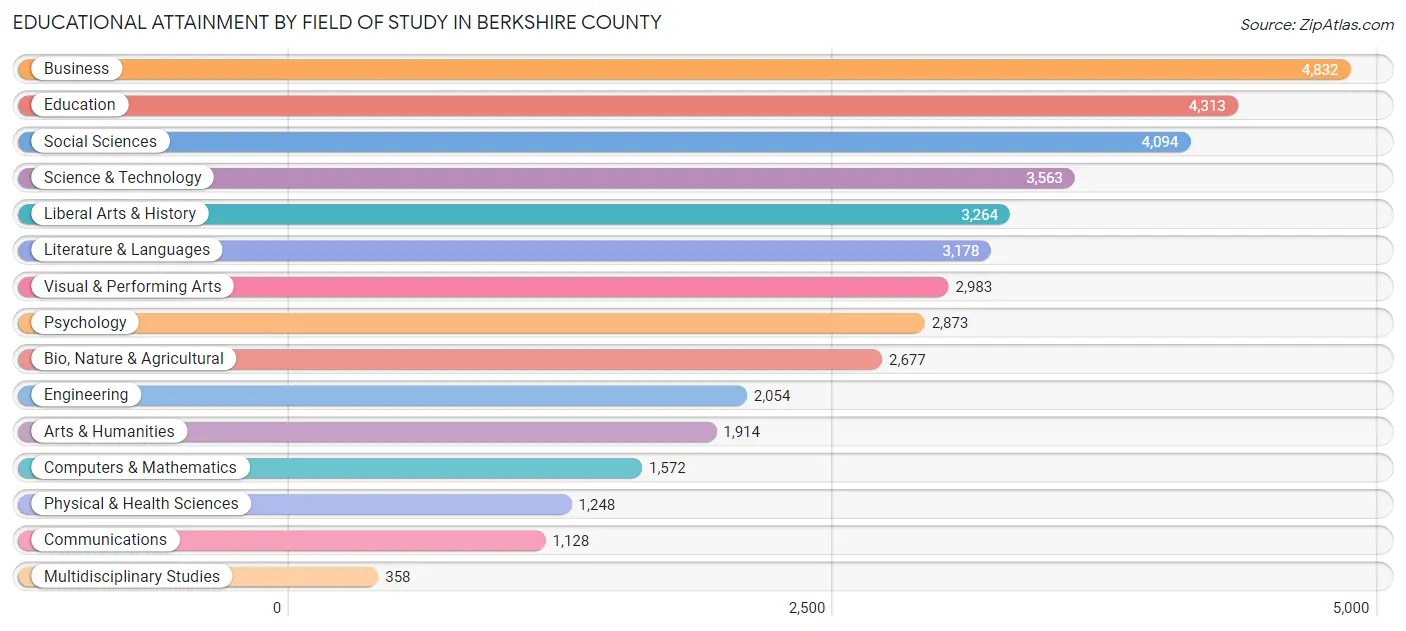
| Field of Study | # Graduates | % Graduates |
| Computers & Mathematics | 1,572 | 3.9% |
| Bio, Nature & Agricultural | 2,677 | 6.7% |
| Physical & Health Sciences | 1,248 | 3.1% |
| Psychology | 2,873 | 7.2% |
| Social Sciences | 4,094 | 10.2% |
| Engineering | 2,054 | 5.1% |
| Multidisciplinary Studies | 358 | 0.9% |
| Science & Technology | 3,563 | 8.9% |
| Business | 4,832 | 12.1% |
| Education | 4,313 | 10.8% |
| Literature & Languages | 3,178 | 7.9% |
| Liberal Arts & History | 3,264 | 8.2% |
| Visual & Performing Arts | 2,983 | 7.4% |
| Communications | 1,128 | 2.8% |
| Arts & Humanities | 1,914 | 4.8% |
| Total | 40,051 | 100.0% |
Transportation & Commute in Berkshire County
Vehicle Availability by Sex in Berkshire County
The most prevalent vehicle ownership categories in Berkshire County are males with 2 vehicles (14,274, accounting for 46.7%) and females with 2 vehicles (12,794, making up 47.8%).
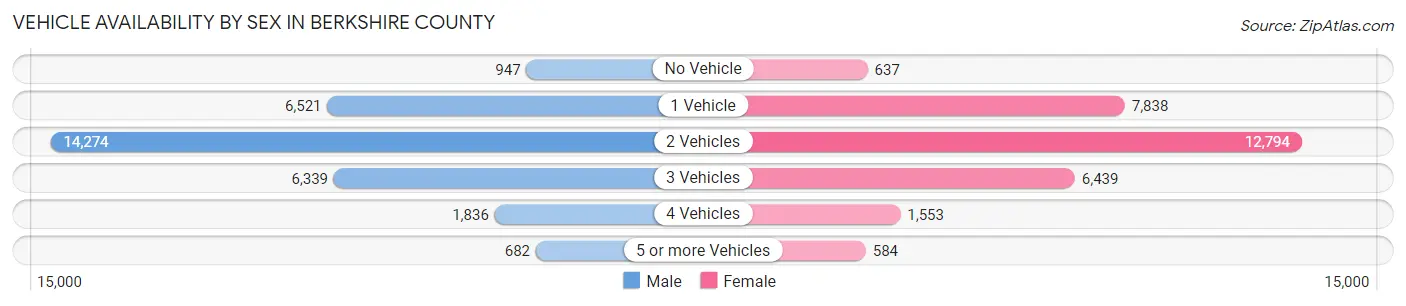
| Vehicles Available | Male | Female |
| No Vehicle | 947 (3.1%) | 637 (2.1%) |
| 1 Vehicle | 6,521 (21.3%) | 7,838 (26.3%) |
| 2 Vehicles | 14,274 (46.7%) | 12,794 (42.9%) |
| 3 Vehicles | 6,339 (20.7%) | 6,439 (21.6%) |
| 4 Vehicles | 1,836 (6.0%) | 1,553 (5.2%) |
| 5 or more Vehicles | 682 (2.2%) | 584 (2.0%) |
| Total | 30,599 (100.0%) | 29,845 (100.0%) |
Commute Time in Berkshire County
The most frequently occuring commute durations in Berkshire County are 10 to 14 minutes (11,696 commuters, 21.0%), 5 to 9 minutes (9,704 commuters, 17.5%), and 15 to 19 minutes (9,190 commuters, 16.5%).
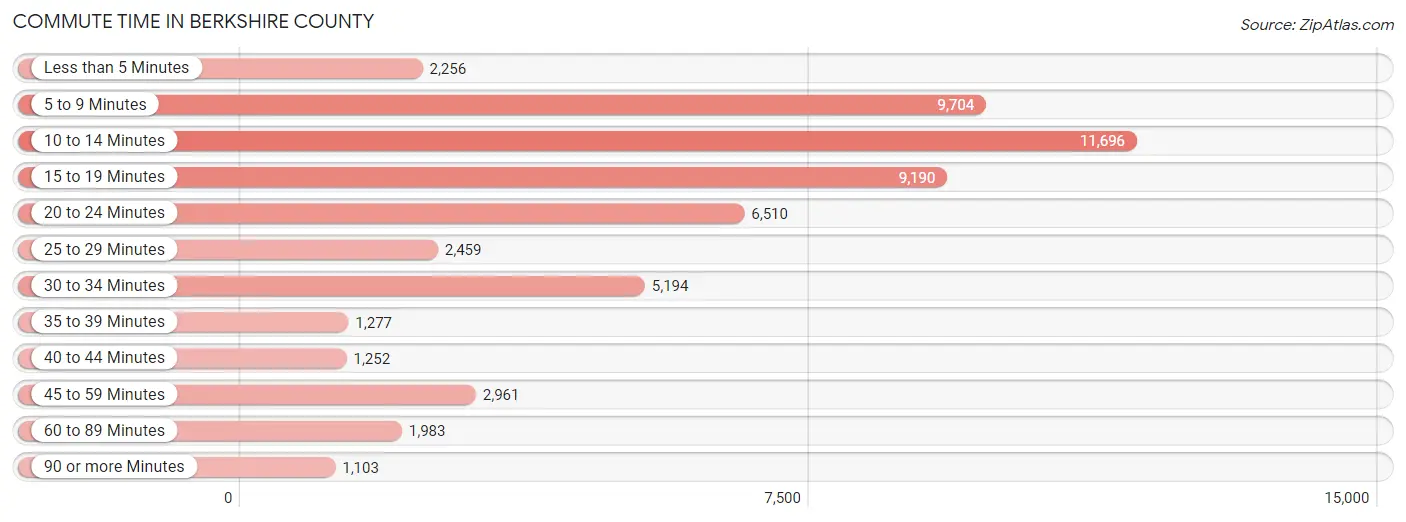
| Commute Time | # Commuters | % Commuters |
| Less than 5 Minutes | 2,256 | 4.1% |
| 5 to 9 Minutes | 9,704 | 17.5% |
| 10 to 14 Minutes | 11,696 | 21.0% |
| 15 to 19 Minutes | 9,190 | 16.5% |
| 20 to 24 Minutes | 6,510 | 11.7% |
| 25 to 29 Minutes | 2,459 | 4.4% |
| 30 to 34 Minutes | 5,194 | 9.3% |
| 35 to 39 Minutes | 1,277 | 2.3% |
| 40 to 44 Minutes | 1,252 | 2.2% |
| 45 to 59 Minutes | 2,961 | 5.3% |
| 60 to 89 Minutes | 1,983 | 3.6% |
| 90 or more Minutes | 1,103 | 2.0% |
Commute Time by Sex in Berkshire County
The most common commute times in Berkshire County are 10 to 14 minutes (5,892 commuters, 20.6%) for males and 10 to 14 minutes (5,804 commuters, 21.5%) for females.
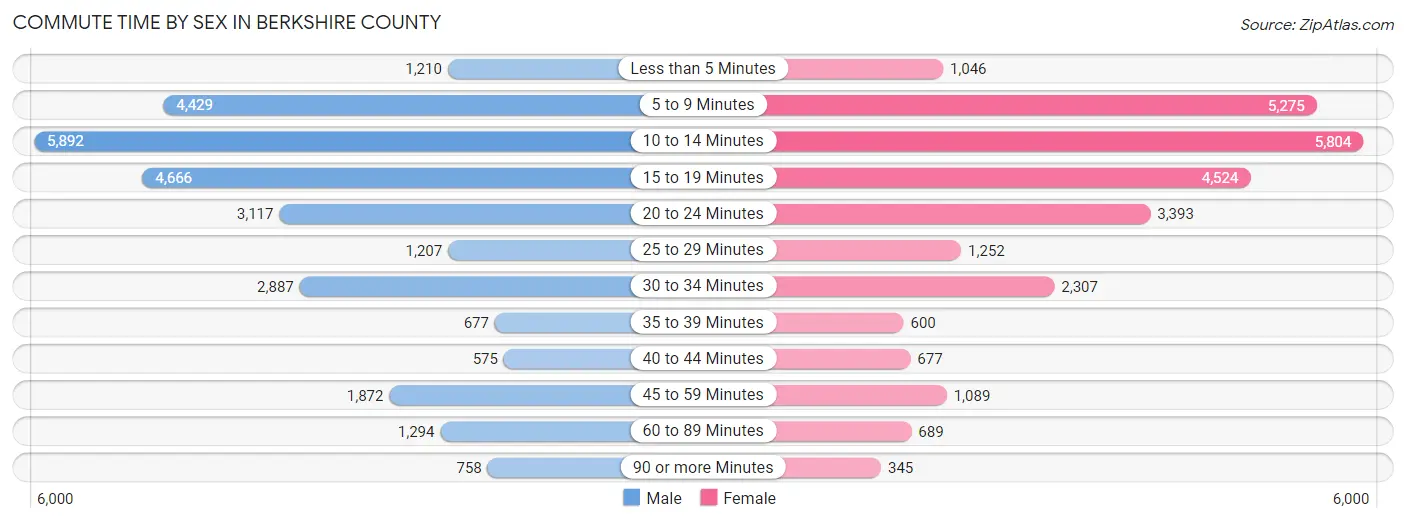
| Commute Time | Male | Female |
| Less than 5 Minutes | 1,210 (4.2%) | 1,046 (3.9%) |
| 5 to 9 Minutes | 4,429 (15.5%) | 5,275 (19.5%) |
| 10 to 14 Minutes | 5,892 (20.6%) | 5,804 (21.5%) |
| 15 to 19 Minutes | 4,666 (16.3%) | 4,524 (16.8%) |
| 20 to 24 Minutes | 3,117 (10.9%) | 3,393 (12.6%) |
| 25 to 29 Minutes | 1,207 (4.2%) | 1,252 (4.6%) |
| 30 to 34 Minutes | 2,887 (10.1%) | 2,307 (8.5%) |
| 35 to 39 Minutes | 677 (2.4%) | 600 (2.2%) |
| 40 to 44 Minutes | 575 (2.0%) | 677 (2.5%) |
| 45 to 59 Minutes | 1,872 (6.6%) | 1,089 (4.0%) |
| 60 to 89 Minutes | 1,294 (4.5%) | 689 (2.5%) |
| 90 or more Minutes | 758 (2.6%) | 345 (1.3%) |
Time of Departure to Work by Sex in Berkshire County
The most frequent times of departure to work in Berkshire County are 7:00 AM to 7:29 AM (3,706, 13.0%) for males and 7:30 AM to 7:59 AM (4,400, 16.3%) for females.
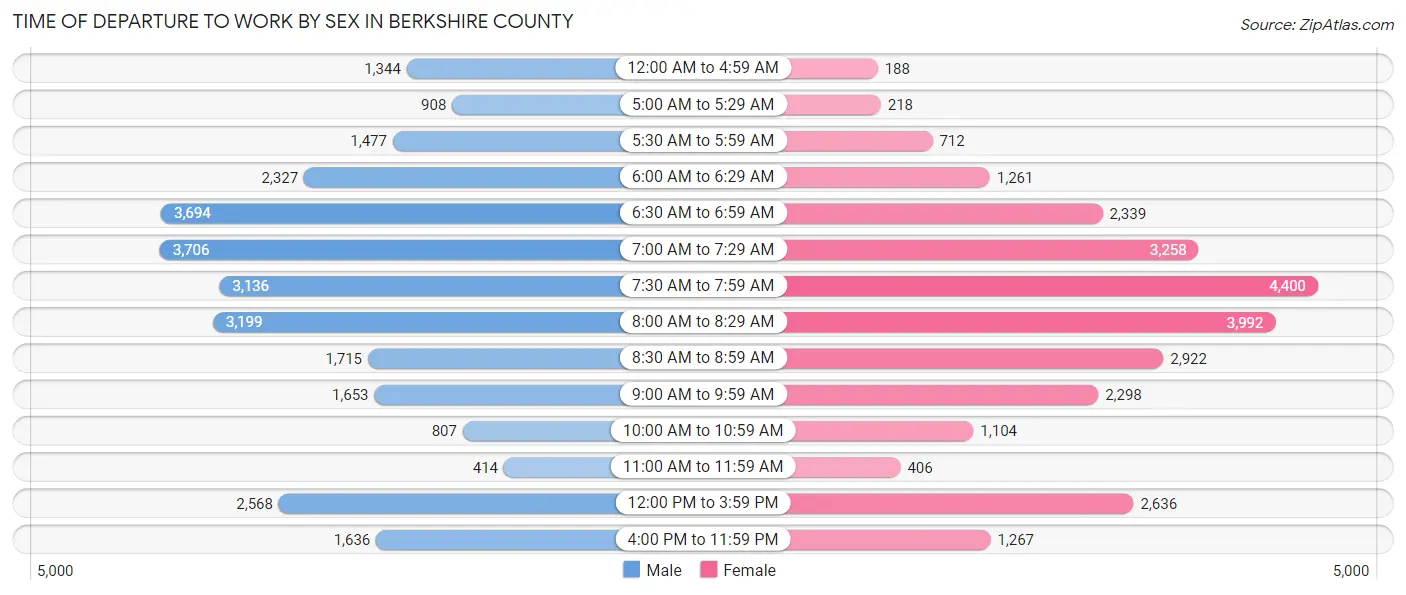
| Time of Departure | Male | Female |
| 12:00 AM to 4:59 AM | 1,344 (4.7%) | 188 (0.7%) |
| 5:00 AM to 5:29 AM | 908 (3.2%) | 218 (0.8%) |
| 5:30 AM to 5:59 AM | 1,477 (5.2%) | 712 (2.6%) |
| 6:00 AM to 6:29 AM | 2,327 (8.1%) | 1,261 (4.7%) |
| 6:30 AM to 6:59 AM | 3,694 (12.9%) | 2,339 (8.7%) |
| 7:00 AM to 7:29 AM | 3,706 (13.0%) | 3,258 (12.1%) |
| 7:30 AM to 7:59 AM | 3,136 (11.0%) | 4,400 (16.3%) |
| 8:00 AM to 8:29 AM | 3,199 (11.2%) | 3,992 (14.8%) |
| 8:30 AM to 8:59 AM | 1,715 (6.0%) | 2,922 (10.8%) |
| 9:00 AM to 9:59 AM | 1,653 (5.8%) | 2,298 (8.5%) |
| 10:00 AM to 10:59 AM | 807 (2.8%) | 1,104 (4.1%) |
| 11:00 AM to 11:59 AM | 414 (1.5%) | 406 (1.5%) |
| 12:00 PM to 3:59 PM | 2,568 (9.0%) | 2,636 (9.8%) |
| 4:00 PM to 11:59 PM | 1,636 (5.7%) | 1,267 (4.7%) |
| Total | 28,584 (100.0%) | 27,001 (100.0%) |
Housing Occupancy in Berkshire County
Occupancy by Ownership in Berkshire County
Of the total 56,078 dwellings in Berkshire County, owner-occupied units account for 39,380 (70.2%), while renter-occupied units make up 16,698 (29.8%).
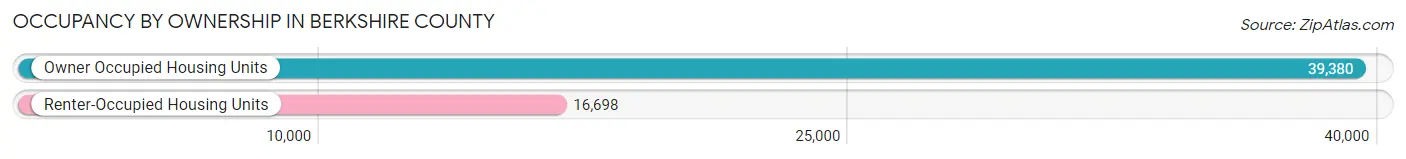
| Occupancy | # Housing Units | % Housing Units |
| Owner Occupied Housing Units | 39,380 | 70.2% |
| Renter-Occupied Housing Units | 16,698 | 29.8% |
| Total Occupied Housing Units | 56,078 | 100.0% |
Occupancy by Household Size in Berkshire County
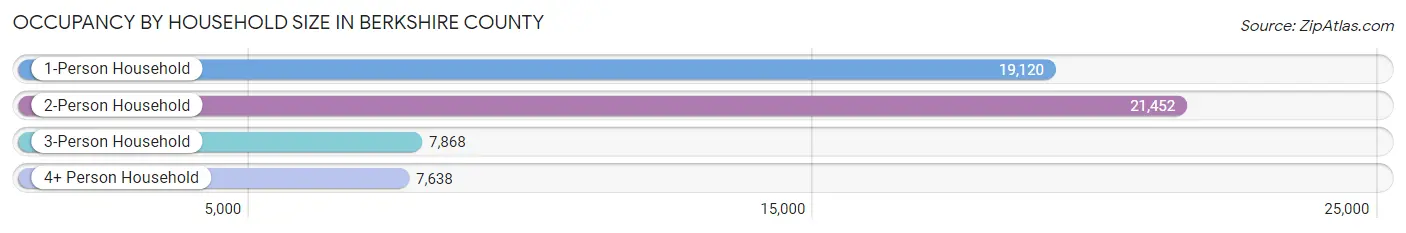
| Household Size | # Housing Units | % Housing Units |
| 1-Person Household | 19,120 | 34.1% |
| 2-Person Household | 21,452 | 38.3% |
| 3-Person Household | 7,868 | 14.0% |
| 4+ Person Household | 7,638 | 13.6% |
| Total Housing Units | 56,078 | 100.0% |
Occupancy by Ownership by Household Size in Berkshire County
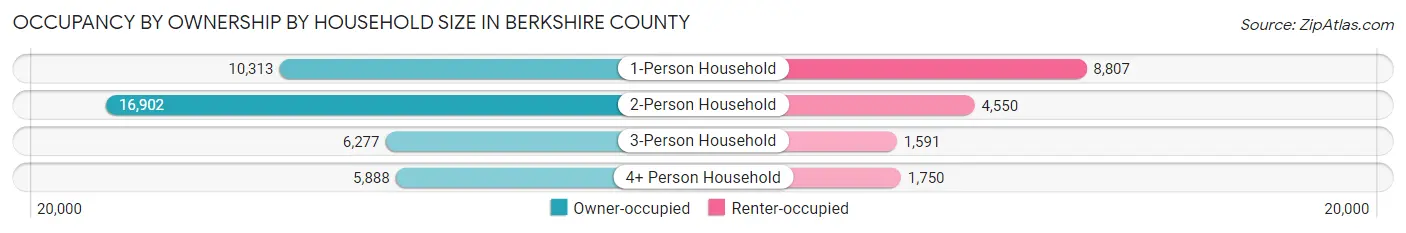
| Household Size | Owner-occupied | Renter-occupied |
| 1-Person Household | 10,313 (53.9%) | 8,807 (46.1%) |
| 2-Person Household | 16,902 (78.8%) | 4,550 (21.2%) |
| 3-Person Household | 6,277 (79.8%) | 1,591 (20.2%) |
| 4+ Person Household | 5,888 (77.1%) | 1,750 (22.9%) |
| Total Housing Units | 39,380 (70.2%) | 16,698 (29.8%) |
Occupancy by Educational Attainment in Berkshire County
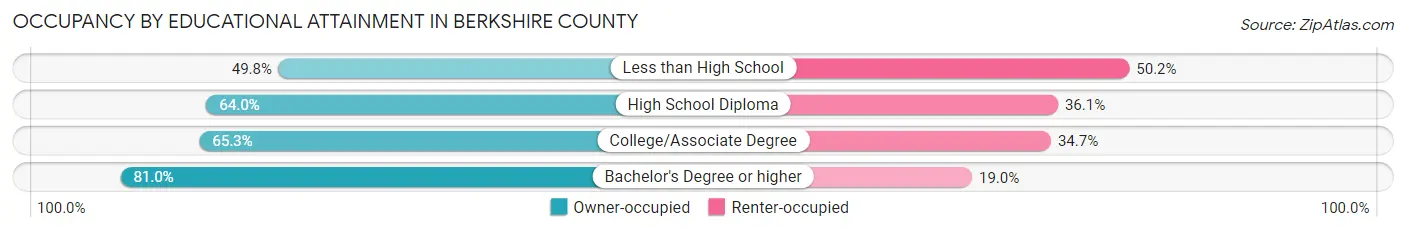
| Household Size | Owner-occupied | Renter-occupied |
| Less than High School | 1,495 (49.8%) | 1,507 (50.2%) |
| High School Diploma | 9,338 (63.9%) | 5,263 (36.0%) |
| College/Associate Degree | 10,908 (65.3%) | 5,787 (34.7%) |
| Bachelor's Degree or higher | 17,639 (81.0%) | 4,141 (19.0%) |
Occupancy by Age of Householder in Berkshire County
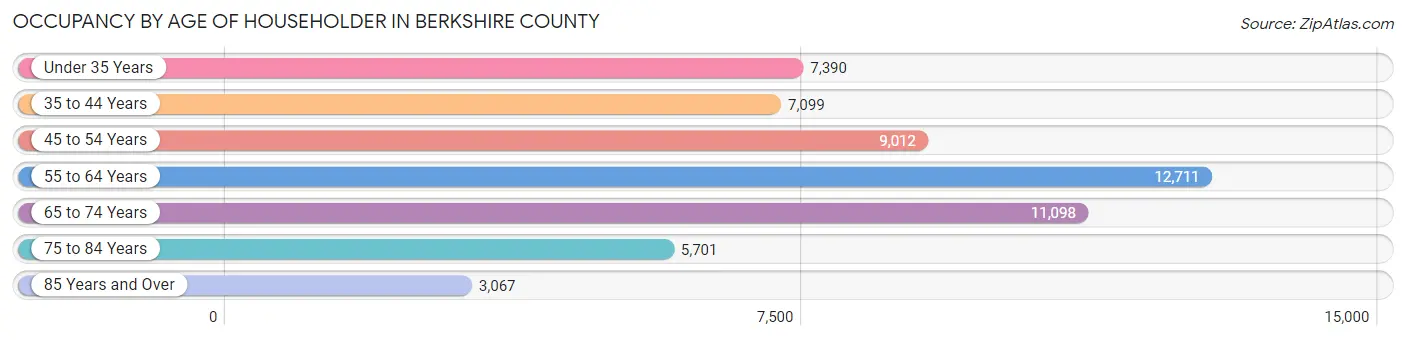
| Age Bracket | # Households | % Households |
| Under 35 Years | 7,390 | 13.2% |
| 35 to 44 Years | 7,099 | 12.7% |
| 45 to 54 Years | 9,012 | 16.1% |
| 55 to 64 Years | 12,711 | 22.7% |
| 65 to 74 Years | 11,098 | 19.8% |
| 75 to 84 Years | 5,701 | 10.2% |
| 85 Years and Over | 3,067 | 5.5% |
| Total | 56,078 | 100.0% |
Housing Finances in Berkshire County
Median Income by Occupancy in Berkshire County
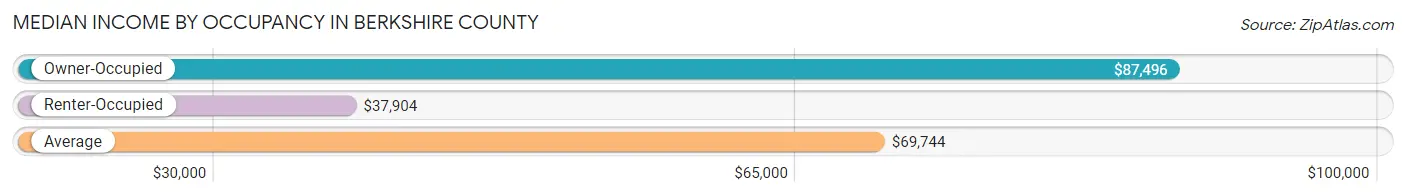
| Occupancy Type | # Households | Median Income |
| Owner-Occupied | 39,380 (70.2%) | $87,496 |
| Renter-Occupied | 16,698 (29.8%) | $37,904 |
| Average | 56,078 (100.0%) | $69,744 |
Occupancy by Householder Income Bracket in Berkshire County
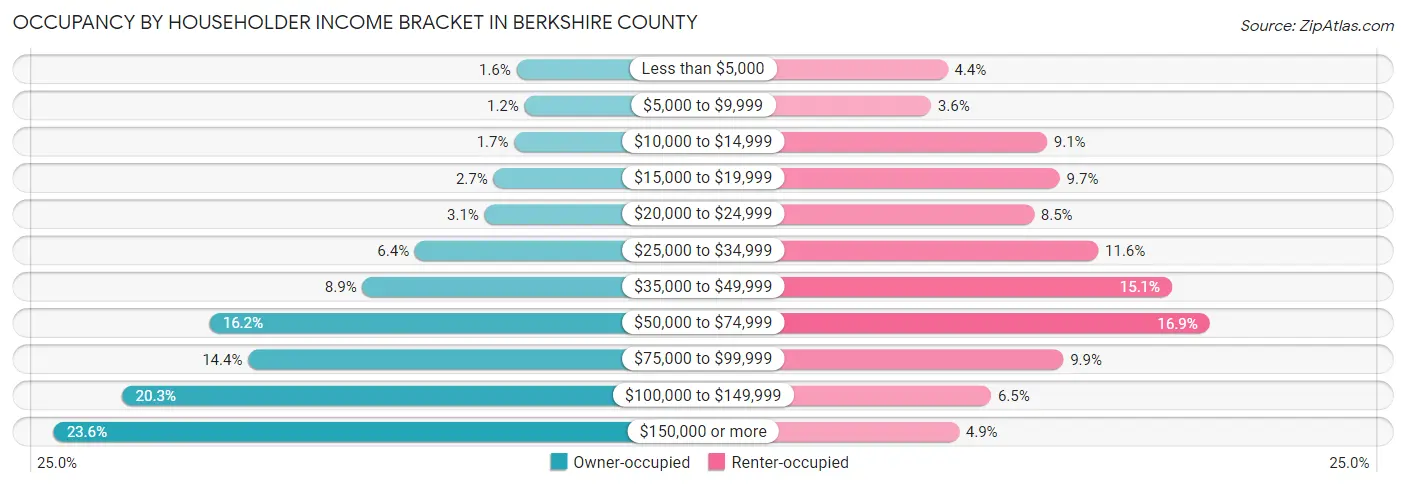
| Income Bracket | Owner-occupied | Renter-occupied |
| Less than $5,000 | 619 (1.6%) | 731 (4.4%) |
| $5,000 to $9,999 | 467 (1.2%) | 599 (3.6%) |
| $10,000 to $14,999 | 662 (1.7%) | 1,521 (9.1%) |
| $15,000 to $19,999 | 1,053 (2.7%) | 1,623 (9.7%) |
| $20,000 to $24,999 | 1,215 (3.1%) | 1,418 (8.5%) |
| $25,000 to $34,999 | 2,526 (6.4%) | 1,928 (11.6%) |
| $35,000 to $49,999 | 3,510 (8.9%) | 2,514 (15.1%) |
| $50,000 to $74,999 | 6,372 (16.2%) | 2,815 (16.9%) |
| $75,000 to $99,999 | 5,652 (14.3%) | 1,651 (9.9%) |
| $100,000 to $149,999 | 8,006 (20.3%) | 1,077 (6.5%) |
| $150,000 or more | 9,298 (23.6%) | 821 (4.9%) |
| Total | 39,380 (100.0%) | 16,698 (100.0%) |
Monthly Housing Cost Tiers in Berkshire County
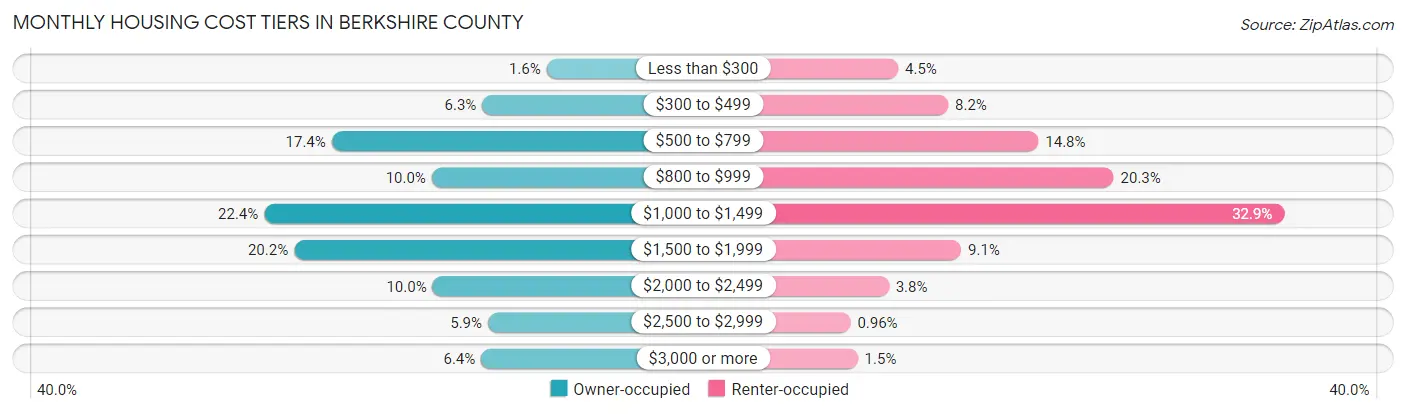
| Monthly Cost | Owner-occupied | Renter-occupied |
| Less than $300 | 615 (1.6%) | 746 (4.5%) |
| $300 to $499 | 2,479 (6.3%) | 1,361 (8.2%) |
| $500 to $799 | 6,847 (17.4%) | 2,471 (14.8%) |
| $800 to $999 | 3,944 (10.0%) | 3,397 (20.3%) |
| $1,000 to $1,499 | 8,804 (22.4%) | 5,494 (32.9%) |
| $1,500 to $1,999 | 7,940 (20.2%) | 1,522 (9.1%) |
| $2,000 to $2,499 | 3,923 (10.0%) | 632 (3.8%) |
| $2,500 to $2,999 | 2,317 (5.9%) | 160 (1.0%) |
| $3,000 or more | 2,511 (6.4%) | 249 (1.5%) |
| Total | 39,380 (100.0%) | 16,698 (100.0%) |
Physical Housing Characteristics in Berkshire County
Housing Structures in Berkshire County
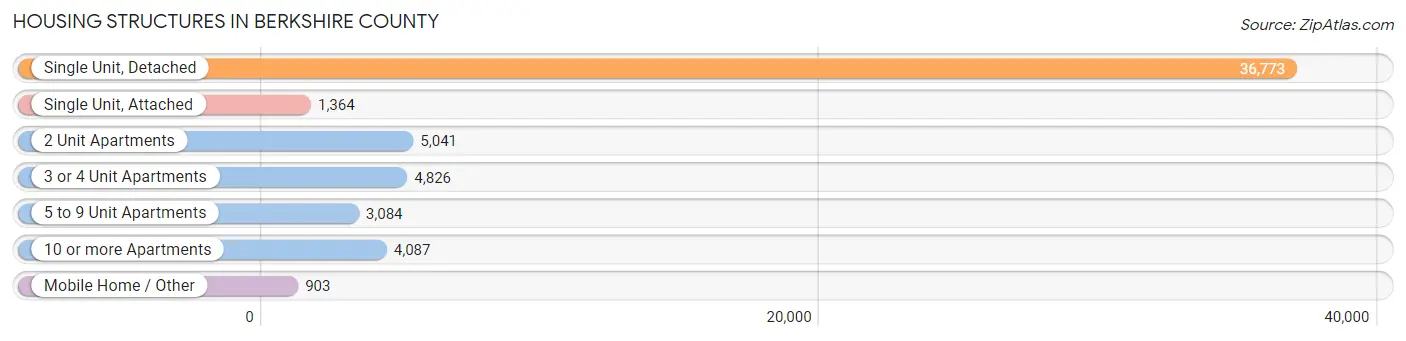
| Structure Type | # Housing Units | % Housing Units |
| Single Unit, Detached | 36,773 | 65.6% |
| Single Unit, Attached | 1,364 | 2.4% |
| 2 Unit Apartments | 5,041 | 9.0% |
| 3 or 4 Unit Apartments | 4,826 | 8.6% |
| 5 to 9 Unit Apartments | 3,084 | 5.5% |
| 10 or more Apartments | 4,087 | 7.3% |
| Mobile Home / Other | 903 | 1.6% |
| Total | 56,078 | 100.0% |
Housing Structures by Occupancy in Berkshire County
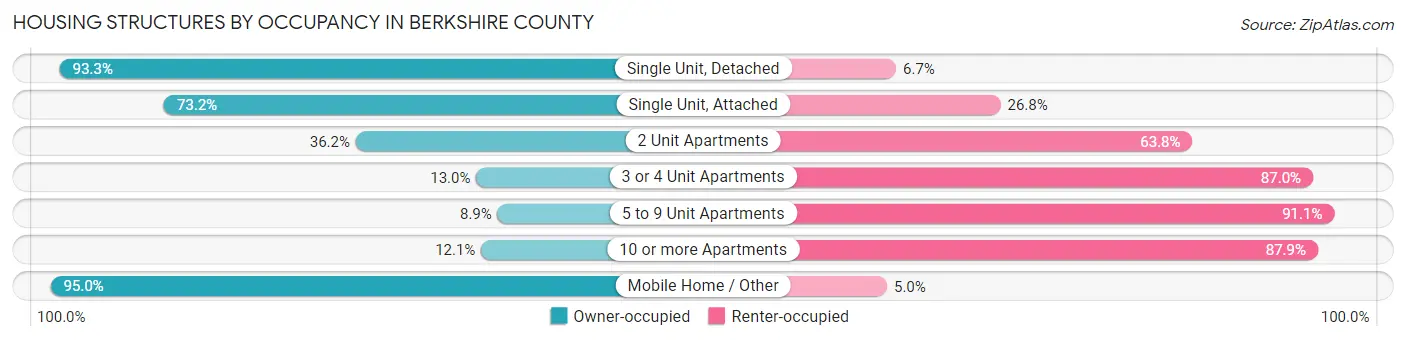
| Structure Type | Owner-occupied | Renter-occupied |
| Single Unit, Detached | 34,299 (93.3%) | 2,474 (6.7%) |
| Single Unit, Attached | 998 (73.2%) | 366 (26.8%) |
| 2 Unit Apartments | 1,827 (36.2%) | 3,214 (63.8%) |
| 3 or 4 Unit Apartments | 629 (13.0%) | 4,197 (87.0%) |
| 5 to 9 Unit Apartments | 275 (8.9%) | 2,809 (91.1%) |
| 10 or more Apartments | 494 (12.1%) | 3,593 (87.9%) |
| Mobile Home / Other | 858 (95.0%) | 45 (5.0%) |
| Total | 39,380 (70.2%) | 16,698 (29.8%) |
Housing Structures by Number of Rooms in Berkshire County
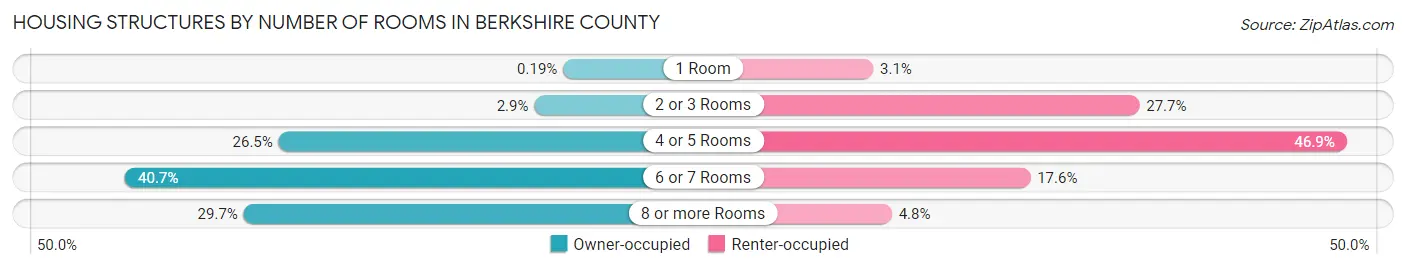
| Number of Rooms | Owner-occupied | Renter-occupied |
| 1 Room | 73 (0.2%) | 513 (3.1%) |
| 2 or 3 Rooms | 1,128 (2.9%) | 4,623 (27.7%) |
| 4 or 5 Rooms | 10,440 (26.5%) | 7,824 (46.9%) |
| 6 or 7 Rooms | 16,028 (40.7%) | 2,939 (17.6%) |
| 8 or more Rooms | 11,711 (29.7%) | 799 (4.8%) |
| Total | 39,380 (100.0%) | 16,698 (100.0%) |
Housing Structure by Heating Type in Berkshire County
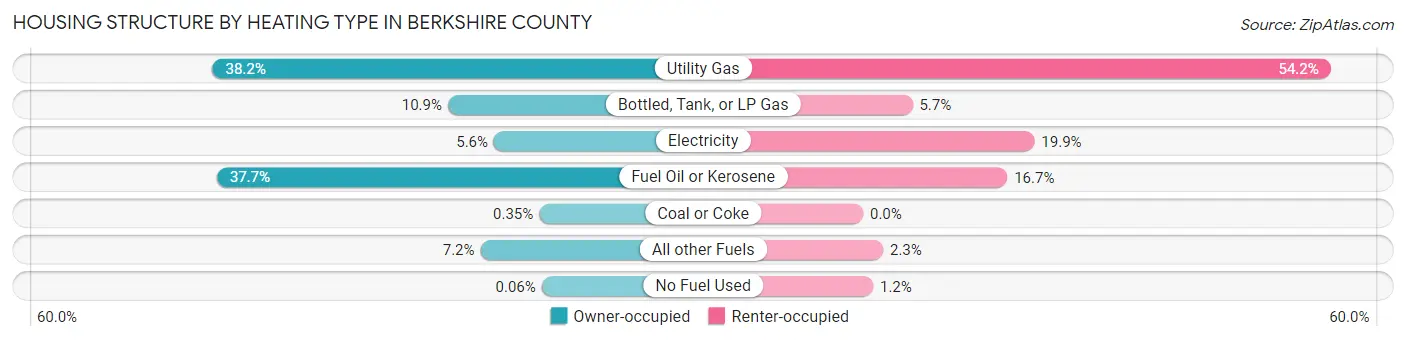
| Heating Type | Owner-occupied | Renter-occupied |
| Utility Gas | 15,044 (38.2%) | 9,051 (54.2%) |
| Bottled, Tank, or LP Gas | 4,306 (10.9%) | 956 (5.7%) |
| Electricity | 2,202 (5.6%) | 3,318 (19.9%) |
| Fuel Oil or Kerosene | 14,849 (37.7%) | 2,792 (16.7%) |
| Coal or Coke | 136 (0.4%) | 0 (0.0%) |
| All other Fuels | 2,821 (7.2%) | 388 (2.3%) |
| No Fuel Used | 22 (0.1%) | 193 (1.2%) |
| Total | 39,380 (100.0%) | 16,698 (100.0%) |
Household Vehicle Usage in Berkshire County
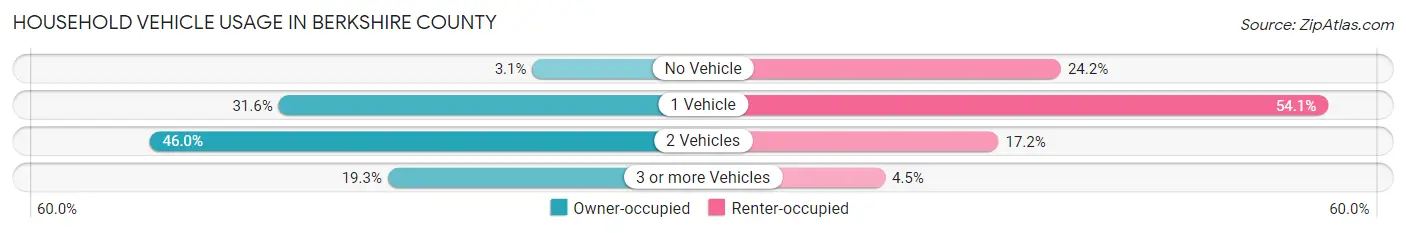
| Vehicles per Household | Owner-occupied | Renter-occupied |
| No Vehicle | 1,234 (3.1%) | 4,041 (24.2%) |
| 1 Vehicle | 12,429 (31.6%) | 9,035 (54.1%) |
| 2 Vehicles | 18,109 (46.0%) | 2,873 (17.2%) |
| 3 or more Vehicles | 7,608 (19.3%) | 749 (4.5%) |
| Total | 39,380 (100.0%) | 16,698 (100.0%) |
Real Estate & Mortgages in Berkshire County
Real Estate and Mortgage Overview in Berkshire County
| Characteristic | Without Mortgage | With Mortgage |
| Housing Units | 15,563 | 23,817 |
| Median Property Value | $248,900 | $277,200 |
| Median Household Income | $68,290 | $6,382 |
| Monthly Housing Costs | $728 | $2,440 |
| Real Estate Taxes | $3,731 | $263 |
Property Value by Mortgage Status in Berkshire County
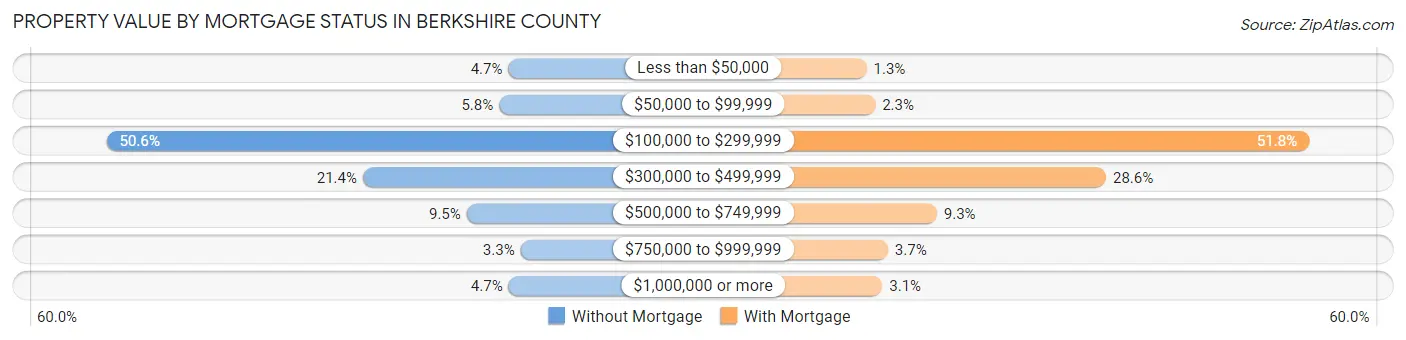
| Property Value | Without Mortgage | With Mortgage |
| Less than $50,000 | 734 (4.7%) | 300 (1.3%) |
| $50,000 to $99,999 | 900 (5.8%) | 536 (2.2%) |
| $100,000 to $299,999 | 7,881 (50.6%) | 12,341 (51.8%) |
| $300,000 to $499,999 | 3,323 (21.3%) | 6,818 (28.6%) |
| $500,000 to $749,999 | 1,476 (9.5%) | 2,212 (9.3%) |
| $750,000 to $999,999 | 518 (3.3%) | 881 (3.7%) |
| $1,000,000 or more | 731 (4.7%) | 729 (3.1%) |
| Total | 15,563 (100.0%) | 23,817 (100.0%) |
Household Income by Mortgage Status in Berkshire County
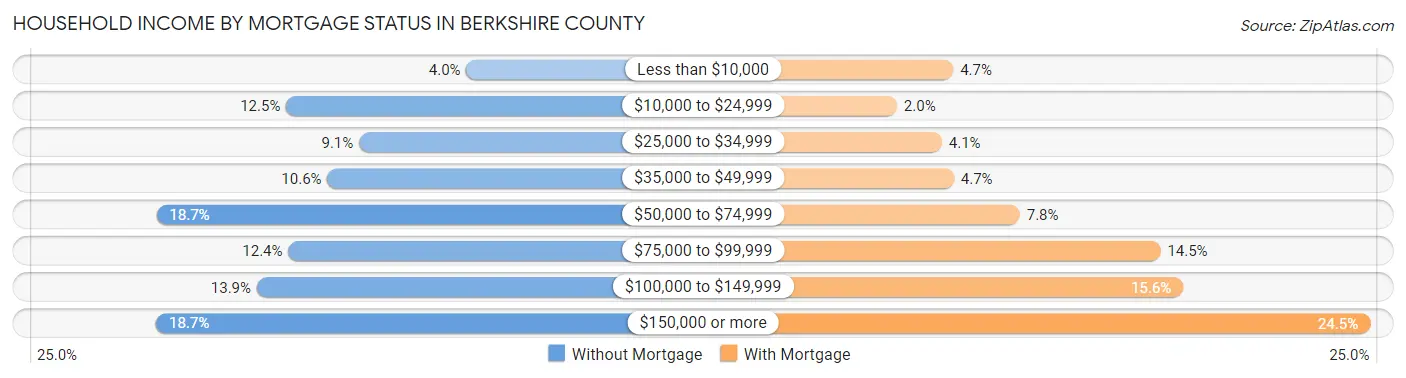
| Household Income | Without Mortgage | With Mortgage |
| Less than $10,000 | 617 (4.0%) | 1,108 (4.6%) |
| $10,000 to $24,999 | 1,952 (12.5%) | 469 (2.0%) |
| $25,000 to $34,999 | 1,412 (9.1%) | 978 (4.1%) |
| $35,000 to $49,999 | 1,647 (10.6%) | 1,114 (4.7%) |
| $50,000 to $74,999 | 2,913 (18.7%) | 1,863 (7.8%) |
| $75,000 to $99,999 | 1,936 (12.4%) | 3,459 (14.5%) |
| $100,000 to $149,999 | 2,170 (13.9%) | 3,716 (15.6%) |
| $150,000 or more | 2,916 (18.7%) | 5,836 (24.5%) |
| Total | 15,563 (100.0%) | 23,817 (100.0%) |
Property Value to Household Income Ratio in Berkshire County
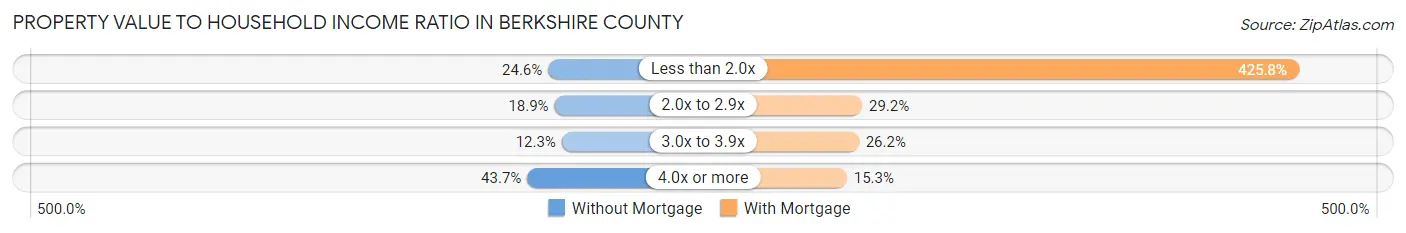
| Value-to-Income Ratio | Without Mortgage | With Mortgage |
| Less than 2.0x | 3,829 (24.6%) | 101,404 (425.8%) |
| 2.0x to 2.9x | 2,936 (18.9%) | 6,957 (29.2%) |
| 3.0x to 3.9x | 1,912 (12.3%) | 6,228 (26.2%) |
| 4.0x or more | 6,793 (43.6%) | 3,649 (15.3%) |
| Total | 15,563 (100.0%) | 23,817 (100.0%) |
Real Estate Taxes by Mortgage Status in Berkshire County
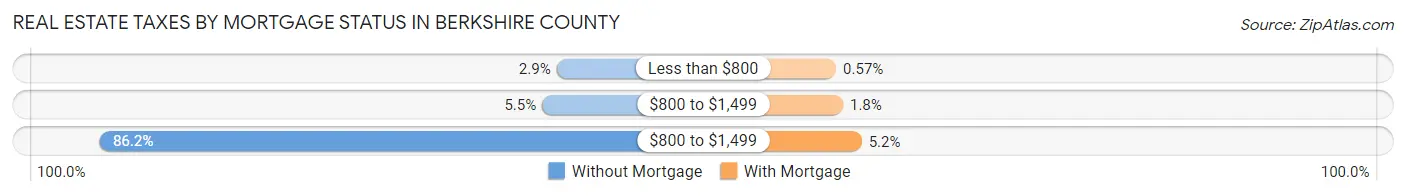
| Property Taxes | Without Mortgage | With Mortgage |
| Less than $800 | 443 (2.9%) | 135 (0.6%) |
| $800 to $1,499 | 855 (5.5%) | 435 (1.8%) |
| $800 to $1,499 | 13,419 (86.2%) | 1,249 (5.2%) |
| Total | 15,563 (100.0%) | 23,817 (100.0%) |
Health & Disability in Berkshire County
Health Insurance Coverage by Age in Berkshire County
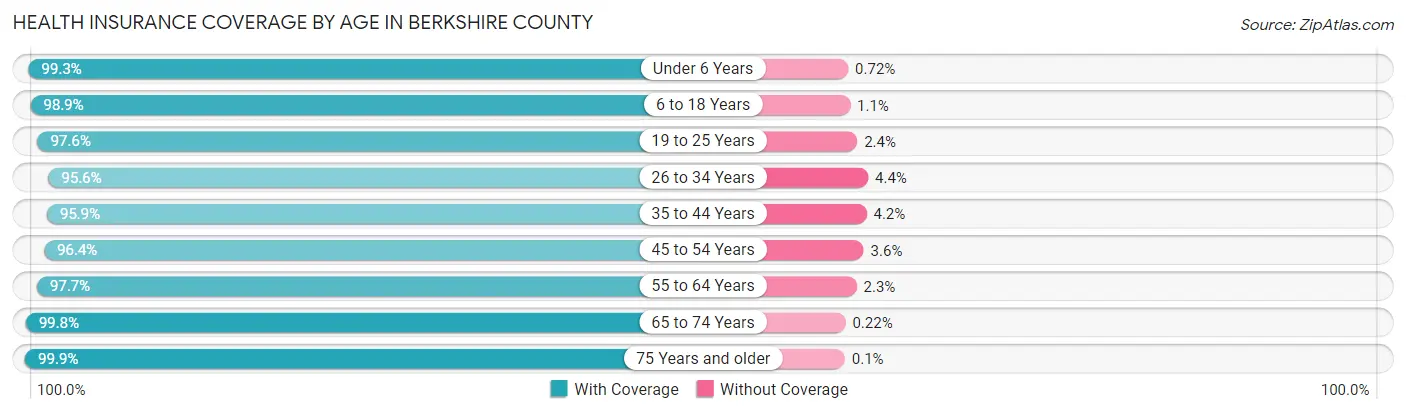
| Age Bracket | With Coverage | Without Coverage |
| Under 6 Years | 6,093 (99.3%) | 44 (0.7%) |
| 6 to 18 Years | 16,520 (98.9%) | 181 (1.1%) |
| 19 to 25 Years | 11,199 (97.6%) | 277 (2.4%) |
| 26 to 34 Years | 11,396 (95.6%) | 530 (4.4%) |
| 35 to 44 Years | 13,603 (95.9%) | 589 (4.2%) |
| 45 to 54 Years | 15,041 (96.4%) | 564 (3.6%) |
| 55 to 64 Years | 20,321 (97.7%) | 476 (2.3%) |
| 65 to 74 Years | 17,412 (99.8%) | 38 (0.2%) |
| 75 Years and older | 12,580 (99.9%) | 13 (0.1%) |
| Total | 124,165 (97.9%) | 2,712 (2.1%) |
Health Insurance Coverage by Citizenship Status in Berkshire County
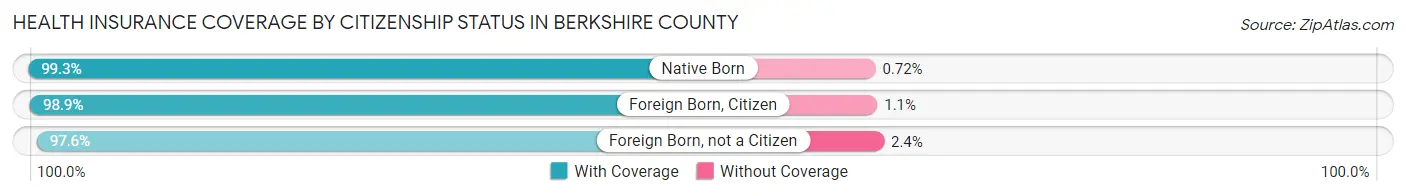
| Citizenship Status | With Coverage | Without Coverage |
| Native Born | 6,093 (99.3%) | 44 (0.7%) |
| Foreign Born, Citizen | 16,520 (98.9%) | 181 (1.1%) |
| Foreign Born, not a Citizen | 11,199 (97.6%) | 277 (2.4%) |
Health Insurance Coverage by Household Income in Berkshire County
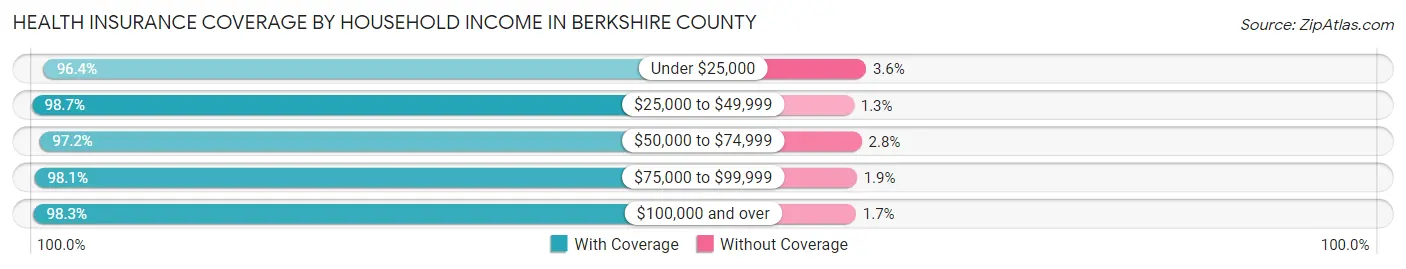
| Household Income | With Coverage | Without Coverage |
| Under $25,000 | 13,790 (96.4%) | 514 (3.6%) |
| $25,000 to $49,999 | 18,669 (98.7%) | 248 (1.3%) |
| $50,000 to $74,999 | 17,639 (97.2%) | 505 (2.8%) |
| $75,000 to $99,999 | 17,693 (98.1%) | 336 (1.9%) |
| $100,000 and over | 52,303 (98.3%) | 906 (1.7%) |
Public vs Private Health Insurance Coverage by Age in Berkshire County
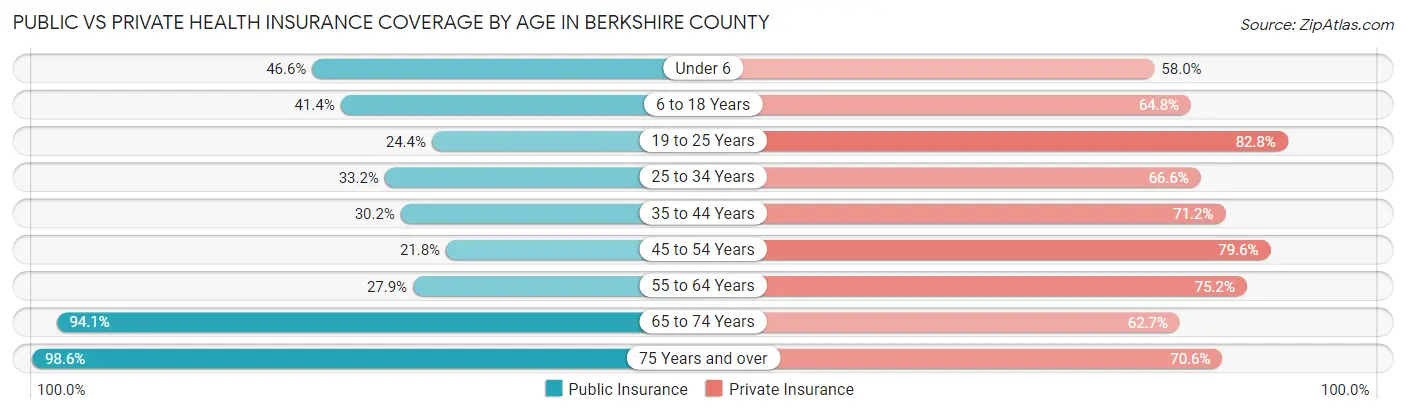
| Age Bracket | Public Insurance | Private Insurance |
| Under 6 | 2,861 (46.6%) | 3,561 (58.0%) |
| 6 to 18 Years | 6,909 (41.4%) | 10,822 (64.8%) |
| 19 to 25 Years | 2,802 (24.4%) | 9,497 (82.8%) |
| 25 to 34 Years | 3,955 (33.2%) | 7,944 (66.6%) |
| 35 to 44 Years | 4,285 (30.2%) | 10,101 (71.2%) |
| 45 to 54 Years | 3,401 (21.8%) | 12,414 (79.5%) |
| 55 to 64 Years | 5,807 (27.9%) | 15,632 (75.2%) |
| 65 to 74 Years | 16,417 (94.1%) | 10,949 (62.7%) |
| 75 Years and over | 12,421 (98.6%) | 8,894 (70.6%) |
| Total | 58,858 (46.4%) | 89,814 (70.8%) |
Disability Status by Sex by Age in Berkshire County
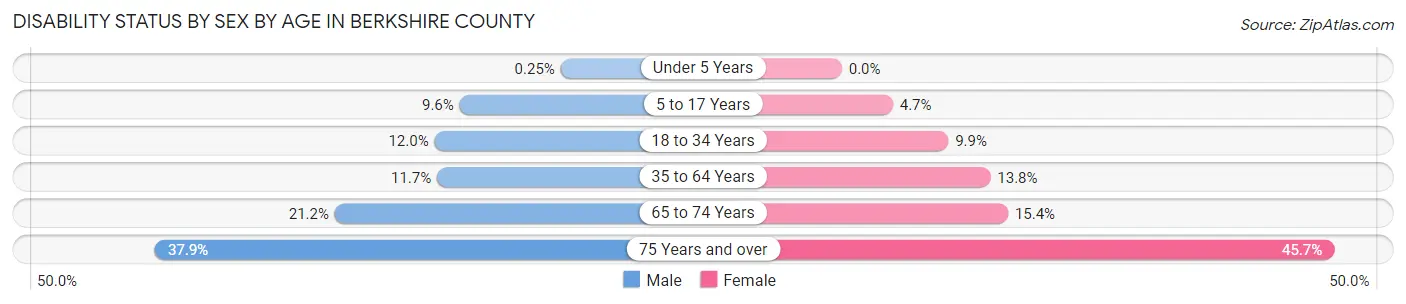
| Age Bracket | Male | Female |
| Under 5 Years | 7 (0.3%) | 0 (0.0%) |
| 5 to 17 Years | 771 (9.6%) | 364 (4.7%) |
| 18 to 34 Years | 1,535 (12.0%) | 1,238 (9.9%) |
| 35 to 64 Years | 2,921 (11.7%) | 3,541 (13.8%) |
| 65 to 74 Years | 1,765 (21.2%) | 1,408 (15.4%) |
| 75 Years and over | 1,936 (37.9%) | 3,419 (45.7%) |
Disability Class by Sex by Age in Berkshire County
Disability Class: Hearing Difficulty
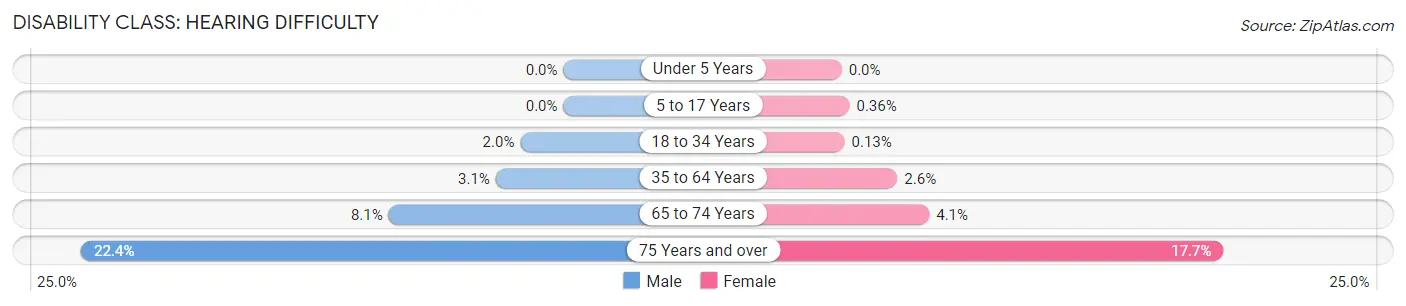
| Age Bracket | Male | Female |
| Under 5 Years | 0 (0.0%) | 0 (0.0%) |
| 5 to 17 Years | 0 (0.0%) | 28 (0.4%) |
| 18 to 34 Years | 257 (2.0%) | 16 (0.1%) |
| 35 to 64 Years | 782 (3.1%) | 662 (2.6%) |
| 65 to 74 Years | 675 (8.1%) | 371 (4.1%) |
| 75 Years and over | 1,143 (22.4%) | 1,325 (17.7%) |
Disability Class: Vision Difficulty
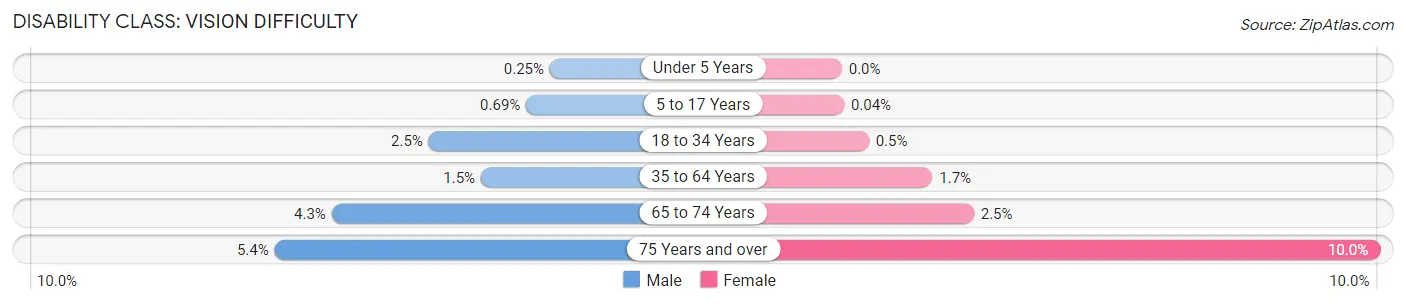
| Age Bracket | Male | Female |
| Under 5 Years | 7 (0.3%) | 0 (0.0%) |
| 5 to 17 Years | 55 (0.7%) | 3 (0.0%) |
| 18 to 34 Years | 321 (2.5%) | 63 (0.5%) |
| 35 to 64 Years | 381 (1.5%) | 431 (1.7%) |
| 65 to 74 Years | 358 (4.3%) | 224 (2.5%) |
| 75 Years and over | 274 (5.4%) | 748 (10.0%) |
Disability Class: Cognitive Difficulty
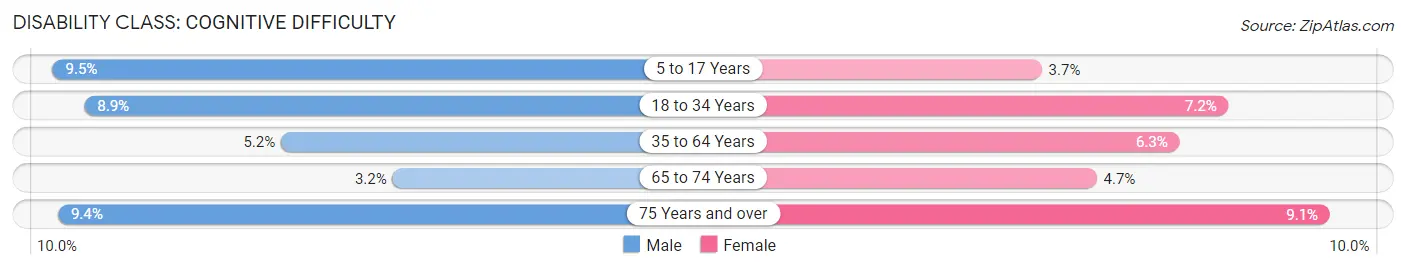
| Age Bracket | Male | Female |
| 5 to 17 Years | 759 (9.5%) | 286 (3.7%) |
| 18 to 34 Years | 1,141 (8.9%) | 899 (7.2%) |
| 35 to 64 Years | 1,306 (5.2%) | 1,611 (6.3%) |
| 65 to 74 Years | 264 (3.2%) | 432 (4.7%) |
| 75 Years and over | 479 (9.4%) | 678 (9.1%) |
Disability Class: Ambulatory Difficulty
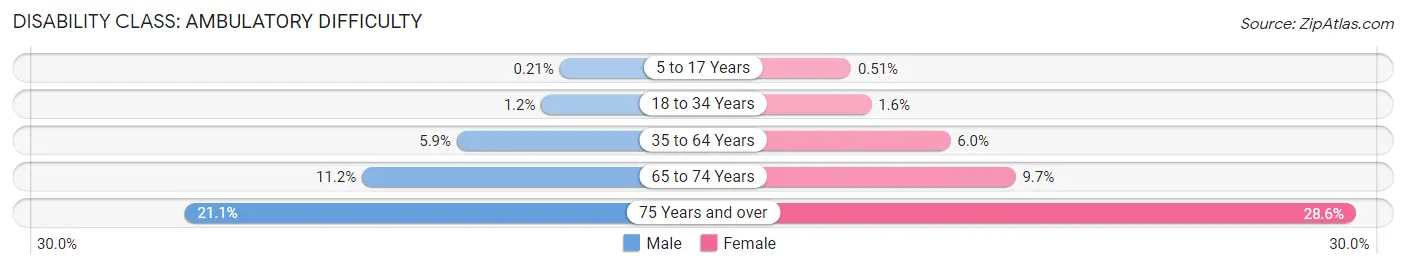
| Age Bracket | Male | Female |
| 5 to 17 Years | 17 (0.2%) | 39 (0.5%) |
| 18 to 34 Years | 158 (1.2%) | 206 (1.6%) |
| 35 to 64 Years | 1,477 (5.9%) | 1,552 (6.0%) |
| 65 to 74 Years | 933 (11.2%) | 883 (9.7%) |
| 75 Years and over | 1,078 (21.1%) | 2,142 (28.6%) |
Disability Class: Self-Care Difficulty
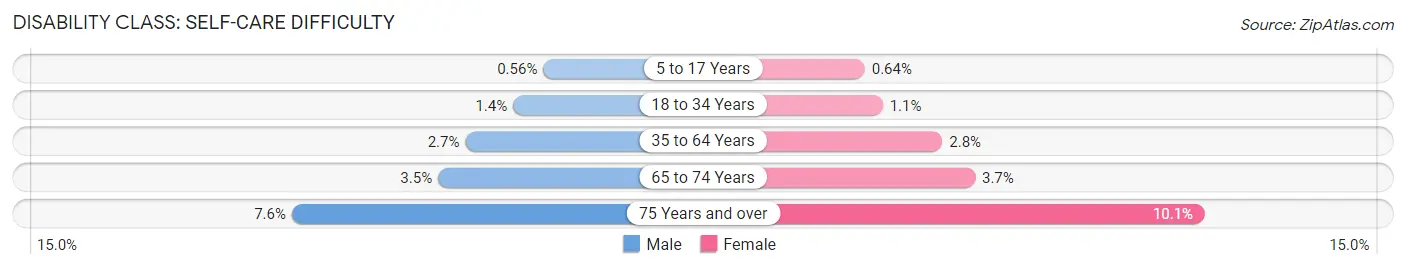
| Age Bracket | Male | Female |
| 5 to 17 Years | 45 (0.6%) | 49 (0.6%) |
| 18 to 34 Years | 180 (1.4%) | 143 (1.1%) |
| 35 to 64 Years | 679 (2.7%) | 718 (2.8%) |
| 65 to 74 Years | 290 (3.5%) | 339 (3.7%) |
| 75 Years and over | 386 (7.6%) | 757 (10.1%) |
Technology Access in Berkshire County
Computing Device Access in Berkshire County
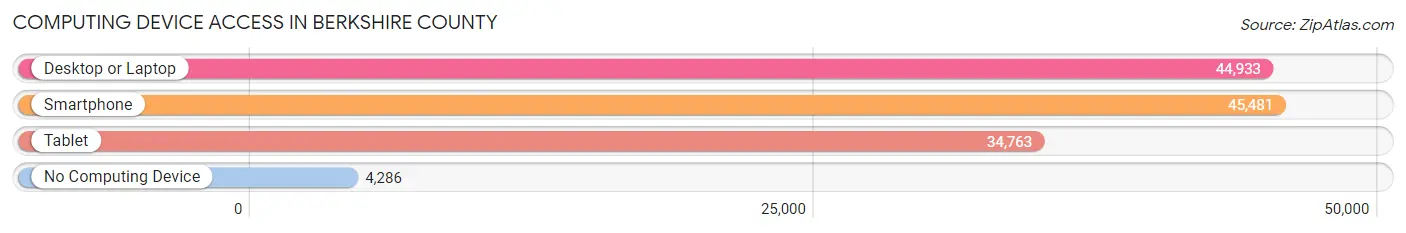
| Device Type | # Households | % Households |
| Desktop or Laptop | 44,933 | 80.1% |
| Smartphone | 45,481 | 81.1% |
| Tablet | 34,763 | 62.0% |
| No Computing Device | 4,286 | 7.6% |
| Total | 56,078 | 100.0% |
Internet Access in Berkshire County
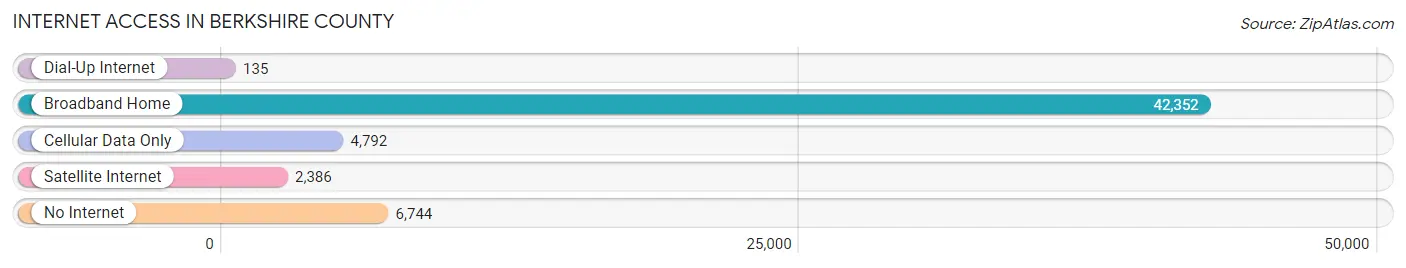
| Internet Type | # Households | % Households |
| Dial-Up Internet | 135 | 0.2% |
| Broadband Home | 42,352 | 75.5% |
| Cellular Data Only | 4,792 | 8.6% |
| Satellite Internet | 2,386 | 4.3% |
| No Internet | 6,744 | 12.0% |
| Total | 56,078 | 100.0% |
Berkshire County Summary
Berkshire County is located in the western part of Massachusetts and is the largest county in the state. It is bordered by New York, Connecticut, and Vermont. The county is home to a variety of landscapes, including the Berkshire Mountains, the Taconic Mountains, and the Housatonic River Valley. The county is also home to numerous lakes, rivers, and streams.
History
Berkshire County was originally inhabited by the Mahican Native American tribe. The first European settlers arrived in the area in the late 17th century. The county was officially established in 1761 and was named after the English county of Berkshire.
During the American Revolution, Berkshire County was a major center of activity. The county was home to several battles, including the Battle of Bennington and the Battle of Saratoga. After the war, the county experienced a period of economic growth, as it became a major center for manufacturing and agriculture.
In the 19th century, the county became a popular destination for wealthy vacationers. The county was home to several grand resorts, including the famous Berkshire Cottage. The county also became a popular destination for artists, writers, and musicians.
Geography
Berkshire County is located in the western part of Massachusetts. It is bordered by New York, Connecticut, and Vermont. The county is home to a variety of landscapes, including the Berkshire Mountains, the Taconic Mountains, and the Housatonic River Valley. The county is also home to numerous lakes, rivers, and streams.
The county is divided into four regions: the Berkshires, the Pioneer Valley, the Connecticut River Valley, and the Taconic Mountains. The Berkshires are the most mountainous region of the county and are home to several ski resorts. The Pioneer Valley is home to the cities of Springfield and Northampton. The Connecticut River Valley is home to the cities of Pittsfield and North Adams. The Taconic Mountains are home to the cities of Williamstown and Lenox.
Economy
Berkshire County has a diverse economy. The county is home to several major industries, including manufacturing, healthcare, education, and tourism.
Manufacturing is a major industry in the county. The county is home to several major companies, including General Electric, Crane & Co., and Berkshire Hathaway. The county is also home to several smaller manufacturing companies.
Healthcare is another major industry in the county. The county is home to several major hospitals, including Berkshire Medical Center and Fairview Hospital. The county is also home to several smaller healthcare facilities.
Education is also an important part of the county's economy. The county is home to several colleges and universities, including Williams College, Massachusetts College of Liberal Arts, and Berkshire Community College.
Tourism is also an important part of the county's economy. The county is home to several popular tourist attractions, including the Berkshire Museum, the Norman Rockwell Museum, and the Clark Art Institute.
Demographics
As of the 2010 census, Berkshire County had a population of 131,219. The county is home to a diverse population, with a variety of ethnic and racial backgrounds. The largest racial group in the county is White (87.3%), followed by Hispanic or Latino (5.3%), African American (2.7%), and Asian (1.7%).
The county is also home to a variety of religious backgrounds. The largest religious group in the county is Christian (77.2%), followed by Jewish (2.2%), Muslim (1.2%), and Buddhist (0.7%).
The median household income in the county is $54,945, and the median home value is $219,400. The county has a poverty rate of 11.2%.
Common Questions
What is the Total Population of Berkshire County?
Total Population of Berkshire County is 128,763.
What is the Total Male Population of Berkshire County?
Total Male Population of Berkshire County is 63,103.
What is the Total Female Population of Berkshire County?
Total Female Population of Berkshire County is 65,660.
What is the Ratio of Males per 100 Females in Berkshire County?
There are 96.11 Males per 100 Females in Berkshire County.
What is the Ratio of Females per 100 Males in Berkshire County?
There are 104.05 Females per 100 Males in Berkshire County.
What is the Median Population Age in Berkshire County?
Median Population Age in Berkshire County is 47.5 Years.
What is the Average Family Size in Berkshire County
Average Family Size in Berkshire County is 2.8 People.
What is the Average Household Size in Berkshire County
Average Household Size in Berkshire County is 2.2 People.
What is Per Capita Income in Berkshire County?
Per Capita income in Berkshire County is $45,300.
What is the Median Family Income in Berkshire County?
Median Family Income in Berkshire County is $92,531.
What is the Median Household income in Berkshire County?
Median Household Income in Berkshire County is $69,744.
What is Income or Wage Gap in Berkshire County?
Income or Wage Gap in Berkshire County is 27.9%.
Women in Berkshire County earn 72.1 cents for every dollar earned by a man.
What is Family Income Deficit in Berkshire County?
Family Income Deficit in Berkshire County is $10,325.
Families that are below poverty line in Berkshire County earn $10,325 less on average than the poverty threshold level.
What is Inequality or Gini Index in Berkshire County?
Inequality or Gini Index in Berkshire County is 0.49.
How Large is the Labor Force in Berkshire County?
There are 67,742 People in the Labor Forcein in Berkshire County.
What is the Percentage of People in the Labor Force in Berkshire County?
61.4% of People are in the Labor Force in Berkshire County.
What is the Unemployment Rate in Berkshire County?
Unemployment Rate in Berkshire County is 5.3%.