Barnstable County, MA
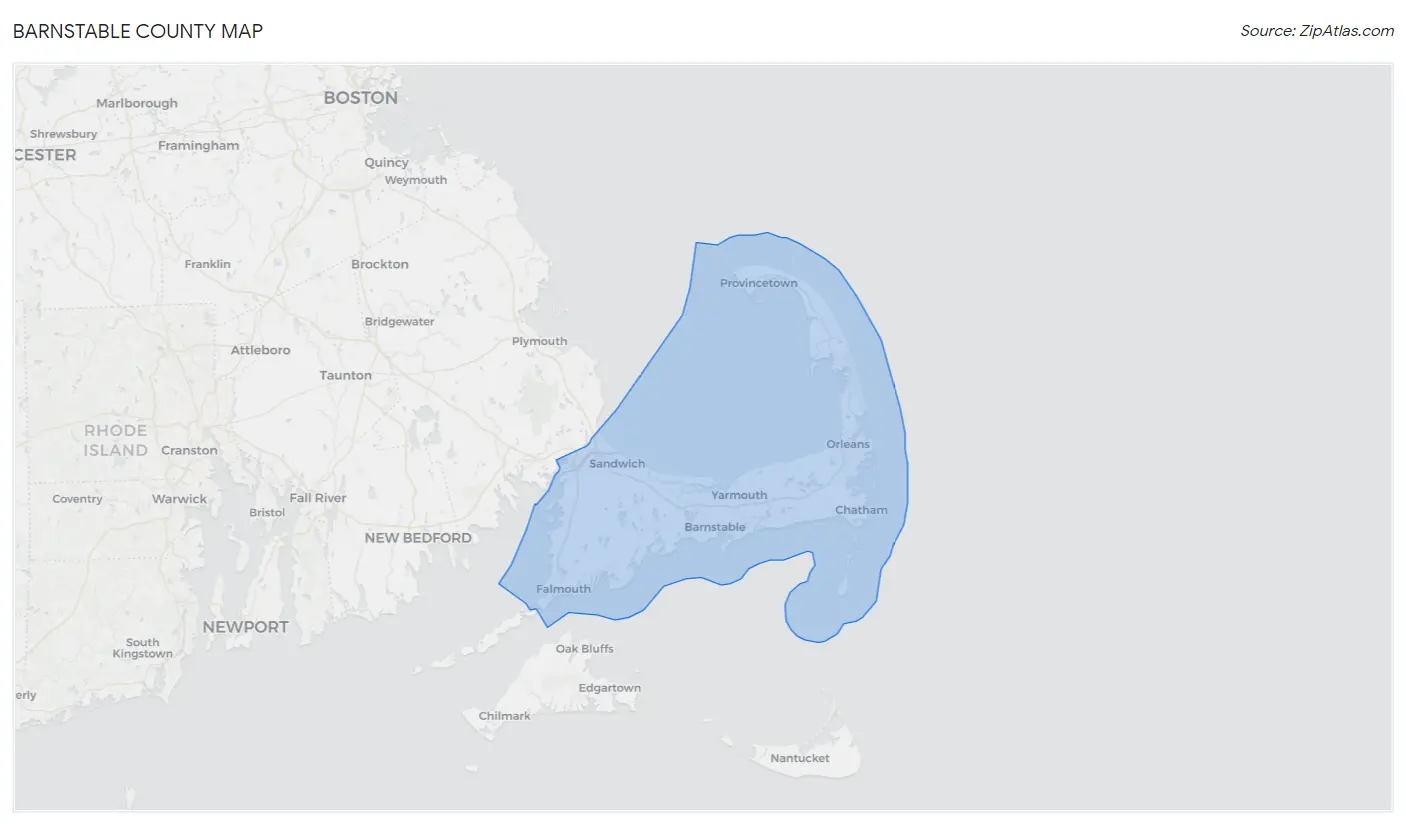
Barnstable County Map
Barnstable County Overview
229,436
TOTAL POPULATION
110,706
MALE POPULATION
118,730
FEMALE POPULATION
93.24
MALES / 100 FEMALES
107.25
FEMALES / 100 MALES
54.5
MEDIAN AGE
2.8
AVG FAMILY SIZE
2.3
AVG HOUSEHOLD SIZE
$55,940
PER CAPITA INCOME
$118,599
AVG FAMILY INCOME
$90,447
AVG HOUSEHOLD INCOME
22.4%
WAGE / INCOME GAP [ % ]
77.6¢/ $1
WAGE / INCOME GAP [ $ ]
$9,691
FAMILY INCOME DEFICIT
0.47
INEQUALITY / GINI INDEX
119,811
LABOR FORCE [ PEOPLE ]
59.7%
PERCENT IN LABOR FORCE
4.5%
UNEMPLOYMENT RATE
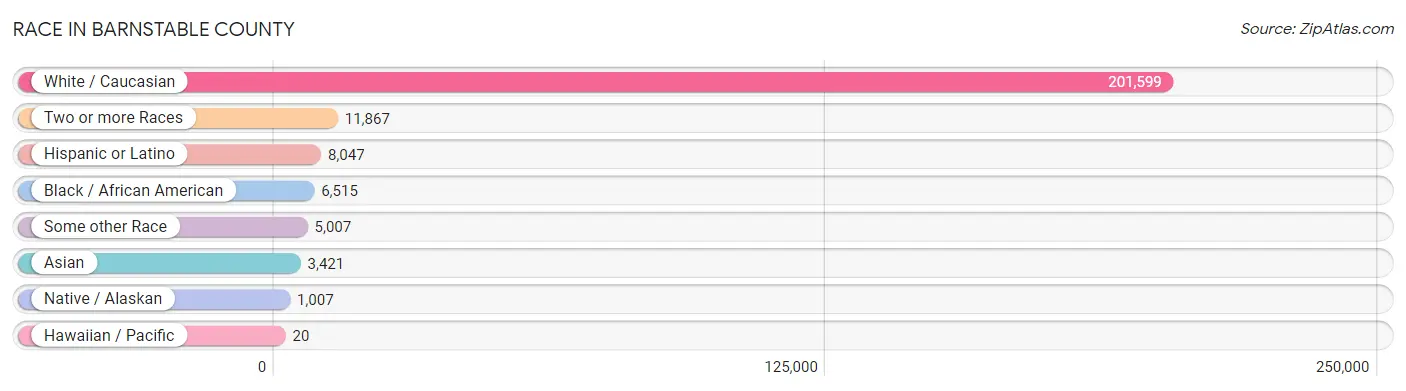
Race in Barnstable County
The most populous races in Barnstable County are White / Caucasian (201,599 | 87.9%), Two or more Races (11,867 | 5.2%), and Hispanic or Latino (8,047 | 3.5%).
| Race | # Population | % Population |
| Asian | 3,421 | 1.5% |
| Black / African American | 6,515 | 2.8% |
| Hawaiian / Pacific | 20 | 0.0% |
| Hispanic or Latino | 8,047 | 3.5% |
| Native / Alaskan | 1,007 | 0.4% |
| White / Caucasian | 201,599 | 87.9% |
| Two or more Races | 11,867 | 5.2% |
| Some other Race | 5,007 | 2.2% |
| Total | 229,436 | 100.0% |
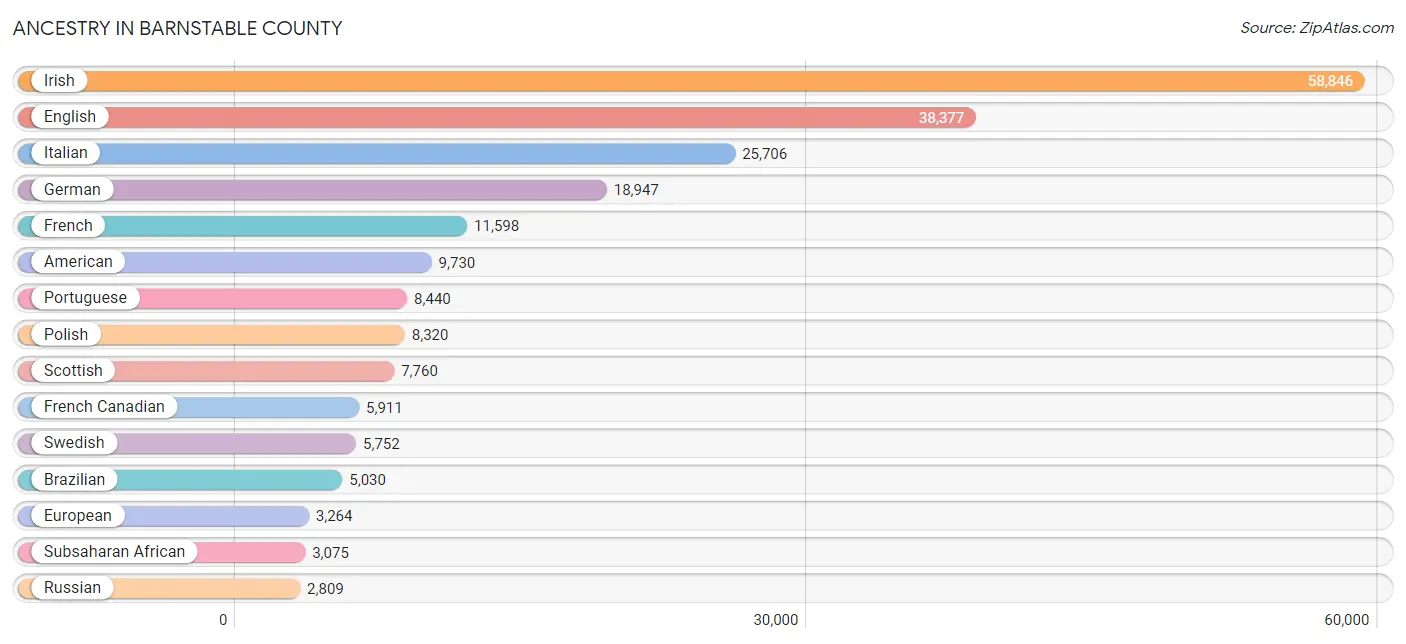
Ancestry in Barnstable County
The most populous ancestries reported in Barnstable County are Irish (58,846 | 25.7%), English (38,377 | 16.7%), Italian (25,706 | 11.2%), German (18,947 | 8.3%), and French (11,598 | 5.1%), together accounting for 66.9% of all Barnstable County residents.
| Ancestry | # Population | % Population |
| African | 678 | 0.3% |
| Albanian | 398 | 0.2% |
| Aleut | 57 | 0.0% |
| Alsatian | 30 | 0.0% |
| American | 9,730 | 4.2% |
| Arab | 1,388 | 0.6% |
| Argentinean | 69 | 0.0% |
| Armenian | 737 | 0.3% |
| Assyrian / Chaldean / Syriac | 19 | 0.0% |
| Australian | 207 | 0.1% |
| Austrian | 620 | 0.3% |
| Barbadian | 38 | 0.0% |
| Belgian | 190 | 0.1% |
| Bermudan | 19 | 0.0% |
| Bhutanese | 460 | 0.2% |
| Brazilian | 5,030 | 2.2% |
| British | 1,764 | 0.8% |
| British West Indian | 244 | 0.1% |
| Bulgarian | 358 | 0.2% |
| Burmese | 253 | 0.1% |
| Cajun | 33 | 0.0% |
| Canadian | 1,244 | 0.5% |
| Cape Verdean | 2,217 | 1.0% |
| Celtic | 61 | 0.0% |
| Central American | 614 | 0.3% |
| Central American Indian | 33 | 0.0% |
| Cherokee | 269 | 0.1% |
| Chilean | 164 | 0.1% |
| Chippewa | 19 | 0.0% |
| Colombian | 187 | 0.1% |
| Costa Rican | 19 | 0.0% |
| Cree | 64 | 0.0% |
| Croatian | 221 | 0.1% |
| Cuban | 273 | 0.1% |
| Czech | 572 | 0.3% |
| Czechoslovakian | 155 | 0.1% |
| Danish | 765 | 0.3% |
| Delaware | 19 | 0.0% |
| Dominican | 498 | 0.2% |
| Dutch | 1,497 | 0.6% |
| Eastern European | 1,279 | 0.6% |
| Ecuadorian | 1,440 | 0.6% |
| Egyptian | 62 | 0.0% |
| English | 38,377 | 16.7% |
| Estonian | 31 | 0.0% |
| Ethiopian | 51 | 0.0% |
| European | 3,264 | 1.4% |
| Filipino | 291 | 0.1% |
| Finnish | 1,027 | 0.4% |
| French | 11,598 | 5.1% |
| French American Indian | 67 | 0.0% |
| French Canadian | 5,911 | 2.6% |
| German | 18,947 | 8.3% |
| Greek | 1,972 | 0.9% |
| Guatemalan | 298 | 0.1% |
| Guyanese | 33 | 0.0% |
| Haitian | 902 | 0.4% |
| Honduran | 52 | 0.0% |
| Hopi | 37 | 0.0% |
| Hungarian | 779 | 0.3% |
| Icelander | 41 | 0.0% |
| Indian (Asian) | 1,141 | 0.5% |
| Iranian | 47 | 0.0% |
| Irish | 58,846 | 25.7% |
| Iroquois | 66 | 0.0% |
| Israeli | 10 | 0.0% |
| Italian | 25,706 | 11.2% |
| Jamaican | 2,489 | 1.1% |
| Japanese | 99 | 0.0% |
| Jordanian | 21 | 0.0% |
| Korean | 404 | 0.2% |
| Laotian | 74 | 0.0% |
| Latvian | 126 | 0.1% |
| Lebanese | 965 | 0.4% |
| Lithuanian | 2,169 | 0.9% |
| Macedonian | 52 | 0.0% |
| Malaysian | 14 | 0.0% |
| Maltese | 11 | 0.0% |
| Mexican | 1,485 | 0.6% |
| Mexican American Indian | 61 | 0.0% |
| Mongolian | 5 | 0.0% |
| Moroccan | 45 | 0.0% |
| Native Hawaiian | 104 | 0.1% |
| Navajo | 76 | 0.0% |
| New Zealander | 26 | 0.0% |
| Nigerian | 19 | 0.0% |
| Northern European | 563 | 0.3% |
| Norwegian | 2,026 | 0.9% |
| Okinawan | 5 | 0.0% |
| Pakistani | 147 | 0.1% |
| Pennsylvania German | 56 | 0.0% |
| Peruvian | 287 | 0.1% |
| Polish | 8,320 | 3.6% |
| Portuguese | 8,440 | 3.7% |
| Puerto Rican | 1,395 | 0.6% |
| Romanian | 178 | 0.1% |
| Russian | 2,809 | 1.2% |
| Salvadoran | 245 | 0.1% |
| Samoan | 40 | 0.0% |
| Scandinavian | 586 | 0.3% |
| Scotch-Irish | 2,017 | 0.9% |
| Scottish | 7,760 | 3.4% |
| Serbian | 745 | 0.3% |
| Sioux | 17 | 0.0% |
| Slavic | 172 | 0.1% |
| Slovak | 247 | 0.1% |
| South African | 68 | 0.0% |
| South American | 2,705 | 1.2% |
| South American Indian | 158 | 0.1% |
| Spaniard | 206 | 0.1% |
| Spanish | 60 | 0.0% |
| Spanish American Indian | 9 | 0.0% |
| Sri Lankan | 207 | 0.1% |
| Subsaharan African | 3,075 | 1.3% |
| Swedish | 5,752 | 2.5% |
| Swiss | 396 | 0.2% |
| Syrian | 172 | 0.1% |
| Thai | 784 | 0.3% |
| Turkish | 124 | 0.1% |
| U.S. Virgin Islander | 1 | 0.0% |
| Ukrainian | 555 | 0.2% |
| Uruguayan | 24 | 0.0% |
| Venezuelan | 196 | 0.1% |
| Vietnamese | 181 | 0.1% |
| Welsh | 978 | 0.4% |
| West Indian | 90 | 0.0% | View All 126 Rows |
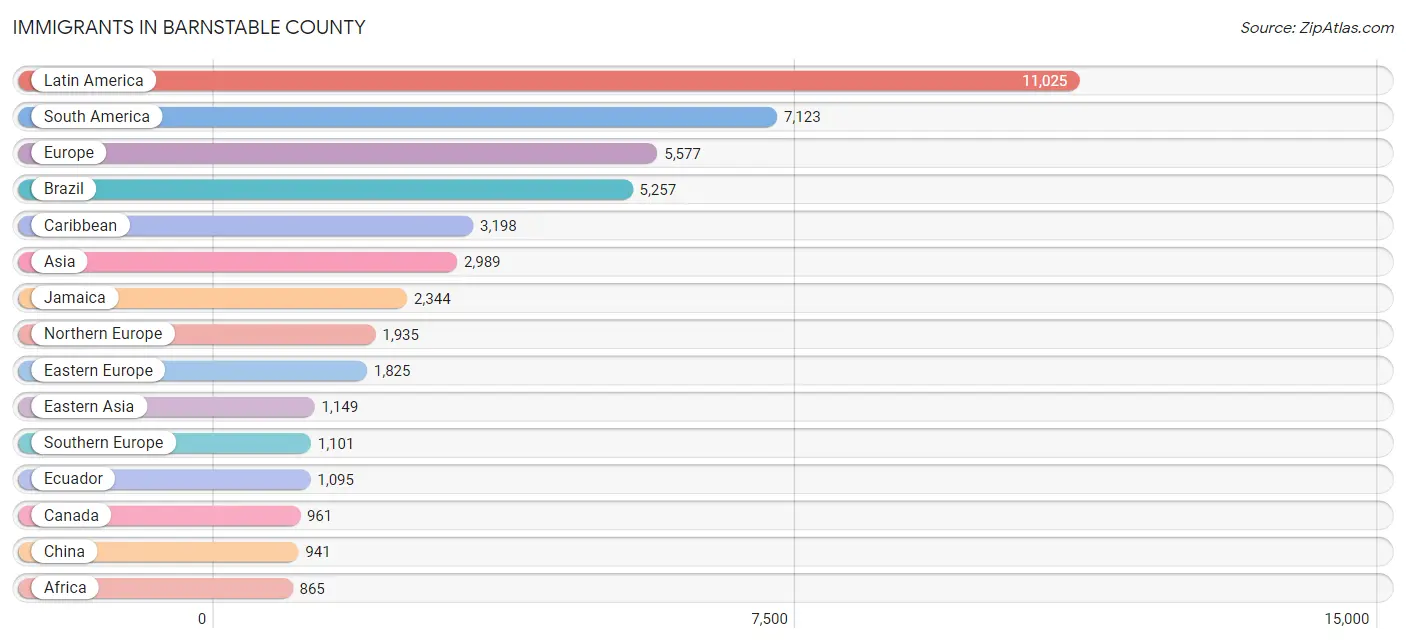
Immigrants in Barnstable County
The most numerous immigrant groups reported in Barnstable County came from Latin America (11,025 | 4.8%), South America (7,123 | 3.1%), Europe (5,577 | 2.4%), Brazil (5,257 | 2.3%), and Caribbean (3,198 | 1.4%), together accounting for 14.0% of all Barnstable County residents.
| Immigration Origin | # Population | % Population |
| Africa | 865 | 0.4% |
| Albania | 24 | 0.0% |
| Argentina | 105 | 0.1% |
| Armenia | 79 | 0.0% |
| Asia | 2,989 | 1.3% |
| Australia | 68 | 0.0% |
| Austria | 11 | 0.0% |
| Azores | 151 | 0.1% |
| Bangladesh | 135 | 0.1% |
| Barbados | 25 | 0.0% |
| Belarus | 162 | 0.1% |
| Belgium | 40 | 0.0% |
| Bosnia and Herzegovina | 68 | 0.0% |
| Brazil | 5,257 | 2.3% |
| Bulgaria | 324 | 0.1% |
| Cabo Verde | 77 | 0.0% |
| Cambodia | 56 | 0.0% |
| Cameroon | 42 | 0.0% |
| Canada | 961 | 0.4% |
| Caribbean | 3,198 | 1.4% |
| Central America | 704 | 0.3% |
| Chile | 152 | 0.1% |
| China | 941 | 0.4% |
| Colombia | 119 | 0.1% |
| Croatia | 57 | 0.0% |
| Cuba | 24 | 0.0% |
| Czechoslovakia | 51 | 0.0% |
| Denmark | 93 | 0.0% |
| Dominica | 115 | 0.1% |
| Dominican Republic | 260 | 0.1% |
| Eastern Africa | 67 | 0.0% |
| Eastern Asia | 1,149 | 0.5% |
| Eastern Europe | 1,825 | 0.8% |
| Ecuador | 1,095 | 0.5% |
| Egypt | 246 | 0.1% |
| El Salvador | 106 | 0.1% |
| England | 863 | 0.4% |
| Ethiopia | 51 | 0.0% |
| Europe | 5,577 | 2.4% |
| France | 248 | 0.1% |
| Germany | 280 | 0.1% |
| Ghana | 195 | 0.1% |
| Greece | 191 | 0.1% |
| Guatemala | 150 | 0.1% |
| Guyana | 60 | 0.0% |
| Haiti | 403 | 0.2% |
| Honduras | 24 | 0.0% |
| Hong Kong | 31 | 0.0% |
| Hungary | 13 | 0.0% |
| India | 314 | 0.1% |
| Indonesia | 11 | 0.0% |
| Iran | 30 | 0.0% |
| Iraq | 16 | 0.0% |
| Ireland | 510 | 0.2% |
| Israel | 30 | 0.0% |
| Italy | 459 | 0.2% |
| Jamaica | 2,344 | 1.0% |
| Japan | 190 | 0.1% |
| Kazakhstan | 79 | 0.0% |
| Korea | 18 | 0.0% |
| Laos | 14 | 0.0% |
| Latin America | 11,025 | 4.8% |
| Latvia | 17 | 0.0% |
| Lebanon | 168 | 0.1% |
| Lithuania | 69 | 0.0% |
| Malaysia | 230 | 0.1% |
| Mexico | 424 | 0.2% |
| Middle Africa | 52 | 0.0% |
| Moldova | 94 | 0.0% |
| Morocco | 36 | 0.0% |
| Nepal | 57 | 0.0% |
| Netherlands | 72 | 0.0% |
| Nigeria | 19 | 0.0% |
| North Macedonia | 111 | 0.1% |
| Northern Africa | 315 | 0.1% |
| Northern Europe | 1,935 | 0.8% |
| Oceania | 119 | 0.1% |
| Pakistan | 113 | 0.1% |
| Peru | 172 | 0.1% |
| Philippines | 146 | 0.1% |
| Poland | 151 | 0.1% |
| Portugal | 451 | 0.2% |
| Romania | 59 | 0.0% |
| Russia | 155 | 0.1% |
| Saudi Arabia | 69 | 0.0% |
| Scotland | 89 | 0.0% |
| Serbia | 291 | 0.1% |
| South Africa | 140 | 0.1% |
| South America | 7,123 | 3.1% |
| South Central Asia | 781 | 0.3% |
| South Eastern Asia | 578 | 0.3% |
| Southern Europe | 1,101 | 0.5% |
| St. Vincent and the Grenadines | 9 | 0.0% |
| Sweden | 29 | 0.0% |
| Switzerland | 62 | 0.0% |
| Syria | 69 | 0.0% |
| Taiwan | 203 | 0.1% |
| Thailand | 69 | 0.0% |
| Trinidad and Tobago | 7 | 0.0% |
| Turkey | 26 | 0.0% |
| Ukraine | 133 | 0.1% |
| Uruguay | 24 | 0.0% |
| Uzbekistan | 47 | 0.0% |
| Venezuela | 139 | 0.1% |
| Vietnam | 52 | 0.0% |
| Western Africa | 291 | 0.1% |
| Western Asia | 481 | 0.2% |
| Western Europe | 713 | 0.3% | View All 108 Rows |
Sex and Age in Barnstable County
Sex and Age in Barnstable County
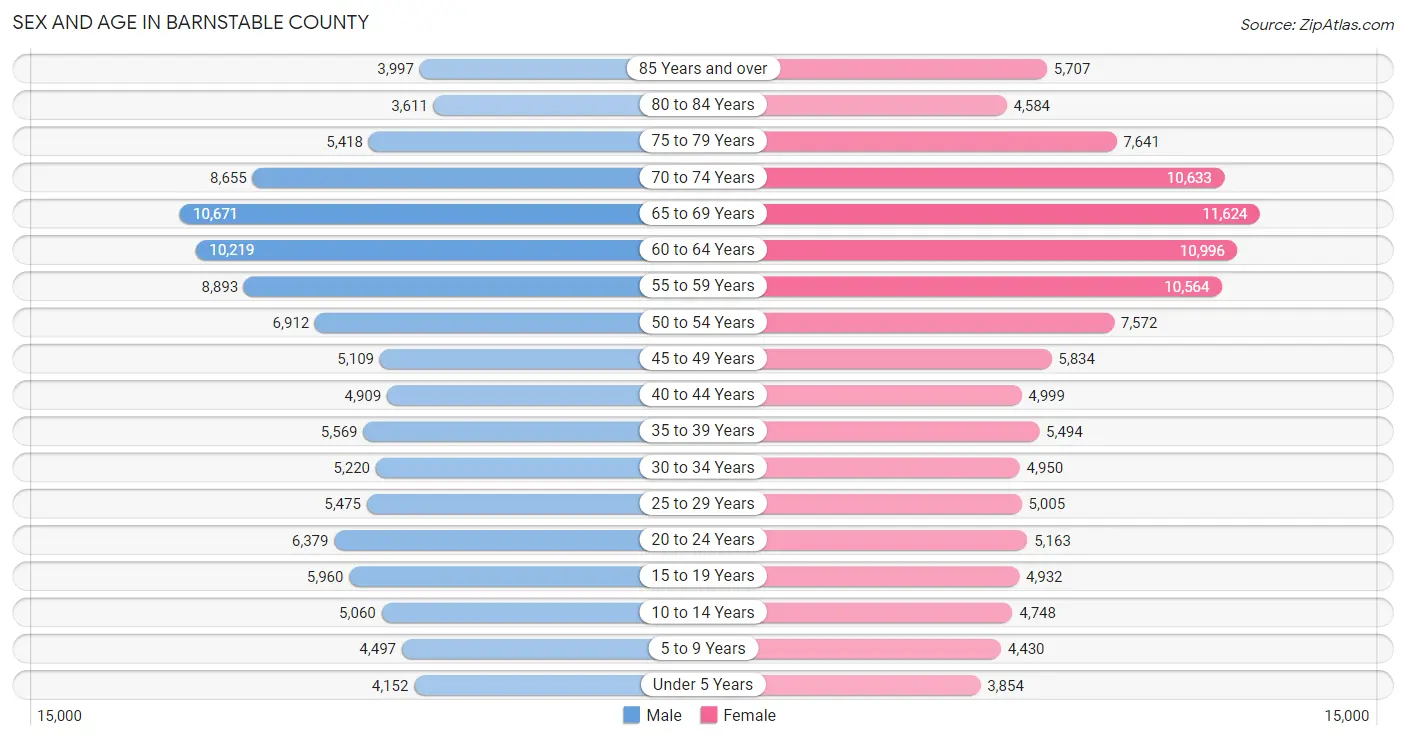
The most populous age groups in Barnstable County are 65 to 69 Years (10,671 | 9.6%) for men and 65 to 69 Years (11,624 | 9.8%) for women.
| Age Bracket | Male | Female |
| Under 5 Years | 4,152 (3.7%) | 3,854 (3.3%) |
| 5 to 9 Years | 4,497 (4.1%) | 4,430 (3.7%) |
| 10 to 14 Years | 5,060 (4.6%) | 4,748 (4.0%) |
| 15 to 19 Years | 5,960 (5.4%) | 4,932 (4.2%) |
| 20 to 24 Years | 6,379 (5.8%) | 5,163 (4.3%) |
| 25 to 29 Years | 5,475 (5.0%) | 5,005 (4.2%) |
| 30 to 34 Years | 5,220 (4.7%) | 4,950 (4.2%) |
| 35 to 39 Years | 5,569 (5.0%) | 5,494 (4.6%) |
| 40 to 44 Years | 4,909 (4.4%) | 4,999 (4.2%) |
| 45 to 49 Years | 5,109 (4.6%) | 5,834 (4.9%) |
| 50 to 54 Years | 6,912 (6.2%) | 7,572 (6.4%) |
| 55 to 59 Years | 8,893 (8.0%) | 10,564 (8.9%) |
| 60 to 64 Years | 10,219 (9.2%) | 10,996 (9.3%) |
| 65 to 69 Years | 10,671 (9.6%) | 11,624 (9.8%) |
| 70 to 74 Years | 8,655 (7.8%) | 10,633 (9.0%) |
| 75 to 79 Years | 5,418 (4.9%) | 7,641 (6.4%) |
| 80 to 84 Years | 3,611 (3.3%) | 4,584 (3.9%) |
| 85 Years and over | 3,997 (3.6%) | 5,707 (4.8%) |
| Total | 110,706 (100.0%) | 118,730 (100.0%) |
Families and Households in Barnstable County
Median Family Size in Barnstable County
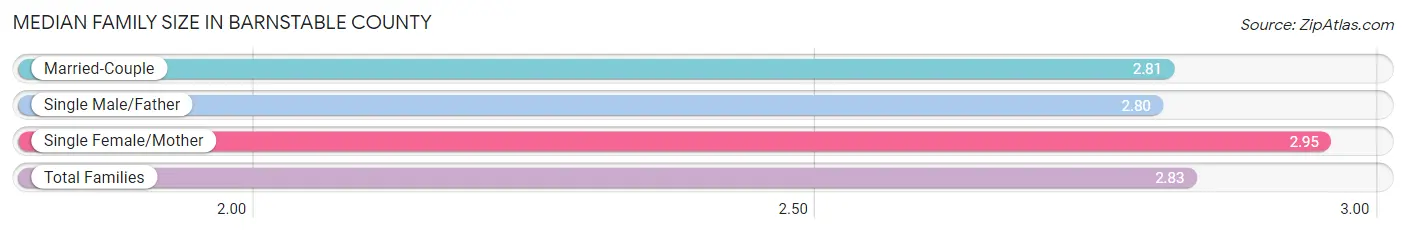
The median family size in Barnstable County is 2.83 persons per family, with single female/mother families (8,818 | 14.2%) accounting for the largest median family size of 2.95 persons per family. On the other hand, single male/father families (3,617 | 5.8%) represent the smallest median family size with 2.80 persons per family.
| Family Type | # Families | Family Size |
| Married-Couple | 49,694 (80.0%) | 2.81 |
| Single Male/Father | 3,617 (5.8%) | 2.80 |
| Single Female/Mother | 8,818 (14.2%) | 2.95 |
| Total Families | 62,129 (100.0%) | 2.83 |
Median Household Size in Barnstable County
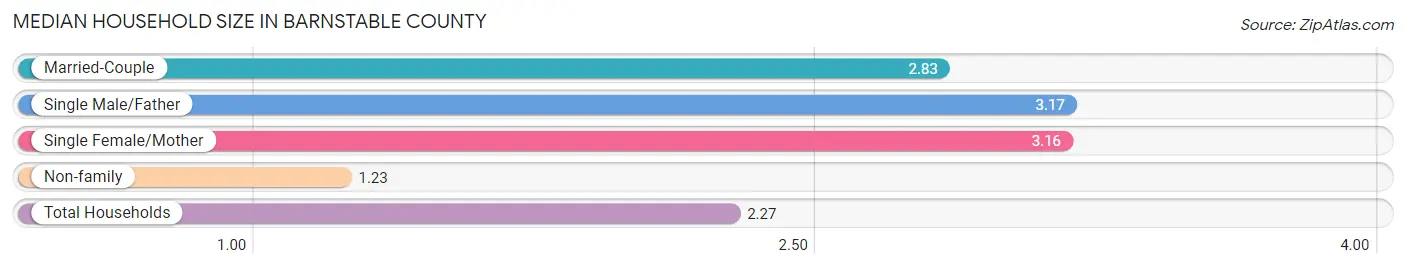
The median household size in Barnstable County is 2.27 persons per household, with single male/father households (3,617 | 3.6%) accounting for the largest median household size of 3.17 persons per household. non-family households (37,840 | 37.9%) represent the smallest median household size with 1.23 persons per household.
| Household Type | # Households | Household Size |
| Married-Couple | 49,694 (49.7%) | 2.83 |
| Single Male/Father | 3,617 (3.6%) | 3.17 |
| Single Female/Mother | 8,818 (8.8%) | 3.16 |
| Non-family | 37,840 (37.9%) | 1.23 |
| Total Households | 99,969 (100.0%) | 2.27 |
Household Size by Marriage Status in Barnstable County
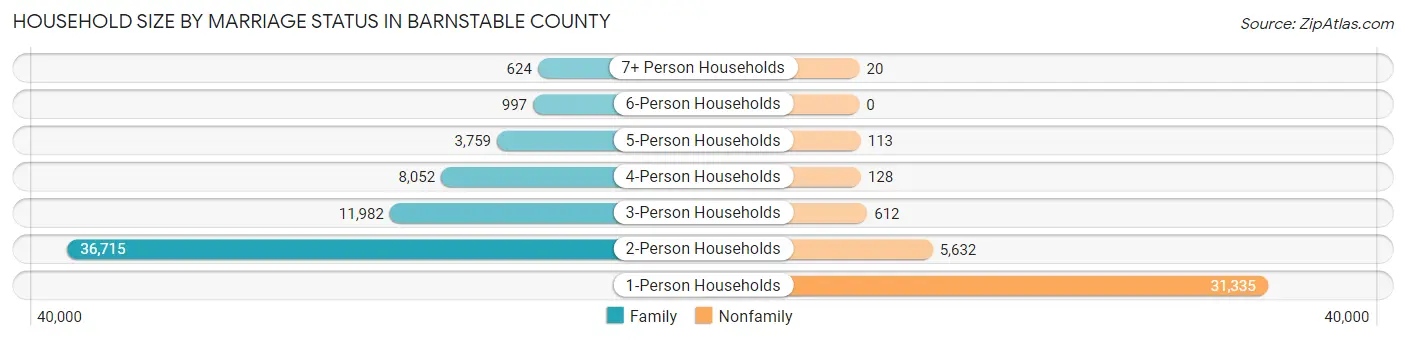
Out of a total of 99,969 households in Barnstable County, 62,129 (62.2%) are family households, while 37,840 (37.9%) are nonfamily households. The most numerous type of family households are 2-person households, comprising 36,715, and the most common type of nonfamily households are 1-person households, comprising 31,335.
| Household Size | Family Households | Nonfamily Households |
| 1-Person Households | - | 31,335 (31.3%) |
| 2-Person Households | 36,715 (36.7%) | 5,632 (5.6%) |
| 3-Person Households | 11,982 (12.0%) | 612 (0.6%) |
| 4-Person Households | 8,052 (8.1%) | 128 (0.1%) |
| 5-Person Households | 3,759 (3.8%) | 113 (0.1%) |
| 6-Person Households | 997 (1.0%) | 0 (0.0%) |
| 7+ Person Households | 624 (0.6%) | 20 (0.0%) |
| Total | 62,129 (62.2%) | 37,840 (37.9%) |
Female Fertility in Barnstable County
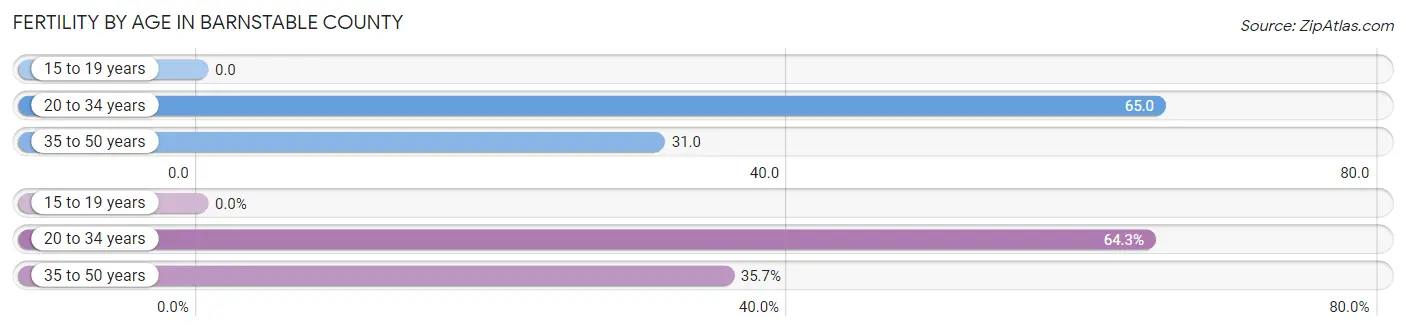
Fertility by Age in Barnstable County
Average fertility rate in Barnstable County is 40.0 births per 1,000 women. Women in the age bracket of 20 to 34 years have the highest fertility rate with 65.0 births per 1,000 women. Women in the age bracket of 20 to 34 years acount for 64.3% of all women with births.
| Age Bracket | Women with Births | Births / 1,000 Women |
| 15 to 19 years | 0 (0.0%) | 0.0 |
| 20 to 34 years | 979 (64.3%) | 65.0 |
| 35 to 50 years | 543 (35.7%) | 31.0 |
| Total | 1,522 (100.0%) | 40.0 |
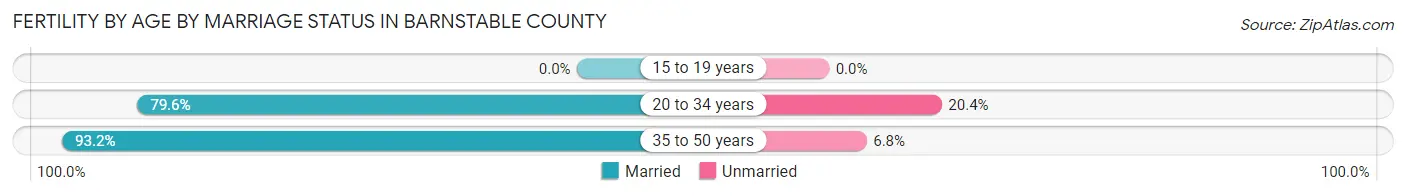
Fertility by Age by Marriage Status in Barnstable County
84.4% of women with births (1,522) in Barnstable County are married. The highest percentage of unmarried women with births falls into 20 to 34 years age bracket with 20.4% of them unmarried at the time of birth, while the lowest percentage of unmarried women with births belong to 35 to 50 years age bracket with 6.8% of them unmarried.
| Age Bracket | Married | Unmarried |
| 15 to 19 years | 0 (0.0%) | 0 (0.0%) |
| 20 to 34 years | 779 (79.6%) | 200 (20.4%) |
| 35 to 50 years | 506 (93.2%) | 37 (6.8%) |
| Total | 1,285 (84.4%) | 237 (15.6%) |
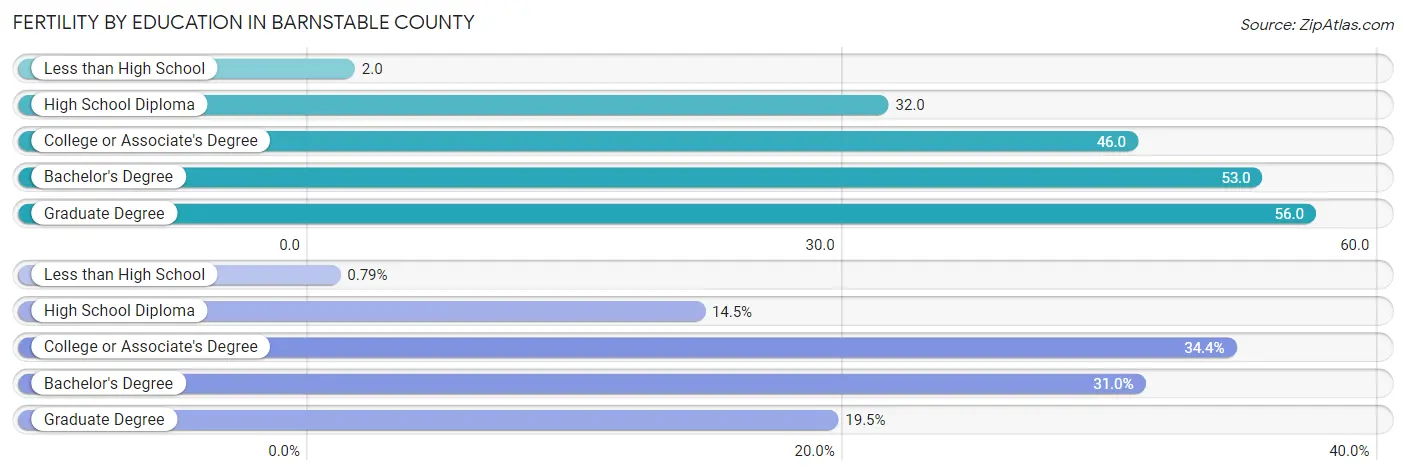
Fertility by Education in Barnstable County
Average fertility rate in Barnstable County is 40.0 births per 1,000 women. Women with the education attainment of graduate degree have the highest fertility rate of 56.0 births per 1,000 women, while women with the education attainment of less than high school have the lowest fertility at 2.0 births per 1,000 women. Women with the education attainment of college or associate's degree represent 34.4% of all women with births.
| Educational Attainment | Women with Births | Births / 1,000 Women |
| Less than High School | 12 (0.8%) | 2.0 |
| High School Diploma | 220 (14.4%) | 32.0 |
| College or Associate's Degree | 523 (34.4%) | 46.0 |
| Bachelor's Degree | 471 (30.9%) | 53.0 |
| Graduate Degree | 296 (19.5%) | 56.0 |
| Total | 1,522 (100.0%) | 40.0 |
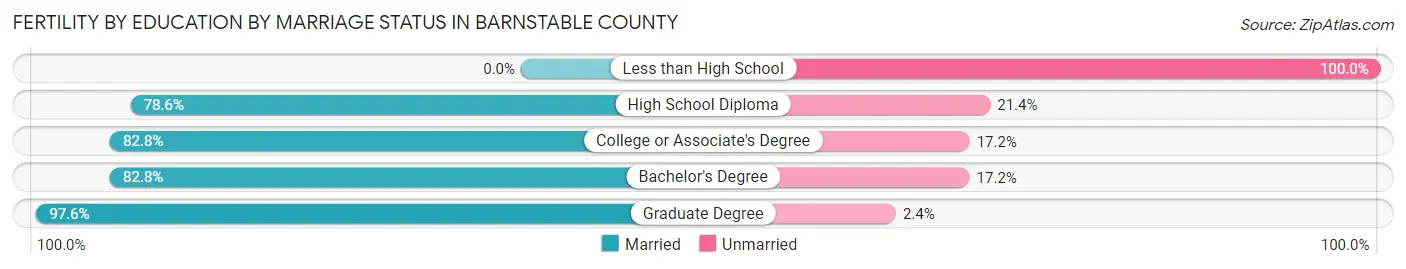
Fertility by Education by Marriage Status in Barnstable County
15.6% of women with births in Barnstable County are unmarried. Women with the educational attainment of graduate degree are most likely to be married with 97.6% of them married at childbirth, while women with the educational attainment of less than high school are least likely to be married with 100.0% of them unmarried at childbirth.
| Educational Attainment | Married | Unmarried |
| Less than High School | 0 (0.0%) | 12 (100.0%) |
| High School Diploma | 173 (78.6%) | 47 (21.4%) |
| College or Associate's Degree | 433 (82.8%) | 90 (17.2%) |
| Bachelor's Degree | 390 (82.8%) | 81 (17.2%) |
| Graduate Degree | 289 (97.6%) | 7 (2.4%) |
| Total | 1,285 (84.4%) | 237 (15.6%) |
Income in Barnstable County
Income Overview in Barnstable County
Per Capita Income in Barnstable County is $55,940, while median incomes of families and households are $118,599 and $90,447 respectively.
| Characteristic | Number | Measure |
| Per Capita Income | 229,436 | $55,940 |
| Median Family Income | 62,129 | $118,599 |
| Mean Family Income | 62,129 | $153,155 |
| Median Household Income | 99,969 | $90,447 |
| Mean Household Income | 99,969 | $124,905 |
| Income Deficit | 62,129 | $9,691 |
| Wage / Income Gap (%) | 229,436 | 22.42% |
| Wage / Income Gap ($) | 229,436 | 77.58¢ per $1 |
| Gini / Inequality Index | 229,436 | 0.47 |
Earnings by Sex in Barnstable County
Average Earnings in Barnstable County are $45,362, $51,736 for men and $40,136 for women, a difference of 22.4%.
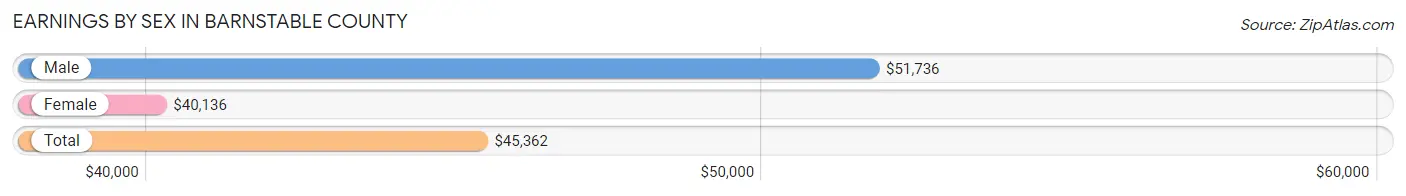
| Sex | Number | Average Earnings |
| Male | 66,148 (51.7%) | $51,736 |
| Female | 61,678 (48.2%) | $40,136 |
| Total | 127,826 (100.0%) | $45,362 |
Earnings by Sex by Income Bracket in Barnstable County
The most common earnings brackets in Barnstable County are $100,000+ for men (15,211 | 23.0%) and $100,000+ for women (7,630 | 12.4%).
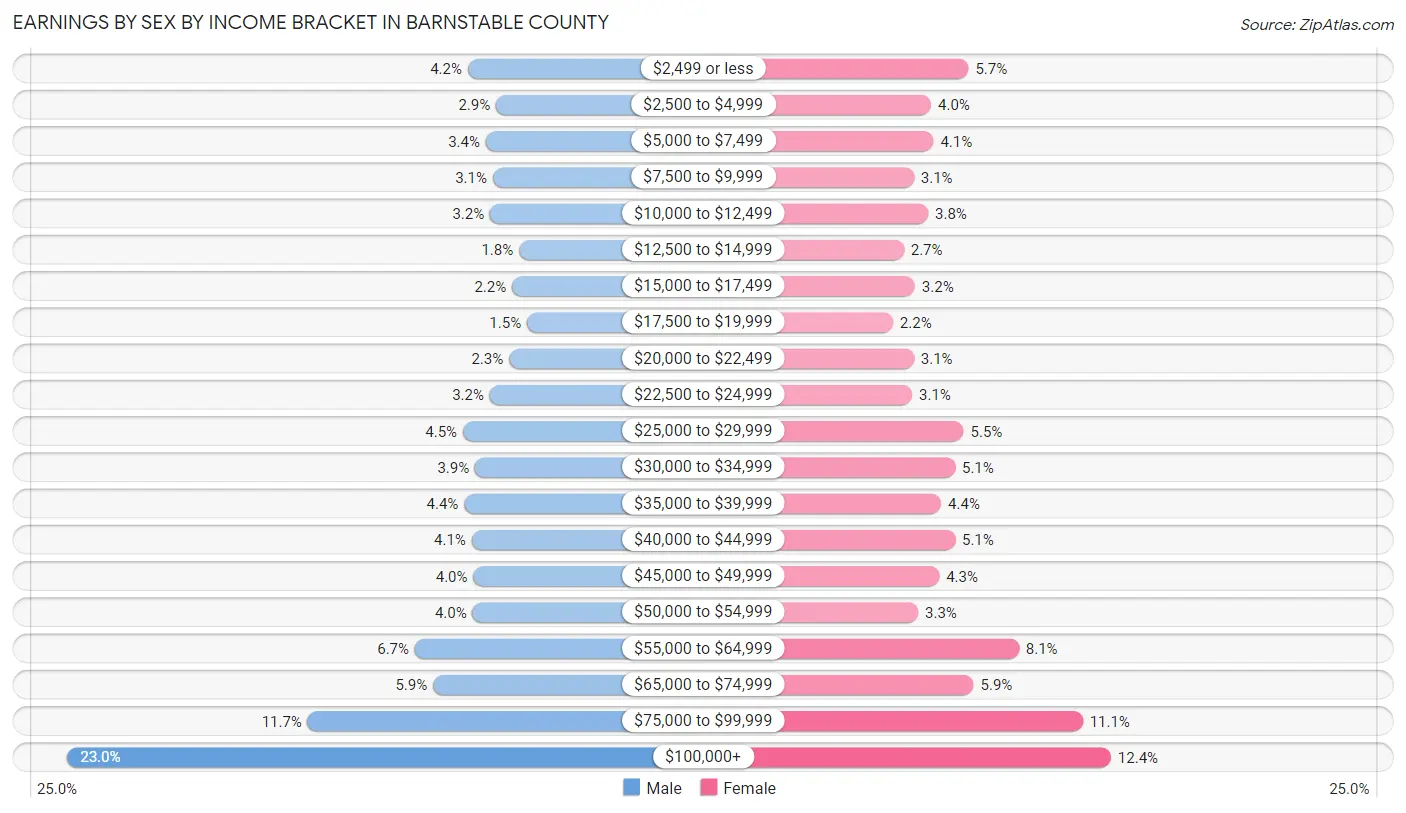
| Income | Male | Female |
| $2,499 or less | 2,805 (4.2%) | 3,514 (5.7%) |
| $2,500 to $4,999 | 1,932 (2.9%) | 2,439 (4.0%) |
| $5,000 to $7,499 | 2,247 (3.4%) | 2,506 (4.1%) |
| $7,500 to $9,999 | 2,028 (3.1%) | 1,938 (3.1%) |
| $10,000 to $12,499 | 2,114 (3.2%) | 2,347 (3.8%) |
| $12,500 to $14,999 | 1,215 (1.8%) | 1,647 (2.7%) |
| $15,000 to $17,499 | 1,436 (2.2%) | 1,966 (3.2%) |
| $17,500 to $19,999 | 974 (1.5%) | 1,333 (2.2%) |
| $20,000 to $22,499 | 1,527 (2.3%) | 1,936 (3.1%) |
| $22,500 to $24,999 | 2,124 (3.2%) | 1,885 (3.1%) |
| $25,000 to $29,999 | 2,960 (4.5%) | 3,376 (5.5%) |
| $30,000 to $34,999 | 2,583 (3.9%) | 3,128 (5.1%) |
| $35,000 to $39,999 | 2,920 (4.4%) | 2,726 (4.4%) |
| $40,000 to $44,999 | 2,687 (4.1%) | 3,126 (5.1%) |
| $45,000 to $49,999 | 2,632 (4.0%) | 2,673 (4.3%) |
| $50,000 to $54,999 | 2,662 (4.0%) | 2,059 (3.3%) |
| $55,000 to $64,999 | 4,447 (6.7%) | 4,973 (8.1%) |
| $65,000 to $74,999 | 3,880 (5.9%) | 3,662 (5.9%) |
| $75,000 to $99,999 | 7,764 (11.7%) | 6,814 (11.1%) |
| $100,000+ | 15,211 (23.0%) | 7,630 (12.4%) |
| Total | 66,148 (100.0%) | 61,678 (100.0%) |
Earnings by Sex by Educational Attainment in Barnstable County
Average earnings in Barnstable County are $59,536 for men and $45,077 for women, a difference of 24.3%. Men with an educational attainment of graduate degree enjoy the highest average annual earnings of $92,592, while those with less than high school education earn the least with $39,410. Women with an educational attainment of graduate degree earn the most with the average annual earnings of $70,757, while those with less than high school education have the smallest earnings of $24,163.
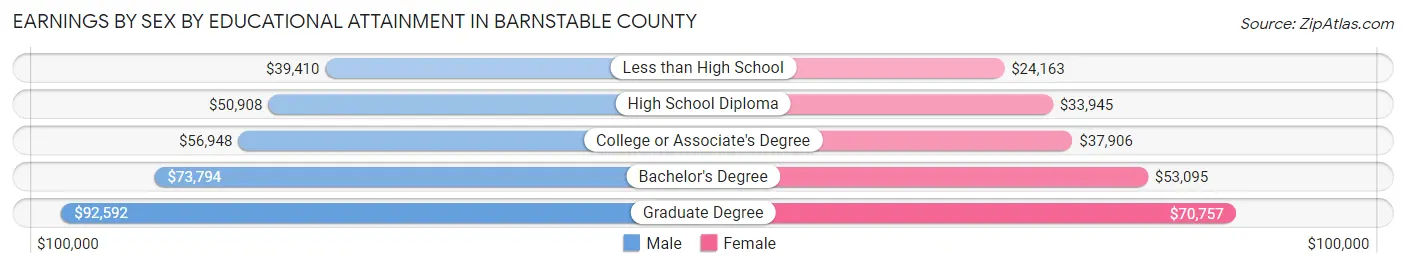
| Educational Attainment | Male Income | Female Income |
| Less than High School | $39,410 | $24,163 |
| High School Diploma | $50,908 | $33,945 |
| College or Associate's Degree | $56,948 | $37,906 |
| Bachelor's Degree | $73,794 | $53,095 |
| Graduate Degree | $92,592 | $70,757 |
| Total | $59,536 | $45,077 |
Family Income in Barnstable County
Family Income Brackets in Barnstable County
According to the Barnstable County family income data, there are 12,799 families falling into the $100,000 to $149,999 income range, which is the most common income bracket and makes up 20.6% of all families. Conversely, the $10,000 to $14,999 income bracket is the least frequent group with only 435 families (0.7%) belonging to this category.
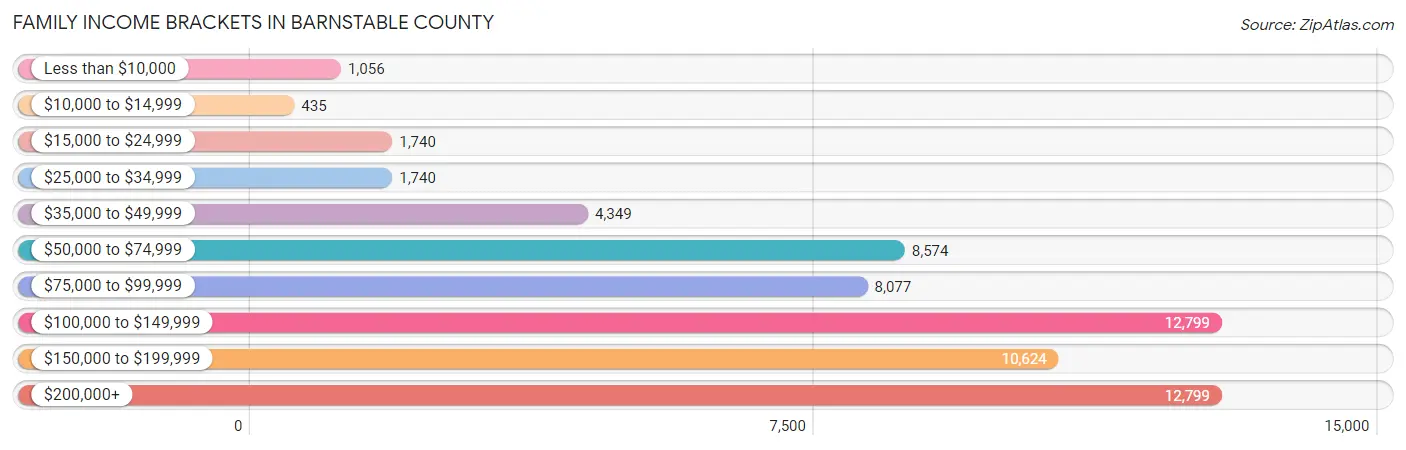
| Income Bracket | # Families | % Families |
| Less than $10,000 | 1,056 | 1.7% |
| $10,000 to $14,999 | 435 | 0.7% |
| $15,000 to $24,999 | 1,740 | 2.8% |
| $25,000 to $34,999 | 1,740 | 2.8% |
| $35,000 to $49,999 | 4,349 | 7.0% |
| $50,000 to $74,999 | 8,574 | 13.8% |
| $75,000 to $99,999 | 8,077 | 13.0% |
| $100,000 to $149,999 | 12,799 | 20.6% |
| $150,000 to $199,999 | 10,624 | 17.1% |
| $200,000+ | 12,799 | 20.6% |
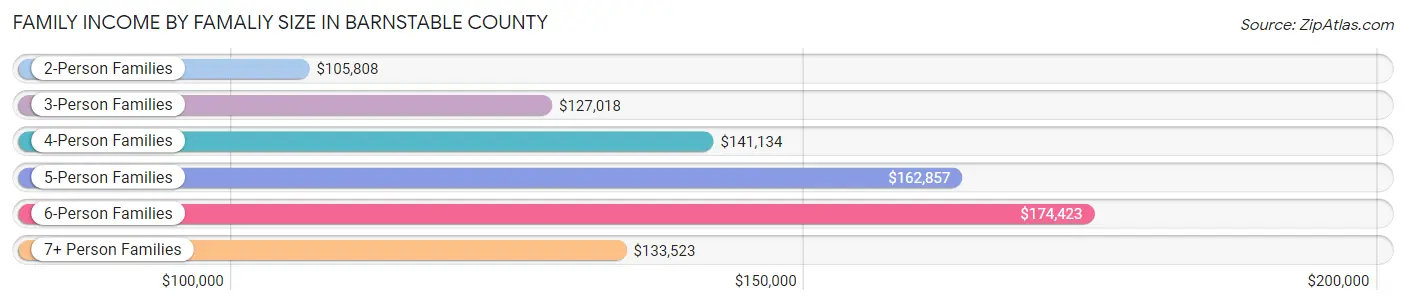
Family Income by Famaliy Size in Barnstable County
6-person families (810 | 1.3%) account for the highest median family income in Barnstable County with $174,423 per family, while 2-person families (38,442 | 61.9%) have the highest median income of $52,904 per family member.
| Income Bracket | # Families | Median Income |
| 2-Person Families | 38,442 (61.9%) | $105,808 |
| 3-Person Families | 11,046 (17.8%) | $127,018 |
| 4-Person Families | 7,800 (12.6%) | $141,134 |
| 5-Person Families | 3,596 (5.8%) | $162,857 |
| 6-Person Families | 810 (1.3%) | $174,423 |
| 7+ Person Families | 435 (0.7%) | $133,523 |
| Total | 62,129 (100.0%) | $118,599 |
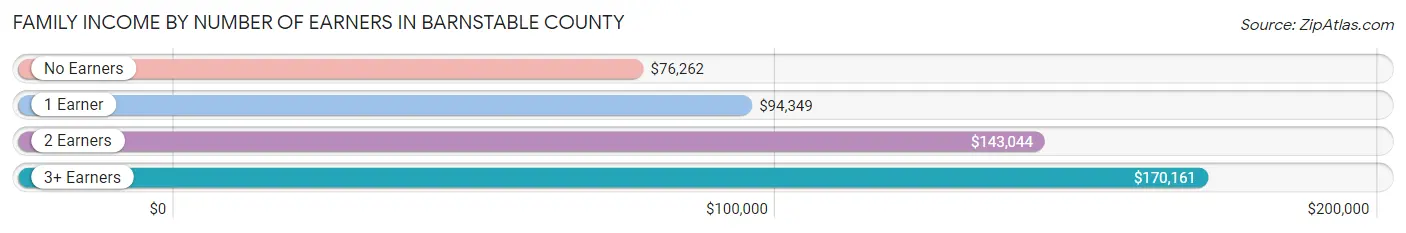
Family Income by Number of Earners in Barnstable County
The median family income in Barnstable County is $118,599, with families comprising 3+ earners (7,619) having the highest median family income of $170,161, while families with no earners (13,395) have the lowest median family income of $76,262, accounting for 12.3% and 21.6% of families, respectively.
| Number of Earners | # Families | Median Income |
| No Earners | 13,395 (21.6%) | $76,262 |
| 1 Earner | 17,212 (27.7%) | $94,349 |
| 2 Earners | 23,903 (38.5%) | $143,044 |
| 3+ Earners | 7,619 (12.3%) | $170,161 |
| Total | 62,129 (100.0%) | $118,599 |
Household Income in Barnstable County
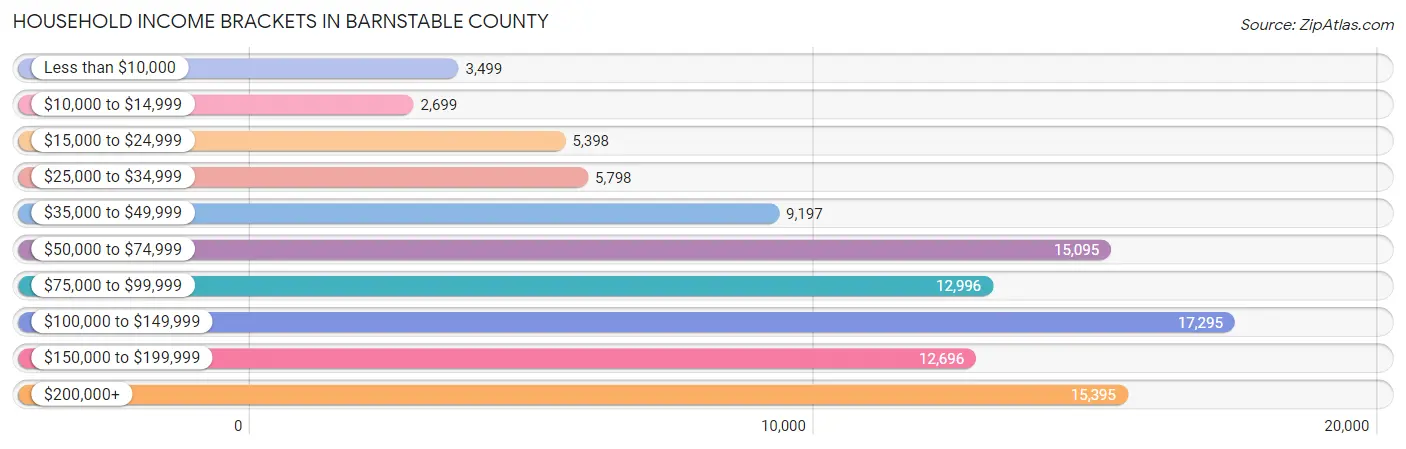
Household Income Brackets in Barnstable County
With 17,295 households falling in the category, the $100,000 to $149,999 income range is the most frequent in Barnstable County, accounting for 17.3% of all households. In contrast, only 2,699 households (2.7%) fall into the $10,000 to $14,999 income bracket, making it the least populous group.
| Income Bracket | # Households | % Households |
| Less than $10,000 | 3,499 | 3.5% |
| $10,000 to $14,999 | 2,699 | 2.7% |
| $15,000 to $24,999 | 5,398 | 5.4% |
| $25,000 to $34,999 | 5,798 | 5.8% |
| $35,000 to $49,999 | 9,197 | 9.2% |
| $50,000 to $74,999 | 15,095 | 15.1% |
| $75,000 to $99,999 | 12,996 | 13.0% |
| $100,000 to $149,999 | 17,295 | 17.3% |
| $150,000 to $199,999 | 12,696 | 12.7% |
| $200,000+ | 15,395 | 15.4% |
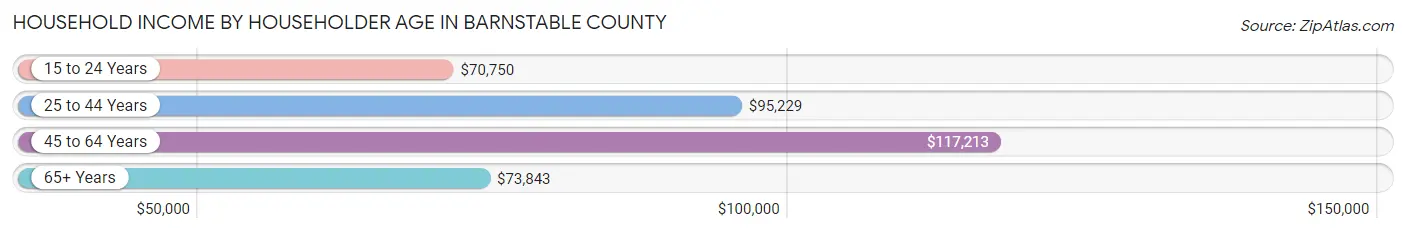
Household Income by Householder Age in Barnstable County
The median household income in Barnstable County is $90,447, with the highest median household income of $117,213 found in the 45 to 64 years age bracket for the primary householder. A total of 36,823 households (36.8%) fall into this category. Meanwhile, the 15 to 24 years age bracket for the primary householder has the lowest median household income of $70,750, with 972 households (1.0%) in this group.
| Income Bracket | # Households | Median Income |
| 15 to 24 Years | 972 (1.0%) | $70,750 |
| 25 to 44 Years | 16,919 (16.9%) | $95,229 |
| 45 to 64 Years | 36,823 (36.8%) | $117,213 |
| 65+ Years | 45,255 (45.3%) | $73,843 |
| Total | 99,969 (100.0%) | $90,447 |
Poverty in Barnstable County
Income Below Poverty by Sex and Age in Barnstable County
With 6.1% poverty level for males and 7.9% for females among the residents of Barnstable County, under 5 year old males and 25 to 34 year old females are the most vulnerable to poverty, with 489 males (12.0%) and 1,231 females (12.4%) in their respective age groups living below the poverty level.
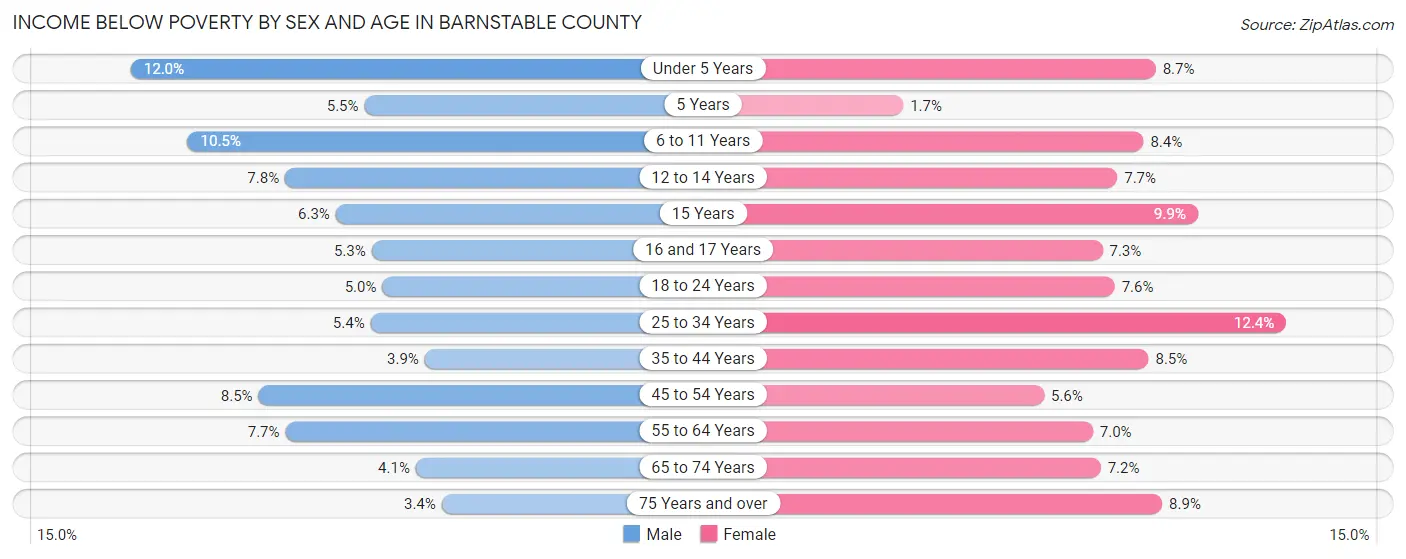
| Age Bracket | Male | Female |
| Under 5 Years | 489 (12.0%) | 314 (8.7%) |
| 5 Years | 61 (5.5%) | 17 (1.7%) |
| 6 to 11 Years | 543 (10.5%) | 445 (8.4%) |
| 12 to 14 Years | 238 (7.7%) | 209 (7.7%) |
| 15 Years | 79 (6.3%) | 74 (9.9%) |
| 16 and 17 Years | 121 (5.3%) | 169 (7.3%) |
| 18 to 24 Years | 428 (5.0%) | 530 (7.6%) |
| 25 to 34 Years | 572 (5.4%) | 1,231 (12.4%) |
| 35 to 44 Years | 403 (3.9%) | 895 (8.5%) |
| 45 to 54 Years | 1,019 (8.5%) | 754 (5.6%) |
| 55 to 64 Years | 1,478 (7.7%) | 1,501 (7.0%) |
| 65 to 74 Years | 790 (4.1%) | 1,593 (7.2%) |
| 75 Years and over | 431 (3.4%) | 1,527 (8.9%) |
| Total | 6,652 (6.1%) | 9,259 (7.9%) |
Income Above Poverty by Sex and Age in Barnstable County
According to the poverty statistics in Barnstable County, males aged 75 years and over and females aged 5 years are the age groups that are most secure financially, with 96.6% of males and 98.3% of females in these age groups living above the poverty line.
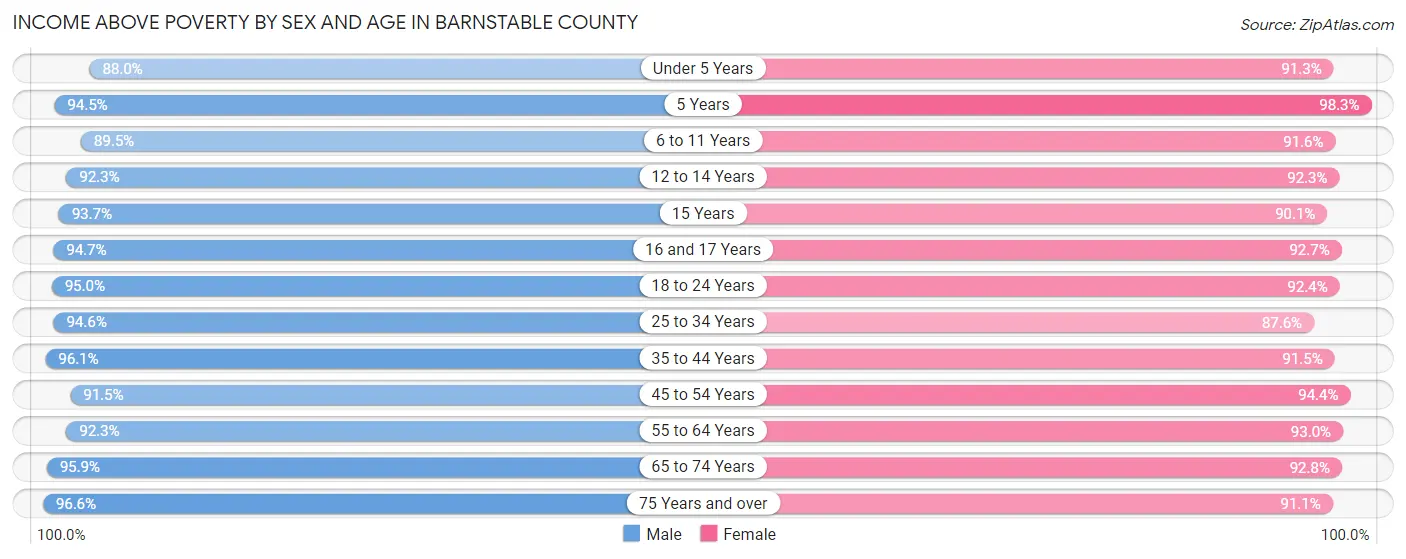
| Age Bracket | Male | Female |
| Under 5 Years | 3,571 (88.0%) | 3,280 (91.3%) |
| 5 Years | 1,040 (94.5%) | 975 (98.3%) |
| 6 to 11 Years | 4,650 (89.5%) | 4,855 (91.6%) |
| 12 to 14 Years | 2,832 (92.2%) | 2,515 (92.3%) |
| 15 Years | 1,167 (93.7%) | 673 (90.1%) |
| 16 and 17 Years | 2,144 (94.7%) | 2,159 (92.7%) |
| 18 to 24 Years | 8,058 (95.0%) | 6,440 (92.4%) |
| 25 to 34 Years | 10,089 (94.6%) | 8,718 (87.6%) |
| 35 to 44 Years | 10,047 (96.1%) | 9,586 (91.5%) |
| 45 to 54 Years | 10,990 (91.5%) | 12,647 (94.4%) |
| 55 to 64 Years | 17,614 (92.3%) | 19,984 (93.0%) |
| 65 to 74 Years | 18,423 (95.9%) | 20,513 (92.8%) |
| 75 Years and over | 12,291 (96.6%) | 15,593 (91.1%) |
| Total | 102,916 (93.9%) | 107,938 (92.1%) |
Income Below Poverty Among Married-Couple Families in Barnstable County
The poverty statistics for married-couple families in Barnstable County show that 2.4% or 1,177 of the total 49,694 families live below the poverty line. Families with 1 or 2 children have the highest poverty rate of 3.9%, comprising of 409 families. On the other hand, families with 5 or more children have the lowest poverty rate of 0.0%, which includes 0 families.
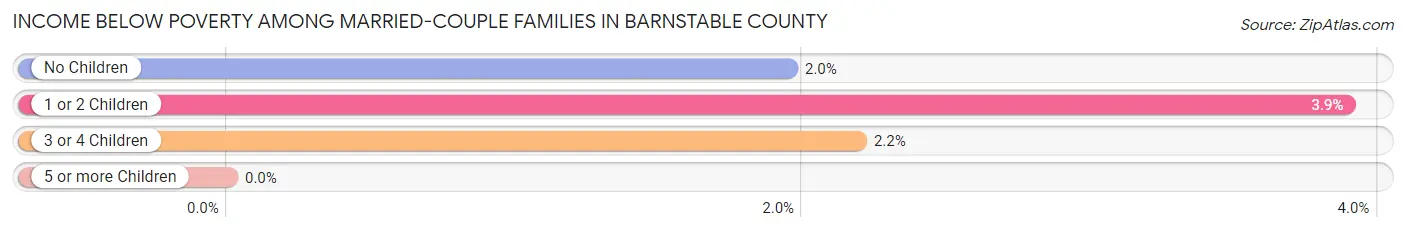
| Children | Above Poverty | Below Poverty |
| No Children | 36,287 (98.1%) | 722 (1.9%) |
| 1 or 2 Children | 10,098 (96.1%) | 409 (3.9%) |
| 3 or 4 Children | 2,051 (97.8%) | 46 (2.2%) |
| 5 or more Children | 81 (100.0%) | 0 (0.0%) |
| Total | 48,517 (97.6%) | 1,177 (2.4%) |
Income Below Poverty Among Single-Parent Households in Barnstable County
According to the poverty data in Barnstable County, 4.9% or 176 single-father households and 13.2% or 1,164 single-mother households are living below the poverty line. Among single-father households, those with 1 or 2 children have the highest poverty rate, with 109 households (5.4%) experiencing poverty. Likewise, among single-mother households, those with 1 or 2 children have the highest poverty rate, with 787 households (23.3%) falling below the poverty line.
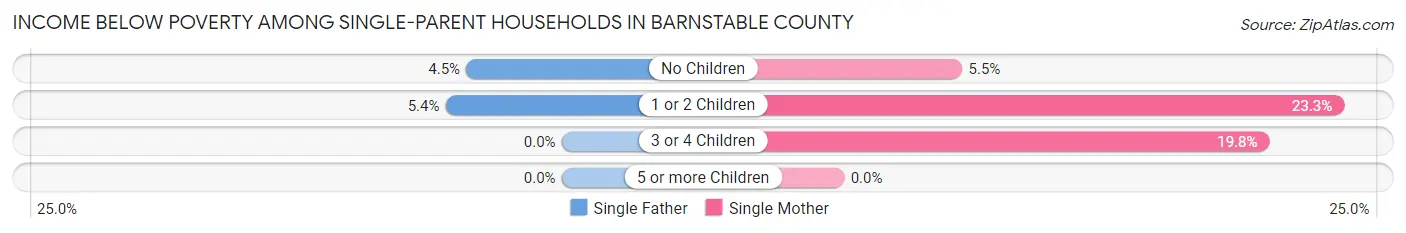
| Children | Single Father | Single Mother |
| No Children | 67 (4.4%) | 267 (5.5%) |
| 1 or 2 Children | 109 (5.4%) | 787 (23.3%) |
| 3 or 4 Children | 0 (0.0%) | 110 (19.8%) |
| 5 or more Children | 0 (0.0%) | 0 (0.0%) |
| Total | 176 (4.9%) | 1,164 (13.2%) |
Income Below Poverty Among Married-Couple vs Single-Parent Households in Barnstable County
The poverty data for Barnstable County shows that 1,177 of the married-couple family households (2.4%) and 1,340 of the single-parent households (10.8%) are living below the poverty level. Within the married-couple family households, those with 1 or 2 children have the highest poverty rate, with 409 households (3.9%) falling below the poverty line. Among the single-parent households, those with 3 or 4 children have the highest poverty rate, with 110 household (17.4%) living below poverty.
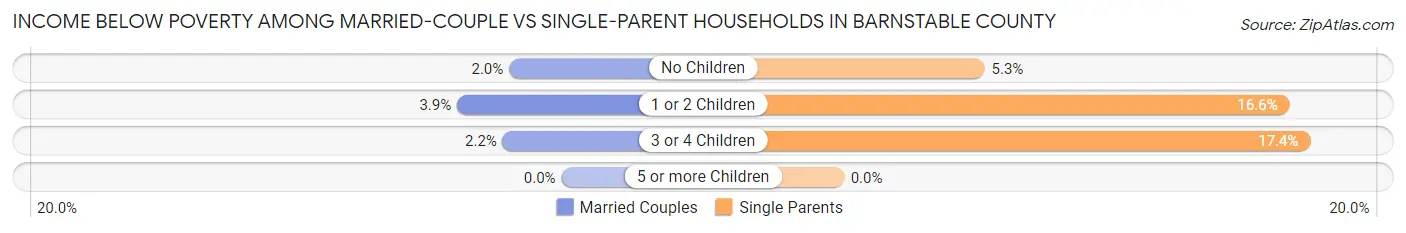
| Children | Married-Couple Families | Single-Parent Households |
| No Children | 722 (1.9%) | 334 (5.2%) |
| 1 or 2 Children | 409 (3.9%) | 896 (16.6%) |
| 3 or 4 Children | 46 (2.2%) | 110 (17.4%) |
| 5 or more Children | 0 (0.0%) | 0 (0.0%) |
| Total | 1,177 (2.4%) | 1,340 (10.8%) |
Employment Characteristics in Barnstable County
Employment by Class of Employer in Barnstable County
Among the 111,344 employed individuals in Barnstable County, private company employees (67,088 | 60.3%), not-for-profit organizations (13,651 | 12.3%), and self-employed (not incorporated) (9,581 | 8.6%) make up the most common classes of employment.
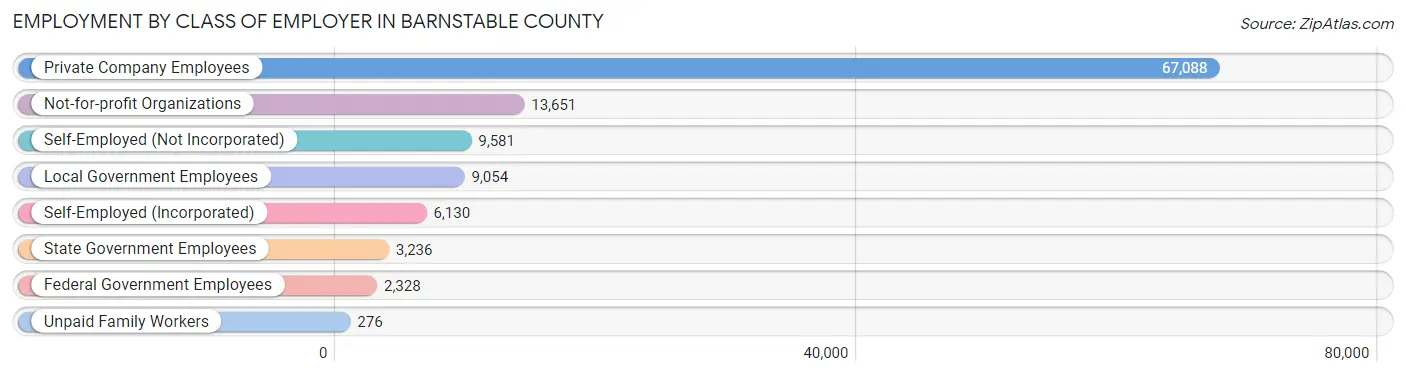
| Employer Class | # Employees | % Employees |
| Private Company Employees | 67,088 | 60.3% |
| Self-Employed (Incorporated) | 6,130 | 5.5% |
| Self-Employed (Not Incorporated) | 9,581 | 8.6% |
| Not-for-profit Organizations | 13,651 | 12.3% |
| Local Government Employees | 9,054 | 8.1% |
| State Government Employees | 3,236 | 2.9% |
| Federal Government Employees | 2,328 | 2.1% |
| Unpaid Family Workers | 276 | 0.3% |
| Total | 111,344 | 100.0% |
Employment Status by Age in Barnstable County
According to the labor force statistics for Barnstable County, out of the total population over 16 years of age (200,688), 59.7% or 119,811 individuals are in the labor force, with 4.5% or 5,391 of them unemployed. The age group with the highest labor force participation rate is 35 to 44 years, with 88.1% or 18,475 individuals in the labor force. Within the labor force, the 65 to 74 years age range has the highest percentage of unemployed individuals, with 5.9% or 881 of them being unemployed.
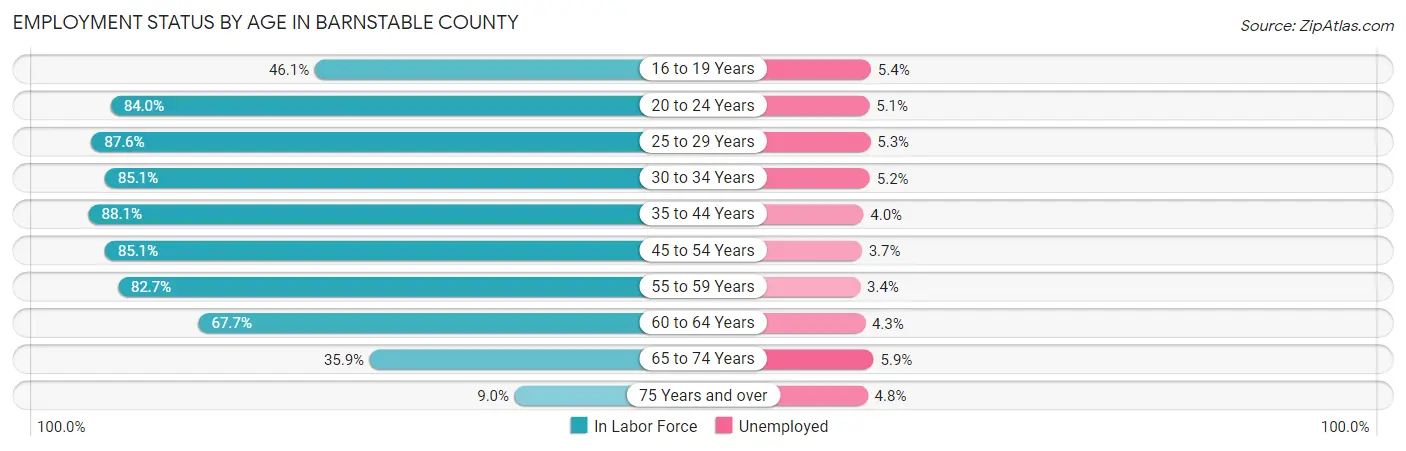
| Age Bracket | In Labor Force | Unemployed |
| 16 to 19 Years | 4,096 (46.1%) | 221 (5.4%) |
| 20 to 24 Years | 9,695 (84.0%) | 494 (5.1%) |
| 25 to 29 Years | 9,180 (87.6%) | 487 (5.3%) |
| 30 to 34 Years | 8,655 (85.1%) | 450 (5.2%) |
| 35 to 44 Years | 18,475 (88.1%) | 739 (4.0%) |
| 45 to 54 Years | 21,638 (85.1%) | 801 (3.7%) |
| 55 to 59 Years | 16,091 (82.7%) | 547 (3.4%) |
| 60 to 64 Years | 14,363 (67.7%) | 618 (4.3%) |
| 65 to 74 Years | 14,928 (35.9%) | 881 (5.9%) |
| 75 Years and over | 2,786 (9.0%) | 134 (4.8%) |
| Total | 119,811 (59.7%) | 5,391 (4.5%) |
Employment Status by Educational Attainment in Barnstable County
According to labor force statistics for Barnstable County, 82.1% of individuals (88,438) out of the total population between 25 and 64 years of age (107,720) are in the labor force, with 4.1% or 3,626 of them being unemployed. The group with the highest labor force participation rate are those with the educational attainment of bachelor's degree or higher, with 85.4% or 39,482 individuals in the labor force. Within the labor force, individuals with high school diploma education have the highest percentage of unemployment, with 5.2% or 1,017 of them being unemployed.
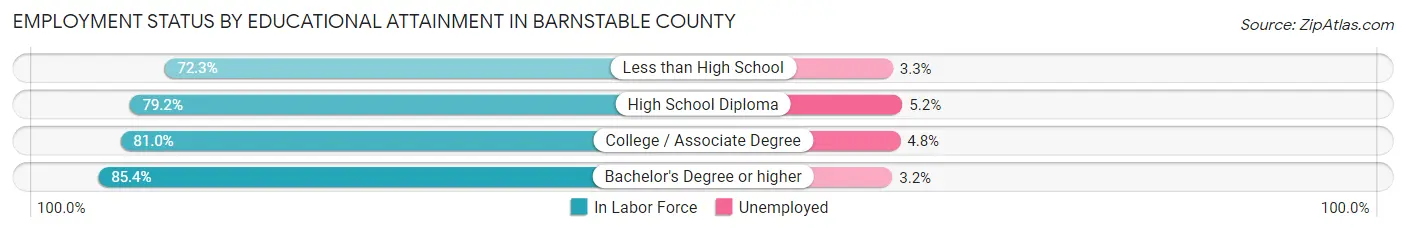
| Educational Attainment | In Labor Force | Unemployed |
| Less than High School | 3,649 (72.3%) | 167 (3.3%) |
| High School Diploma | 19,551 (79.2%) | 1,284 (5.2%) |
| College / Associate Degree | 25,722 (81.0%) | 1,524 (4.8%) |
| Bachelor's Degree or higher | 39,482 (85.4%) | 1,479 (3.2%) |
| Total | 88,438 (82.1%) | 4,417 (4.1%) |
Employment Occupations by Sex in Barnstable County
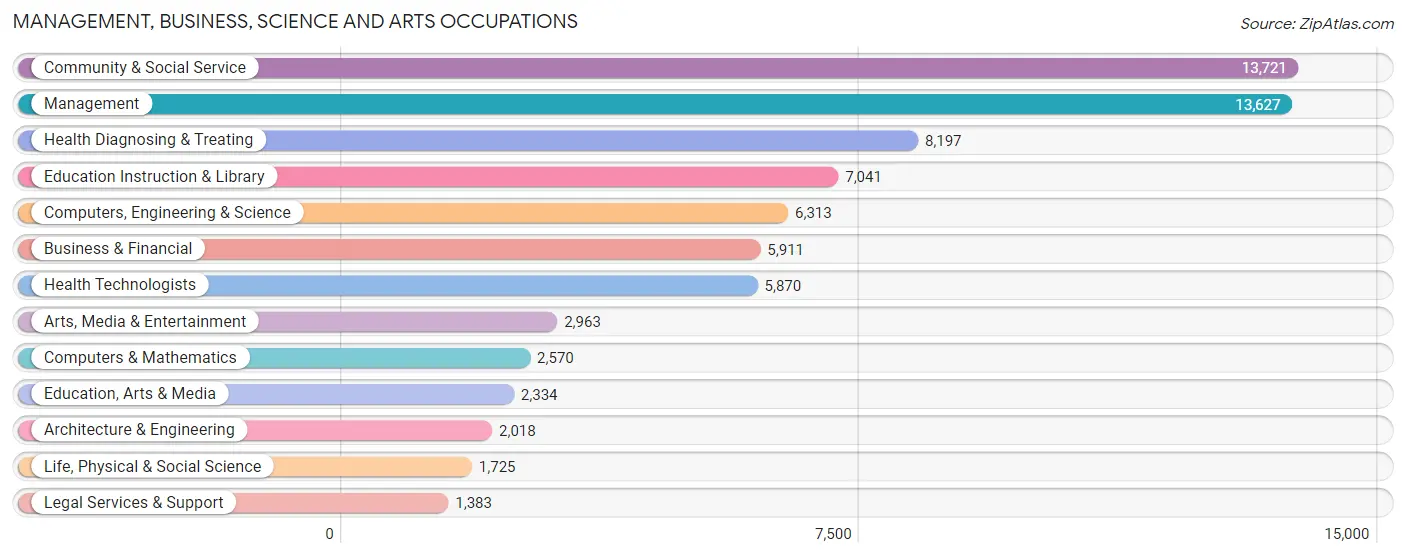
Management, Business, Science and Arts Occupations
The most common Management, Business, Science and Arts occupations in Barnstable County are Community & Social Service (13,721 | 12.0%), Management (13,627 | 12.0%), Health Diagnosing & Treating (8,197 | 7.2%), Education Instruction & Library (7,041 | 6.2%), and Computers, Engineering & Science (6,313 | 5.5%).
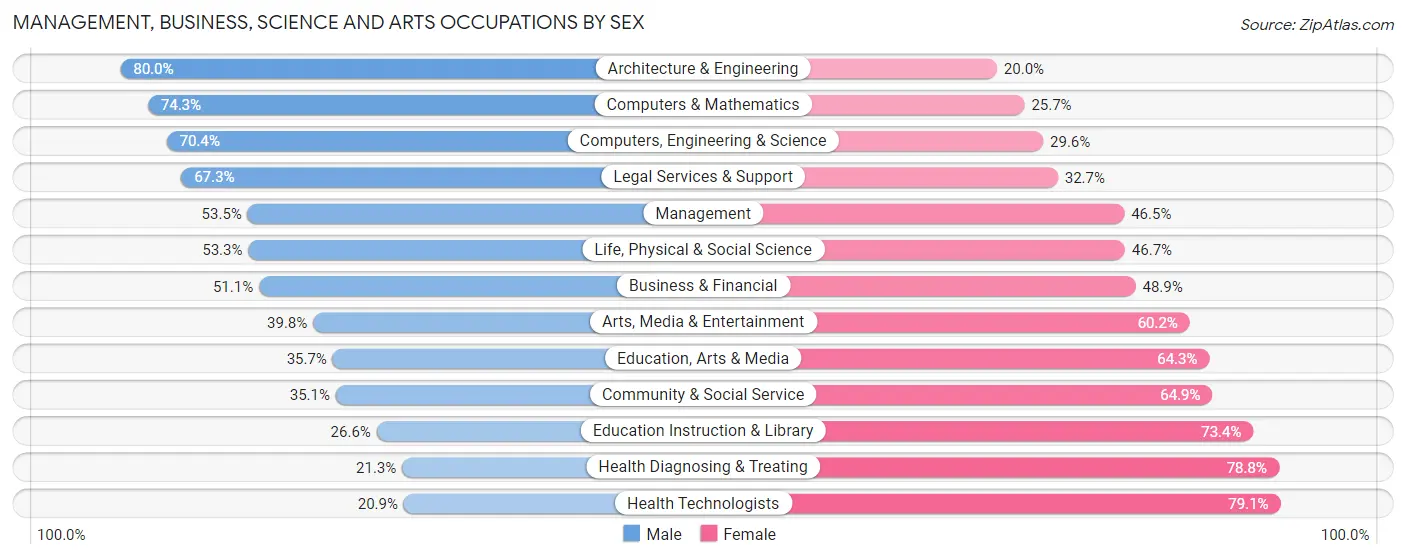
Management, Business, Science and Arts Occupations by Sex
Within the Management, Business, Science and Arts occupations in Barnstable County, the most male-oriented occupations are Architecture & Engineering (80.0%), Computers & Mathematics (74.3%), and Computers, Engineering & Science (70.4%), while the most female-oriented occupations are Health Technologists (79.1%), Health Diagnosing & Treating (78.7%), and Education Instruction & Library (73.4%).
| Occupation | Male | Female |
| Management | 7,286 (53.5%) | 6,341 (46.5%) |
| Business & Financial | 3,021 (51.1%) | 2,890 (48.9%) |
| Computers, Engineering & Science | 4,444 (70.4%) | 1,869 (29.6%) |
| Computers & Mathematics | 1,909 (74.3%) | 661 (25.7%) |
| Architecture & Engineering | 1,615 (80.0%) | 403 (20.0%) |
| Life, Physical & Social Science | 920 (53.3%) | 805 (46.7%) |
| Community & Social Service | 4,815 (35.1%) | 8,906 (64.9%) |
| Education, Arts & Media | 834 (35.7%) | 1,500 (64.3%) |
| Legal Services & Support | 931 (67.3%) | 452 (32.7%) |
| Education Instruction & Library | 1,870 (26.6%) | 5,171 (73.4%) |
| Arts, Media & Entertainment | 1,180 (39.8%) | 1,783 (60.2%) |
| Health Diagnosing & Treating | 1,742 (21.2%) | 6,455 (78.7%) |
| Health Technologists | 1,227 (20.9%) | 4,643 (79.1%) |
| Total (Category) | 21,308 (44.6%) | 26,461 (55.4%) |
| Total (Overall) | 58,719 (51.5%) | 55,181 (48.4%) |
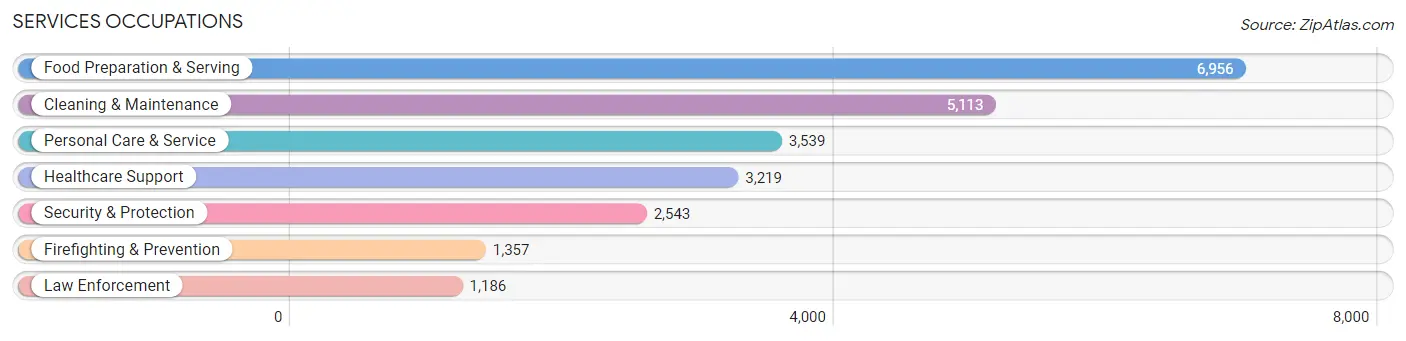
Services Occupations
The most common Services occupations in Barnstable County are Food Preparation & Serving (6,956 | 6.1%), Cleaning & Maintenance (5,113 | 4.5%), Personal Care & Service (3,539 | 3.1%), Healthcare Support (3,219 | 2.8%), and Security & Protection (2,543 | 2.2%).
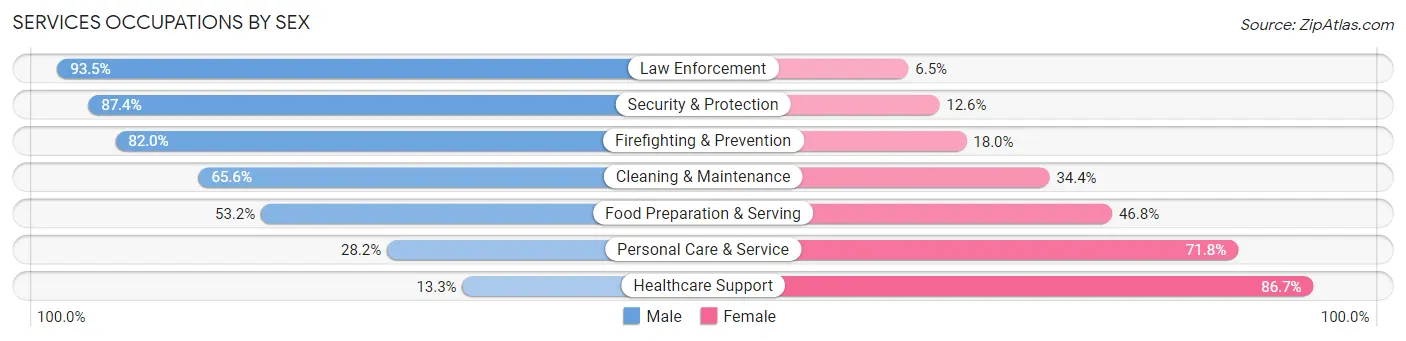
Services Occupations by Sex
Within the Services occupations in Barnstable County, the most male-oriented occupations are Law Enforcement (93.5%), Security & Protection (87.4%), and Firefighting & Prevention (82.0%), while the most female-oriented occupations are Healthcare Support (86.7%), Personal Care & Service (71.8%), and Food Preparation & Serving (46.8%).
| Occupation | Male | Female |
| Healthcare Support | 428 (13.3%) | 2,791 (86.7%) |
| Security & Protection | 2,222 (87.4%) | 321 (12.6%) |
| Firefighting & Prevention | 1,113 (82.0%) | 244 (18.0%) |
| Law Enforcement | 1,109 (93.5%) | 77 (6.5%) |
| Food Preparation & Serving | 3,699 (53.2%) | 3,257 (46.8%) |
| Cleaning & Maintenance | 3,352 (65.6%) | 1,761 (34.4%) |
| Personal Care & Service | 999 (28.2%) | 2,540 (71.8%) |
| Total (Category) | 10,700 (50.1%) | 10,670 (49.9%) |
| Total (Overall) | 58,719 (51.5%) | 55,181 (48.4%) |
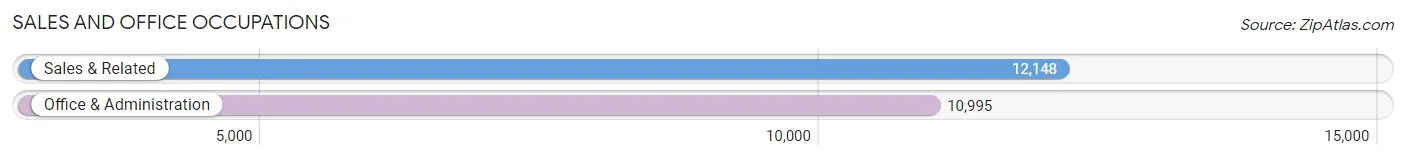
Sales and Office Occupations
The most common Sales and Office occupations in Barnstable County are Sales & Related (12,148 | 10.7%), and Office & Administration (10,995 | 9.7%).
Sales and Office Occupations by Sex
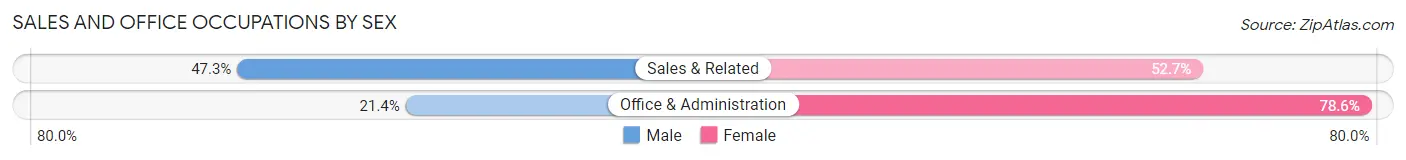
| Occupation | Male | Female |
| Sales & Related | 5,745 (47.3%) | 6,403 (52.7%) |
| Office & Administration | 2,351 (21.4%) | 8,644 (78.6%) |
| Total (Category) | 8,096 (35.0%) | 15,047 (65.0%) |
| Total (Overall) | 58,719 (51.5%) | 55,181 (48.4%) |
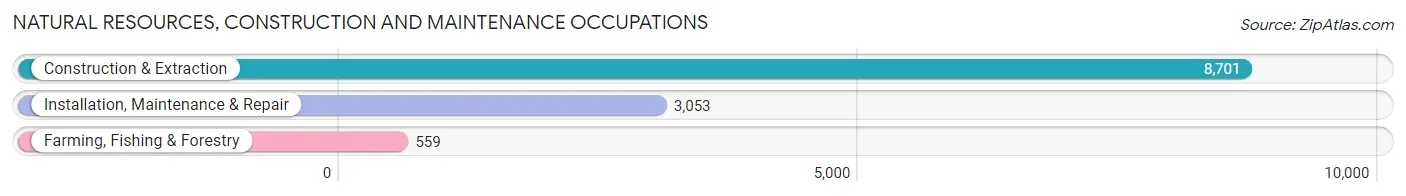
Natural Resources, Construction and Maintenance Occupations
The most common Natural Resources, Construction and Maintenance occupations in Barnstable County are Construction & Extraction (8,701 | 7.6%), Installation, Maintenance & Repair (3,053 | 2.7%), and Farming, Fishing & Forestry (559 | 0.5%).
Natural Resources, Construction and Maintenance Occupations by Sex
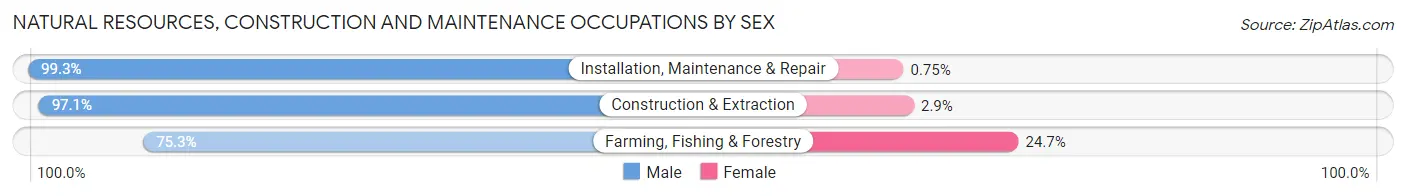
| Occupation | Male | Female |
| Farming, Fishing & Forestry | 421 (75.3%) | 138 (24.7%) |
| Construction & Extraction | 8,445 (97.1%) | 256 (2.9%) |
| Installation, Maintenance & Repair | 3,030 (99.3%) | 23 (0.7%) |
| Total (Category) | 11,896 (96.6%) | 417 (3.4%) |
| Total (Overall) | 58,719 (51.5%) | 55,181 (48.4%) |
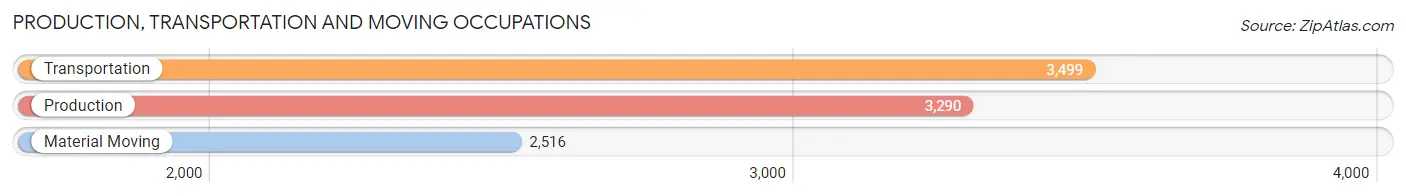
Production, Transportation and Moving Occupations
The most common Production, Transportation and Moving occupations in Barnstable County are Transportation (3,499 | 3.1%), Production (3,290 | 2.9%), and Material Moving (2,516 | 2.2%).
Production, Transportation and Moving Occupations by Sex
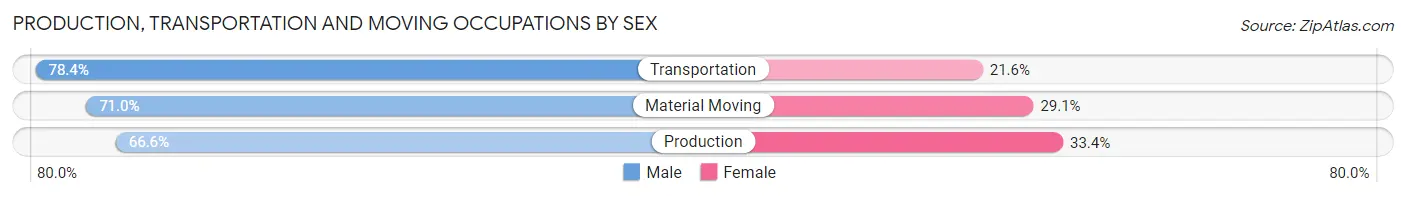
| Occupation | Male | Female |
| Production | 2,191 (66.6%) | 1,099 (33.4%) |
| Transportation | 2,743 (78.4%) | 756 (21.6%) |
| Material Moving | 1,785 (71.0%) | 731 (29.0%) |
| Total (Category) | 6,719 (72.2%) | 2,586 (27.8%) |
| Total (Overall) | 58,719 (51.5%) | 55,181 (48.4%) |
Employment Industries by Sex in Barnstable County
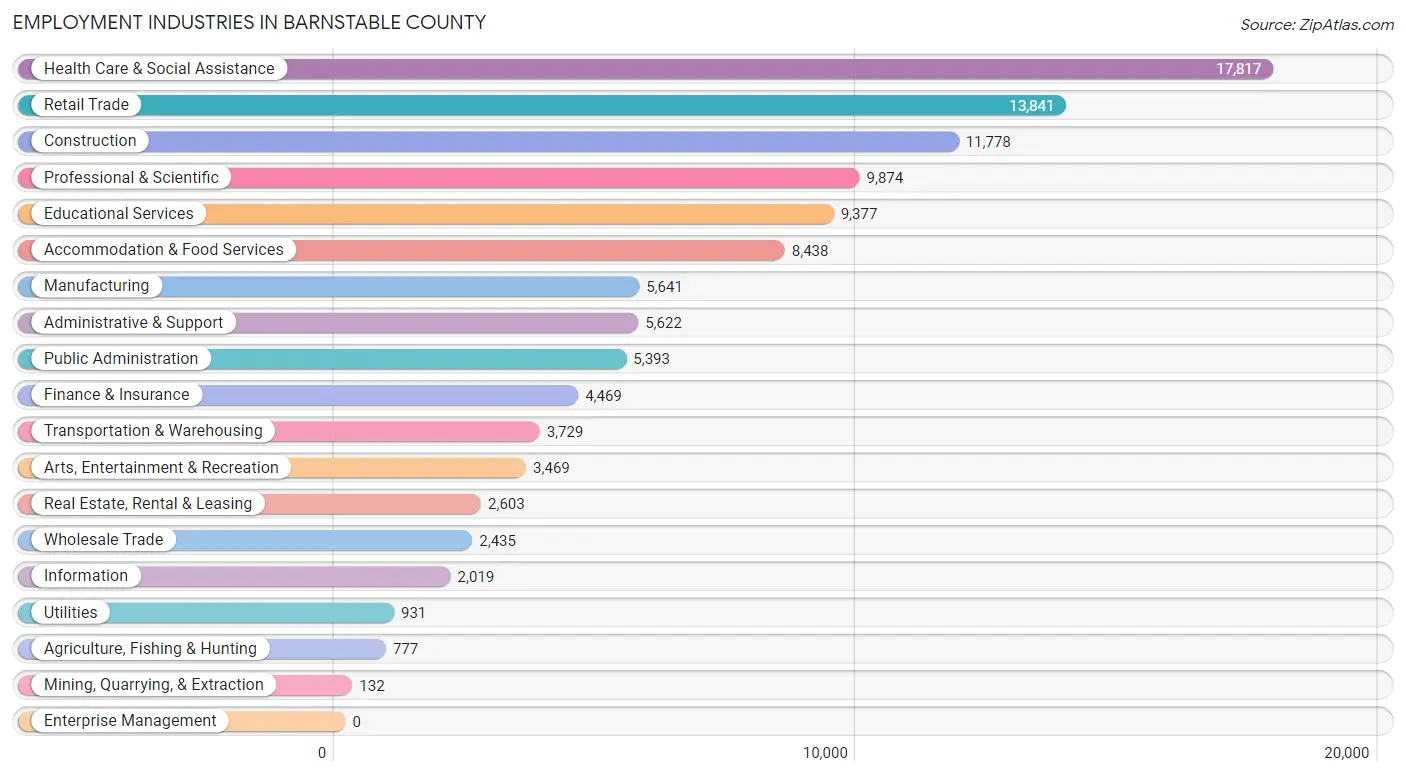
Employment Industries in Barnstable County
The major employment industries in Barnstable County include Health Care & Social Assistance (17,817 | 15.6%), Retail Trade (13,841 | 12.1%), Construction (11,778 | 10.3%), Professional & Scientific (9,874 | 8.7%), and Educational Services (9,377 | 8.2%).
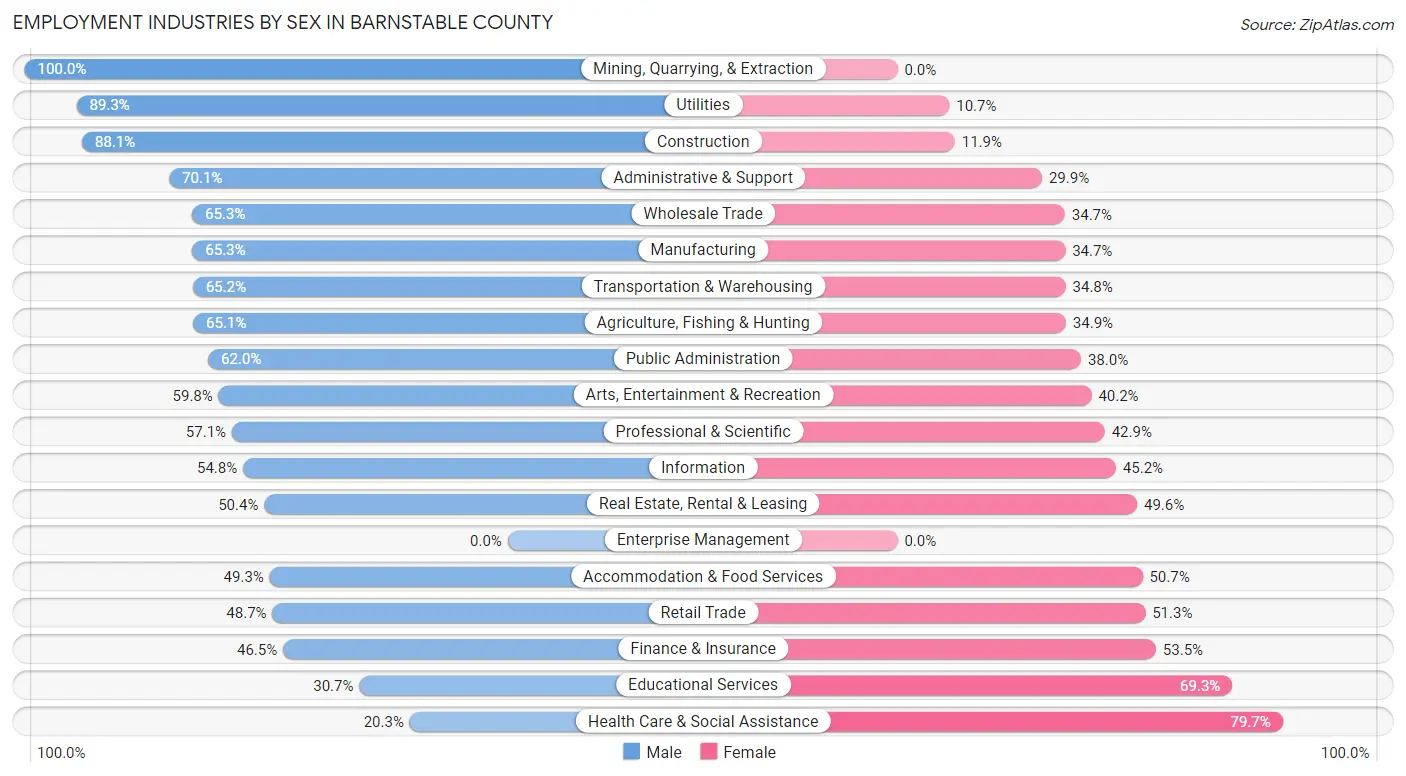
Employment Industries by Sex in Barnstable County
The Barnstable County industries that see more men than women are Mining, Quarrying, & Extraction (100.0%), Utilities (89.3%), and Construction (88.1%), whereas the industries that tend to have a higher number of women are Health Care & Social Assistance (79.7%), Educational Services (69.3%), and Finance & Insurance (53.5%).
| Industry | Male | Female |
| Agriculture, Fishing & Hunting | 506 (65.1%) | 271 (34.9%) |
| Mining, Quarrying, & Extraction | 132 (100.0%) | 0 (0.0%) |
| Construction | 10,380 (88.1%) | 1,398 (11.9%) |
| Manufacturing | 3,682 (65.3%) | 1,959 (34.7%) |
| Wholesale Trade | 1,591 (65.3%) | 844 (34.7%) |
| Retail Trade | 6,742 (48.7%) | 7,099 (51.3%) |
| Transportation & Warehousing | 2,431 (65.2%) | 1,298 (34.8%) |
| Utilities | 831 (89.3%) | 100 (10.7%) |
| Information | 1,106 (54.8%) | 913 (45.2%) |
| Finance & Insurance | 2,078 (46.5%) | 2,391 (53.5%) |
| Real Estate, Rental & Leasing | 1,312 (50.4%) | 1,291 (49.6%) |
| Professional & Scientific | 5,637 (57.1%) | 4,237 (42.9%) |
| Enterprise Management | 0 (0.0%) | 0 (0.0%) |
| Administrative & Support | 3,940 (70.1%) | 1,682 (29.9%) |
| Educational Services | 2,881 (30.7%) | 6,496 (69.3%) |
| Health Care & Social Assistance | 3,614 (20.3%) | 14,203 (79.7%) |
| Arts, Entertainment & Recreation | 2,076 (59.8%) | 1,393 (40.2%) |
| Accommodation & Food Services | 4,158 (49.3%) | 4,280 (50.7%) |
| Public Administration | 3,344 (62.0%) | 2,049 (38.0%) |
| Total | 58,719 (51.5%) | 55,181 (48.4%) |
Education in Barnstable County
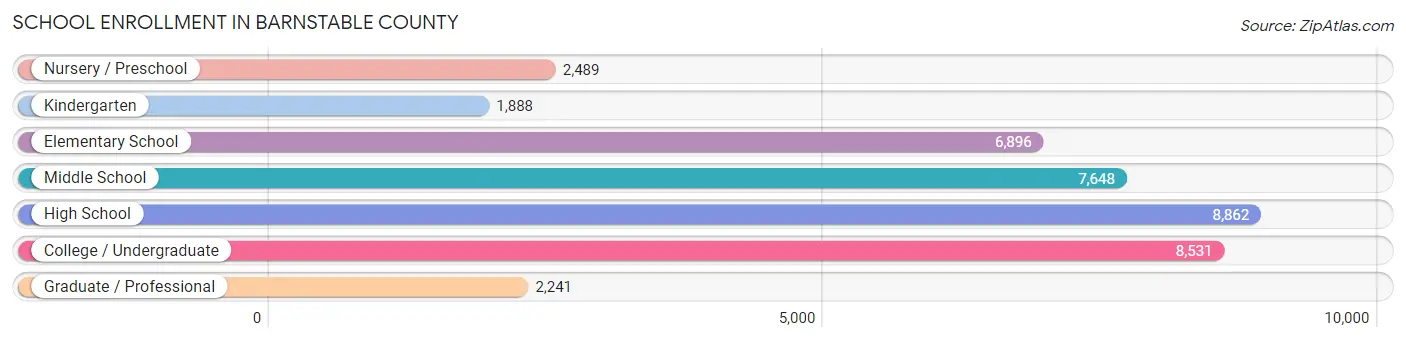
School Enrollment in Barnstable County
The most common levels of schooling among the 38,555 students in Barnstable County are high school (8,862 | 23.0%), college / undergraduate (8,531 | 22.1%), and middle school (7,648 | 19.8%).
| School Level | # Students | % Students |
| Nursery / Preschool | 2,489 | 6.5% |
| Kindergarten | 1,888 | 4.9% |
| Elementary School | 6,896 | 17.9% |
| Middle School | 7,648 | 19.8% |
| High School | 8,862 | 23.0% |
| College / Undergraduate | 8,531 | 22.1% |
| Graduate / Professional | 2,241 | 5.8% |
| Total | 38,555 | 100.0% |
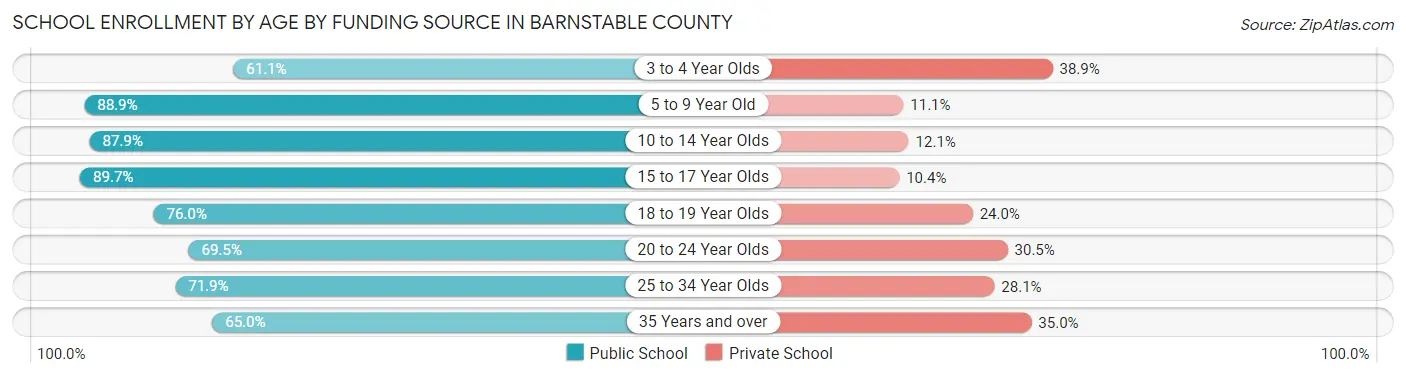
School Enrollment by Age by Funding Source in Barnstable County
Out of a total of 38,555 students who are enrolled in schools in Barnstable County, 7,094 (18.4%) attend a private institution, while the remaining 31,461 (81.6%) are enrolled in public schools. The age group of 3 to 4 year olds has the highest likelihood of being enrolled in private schools, with 675 (38.9% in the age bracket) enrolled. Conversely, the age group of 15 to 17 year olds has the lowest likelihood of being enrolled in a private school, with 5,759 (89.6% in the age bracket) attending a public institution.
| Age Bracket | Public School | Private School |
| 3 to 4 Year Olds | 1,060 (61.1%) | 675 (38.9%) |
| 5 to 9 Year Old | 7,362 (88.9%) | 921 (11.1%) |
| 10 to 14 Year Olds | 8,474 (87.9%) | 1,167 (12.1%) |
| 15 to 17 Year Olds | 5,759 (89.6%) | 665 (10.3%) |
| 18 to 19 Year Olds | 2,440 (76.0%) | 772 (24.0%) |
| 20 to 24 Year Olds | 2,818 (69.5%) | 1,239 (30.5%) |
| 25 to 34 Year Olds | 1,644 (71.9%) | 642 (28.1%) |
| 35 Years and over | 1,897 (65.0%) | 1,020 (35.0%) |
| Total | 31,461 (81.6%) | 7,094 (18.4%) |
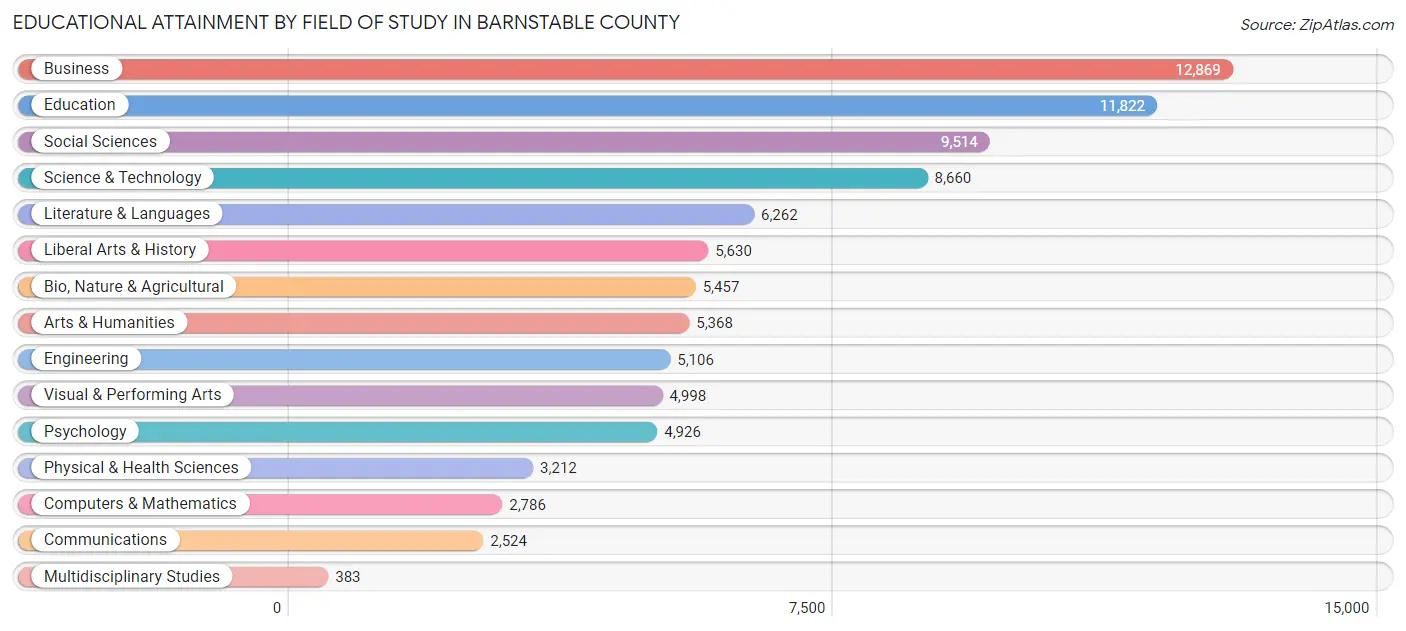
Educational Attainment by Field of Study in Barnstable County
Business (12,869 | 14.4%), education (11,822 | 13.2%), social sciences (9,514 | 10.6%), science & technology (8,660 | 9.7%), and literature & languages (6,262 | 7.0%) are the most common fields of study among 89,517 individuals in Barnstable County who have obtained a bachelor's degree or higher.
| Field of Study | # Graduates | % Graduates |
| Computers & Mathematics | 2,786 | 3.1% |
| Bio, Nature & Agricultural | 5,457 | 6.1% |
| Physical & Health Sciences | 3,212 | 3.6% |
| Psychology | 4,926 | 5.5% |
| Social Sciences | 9,514 | 10.6% |
| Engineering | 5,106 | 5.7% |
| Multidisciplinary Studies | 383 | 0.4% |
| Science & Technology | 8,660 | 9.7% |
| Business | 12,869 | 14.4% |
| Education | 11,822 | 13.2% |
| Literature & Languages | 6,262 | 7.0% |
| Liberal Arts & History | 5,630 | 6.3% |
| Visual & Performing Arts | 4,998 | 5.6% |
| Communications | 2,524 | 2.8% |
| Arts & Humanities | 5,368 | 6.0% |
| Total | 89,517 | 100.0% |
Transportation & Commute in Barnstable County
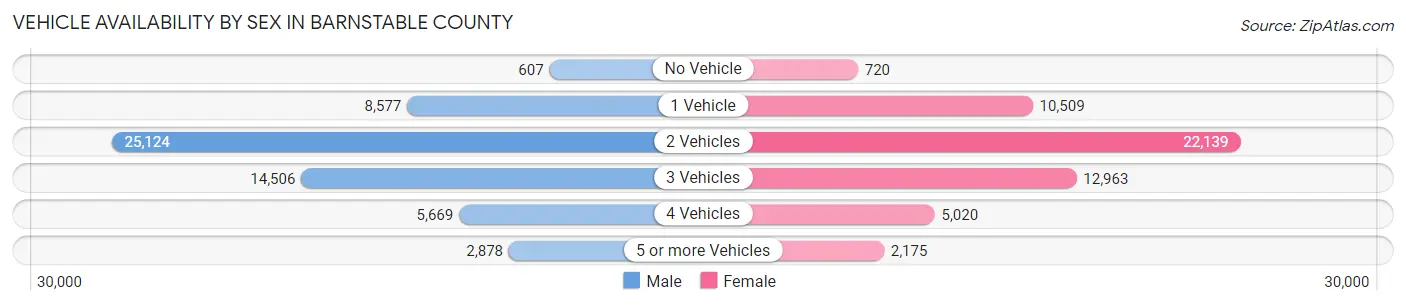
Vehicle Availability by Sex in Barnstable County
The most prevalent vehicle ownership categories in Barnstable County are males with 2 vehicles (25,124, accounting for 43.8%) and females with 2 vehicles (22,139, making up 46.9%).
| Vehicles Available | Male | Female |
| No Vehicle | 607 (1.1%) | 720 (1.3%) |
| 1 Vehicle | 8,577 (14.9%) | 10,509 (19.6%) |
| 2 Vehicles | 25,124 (43.8%) | 22,139 (41.4%) |
| 3 Vehicles | 14,506 (25.3%) | 12,963 (24.2%) |
| 4 Vehicles | 5,669 (9.9%) | 5,020 (9.4%) |
| 5 or more Vehicles | 2,878 (5.0%) | 2,175 (4.1%) |
| Total | 57,361 (100.0%) | 53,526 (100.0%) |
Commute Time in Barnstable County
The most frequently occuring commute durations in Barnstable County are 10 to 14 minutes (16,581 commuters, 17.1%), 15 to 19 minutes (16,197 commuters, 16.7%), and 20 to 24 minutes (13,665 commuters, 14.1%).
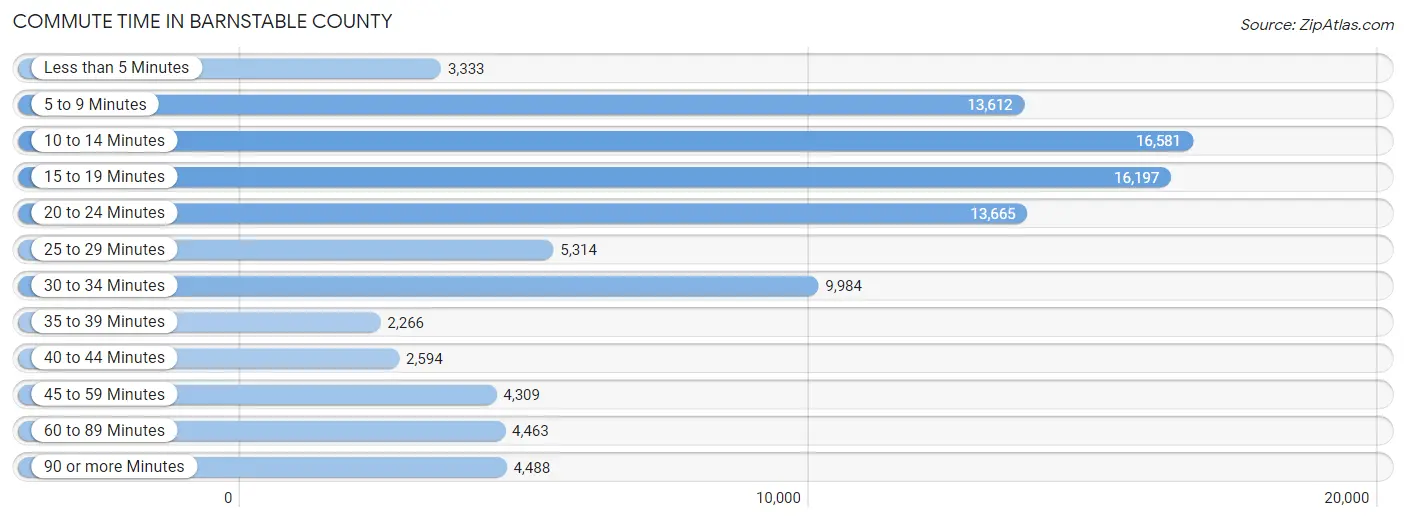
| Commute Time | # Commuters | % Commuters |
| Less than 5 Minutes | 3,333 | 3.4% |
| 5 to 9 Minutes | 13,612 | 14.1% |
| 10 to 14 Minutes | 16,581 | 17.1% |
| 15 to 19 Minutes | 16,197 | 16.7% |
| 20 to 24 Minutes | 13,665 | 14.1% |
| 25 to 29 Minutes | 5,314 | 5.5% |
| 30 to 34 Minutes | 9,984 | 10.3% |
| 35 to 39 Minutes | 2,266 | 2.3% |
| 40 to 44 Minutes | 2,594 | 2.7% |
| 45 to 59 Minutes | 4,309 | 4.4% |
| 60 to 89 Minutes | 4,463 | 4.6% |
| 90 or more Minutes | 4,488 | 4.6% |
Commute Time by Sex in Barnstable County
The most common commute times in Barnstable County are 10 to 14 minutes (9,071 commuters, 18.0%) for males and 15 to 19 minutes (8,186 commuters, 17.7%) for females.
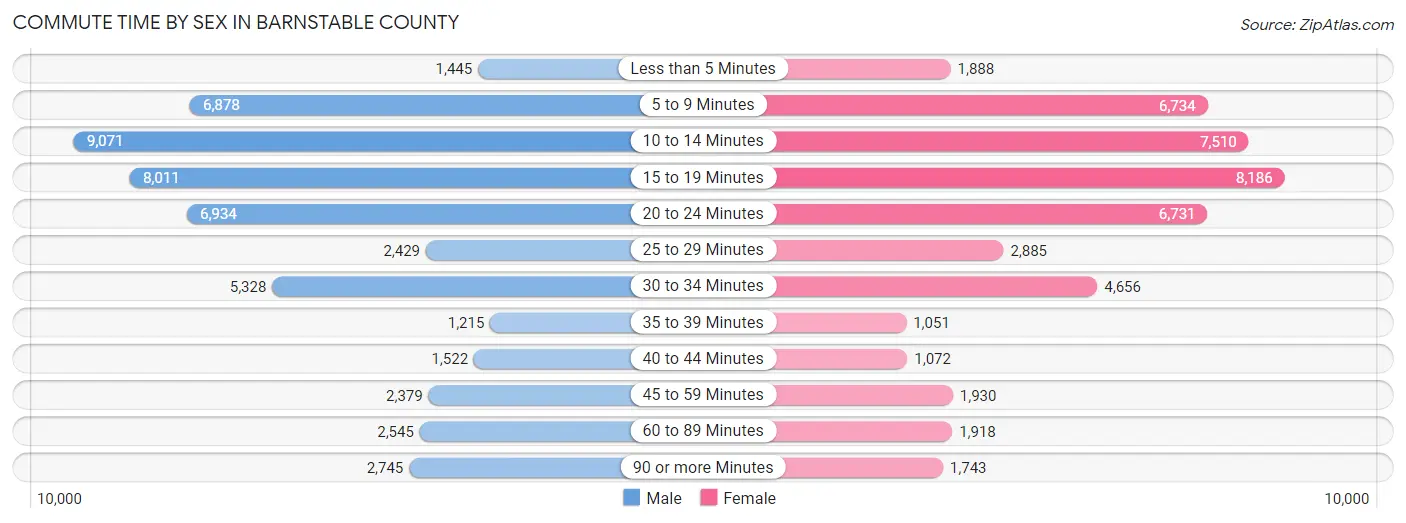
| Commute Time | Male | Female |
| Less than 5 Minutes | 1,445 (2.9%) | 1,888 (4.1%) |
| 5 to 9 Minutes | 6,878 (13.6%) | 6,734 (14.5%) |
| 10 to 14 Minutes | 9,071 (18.0%) | 7,510 (16.2%) |
| 15 to 19 Minutes | 8,011 (15.9%) | 8,186 (17.7%) |
| 20 to 24 Minutes | 6,934 (13.7%) | 6,731 (14.5%) |
| 25 to 29 Minutes | 2,429 (4.8%) | 2,885 (6.2%) |
| 30 to 34 Minutes | 5,328 (10.5%) | 4,656 (10.1%) |
| 35 to 39 Minutes | 1,215 (2.4%) | 1,051 (2.3%) |
| 40 to 44 Minutes | 1,522 (3.0%) | 1,072 (2.3%) |
| 45 to 59 Minutes | 2,379 (4.7%) | 1,930 (4.2%) |
| 60 to 89 Minutes | 2,545 (5.0%) | 1,918 (4.1%) |
| 90 or more Minutes | 2,745 (5.4%) | 1,743 (3.8%) |
Time of Departure to Work by Sex in Barnstable County
The most frequent times of departure to work in Barnstable County are 7:00 AM to 7:29 AM (8,114, 16.1%) for males and 7:30 AM to 7:59 AM (7,306, 15.8%) for females.
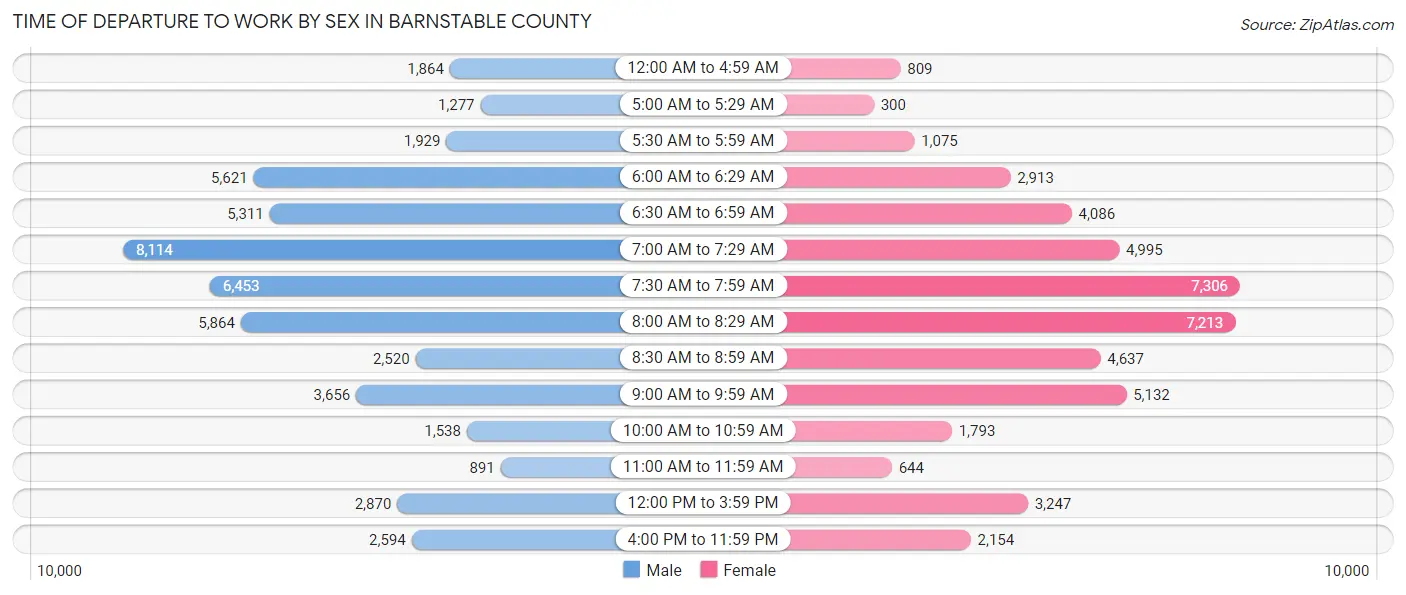
| Time of Departure | Male | Female |
| 12:00 AM to 4:59 AM | 1,864 (3.7%) | 809 (1.8%) |
| 5:00 AM to 5:29 AM | 1,277 (2.5%) | 300 (0.6%) |
| 5:30 AM to 5:59 AM | 1,929 (3.8%) | 1,075 (2.3%) |
| 6:00 AM to 6:29 AM | 5,621 (11.1%) | 2,913 (6.3%) |
| 6:30 AM to 6:59 AM | 5,311 (10.5%) | 4,086 (8.8%) |
| 7:00 AM to 7:29 AM | 8,114 (16.1%) | 4,995 (10.8%) |
| 7:30 AM to 7:59 AM | 6,453 (12.8%) | 7,306 (15.8%) |
| 8:00 AM to 8:29 AM | 5,864 (11.6%) | 7,213 (15.6%) |
| 8:30 AM to 8:59 AM | 2,520 (5.0%) | 4,637 (10.0%) |
| 9:00 AM to 9:59 AM | 3,656 (7.2%) | 5,132 (11.1%) |
| 10:00 AM to 10:59 AM | 1,538 (3.0%) | 1,793 (3.9%) |
| 11:00 AM to 11:59 AM | 891 (1.8%) | 644 (1.4%) |
| 12:00 PM to 3:59 PM | 2,870 (5.7%) | 3,247 (7.0%) |
| 4:00 PM to 11:59 PM | 2,594 (5.1%) | 2,154 (4.6%) |
| Total | 50,502 (100.0%) | 46,304 (100.0%) |
Housing Occupancy in Barnstable County
Occupancy by Ownership in Barnstable County
Of the total 99,969 dwellings in Barnstable County, owner-occupied units account for 81,334 (81.4%), while renter-occupied units make up 18,635 (18.6%).
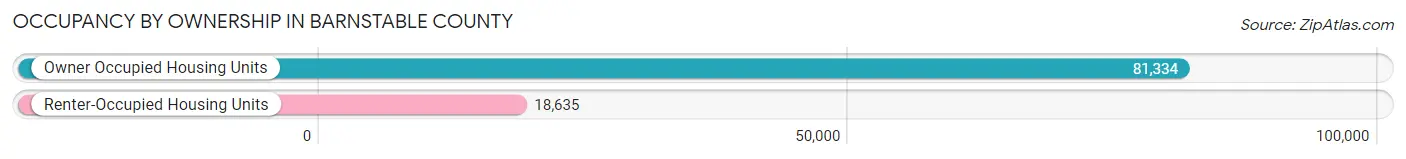
| Occupancy | # Housing Units | % Housing Units |
| Owner Occupied Housing Units | 81,334 | 81.4% |
| Renter-Occupied Housing Units | 18,635 | 18.6% |
| Total Occupied Housing Units | 99,969 | 100.0% |
Occupancy by Household Size in Barnstable County
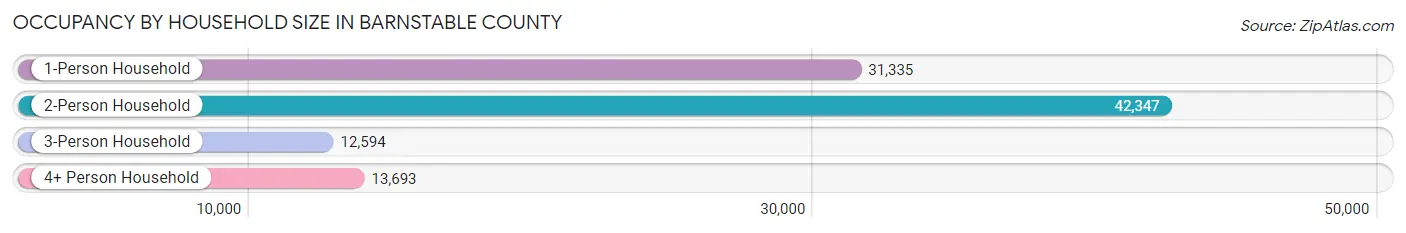
| Household Size | # Housing Units | % Housing Units |
| 1-Person Household | 31,335 | 31.3% |
| 2-Person Household | 42,347 | 42.4% |
| 3-Person Household | 12,594 | 12.6% |
| 4+ Person Household | 13,693 | 13.7% |
| Total Housing Units | 99,969 | 100.0% |
Occupancy by Ownership by Household Size in Barnstable County
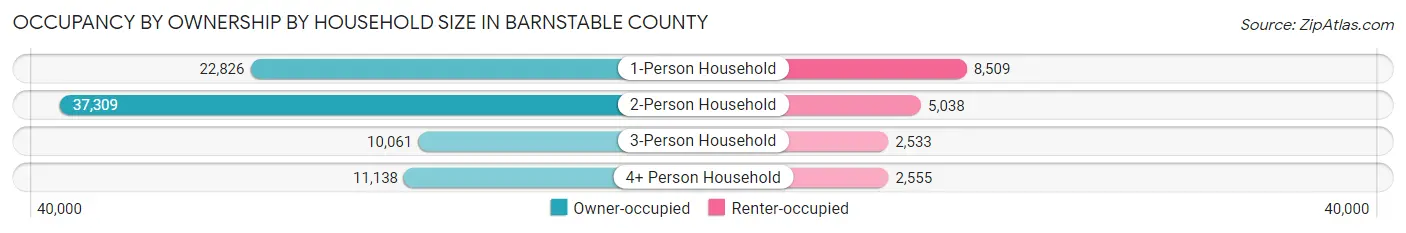
| Household Size | Owner-occupied | Renter-occupied |
| 1-Person Household | 22,826 (72.9%) | 8,509 (27.2%) |
| 2-Person Household | 37,309 (88.1%) | 5,038 (11.9%) |
| 3-Person Household | 10,061 (79.9%) | 2,533 (20.1%) |
| 4+ Person Household | 11,138 (81.3%) | 2,555 (18.7%) |
| Total Housing Units | 81,334 (81.4%) | 18,635 (18.6%) |
Occupancy by Educational Attainment in Barnstable County
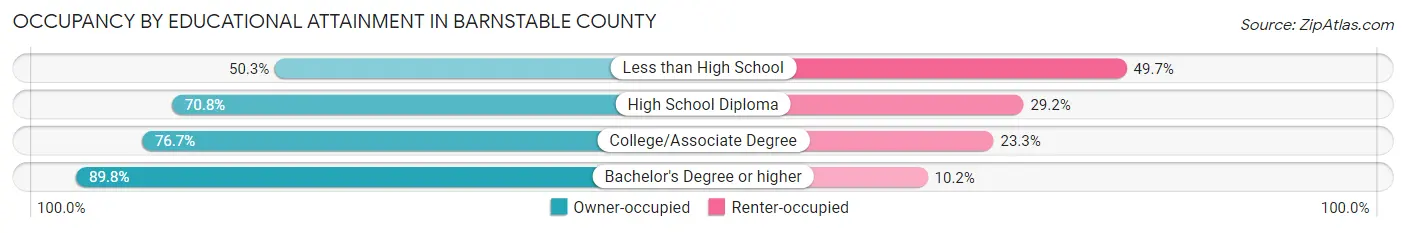
| Household Size | Owner-occupied | Renter-occupied |
| Less than High School | 1,461 (50.3%) | 1,441 (49.7%) |
| High School Diploma | 13,016 (70.8%) | 5,371 (29.2%) |
| College/Associate Degree | 22,293 (76.7%) | 6,762 (23.3%) |
| Bachelor's Degree or higher | 44,564 (89.8%) | 5,061 (10.2%) |
Occupancy by Age of Householder in Barnstable County
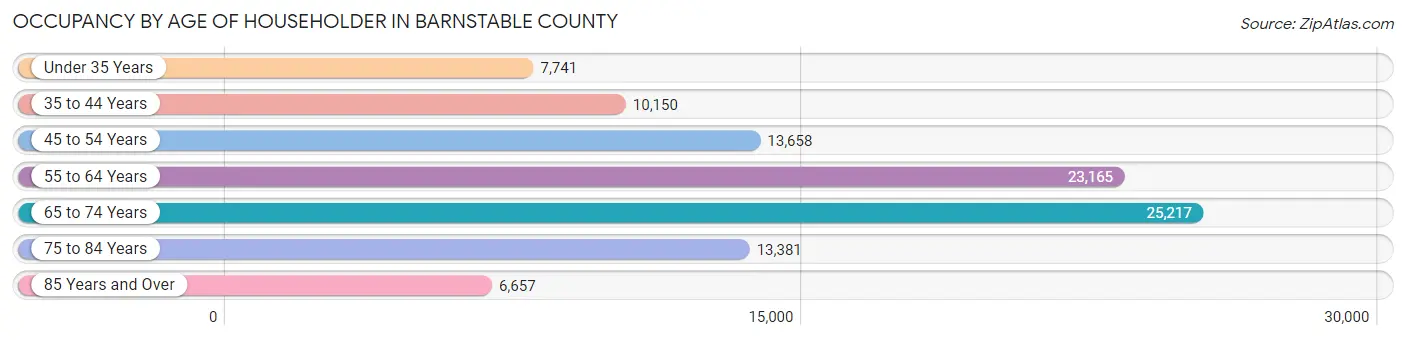
| Age Bracket | # Households | % Households |
| Under 35 Years | 7,741 | 7.7% |
| 35 to 44 Years | 10,150 | 10.2% |
| 45 to 54 Years | 13,658 | 13.7% |
| 55 to 64 Years | 23,165 | 23.2% |
| 65 to 74 Years | 25,217 | 25.2% |
| 75 to 84 Years | 13,381 | 13.4% |
| 85 Years and Over | 6,657 | 6.7% |
| Total | 99,969 | 100.0% |
Housing Finances in Barnstable County
Median Income by Occupancy in Barnstable County
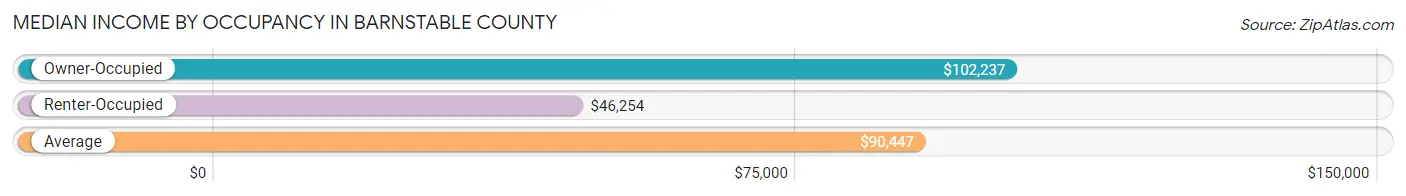
| Occupancy Type | # Households | Median Income |
| Owner-Occupied | 81,334 (81.4%) | $102,237 |
| Renter-Occupied | 18,635 (18.6%) | $46,254 |
| Average | 99,969 (100.0%) | $90,447 |
Occupancy by Householder Income Bracket in Barnstable County
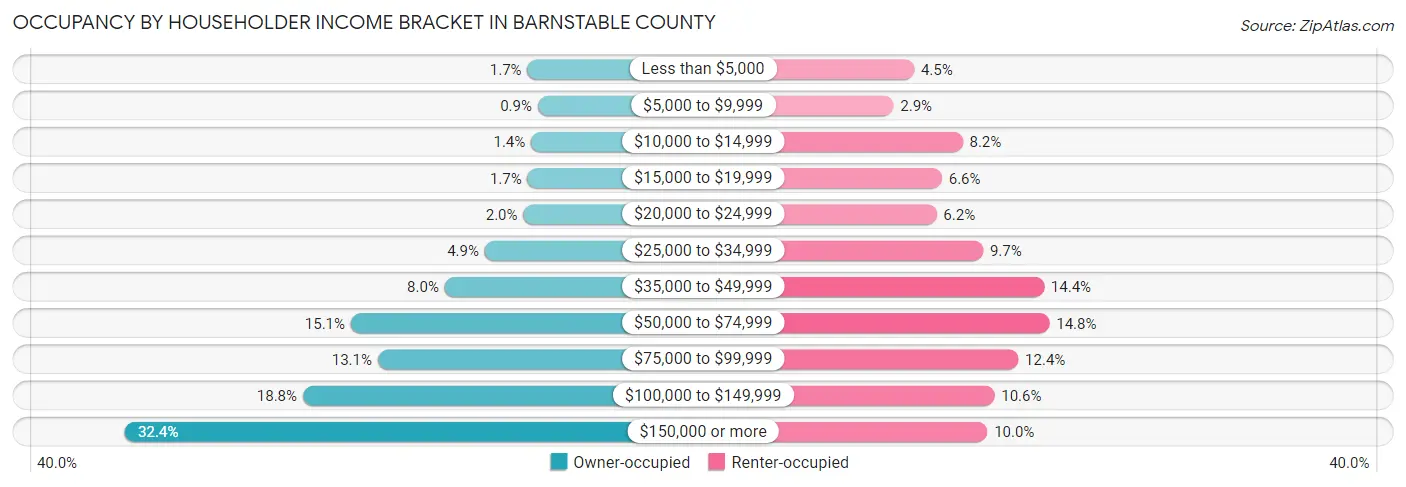
| Income Bracket | Owner-occupied | Renter-occupied |
| Less than $5,000 | 1,377 (1.7%) | 829 (4.4%) |
| $5,000 to $9,999 | 730 (0.9%) | 537 (2.9%) |
| $10,000 to $14,999 | 1,149 (1.4%) | 1,518 (8.2%) |
| $15,000 to $19,999 | 1,365 (1.7%) | 1,224 (6.6%) |
| $20,000 to $24,999 | 1,624 (2.0%) | 1,147 (6.2%) |
| $25,000 to $34,999 | 4,020 (4.9%) | 1,809 (9.7%) |
| $35,000 to $49,999 | 6,502 (8.0%) | 2,674 (14.3%) |
| $50,000 to $74,999 | 12,316 (15.1%) | 2,750 (14.8%) |
| $75,000 to $99,999 | 10,649 (13.1%) | 2,309 (12.4%) |
| $100,000 to $149,999 | 15,290 (18.8%) | 1,969 (10.6%) |
| $150,000 or more | 26,312 (32.4%) | 1,869 (10.0%) |
| Total | 81,334 (100.0%) | 18,635 (100.0%) |
Monthly Housing Cost Tiers in Barnstable County
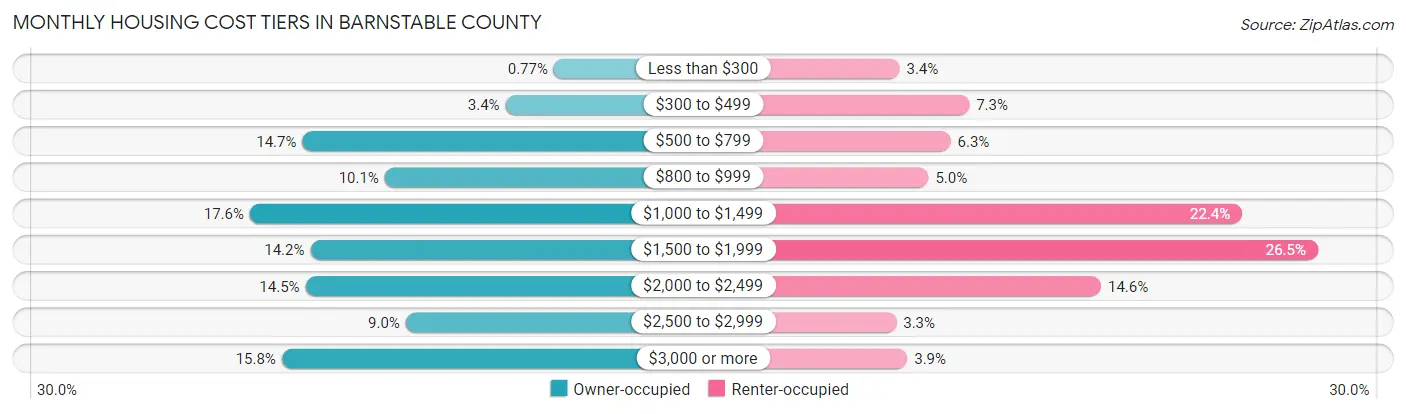
| Monthly Cost | Owner-occupied | Renter-occupied |
| Less than $300 | 629 (0.8%) | 639 (3.4%) |
| $300 to $499 | 2,794 (3.4%) | 1,357 (7.3%) |
| $500 to $799 | 11,923 (14.7%) | 1,164 (6.2%) |
| $800 to $999 | 8,223 (10.1%) | 937 (5.0%) |
| $1,000 to $1,499 | 14,280 (17.6%) | 4,165 (22.4%) |
| $1,500 to $1,999 | 11,565 (14.2%) | 4,944 (26.5%) |
| $2,000 to $2,499 | 11,786 (14.5%) | 2,713 (14.6%) |
| $2,500 to $2,999 | 7,280 (8.9%) | 605 (3.3%) |
| $3,000 or more | 12,854 (15.8%) | 719 (3.9%) |
| Total | 81,334 (100.0%) | 18,635 (100.0%) |
Physical Housing Characteristics in Barnstable County
Housing Structures in Barnstable County
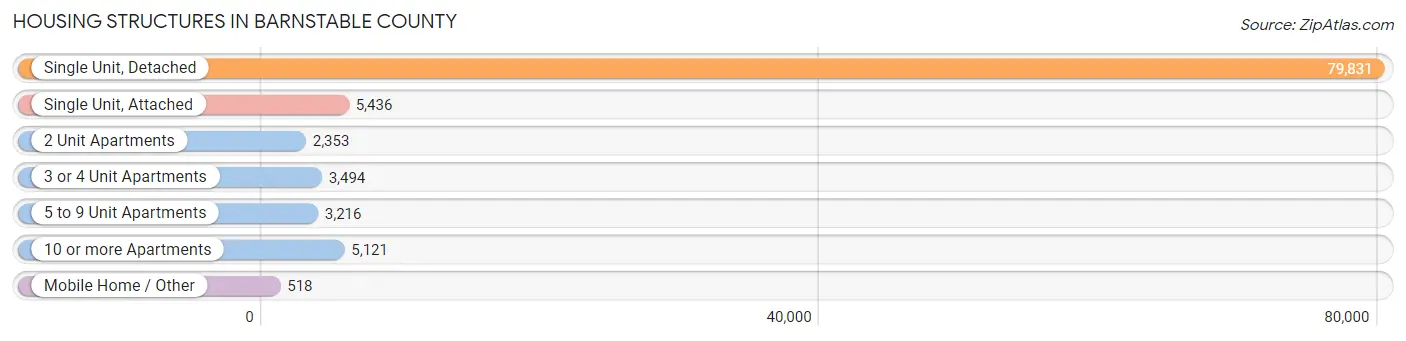
| Structure Type | # Housing Units | % Housing Units |
| Single Unit, Detached | 79,831 | 79.9% |
| Single Unit, Attached | 5,436 | 5.4% |
| 2 Unit Apartments | 2,353 | 2.4% |
| 3 or 4 Unit Apartments | 3,494 | 3.5% |
| 5 to 9 Unit Apartments | 3,216 | 3.2% |
| 10 or more Apartments | 5,121 | 5.1% |
| Mobile Home / Other | 518 | 0.5% |
| Total | 99,969 | 100.0% |
Housing Structures by Occupancy in Barnstable County
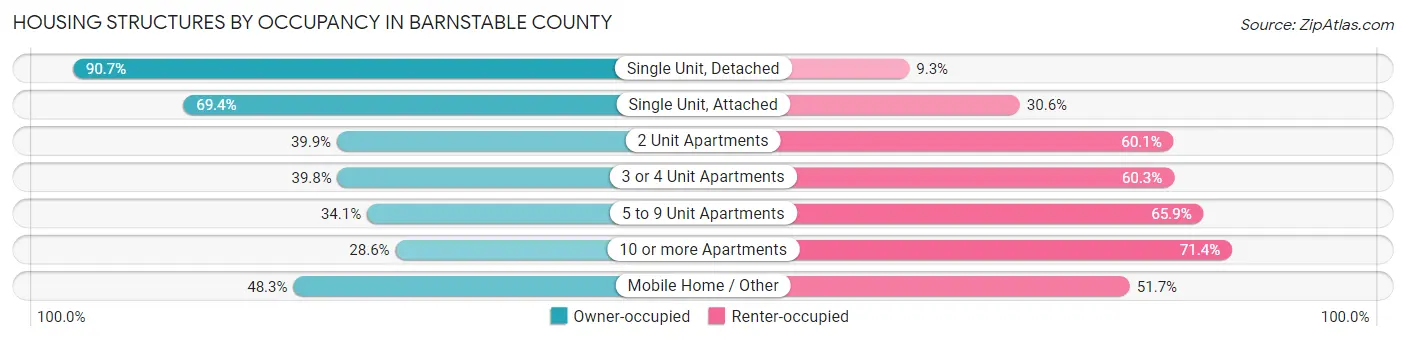
| Structure Type | Owner-occupied | Renter-occupied |
| Single Unit, Detached | 72,421 (90.7%) | 7,410 (9.3%) |
| Single Unit, Attached | 3,775 (69.4%) | 1,661 (30.6%) |
| 2 Unit Apartments | 938 (39.9%) | 1,415 (60.1%) |
| 3 or 4 Unit Apartments | 1,389 (39.8%) | 2,105 (60.3%) |
| 5 to 9 Unit Apartments | 1,096 (34.1%) | 2,120 (65.9%) |
| 10 or more Apartments | 1,465 (28.6%) | 3,656 (71.4%) |
| Mobile Home / Other | 250 (48.3%) | 268 (51.7%) |
| Total | 81,334 (81.4%) | 18,635 (18.6%) |
Housing Structures by Number of Rooms in Barnstable County
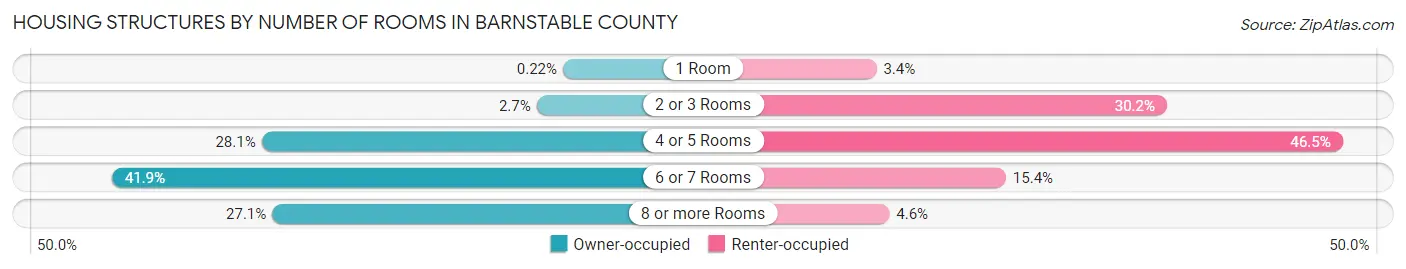
| Number of Rooms | Owner-occupied | Renter-occupied |
| 1 Room | 181 (0.2%) | 629 (3.4%) |
| 2 or 3 Rooms | 2,154 (2.6%) | 5,633 (30.2%) |
| 4 or 5 Rooms | 22,850 (28.1%) | 8,661 (46.5%) |
| 6 or 7 Rooms | 34,102 (41.9%) | 2,860 (15.3%) |
| 8 or more Rooms | 22,047 (27.1%) | 852 (4.6%) |
| Total | 81,334 (100.0%) | 18,635 (100.0%) |
Housing Structure by Heating Type in Barnstable County
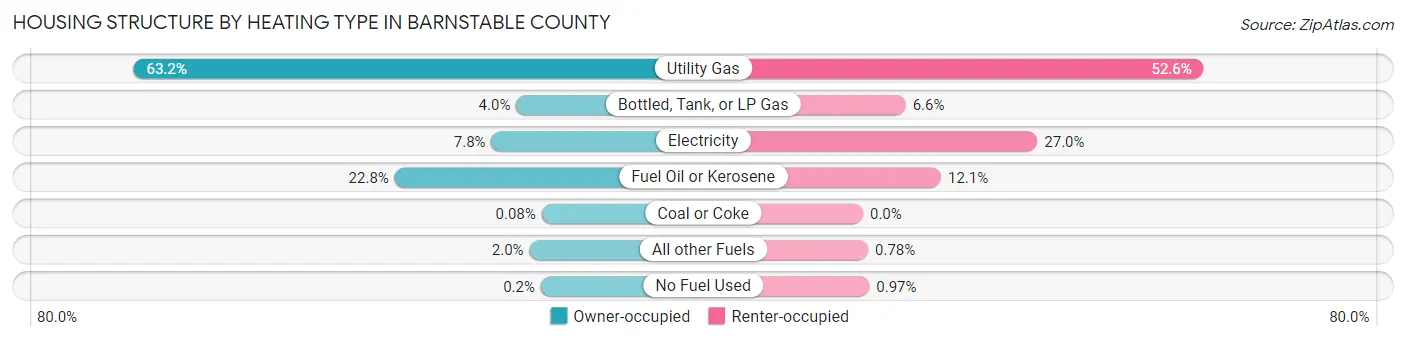
| Heating Type | Owner-occupied | Renter-occupied |
| Utility Gas | 51,359 (63.1%) | 9,808 (52.6%) |
| Bottled, Tank, or LP Gas | 3,251 (4.0%) | 1,230 (6.6%) |
| Electricity | 6,369 (7.8%) | 5,023 (27.0%) |
| Fuel Oil or Kerosene | 18,532 (22.8%) | 2,248 (12.1%) |
| Coal or Coke | 66 (0.1%) | 0 (0.0%) |
| All other Fuels | 1,593 (2.0%) | 145 (0.8%) |
| No Fuel Used | 164 (0.2%) | 181 (1.0%) |
| Total | 81,334 (100.0%) | 18,635 (100.0%) |
Household Vehicle Usage in Barnstable County
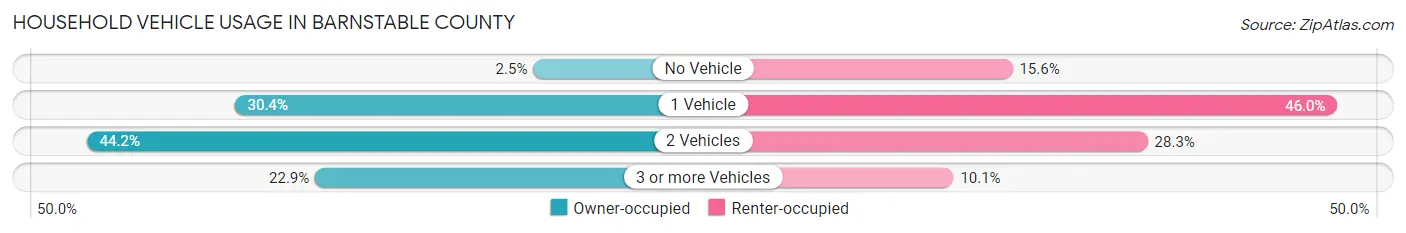
| Vehicles per Household | Owner-occupied | Renter-occupied |
| No Vehicle | 2,053 (2.5%) | 2,915 (15.6%) |
| 1 Vehicle | 24,718 (30.4%) | 8,565 (46.0%) |
| 2 Vehicles | 35,954 (44.2%) | 5,267 (28.3%) |
| 3 or more Vehicles | 18,609 (22.9%) | 1,888 (10.1%) |
| Total | 81,334 (100.0%) | 18,635 (100.0%) |
Real Estate & Mortgages in Barnstable County
Real Estate and Mortgage Overview in Barnstable County
| Characteristic | Without Mortgage | With Mortgage |
| Housing Units | 32,932 | 48,402 |
| Median Property Value | $549,000 | $500,300 |
| Median Household Income | $82,006 | $17,718 |
| Monthly Housing Costs | $852 | $12,485 |
| Real Estate Taxes | $4,108 | $503 |
Property Value by Mortgage Status in Barnstable County
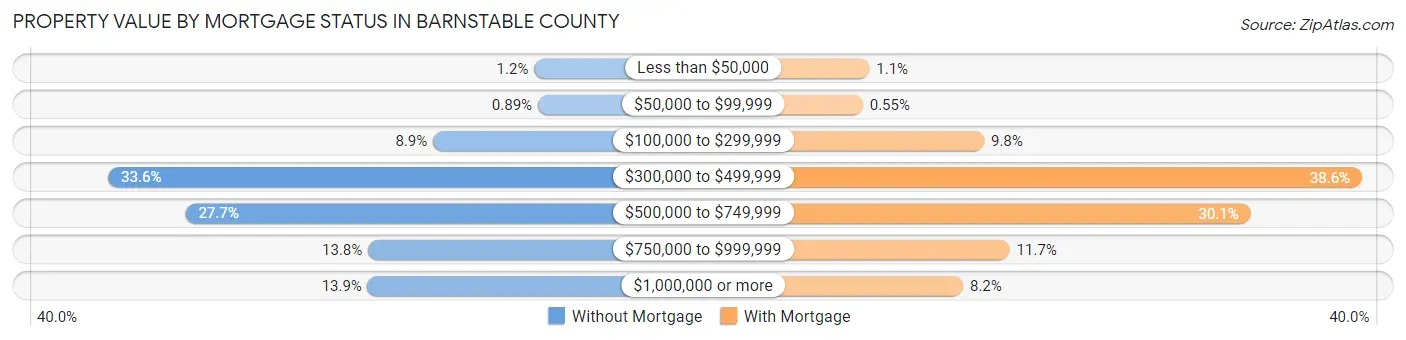
| Property Value | Without Mortgage | With Mortgage |
| Less than $50,000 | 386 (1.2%) | 506 (1.1%) |
| $50,000 to $99,999 | 292 (0.9%) | 266 (0.5%) |
| $100,000 to $299,999 | 2,924 (8.9%) | 4,739 (9.8%) |
| $300,000 to $499,999 | 11,075 (33.6%) | 18,672 (38.6%) |
| $500,000 to $749,999 | 9,134 (27.7%) | 14,571 (30.1%) |
| $750,000 to $999,999 | 4,556 (13.8%) | 5,684 (11.7%) |
| $1,000,000 or more | 4,565 (13.9%) | 3,964 (8.2%) |
| Total | 32,932 (100.0%) | 48,402 (100.0%) |
Household Income by Mortgage Status in Barnstable County

| Household Income | Without Mortgage | With Mortgage |
| Less than $10,000 | 1,199 (3.6%) | 1,903 (3.9%) |
| $10,000 to $24,999 | 2,579 (7.8%) | 908 (1.9%) |
| $25,000 to $34,999 | 2,444 (7.4%) | 1,559 (3.2%) |
| $35,000 to $49,999 | 3,602 (10.9%) | 1,576 (3.3%) |
| $50,000 to $74,999 | 5,367 (16.3%) | 2,900 (6.0%) |
| $75,000 to $99,999 | 4,083 (12.4%) | 6,949 (14.4%) |
| $100,000 to $149,999 | 5,064 (15.4%) | 6,566 (13.6%) |
| $150,000 or more | 8,594 (26.1%) | 10,226 (21.1%) |
| Total | 32,932 (100.0%) | 48,402 (100.0%) |
Property Value to Household Income Ratio in Barnstable County
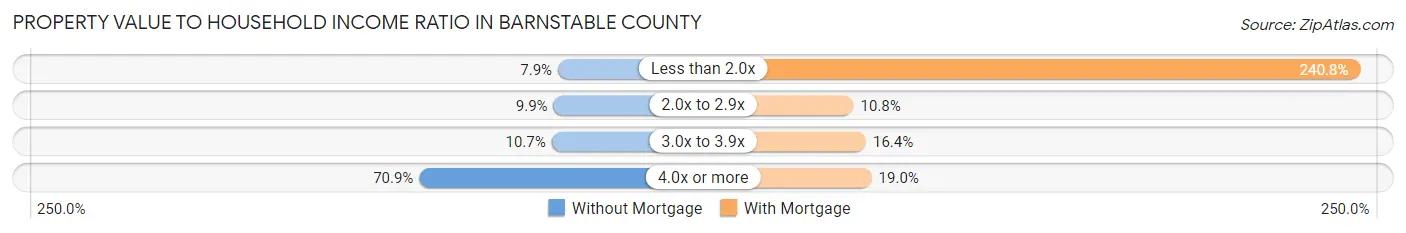
| Value-to-Income Ratio | Without Mortgage | With Mortgage |
| Less than 2.0x | 2,584 (7.9%) | 116,538 (240.8%) |
| 2.0x to 2.9x | 3,263 (9.9%) | 5,206 (10.8%) |
| 3.0x to 3.9x | 3,536 (10.7%) | 7,943 (16.4%) |
| 4.0x or more | 23,332 (70.9%) | 9,170 (19.0%) |
| Total | 32,932 (100.0%) | 48,402 (100.0%) |
Real Estate Taxes by Mortgage Status in Barnstable County
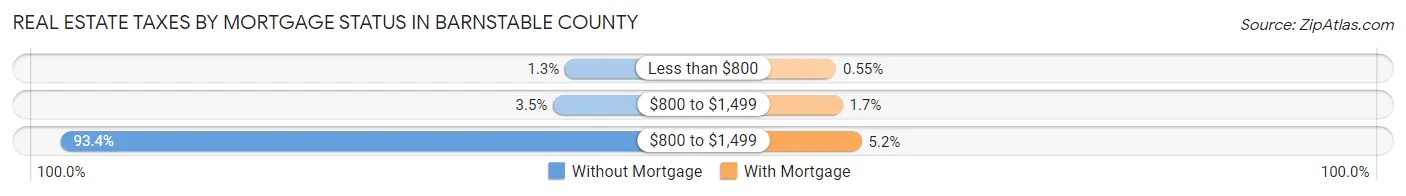
| Property Taxes | Without Mortgage | With Mortgage |
| Less than $800 | 422 (1.3%) | 266 (0.5%) |
| $800 to $1,499 | 1,136 (3.5%) | 836 (1.7%) |
| $800 to $1,499 | 30,763 (93.4%) | 2,523 (5.2%) |
| Total | 32,932 (100.0%) | 48,402 (100.0%) |
Health & Disability in Barnstable County
Health Insurance Coverage by Age in Barnstable County
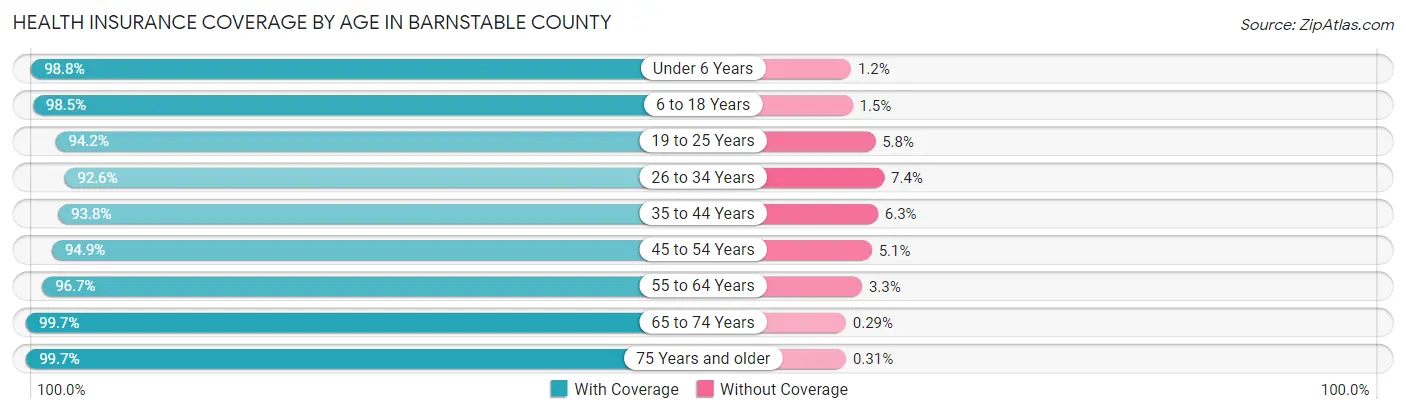
| Age Bracket | With Coverage | Without Coverage |
| Under 6 Years | 9,995 (98.8%) | 126 (1.2%) |
| 6 to 18 Years | 25,216 (98.5%) | 392 (1.5%) |
| 19 to 25 Years | 14,458 (94.2%) | 885 (5.8%) |
| 26 to 34 Years | 16,777 (92.6%) | 1,344 (7.4%) |
| 35 to 44 Years | 19,465 (93.8%) | 1,298 (6.2%) |
| 45 to 54 Years | 24,089 (94.9%) | 1,296 (5.1%) |
| 55 to 64 Years | 39,226 (96.7%) | 1,336 (3.3%) |
| 65 to 74 Years | 41,200 (99.7%) | 119 (0.3%) |
| 75 Years and older | 29,748 (99.7%) | 94 (0.3%) |
| Total | 220,174 (97.0%) | 6,890 (3.0%) |
Health Insurance Coverage by Citizenship Status in Barnstable County
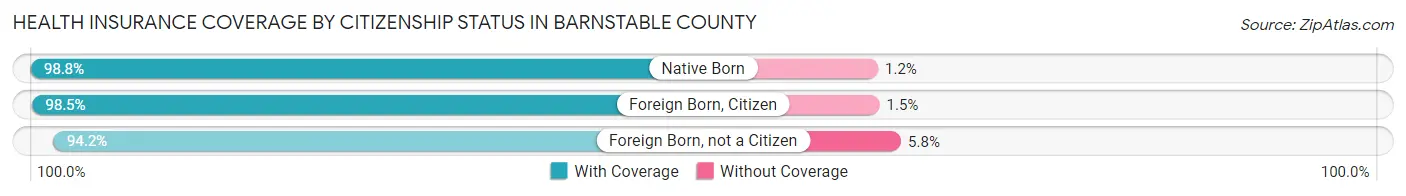
| Citizenship Status | With Coverage | Without Coverage |
| Native Born | 9,995 (98.8%) | 126 (1.2%) |
| Foreign Born, Citizen | 25,216 (98.5%) | 392 (1.5%) |
| Foreign Born, not a Citizen | 14,458 (94.2%) | 885 (5.8%) |
Health Insurance Coverage by Household Income in Barnstable County
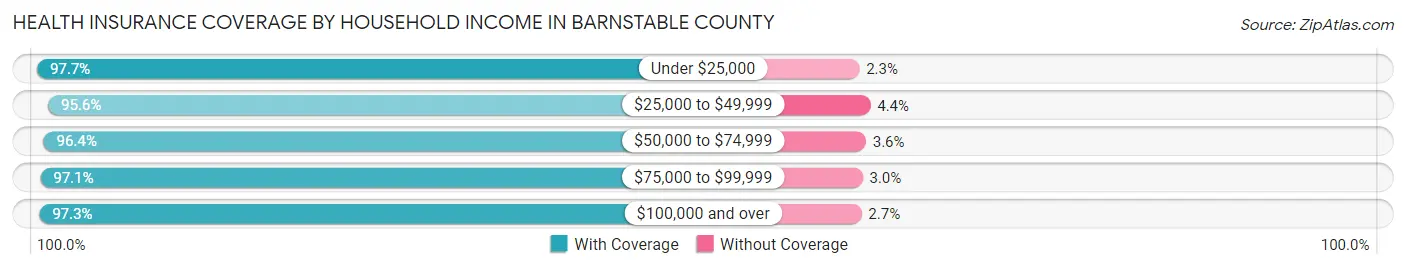
| Household Income | With Coverage | Without Coverage |
| Under $25,000 | 16,038 (97.7%) | 381 (2.3%) |
| $25,000 to $49,999 | 24,200 (95.6%) | 1,114 (4.4%) |
| $50,000 to $74,999 | 28,989 (96.4%) | 1,071 (3.6%) |
| $75,000 to $99,999 | 27,913 (97.1%) | 848 (2.9%) |
| $100,000 and over | 121,968 (97.3%) | 3,441 (2.7%) |
Public vs Private Health Insurance Coverage by Age in Barnstable County
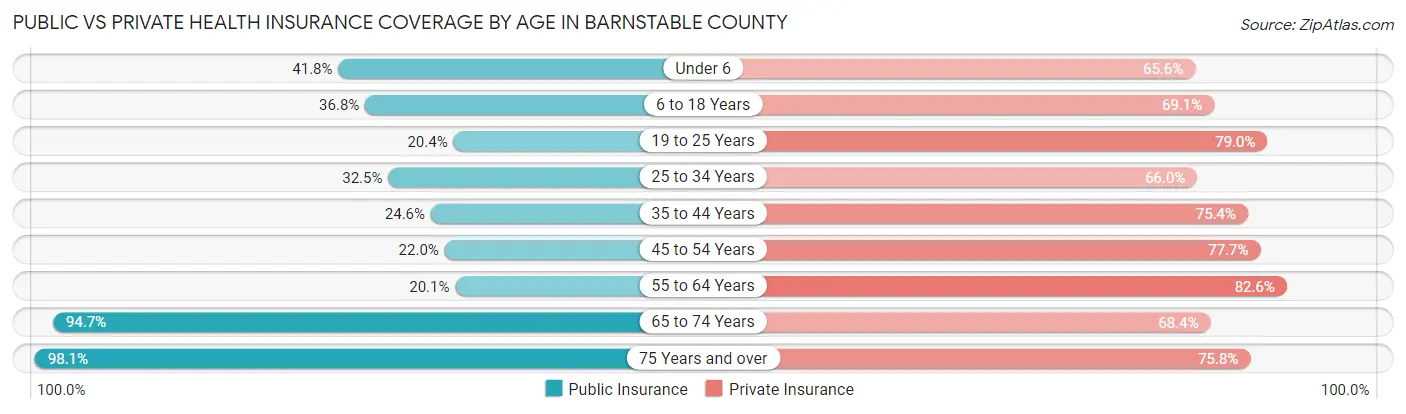
| Age Bracket | Public Insurance | Private Insurance |
| Under 6 | 4,227 (41.8%) | 6,636 (65.6%) |
| 6 to 18 Years | 9,420 (36.8%) | 17,691 (69.1%) |
| 19 to 25 Years | 3,129 (20.4%) | 12,118 (79.0%) |
| 25 to 34 Years | 5,889 (32.5%) | 11,955 (66.0%) |
| 35 to 44 Years | 5,105 (24.6%) | 15,646 (75.4%) |
| 45 to 54 Years | 5,592 (22.0%) | 19,718 (77.7%) |
| 55 to 64 Years | 8,137 (20.1%) | 33,491 (82.6%) |
| 65 to 74 Years | 39,147 (94.7%) | 28,276 (68.4%) |
| 75 Years and over | 29,271 (98.1%) | 22,619 (75.8%) |
| Total | 109,917 (48.4%) | 168,150 (74.1%) |
Disability Status by Sex by Age in Barnstable County
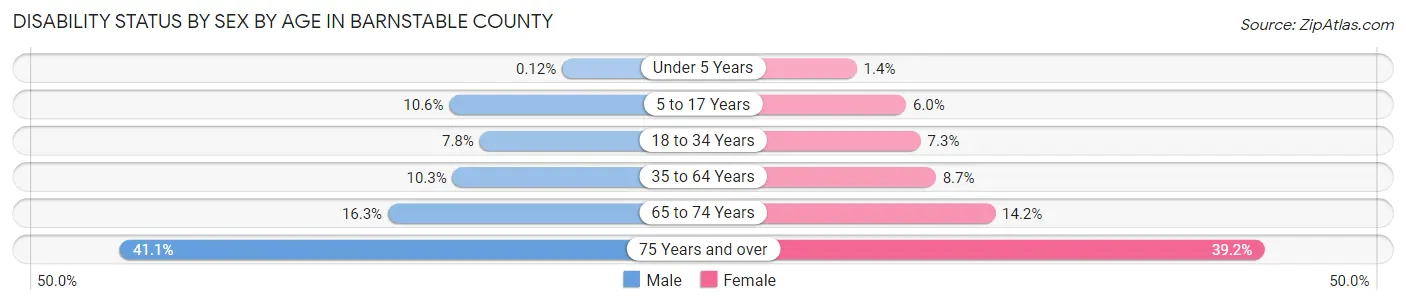
| Age Bracket | Male | Female |
| Under 5 Years | 5 (0.1%) | 53 (1.4%) |
| 5 to 17 Years | 1,382 (10.6%) | 730 (6.0%) |
| 18 to 34 Years | 1,481 (7.8%) | 1,231 (7.3%) |
| 35 to 64 Years | 4,254 (10.3%) | 3,952 (8.7%) |
| 65 to 74 Years | 3,128 (16.3%) | 3,145 (14.2%) |
| 75 Years and over | 5,234 (41.1%) | 6,709 (39.2%) |
Disability Class by Sex by Age in Barnstable County
Disability Class: Hearing Difficulty
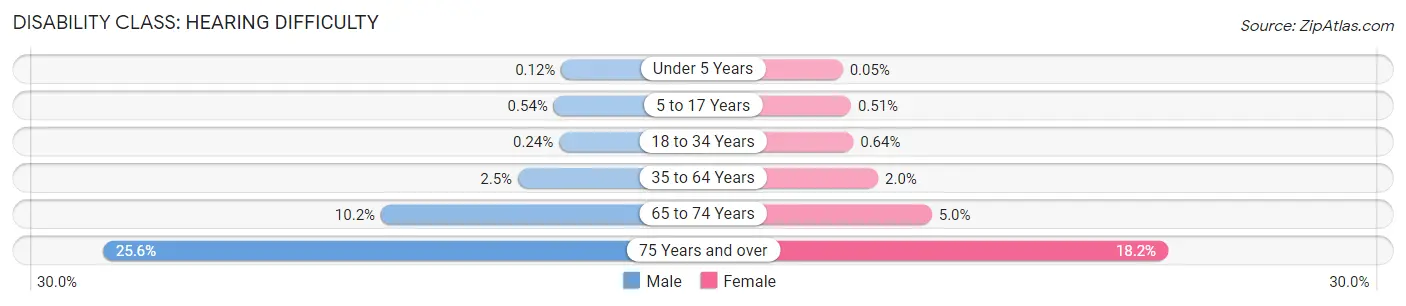
| Age Bracket | Male | Female |
| Under 5 Years | 5 (0.1%) | 2 (0.1%) |
| 5 to 17 Years | 70 (0.5%) | 62 (0.5%) |
| 18 to 34 Years | 46 (0.2%) | 107 (0.6%) |
| 35 to 64 Years | 1,048 (2.5%) | 914 (2.0%) |
| 65 to 74 Years | 1,953 (10.2%) | 1,107 (5.0%) |
| 75 Years and over | 3,262 (25.6%) | 3,109 (18.2%) |
Disability Class: Vision Difficulty
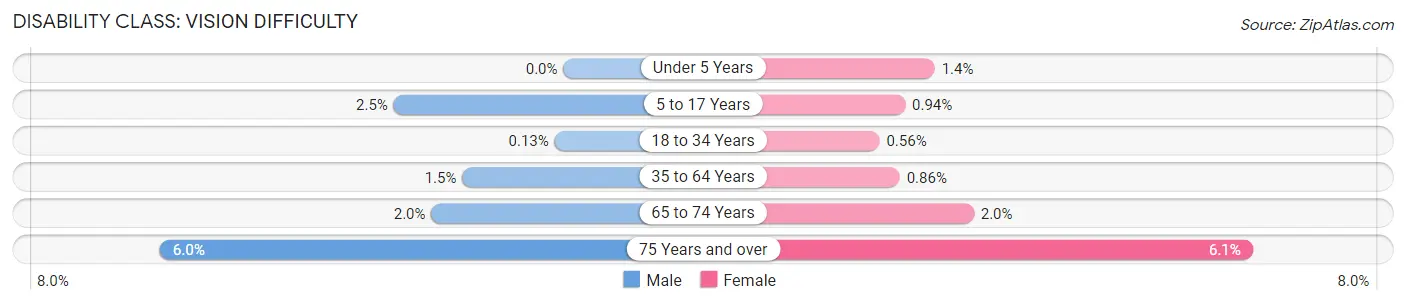
| Age Bracket | Male | Female |
| Under 5 Years | 0 (0.0%) | 53 (1.4%) |
| 5 to 17 Years | 329 (2.5%) | 115 (0.9%) |
| 18 to 34 Years | 25 (0.1%) | 94 (0.6%) |
| 35 to 64 Years | 619 (1.5%) | 392 (0.9%) |
| 65 to 74 Years | 377 (2.0%) | 434 (2.0%) |
| 75 Years and over | 762 (6.0%) | 1,045 (6.1%) |
Disability Class: Cognitive Difficulty
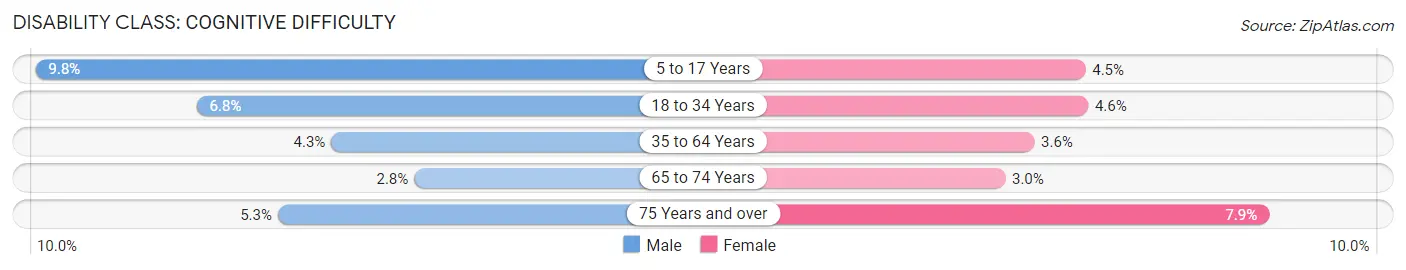
| Age Bracket | Male | Female |
| 5 to 17 Years | 1,280 (9.8%) | 554 (4.5%) |
| 18 to 34 Years | 1,298 (6.8%) | 769 (4.6%) |
| 35 to 64 Years | 1,782 (4.3%) | 1,619 (3.6%) |
| 65 to 74 Years | 533 (2.8%) | 670 (3.0%) |
| 75 Years and over | 674 (5.3%) | 1,358 (7.9%) |
Disability Class: Ambulatory Difficulty
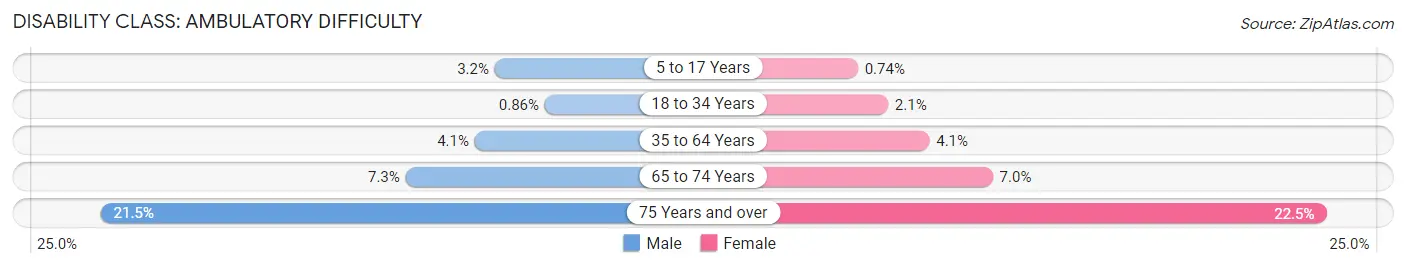
| Age Bracket | Male | Female |
| 5 to 17 Years | 416 (3.2%) | 91 (0.7%) |
| 18 to 34 Years | 163 (0.9%) | 360 (2.1%) |
| 35 to 64 Years | 1,701 (4.1%) | 1,841 (4.1%) |
| 65 to 74 Years | 1,407 (7.3%) | 1,548 (7.0%) |
| 75 Years and over | 2,732 (21.5%) | 3,848 (22.5%) |
Disability Class: Self-Care Difficulty
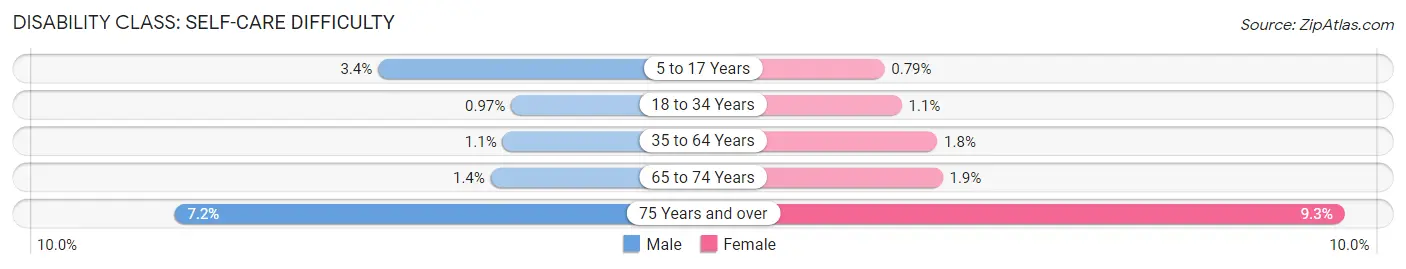
| Age Bracket | Male | Female |
| 5 to 17 Years | 450 (3.4%) | 97 (0.8%) |
| 18 to 34 Years | 184 (1.0%) | 186 (1.1%) |
| 35 to 64 Years | 466 (1.1%) | 802 (1.8%) |
| 65 to 74 Years | 259 (1.3%) | 413 (1.9%) |
| 75 Years and over | 918 (7.2%) | 1,598 (9.3%) |
Technology Access in Barnstable County
Computing Device Access in Barnstable County
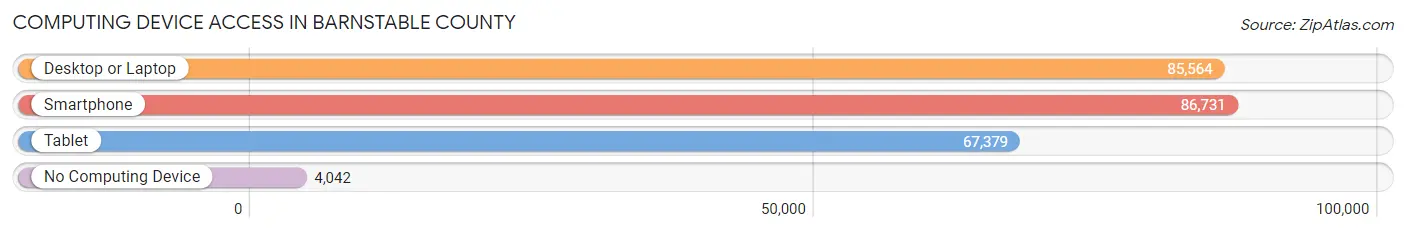
| Device Type | # Households | % Households |
| Desktop or Laptop | 85,564 | 85.6% |
| Smartphone | 86,731 | 86.8% |
| Tablet | 67,379 | 67.4% |
| No Computing Device | 4,042 | 4.0% |
| Total | 99,969 | 100.0% |
Internet Access in Barnstable County
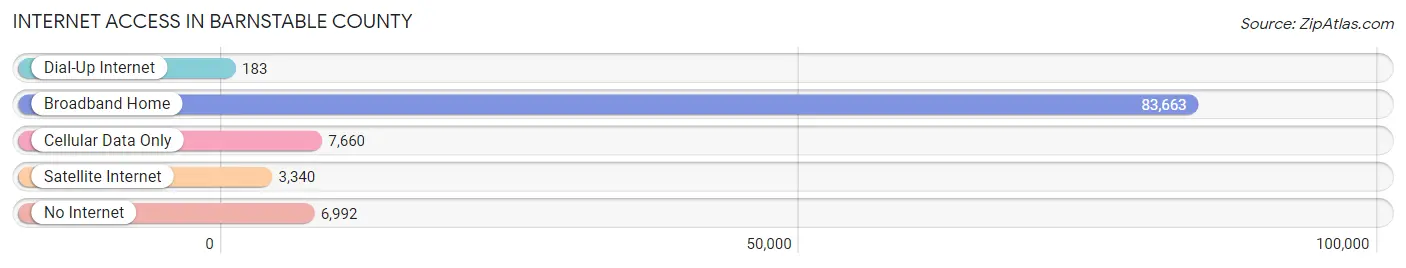
| Internet Type | # Households | % Households |
| Dial-Up Internet | 183 | 0.2% |
| Broadband Home | 83,663 | 83.7% |
| Cellular Data Only | 7,660 | 7.7% |
| Satellite Internet | 3,340 | 3.3% |
| No Internet | 6,992 | 7.0% |
| Total | 99,969 | 100.0% |
Barnstable County Summary
Introduction
Barnstable County is located in the southeastern corner of Massachusetts and is the largest county in the state. It is bordered by Plymouth County to the north, Bristol County to the west, and Nantucket County to the south. The county is comprised of 15 towns and two cities, and is home to a population of 215,888 people. Barnstable County is known for its beautiful beaches, quaint towns, and rich history.
History
Barnstable County was established in 1685 and was named after Barnstable, England. The county was originally part of Plymouth Colony and was part of the original Plymouth Colony land grant. The county was divided into three townships in 1690: Barnstable, Yarmouth, and Sandwich. The towns of Falmouth, Dennis, and Harwich were added in 1739. The towns of Brewster, Chatham, and Orleans were added in 1797. The towns of Eastham, Wellfleet, Truro, and Provincetown were added in 1803. The towns of Bourne and Mashpee were added in 1884. The cities of Barnstable and Yarmouth were incorporated in 1836 and 1854, respectively.
Geography
Barnstable County is located in the southeastern corner of Massachusetts and is bordered by Plymouth County to the north, Bristol County to the west, and Nantucket County to the south. The county is comprised of 15 towns and two cities. The towns are Barnstable, Yarmouth, Sandwich, Falmouth, Dennis, Harwich, Brewster, Chatham, Orleans, Eastham, Wellfleet, Truro, Provincetown, Bourne, and Mashpee. The two cities are Barnstable and Yarmouth. The county is located on Cape Cod and is known for its beautiful beaches, quaint towns, and rich history.
Economy
Barnstable County has a diverse economy that is driven by tourism, fishing, and agriculture. Tourism is the largest industry in the county, with over 4 million visitors each year. The county is home to several popular tourist attractions, including the Cape Cod National Seashore, the John F. Kennedy Hyannis Museum, and the Cape Cod Museum of Natural History. Fishing is also an important industry in the county, with the majority of the catch being lobster, scallops, and flounder. Agriculture is also an important part of the county’s economy, with cranberries, blueberries, and vegetables being the main crops.
Demographics
As of the 2010 census, the population of Barnstable County was 215,888. The population is comprised of 97.3% White, 0.9% African American, 0.5% Native American, 0.9% Asian, 0.1% Pacific Islander, 0.7% from other races, and 1.6% from two or more races. The median household income in the county is $60,890 and the median family income is $76,845. The per capita income in the county is $35,945. The unemployment rate in the county is 4.2%.
Conclusion
Barnstable County is located in the southeastern corner of Massachusetts and is the largest county in the state. It is bordered by Plymouth County to the north, Bristol County to the west, and Nantucket County to the south. The county is comprised of 15 towns and two cities, and is home to a population of 215,888 people. Barnstable County is known for its beautiful beaches, quaint towns, and rich history. The county has a diverse economy that is driven by tourism, fishing, and agriculture. The population of the county is 97.3% White, 0.9% African American, 0.5% Native American, 0.9% Asian, 0.1% Pacific Islander, 0.7% from other races, and 1.6% from two or more races. The median household income in the county is $60,890 and the median family income is $76,845. The per capita income in the county is $35,945. The unemployment rate in the county is 4.2%.
Common Questions
What is the Total Population of Barnstable County?
Total Population of Barnstable County is 229,436.
What is the Total Male Population of Barnstable County?
Total Male Population of Barnstable County is 110,706.
What is the Total Female Population of Barnstable County?
Total Female Population of Barnstable County is 118,730.
What is the Ratio of Males per 100 Females in Barnstable County?
There are 93.24 Males per 100 Females in Barnstable County.
What is the Ratio of Females per 100 Males in Barnstable County?
There are 107.25 Females per 100 Males in Barnstable County.
What is the Median Population Age in Barnstable County?
Median Population Age in Barnstable County is 54.5 Years.
What is the Average Family Size in Barnstable County
Average Family Size in Barnstable County is 2.8 People.
What is the Average Household Size in Barnstable County
Average Household Size in Barnstable County is 2.3 People.
What is Per Capita Income in Barnstable County?
Per Capita income in Barnstable County is $55,940.
What is the Median Family Income in Barnstable County?
Median Family Income in Barnstable County is $118,599.
What is the Median Household income in Barnstable County?
Median Household Income in Barnstable County is $90,447.
What is Income or Wage Gap in Barnstable County?
Income or Wage Gap in Barnstable County is 22.4%.
Women in Barnstable County earn 77.6 cents for every dollar earned by a man.
What is Family Income Deficit in Barnstable County?
Family Income Deficit in Barnstable County is $9,691.
Families that are below poverty line in Barnstable County earn $9,691 less on average than the poverty threshold level.
What is Inequality or Gini Index in Barnstable County?
Inequality or Gini Index in Barnstable County is 0.47.
How Large is the Labor Force in Barnstable County?
There are 119,811 People in the Labor Forcein in Barnstable County.
What is the Percentage of People in the Labor Force in Barnstable County?
59.7% of People are in the Labor Force in Barnstable County.
What is the Unemployment Rate in Barnstable County?
Unemployment Rate in Barnstable County is 4.5%.