Cities with the Highest Percentage of Immigrants from Caribbean in Indiana
RELATED REPORTS & OPTIONS
Caribbean
Indiana
Compare Cities
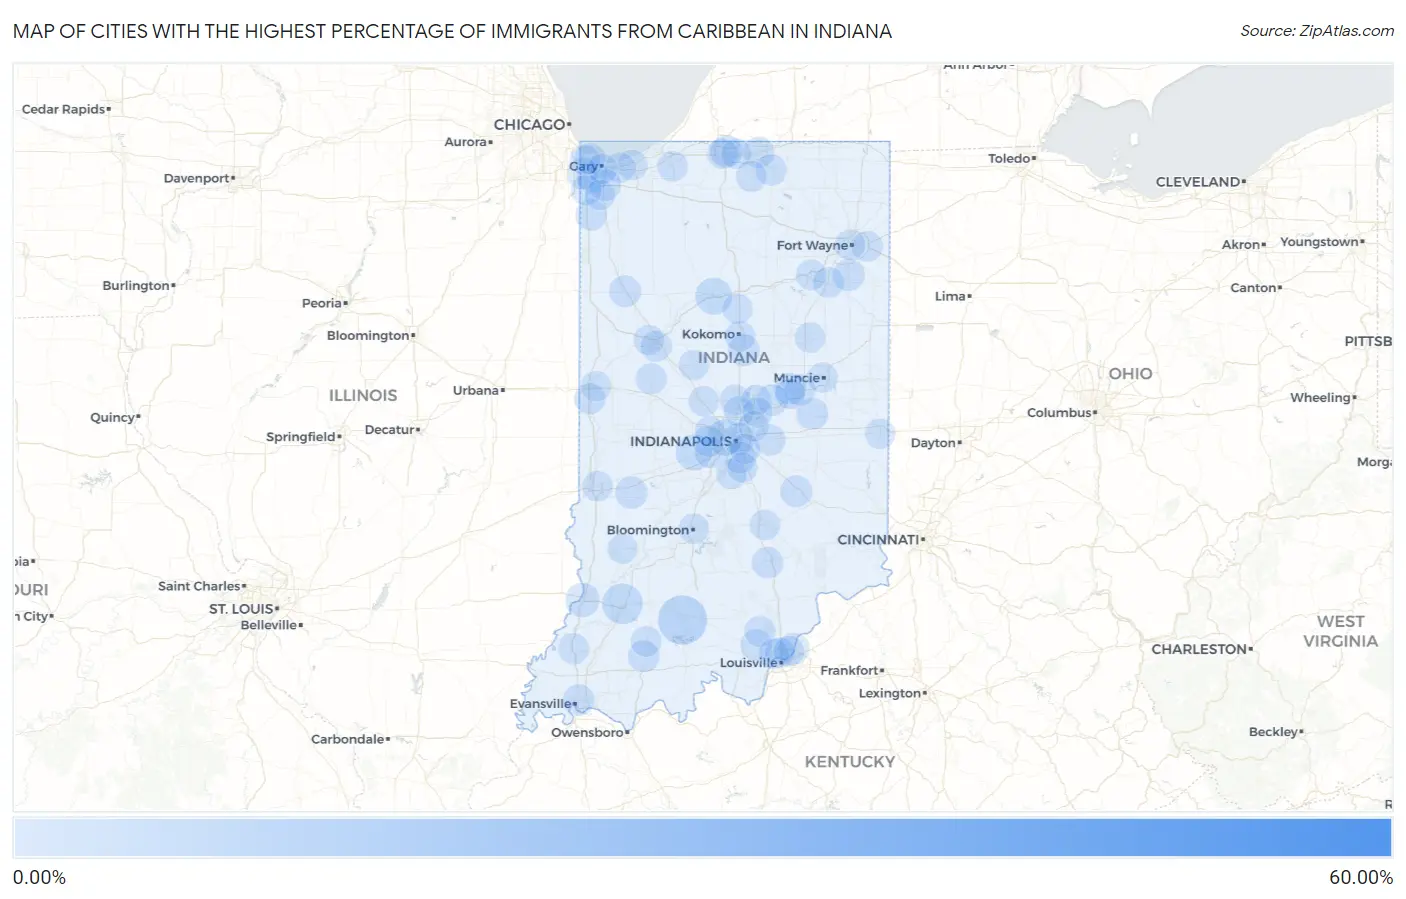
Map of Cities with the Highest Percentage of Immigrants from Caribbean in Indiana
0.00%
60.00%
Cities with the Highest Percentage of Immigrants from Caribbean in Indiana
| City | Caribbean | vs State | vs National | |
| 1. | Ireland | 57.14% | 0.18%(+57.0)#-1 | 1.37%(+55.8)#0 |
| 2. | French Lick | 6.96% | 0.18%(+6.79)#0 | 1.37%(+5.59)#1 |
| 3. | Washington | 3.76% | 0.18%(+3.58)#1 | 1.37%(+2.39)#2 |
| 4. | Logansport | 2.42% | 0.18%(+2.25)#2 | 1.37%(+1.05)#3 |
| 5. | Clayton | 2.14% | 0.18%(+1.97)#3 | 1.37%(+0.770)#4 |
| 6. | Speedway | 2.13% | 0.18%(+1.95)#4 | 1.37%(+0.753)#5 |
| 7. | Vincennes | 1.47% | 0.18%(+1.29)#5 | 1.37%(+0.093)#6 |
| 8. | Center Point | 0.80% | 0.18%(+0.619)#6 | 1.37%(-0.577)#7 |
| 9. | Notre Dame | 0.79% | 0.18%(+0.611)#7 | 1.37%(-0.585)#8 |
| 10. | Floyds Knobs | 0.70% | 0.18%(+0.523)#8 | 1.37%(-0.673)#9 |
| 11. | Ossian | 0.66% | 0.18%(+0.482)#9 | 1.37%(-0.714)#10 |
| 12. | St Paul | 0.64% | 0.18%(+0.466)#10 | 1.37%(-0.730)#11 |
| 13. | Griffith | 0.60% | 0.18%(+0.423)#11 | 1.37%(-0.773)#12 |
| 14. | Indianapolis | 0.59% | 0.18%(+0.410)#19 | 1.37%(-0.786)#2,075 |
| 15. | Huntingburg | 0.59% | 0.18%(+0.410)#20 | 1.37%(-0.786)#2,076 |
| 16. | Sharpsville | 0.57% | 0.18%(+0.393)#21 | 1.37%(-0.803)#2,077 |
| 17. | Country Club Heights | 0.57% | 0.18%(+0.392)#22 | 1.37%(-0.804)#2,078 |
| 18. | Cadiz | 0.55% | 0.18%(+0.376)#23 | 1.37%(-0.820)#2,079 |
| 19. | Merrillville | 0.55% | 0.18%(+0.376)#24 | 1.37%(-0.820)#2,080 |
| 20. | Remington | 0.54% | 0.18%(+0.362)#25 | 1.37%(-0.834)#2,081 |
| 21. | Evansville | 0.50% | 0.18%(+0.327)#26 | 1.37%(-0.869)#2,257 |
| 22. | Seymour | 0.48% | 0.18%(+0.305)#27 | 1.37%(-0.891)#2,258 |
| 23. | Southport | 0.48% | 0.18%(+0.302)#28 | 1.37%(-0.894)#2,259 |
| 24. | Greenville | 0.47% | 0.18%(+0.295)#29 | 1.37%(-0.901)#2,260 |
| 25. | Putnamville | 0.46% | 0.18%(+0.282)#30 | 1.37%(-0.914)#2,261 |
| 26. | Lowell | 0.45% | 0.18%(+0.271)#31 | 1.37%(-0.925)#2,262 |
| 27. | Spring Lake | 0.45% | 0.18%(+0.270)#32 | 1.37%(-0.926)#2,263 |
| 28. | Avon | 0.43% | 0.18%(+0.255)#33 | 1.37%(-0.941)#2,264 |
| 29. | Utica | 0.43% | 0.18%(+0.253)#34 | 1.37%(-0.943)#2,265 |
| 30. | Chesterfield | 0.43% | 0.18%(+0.249)#35 | 1.37%(-0.947)#2,266 |
| 31. | Munster | 0.41% | 0.18%(+0.232)#36 | 1.37%(-0.964)#2,267 |
| 32. | Lafayette | 0.40% | 0.18%(+0.226)#37 | 1.37%(-0.970)#2,268 |
| 33. | Lapel | 0.40% | 0.18%(+0.221)#38 | 1.37%(-0.975)#2,269 |
| 34. | East Chicago | 0.39% | 0.18%(+0.218)#39 | 1.37%(-0.978)#2,270 |
| 35. | Goshen | 0.39% | 0.18%(+0.213)#40 | 1.37%(-0.983)#2,271 |
| 36. | Elkhart | 0.37% | 0.18%(+0.197)#41 | 1.37%(-0.999)#2,272 |
| 37. | Perrysville | 0.36% | 0.18%(+0.183)#42 | 1.37%(-1.01)#2,273 |
| 38. | Linden | 0.36% | 0.18%(+0.179)#43 | 1.37%(-1.02)#2,274 |
| 39. | Wakarusa | 0.32% | 0.18%(+0.145)#44 | 1.37%(-1.05)#2,275 |
| 40. | Borden | 0.31% | 0.18%(+0.137)#45 | 1.37%(-1.06)#2,276 |
| 41. | Markle | 0.31% | 0.18%(+0.130)#46 | 1.37%(-1.07)#2,277 |
| 42. | Princeton | 0.30% | 0.18%(+0.123)#47 | 1.37%(-1.07)#2,278 |
| 43. | Plainfield | 0.29% | 0.18%(+0.111)#48 | 1.37%(-1.08)#2,279 |
| 44. | Kokomo | 0.23% | 0.18%(+0.054)#49 | 1.37%(-1.14)#2,280 |
| 45. | Huntington | 0.22% | 0.18%(+0.041)#50 | 1.37%(-1.16)#2,281 |
| 46. | St John | 0.21% | 0.18%(+0.036)#51 | 1.37%(-1.16)#2,282 |
| 47. | New Haven | 0.21% | 0.18%(+0.029)#52 | 1.37%(-1.17)#2,283 |
| 48. | Jasper | 0.19% | 0.18%(+0.018)#53 | 1.37%(-1.18)#2,284 |
| 49. | Upland | 0.18% | 0.18%(+0.000)#54 | 1.37%(-1.20)#2,285 |
| 50. | Fort Wayne | 0.16% | 0.18%(-0.014)#55 | 1.37%(-1.21)#2,286 |
| 51. | Columbus | 0.16% | 0.18%(-0.019)#56 | 1.37%(-1.22)#2,287 |
| 52. | Westfield | 0.16% | 0.18%(-0.021)#57 | 1.37%(-1.22)#2,288 |
| 53. | La Porte | 0.15% | 0.18%(-0.025)#58 | 1.37%(-1.22)#2,289 |
| 54. | South Bend | 0.12% | 0.18%(-0.054)#59 | 1.37%(-1.25)#2,290 |
| 55. | Carmel | 0.11% | 0.18%(-0.068)#60 | 1.37%(-1.26)#2,291 |
| 56. | Lebanon | 0.10% | 0.18%(-0.072)#61 | 1.37%(-1.27)#2,292 |
| 57. | New Albany | 0.10% | 0.18%(-0.073)#62 | 1.37%(-1.27)#2,293 |
| 58. | Lawrence | 0.10% | 0.18%(-0.073)#63 | 1.37%(-1.27)#2,294 |
| 59. | Bloomington | 0.099% | 0.18%(-0.078)#64 | 1.37%(-1.27)#2,295 |
| 60. | Chesterton | 0.099% | 0.18%(-0.078)#65 | 1.37%(-1.27)#2,296 |
| 61. | Hammond | 0.097% | 0.18%(-0.080)#66 | 1.37%(-1.28)#2,405 |
| 62. | Terre Haute | 0.096% | 0.18%(-0.081)#67 | 1.37%(-1.28)#2,406 |
| 63. | Jeffersonville | 0.092% | 0.18%(-0.084)#68 | 1.37%(-1.28)#2,407 |
| 64. | Noblesville | 0.084% | 0.18%(-0.093)#69 | 1.37%(-1.29)#2,408 |
| 65. | West Lafayette | 0.082% | 0.18%(-0.094)#70 | 1.37%(-1.29)#2,409 |
| 66. | Grissom Afb | 0.076% | 0.18%(-0.100)#71 | 1.37%(-1.30)#2,410 |
| 67. | Portage | 0.066% | 0.18%(-0.110)#72 | 1.37%(-1.31)#2,411 |
| 68. | Covington | 0.066% | 0.18%(-0.111)#73 | 1.37%(-1.31)#2,412 |
| 69. | Gary | 0.064% | 0.18%(-0.113)#74 | 1.37%(-1.31)#2,413 |
| 70. | Bargersville | 0.063% | 0.18%(-0.113)#75 | 1.37%(-1.31)#2,414 |
| 71. | Frankfort | 0.050% | 0.18%(-0.126)#76 | 1.37%(-1.32)#2,415 |
| 72. | Mishawaka | 0.049% | 0.18%(-0.127)#77 | 1.37%(-1.32)#2,416 |
| 73. | Beech Grove | 0.046% | 0.18%(-0.130)#78 | 1.37%(-1.33)#2,417 |
| 74. | Clarksville | 0.041% | 0.18%(-0.136)#79 | 1.37%(-1.33)#2,418 |
| 75. | Muncie | 0.038% | 0.18%(-0.138)#80 | 1.37%(-1.33)#2,419 |
| 76. | Greenwood | 0.038% | 0.18%(-0.139)#81 | 1.37%(-1.33)#2,420 |
| 77. | Crown Point | 0.030% | 0.18%(-0.147)#82 | 1.37%(-1.34)#2,421 |
| 78. | Anderson | 0.025% | 0.18%(-0.151)#83 | 1.37%(-1.35)#2,422 |
| 79. | Brownsburg | 0.020% | 0.18%(-0.156)#84 | 1.37%(-1.35)#2,423 |
| 80. | Linton | 0.019% | 0.18%(-0.157)#85 | 1.37%(-1.35)#2,424 |
| 81. | Fishers | 0.018% | 0.18%(-0.158)#86 | 1.37%(-1.35)#2,425 |
| 82. | Richmond | 0.017% | 0.18%(-0.160)#87 | 1.37%(-1.36)#2,426 |
Common Questions
What are the Top 10 Cities with the Highest Percentage of Immigrants from Caribbean in Indiana?
Top 10 Cities with the Highest Percentage of Immigrants from Caribbean in Indiana are:
#1
6.96%
#2
3.76%
#3
2.42%
#4
2.14%
#5
2.13%
#6
1.47%
#7
0.80%
#8
0.79%
#9
0.66%
#10
0.64%
What city has the Highest Percentage of Immigrants from Caribbean in Indiana?
French Lick has the Highest Percentage of Immigrants from Caribbean in Indiana with 6.96%.
What is the Percentage of Immigrants from Caribbean in the State of Indiana?
Percentage of Immigrants from Caribbean in Indiana is 0.18%.
What is the Percentage of Immigrants from Caribbean in the United States?
Percentage of Immigrants from Caribbean in the United States is 1.37%.