Cities with the Highest Percentage of British Population in Indiana
RELATED REPORTS & OPTIONS
British
Indiana
Compare Cities
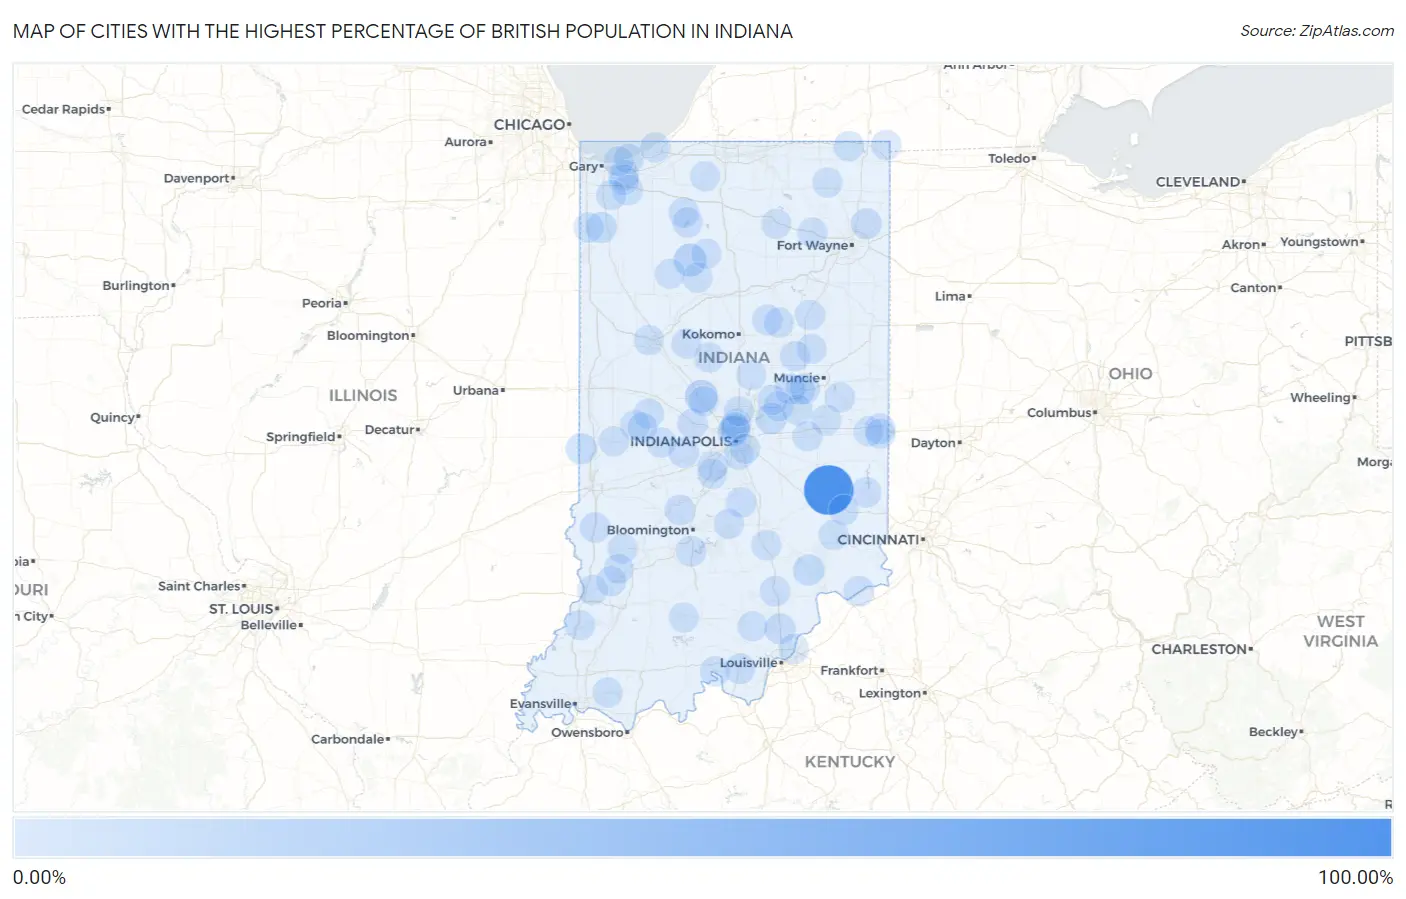
Map of Cities with the Highest Percentage of British Population in Indiana
0.00%
100.00%
Cities with the Highest Percentage of British Population in Indiana
| City | British | vs State | vs National | |
| 1. | Clarksburg | 100.00% | 0.51%(+99.5)#1 | 0.53%(+99.5)#1 |
| 2. | Needham | 100.00% | 0.51%(+99.5)#2 | 0.53%(+99.5)#2 |
| 3. | Helmer | 18.18% | 0.51%(+17.7)#3 | 0.53%(+17.7)#46 |
| 4. | Star City | 14.60% | 0.51%(+14.1)#4 | 0.53%(+14.1)#66 |
| 5. | Ulen | 13.43% | 0.51%(+12.9)#5 | 0.53%(+12.9)#74 |
| 6. | Blairsville | 10.77% | 0.51%(+10.3)#6 | 0.53%(+10.2)#108 |
| 7. | Blue Ridge | 10.22% | 0.51%(+9.71)#7 | 0.53%(+9.69)#122 |
| 8. | Dupont | 6.30% | 0.51%(+5.80)#8 | 0.53%(+5.77)#253 |
| 9. | Shelby | 5.84% | 0.51%(+5.34)#9 | 0.53%(+5.31)#279 |
| 10. | Fortville | 5.82% | 0.51%(+5.31)#10 | 0.53%(+5.29)#283 |
| 11. | Romney | 5.66% | 0.51%(+5.15)#11 | 0.53%(+5.13)#291 |
| 12. | St Bernice | 5.66% | 0.51%(+5.15)#12 | 0.53%(+5.13)#294 |
| 13. | Antioch | 5.59% | 0.51%(+5.08)#13 | 0.53%(+5.06)#301 |
| 14. | Memphis | 4.27% | 0.51%(+3.77)#14 | 0.53%(+3.74)#443 |
| 15. | Leo Cedarville | 4.17% | 0.51%(+3.66)#15 | 0.53%(+3.64)#457 |
| 16. | Otter Lake | 4.09% | 0.51%(+3.59)#16 | 0.53%(+3.56)#471 |
| 17. | Shelburn | 3.36% | 0.51%(+2.86)#17 | 0.53%(+2.83)#639 |
| 18. | Nineveh | 3.36% | 0.51%(+2.86)#18 | 0.53%(+2.83)#640 |
| 19. | Aberdeen | 3.19% | 0.51%(+2.68)#19 | 0.53%(+2.66)#684 |
| 20. | Vevay | 3.18% | 0.51%(+2.67)#20 | 0.53%(+2.65)#691 |
| 21. | Stinesville | 3.14% | 0.51%(+2.64)#21 | 0.53%(+2.61)#707 |
| 22. | Prince S Lakes | 3.06% | 0.51%(+2.55)#22 | 0.53%(+2.53)#733 |
| 23. | Austin | 2.89% | 0.51%(+2.39)#23 | 0.53%(+2.36)#803 |
| 24. | Amo | 2.84% | 0.51%(+2.34)#24 | 0.53%(+2.31)#818 |
| 25. | Country Club Heights | 2.84% | 0.51%(+2.33)#25 | 0.53%(+2.31)#819 |
| 26. | Corydon | 2.82% | 0.51%(+2.32)#26 | 0.53%(+2.29)#829 |
| 27. | Spring Grove | 2.81% | 0.51%(+2.30)#27 | 0.53%(+2.28)#836 |
| 28. | Converse | 2.79% | 0.51%(+2.29)#28 | 0.53%(+2.26)#846 |
| 29. | Harrodsburg | 2.70% | 0.51%(+2.19)#29 | 0.53%(+2.17)#889 |
| 30. | Bruceville | 2.53% | 0.51%(+2.03)#30 | 0.53%(+2.00)#981 |
| 31. | Knox | 2.47% | 0.51%(+1.96)#31 | 0.53%(+1.94)#1,028 |
| 32. | Lizton | 2.35% | 0.51%(+1.85)#32 | 0.53%(+1.82)#1,106 |
| 33. | Markleville | 2.29% | 0.51%(+1.79)#33 | 0.53%(+1.76)#1,146 |
| 34. | South Haven | 2.20% | 0.51%(+1.69)#34 | 0.53%(+1.67)#1,222 |
| 35. | Bass Lake | 2.06% | 0.51%(+1.56)#35 | 0.53%(+1.53)#1,350 |
| 36. | Orland | 2.02% | 0.51%(+1.51)#36 | 0.53%(+1.49)#1,409 |
| 37. | New Market | 1.94% | 0.51%(+1.43)#37 | 0.53%(+1.41)#1,502 |
| 38. | Underwood | 1.86% | 0.51%(+1.36)#38 | 0.53%(+1.33)#1,590 |
| 39. | Batesville | 1.83% | 0.51%(+1.32)#39 | 0.53%(+1.30)#1,628 |
| 40. | Tyner | 1.82% | 0.51%(+1.32)#40 | 0.53%(+1.30)#1,632 |
| 41. | Daleville | 1.82% | 0.51%(+1.32)#41 | 0.53%(+1.29)#1,636 |
| 42. | Rocky Ripple | 1.79% | 0.51%(+1.29)#42 | 0.53%(+1.26)#1,683 |
| 43. | Summitville | 1.79% | 0.51%(+1.28)#43 | 0.53%(+1.26)#1,686 |
| 44. | Brookville | 1.76% | 0.51%(+1.25)#44 | 0.53%(+1.23)#1,733 |
| 45. | Salt Creek Commons | 1.73% | 0.51%(+1.22)#45 | 0.53%(+1.20)#1,778 |
| 46. | Winfield | 1.72% | 0.51%(+1.21)#46 | 0.53%(+1.19)#1,798 |
| 47. | Osgood | 1.67% | 0.51%(+1.17)#47 | 0.53%(+1.14)#1,867 |
| 48. | Enchanted Hills | 1.67% | 0.51%(+1.17)#48 | 0.53%(+1.14)#1,871 |
| 49. | Nashville | 1.64% | 0.51%(+1.13)#49 | 0.53%(+1.11)#1,942 |
| 50. | Van Buren | 1.60% | 0.51%(+1.10)#50 | 0.53%(+1.07)#1,997 |
| 51. | Schneider | 1.60% | 0.51%(+1.10)#51 | 0.53%(+1.07)#1,998 |
| 52. | Waveland | 1.54% | 0.51%(+1.04)#52 | 0.53%(+1.01)#2,129 |
| 53. | Pendleton | 1.54% | 0.51%(+1.03)#53 | 0.53%(+1.01)#2,143 |
| 54. | Jonesville | 1.53% | 0.51%(+1.02)#54 | 0.53%(+1.00)#2,162 |
| 55. | Lapel | 1.47% | 0.51%(+0.964)#55 | 0.53%(+0.940)#2,287 |
| 56. | Mooresville | 1.45% | 0.51%(+0.943)#56 | 0.53%(+0.919)#2,343 |
| 57. | Chesterfield | 1.43% | 0.51%(+0.924)#57 | 0.53%(+0.900)#2,391 |
| 58. | Spring Hill | 1.39% | 0.51%(+0.883)#58 | 0.53%(+0.859)#2,515 |
| 59. | Dune Acres | 1.37% | 0.51%(+0.859)#59 | 0.53%(+0.835)#2,578 |
| 60. | Sweetser | 1.36% | 0.51%(+0.849)#60 | 0.53%(+0.825)#2,604 |
| 61. | Royal Center | 1.35% | 0.51%(+0.842)#61 | 0.53%(+0.818)#2,620 |
| 62. | Meridian Hills | 1.32% | 0.51%(+0.812)#62 | 0.53%(+0.788)#2,699 |
| 63. | Atlanta | 1.29% | 0.51%(+0.788)#63 | 0.53%(+0.764)#2,767 |
| 64. | Utica | 1.29% | 0.51%(+0.781)#64 | 0.53%(+0.758)#2,783 |
| 65. | Winona Lake | 1.28% | 0.51%(+0.774)#65 | 0.53%(+0.750)#2,804 |
| 66. | Pottawattamie Park | 1.26% | 0.51%(+0.756)#66 | 0.53%(+0.732)#2,861 |
| 67. | Columbia City | 1.24% | 0.51%(+0.739)#67 | 0.53%(+0.715)#2,907 |
| 68. | Michigantown | 1.24% | 0.51%(+0.731)#68 | 0.53%(+0.707)#2,935 |
| 69. | Centerville | 1.23% | 0.51%(+0.726)#69 | 0.53%(+0.702)#2,955 |
| 70. | Homecroft | 1.22% | 0.51%(+0.715)#70 | 0.53%(+0.691)#2,986 |
| 71. | Leavenworth | 1.22% | 0.51%(+0.713)#71 | 0.53%(+0.690)#2,992 |
| 72. | North Liberty | 1.22% | 0.51%(+0.711)#72 | 0.53%(+0.687)#2,999 |
| 73. | Rome City | 1.19% | 0.51%(+0.687)#73 | 0.53%(+0.663)#3,085 |
| 74. | Kewanna | 1.19% | 0.51%(+0.686)#74 | 0.53%(+0.663)#3,089 |
| 75. | Bainbridge | 1.18% | 0.51%(+0.676)#75 | 0.53%(+0.653)#3,122 |
| 76. | Decker | 1.18% | 0.51%(+0.670)#76 | 0.53%(+0.647)#3,136 |
| 77. | Brooklyn | 1.16% | 0.51%(+0.650)#77 | 0.53%(+0.627)#3,207 |
| 78. | Rockville | 1.14% | 0.51%(+0.637)#78 | 0.53%(+0.613)#3,267 |
| 79. | Lebanon | 1.11% | 0.51%(+0.599)#79 | 0.53%(+0.576)#3,413 |
| 80. | New Castle | 1.10% | 0.51%(+0.596)#80 | 0.53%(+0.573)#3,425 |
| 81. | Richmond | 1.09% | 0.51%(+0.582)#81 | 0.53%(+0.559)#3,487 |
| 82. | Carmel | 1.09% | 0.51%(+0.580)#82 | 0.53%(+0.556)#3,494 |
| 83. | Crows Nest | 1.08% | 0.51%(+0.569)#83 | 0.53%(+0.545)#3,543 |
| 84. | Edwardsport | 1.07% | 0.51%(+0.561)#84 | 0.53%(+0.538)#3,581 |
| 85. | New Pekin | 1.06% | 0.51%(+0.556)#85 | 0.53%(+0.532)#3,611 |
| 86. | West Baden Springs | 1.04% | 0.51%(+0.538)#86 | 0.53%(+0.514)#3,704 |
| 87. | Beech Grove | 1.04% | 0.51%(+0.535)#87 | 0.53%(+0.511)#3,718 |
| 88. | Buffalo | 1.03% | 0.51%(+0.525)#88 | 0.53%(+0.501)#3,771 |
| 89. | Rossville | 1.03% | 0.51%(+0.523)#89 | 0.53%(+0.499)#3,784 |
| 90. | Russellville | 1.02% | 0.51%(+0.517)#90 | 0.53%(+0.493)#3,815 |
| 91. | Jimmerson Lake | 1.01% | 0.51%(+0.508)#91 | 0.53%(+0.485)#3,856 |
| 92. | Clear Lake | 1.01% | 0.51%(+0.504)#92 | 0.53%(+0.480)#3,880 |
| 93. | Linton | 1.01% | 0.51%(+0.504)#93 | 0.53%(+0.480)#3,883 |
| 94. | Ogden Dunes | 0.98% | 0.51%(+0.478)#94 | 0.53%(+0.455)#3,992 |
| 95. | West Lafayette | 0.97% | 0.51%(+0.459)#95 | 0.53%(+0.435)#4,076 |
| 96. | Boonville | 0.96% | 0.51%(+0.453)#96 | 0.53%(+0.430)#4,106 |
| 97. | Sandborn | 0.96% | 0.51%(+0.449)#97 | 0.53%(+0.426)#4,135 |
| 98. | Knightstown | 0.92% | 0.51%(+0.413)#98 | 0.53%(+0.390)#4,320 |
| 99. | Matthews | 0.92% | 0.51%(+0.413)#99 | 0.53%(+0.390)#4,321 |
| 100. | Blountsville | 0.92% | 0.51%(+0.411)#100 | 0.53%(+0.388)#4,338 |
Common Questions
What are the Top 10 Cities with the Highest Percentage of British Population in Indiana?
Top 10 Cities with the Highest Percentage of British Population in Indiana are:
#1
100.00%
#2
14.60%
#3
13.43%
#4
6.30%
#5
5.84%
#6
5.82%
#7
5.66%
#8
4.27%
#9
4.17%
#10
3.36%
What city has the Highest Percentage of British Population in Indiana?
Clarksburg has the Highest Percentage of British Population in Indiana with 100.00%.
What is the Percentage of British Population in the State of Indiana?
Percentage of British Population in Indiana is 0.51%.
What is the Percentage of British Population in the United States?
Percentage of British Population in the United States is 0.53%.