Bloomfield, IN
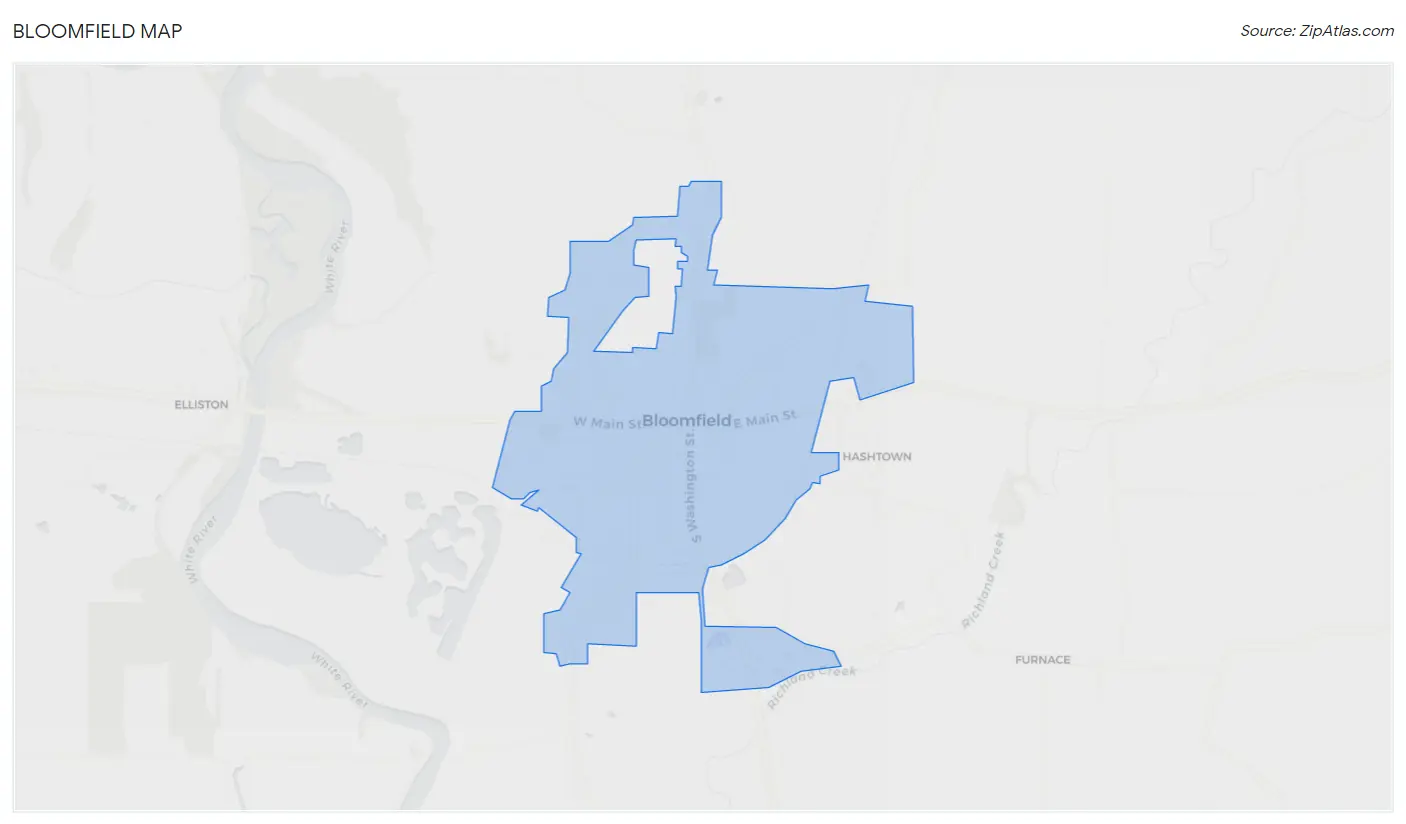
Bloomfield Map
Bloomfield Overview
2,337
TOTAL POPULATION
1,117
MALE POPULATION
1,220
FEMALE POPULATION
91.56
MALES / 100 FEMALES
109.22
FEMALES / 100 MALES
44.1
MEDIAN AGE
3.0
AVG FAMILY SIZE
2.2
AVG HOUSEHOLD SIZE
$27,403
PER CAPITA INCOME
$70,536
AVG FAMILY INCOME
$50,063
AVG HOUSEHOLD INCOME
41.8%
WAGE / INCOME GAP [ % ]
58.2¢/ $1
WAGE / INCOME GAP [ $ ]
0.42
INEQUALITY / GINI INDEX
1,009
LABOR FORCE [ PEOPLE ]
52.5%
PERCENT IN LABOR FORCE
9.1%
UNEMPLOYMENT RATE
Bloomfield Zip Codes
Bloomfield Area Codes
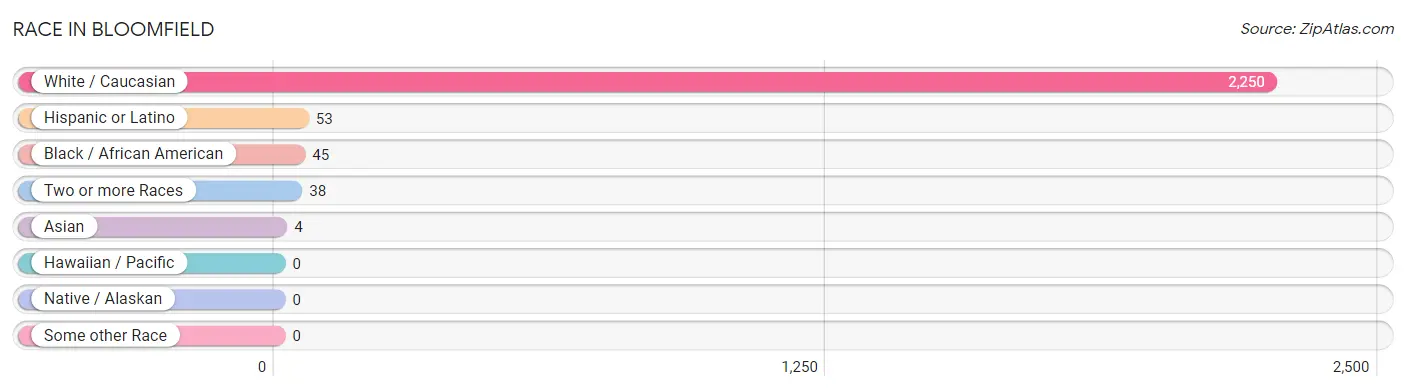
Race in Bloomfield
The most populous races in Bloomfield are White / Caucasian (2,250 | 96.3%), Hispanic or Latino (53 | 2.3%), and Black / African American (45 | 1.9%).
| Race | # Population | % Population |
| Asian | 4 | 0.2% |
| Black / African American | 45 | 1.9% |
| Hawaiian / Pacific | 0 | 0.0% |
| Hispanic or Latino | 53 | 2.3% |
| Native / Alaskan | 0 | 0.0% |
| White / Caucasian | 2,250 | 96.3% |
| Two or more Races | 38 | 1.6% |
| Some other Race | 0 | 0.0% |
| Total | 2,337 | 100.0% |
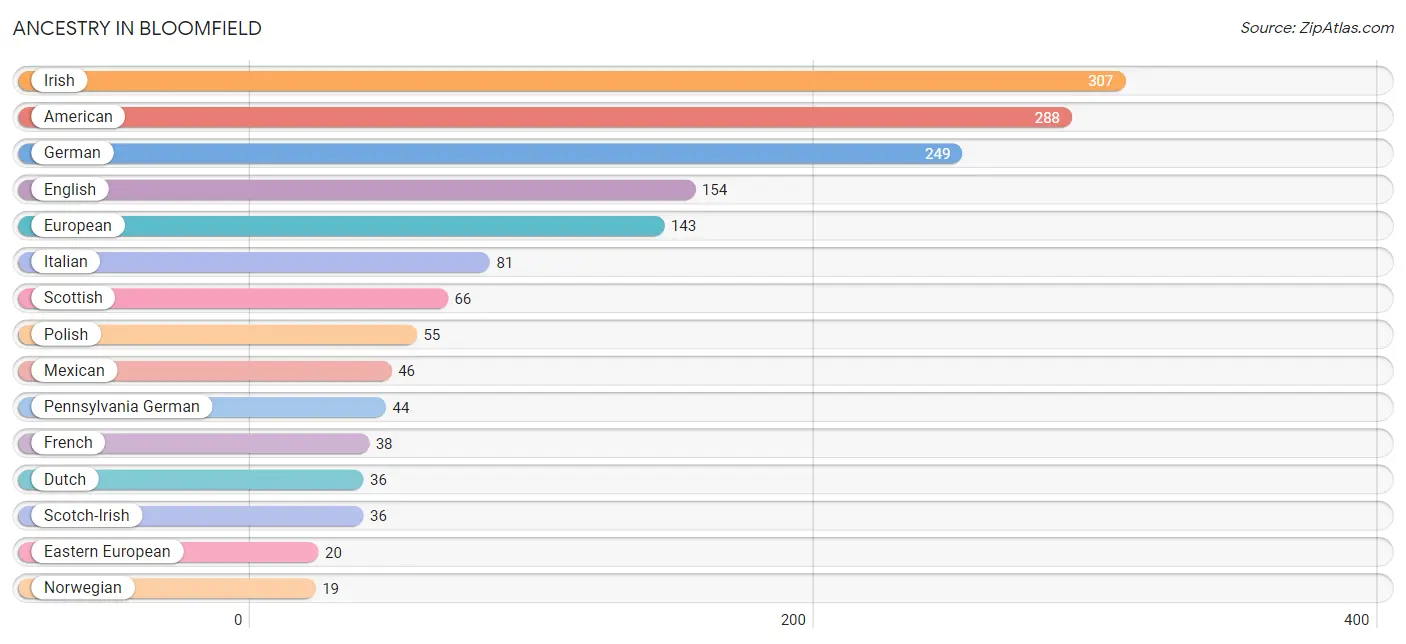
Ancestry in Bloomfield
The most populous ancestries reported in Bloomfield are Irish (307 | 13.1%), American (288 | 12.3%), German (249 | 10.6%), English (154 | 6.6%), and European (143 | 6.1%), together accounting for 48.8% of all Bloomfield residents.
| Ancestry | # Population | % Population |
| Alsatian | 6 | 0.3% |
| American | 288 | 12.3% |
| British | 6 | 0.3% |
| Central American | 4 | 0.2% |
| Dominican | 3 | 0.1% |
| Dutch | 36 | 1.5% |
| Eastern European | 20 | 0.9% |
| English | 154 | 6.6% |
| European | 143 | 6.1% |
| Finnish | 6 | 0.3% |
| French | 38 | 1.6% |
| German | 249 | 10.6% |
| Haitian | 11 | 0.5% |
| Irish | 307 | 13.1% |
| Italian | 81 | 3.5% |
| Korean | 4 | 0.2% |
| Mexican | 46 | 2.0% |
| Norwegian | 19 | 0.8% |
| Pennsylvania German | 44 | 1.9% |
| Polish | 55 | 2.4% |
| Salvadoran | 4 | 0.2% |
| Scotch-Irish | 36 | 1.5% |
| Scottish | 66 | 2.8% |
| Sioux | 4 | 0.2% |
| Welsh | 13 | 0.6% | View All 25 Rows |
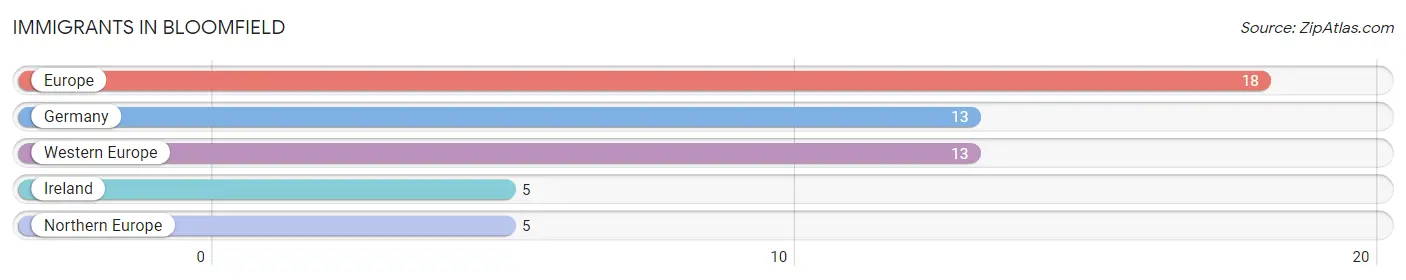
Immigrants in Bloomfield
The most numerous immigrant groups reported in Bloomfield came from Europe (18 | 0.8%), Germany (13 | 0.6%), Western Europe (13 | 0.6%), Ireland (5 | 0.2%), and Northern Europe (5 | 0.2%), together accounting for 2.3% of all Bloomfield residents.
| Immigration Origin | # Population | % Population |
| Europe | 18 | 0.8% |
| Germany | 13 | 0.6% |
| Ireland | 5 | 0.2% |
| Northern Europe | 5 | 0.2% |
| Western Europe | 13 | 0.6% | View All 5 Rows |
Sex and Age in Bloomfield
Sex and Age in Bloomfield
The most populous age groups in Bloomfield are 25 to 29 Years (110 | 9.9%) for men and 50 to 54 Years (107 | 8.8%) for women.
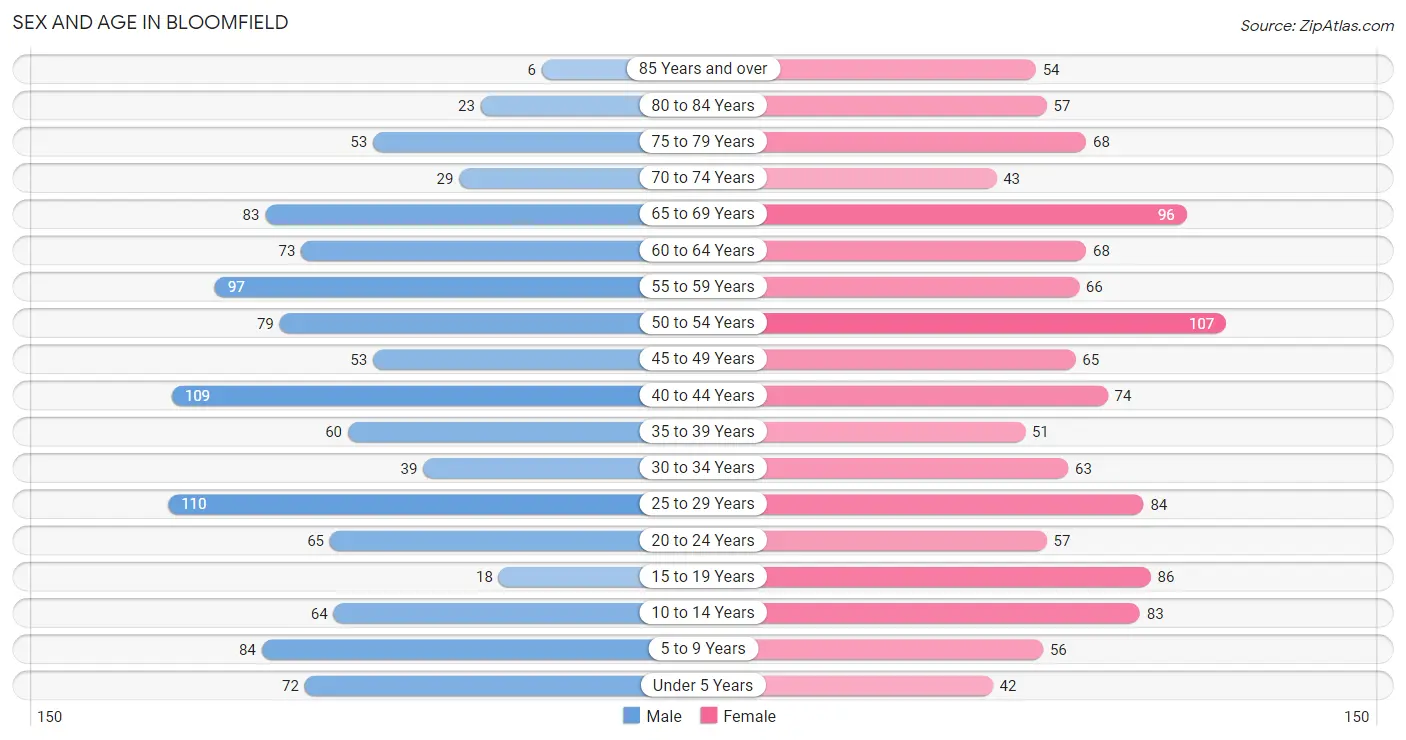
| Age Bracket | Male | Female |
| Under 5 Years | 72 (6.5%) | 42 (3.4%) |
| 5 to 9 Years | 84 (7.5%) | 56 (4.6%) |
| 10 to 14 Years | 64 (5.7%) | 83 (6.8%) |
| 15 to 19 Years | 18 (1.6%) | 86 (7.0%) |
| 20 to 24 Years | 65 (5.8%) | 57 (4.7%) |
| 25 to 29 Years | 110 (9.9%) | 84 (6.9%) |
| 30 to 34 Years | 39 (3.5%) | 63 (5.2%) |
| 35 to 39 Years | 60 (5.4%) | 51 (4.2%) |
| 40 to 44 Years | 109 (9.8%) | 74 (6.1%) |
| 45 to 49 Years | 53 (4.7%) | 65 (5.3%) |
| 50 to 54 Years | 79 (7.1%) | 107 (8.8%) |
| 55 to 59 Years | 97 (8.7%) | 66 (5.4%) |
| 60 to 64 Years | 73 (6.5%) | 68 (5.6%) |
| 65 to 69 Years | 83 (7.4%) | 96 (7.9%) |
| 70 to 74 Years | 29 (2.6%) | 43 (3.5%) |
| 75 to 79 Years | 53 (4.7%) | 68 (5.6%) |
| 80 to 84 Years | 23 (2.1%) | 57 (4.7%) |
| 85 Years and over | 6 (0.5%) | 54 (4.4%) |
| Total | 1,117 (100.0%) | 1,220 (100.0%) |
Families and Households in Bloomfield
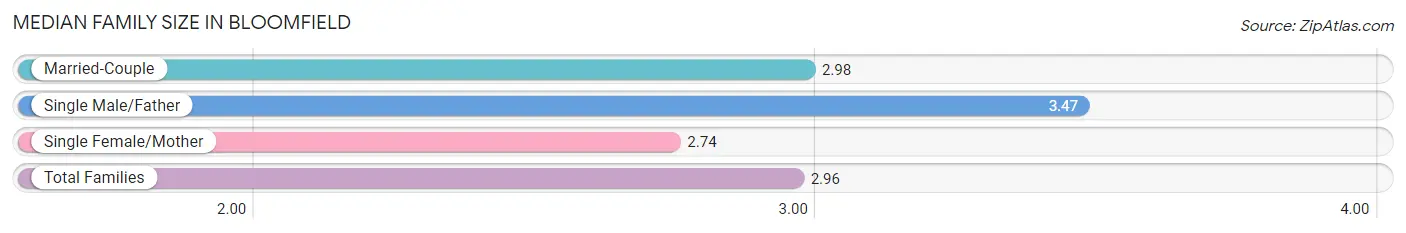
Median Family Size in Bloomfield
The median family size in Bloomfield is 2.96 persons per family, with single male/father families (60 | 10.4%) accounting for the largest median family size of 3.47 persons per family. On the other hand, single female/mother families (163 | 28.3%) represent the smallest median family size with 2.74 persons per family.
| Family Type | # Families | Family Size |
| Married-Couple | 353 (61.3%) | 2.98 |
| Single Male/Father | 60 (10.4%) | 3.47 |
| Single Female/Mother | 163 (28.3%) | 2.74 |
| Total Families | 576 (100.0%) | 2.96 |
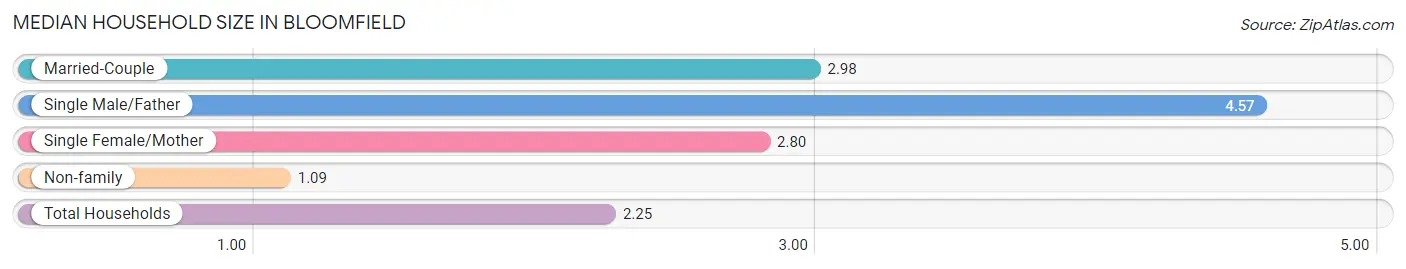
Median Household Size in Bloomfield
The median household size in Bloomfield is 2.25 persons per household, with single male/father households (60 | 6.0%) accounting for the largest median household size of 4.57 persons per household. non-family households (420 | 42.2%) represent the smallest median household size with 1.09 persons per household.
| Household Type | # Households | Household Size |
| Married-Couple | 353 (35.4%) | 2.98 |
| Single Male/Father | 60 (6.0%) | 4.57 |
| Single Female/Mother | 163 (16.4%) | 2.80 |
| Non-family | 420 (42.2%) | 1.09 |
| Total Households | 996 (100.0%) | 2.25 |
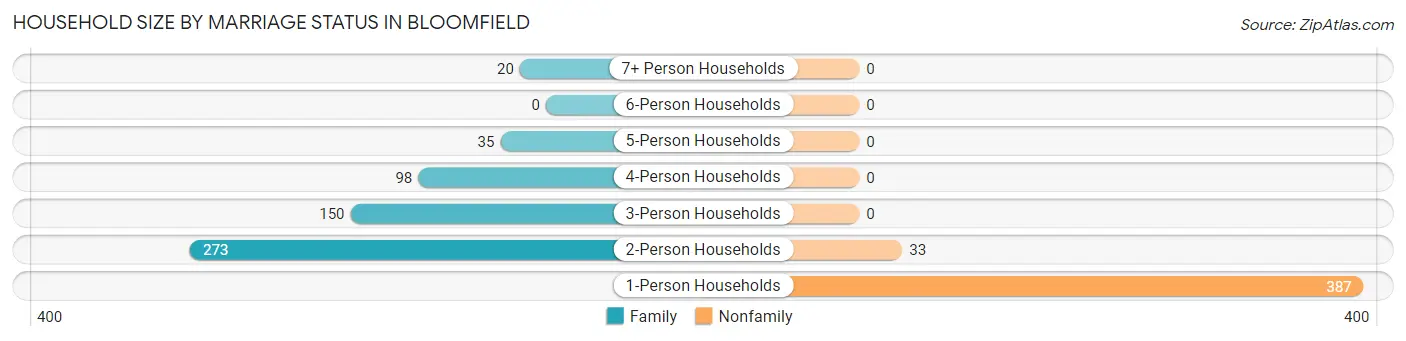
Household Size by Marriage Status in Bloomfield
Out of a total of 996 households in Bloomfield, 576 (57.8%) are family households, while 420 (42.2%) are nonfamily households. The most numerous type of family households are 2-person households, comprising 273, and the most common type of nonfamily households are 1-person households, comprising 387.
| Household Size | Family Households | Nonfamily Households |
| 1-Person Households | - | 387 (38.9%) |
| 2-Person Households | 273 (27.4%) | 33 (3.3%) |
| 3-Person Households | 150 (15.1%) | 0 (0.0%) |
| 4-Person Households | 98 (9.8%) | 0 (0.0%) |
| 5-Person Households | 35 (3.5%) | 0 (0.0%) |
| 6-Person Households | 0 (0.0%) | 0 (0.0%) |
| 7+ Person Households | 20 (2.0%) | 0 (0.0%) |
| Total | 576 (57.8%) | 420 (42.2%) |
Female Fertility in Bloomfield
Fertility by Age in Bloomfield
Average fertility rate in Bloomfield is 72.0 births per 1,000 women. Women in the age bracket of 20 to 34 years have the highest fertility rate with 172.0 births per 1,000 women. Women in the age bracket of 20 to 34 years acount for 100.0% of all women with births.
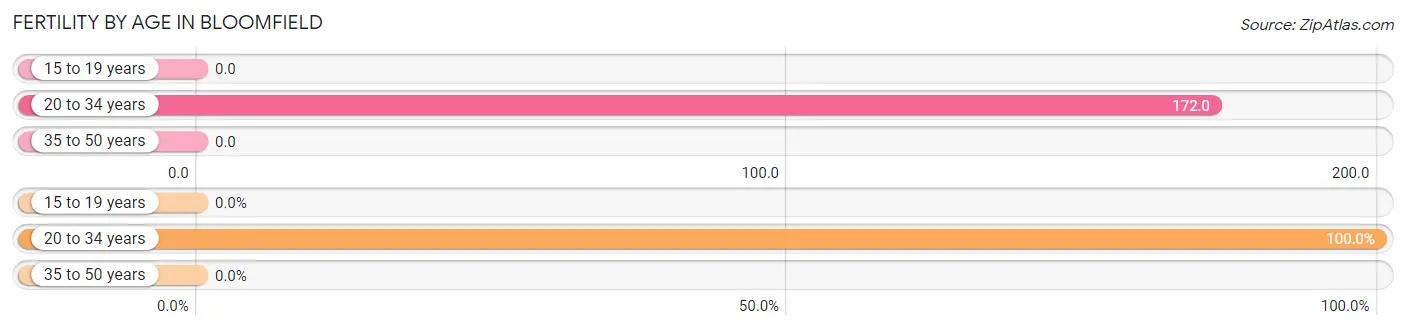
| Age Bracket | Women with Births | Births / 1,000 Women |
| 15 to 19 years | 0 (0.0%) | 0.0 |
| 20 to 34 years | 35 (100.0%) | 172.0 |
| 35 to 50 years | 0 (0.0%) | 0.0 |
| Total | 35 (100.0%) | 72.0 |
Fertility by Age by Marriage Status in Bloomfield
54.3% of women with births (35) in Bloomfield are married. The highest percentage of unmarried women with births falls into 20 to 34 years age bracket with 45.7% of them unmarried at the time of birth, while the lowest percentage of unmarried women with births belong to 20 to 34 years age bracket with 45.7% of them unmarried.
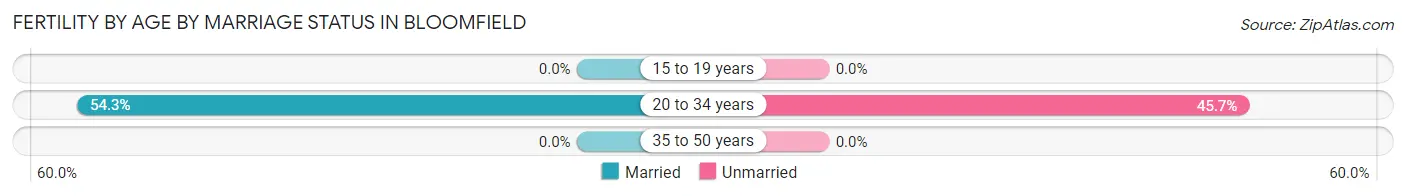
| Age Bracket | Married | Unmarried |
| 15 to 19 years | 0 (0.0%) | 0 (0.0%) |
| 20 to 34 years | 19 (54.3%) | 16 (45.7%) |
| 35 to 50 years | 0 (0.0%) | 0 (0.0%) |
| Total | 19 (54.3%) | 16 (45.7%) |
Fertility by Education in Bloomfield
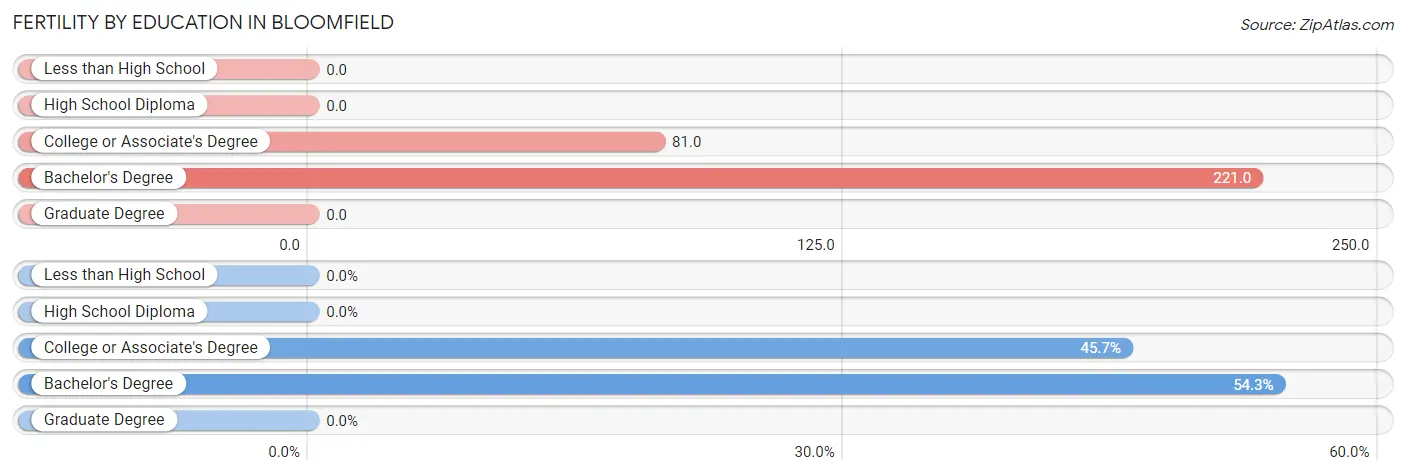
| Educational Attainment | Women with Births | Births / 1,000 Women |
| Less than High School | 0 (0.0%) | 0.0 |
| High School Diploma | 0 (0.0%) | 0.0 |
| College or Associate's Degree | 16 (45.7%) | 81.0 |
| Bachelor's Degree | 19 (54.3%) | 221.0 |
| Graduate Degree | 0 (0.0%) | 0.0 |
| Total | 35 (100.0%) | 72.0 |
Fertility by Education by Marriage Status in Bloomfield
45.7% of women with births in Bloomfield are unmarried. Women with the educational attainment of bachelor's degree are most likely to be married with 100.0% of them married at childbirth, while women with the educational attainment of college or associate's degree are least likely to be married with 100.0% of them unmarried at childbirth.
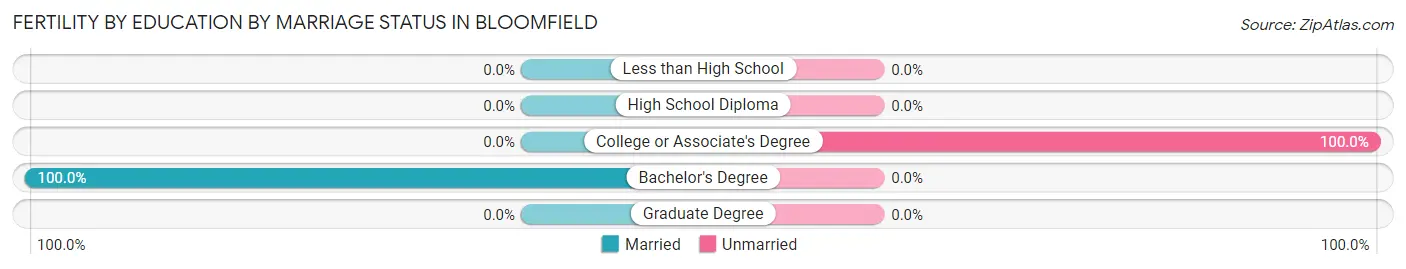
| Educational Attainment | Married | Unmarried |
| Less than High School | 0 (0.0%) | 0 (0.0%) |
| High School Diploma | 0 (0.0%) | 0 (0.0%) |
| College or Associate's Degree | 0 (0.0%) | 16 (100.0%) |
| Bachelor's Degree | 19 (100.0%) | 0 (0.0%) |
| Graduate Degree | 0 (0.0%) | 0 (0.0%) |
| Total | 19 (54.3%) | 16 (45.7%) |
Income in Bloomfield
Income Overview in Bloomfield
Per Capita Income in Bloomfield is $27,403, while median incomes of families and households are $70,536 and $50,063 respectively.
| Characteristic | Number | Measure |
| Per Capita Income | 2,337 | $27,403 |
| Median Family Income | 576 | $70,536 |
| Mean Family Income | 576 | $76,382 |
| Median Household Income | 996 | $50,063 |
| Mean Household Income | 996 | $59,976 |
| Income Deficit | 576 | $0 |
| Wage / Income Gap (%) | 2,337 | 41.80% |
| Wage / Income Gap ($) | 2,337 | 58.20¢ per $1 |
| Gini / Inequality Index | 2,337 | 0.42 |
Earnings by Sex in Bloomfield
Average Earnings in Bloomfield are $40,390, $51,544 for men and $30,000 for women, a difference of 41.8%.
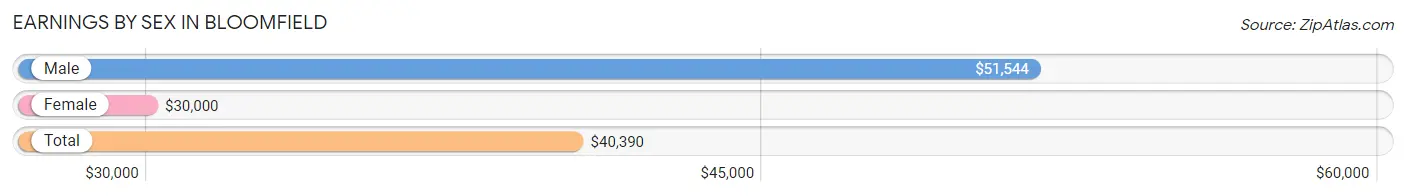
| Sex | Number | Average Earnings |
| Male | 608 (57.8%) | $51,544 |
| Female | 444 (42.2%) | $30,000 |
| Total | 1,052 (100.0%) | $40,390 |
Earnings by Sex by Income Bracket in Bloomfield
The most common earnings brackets in Bloomfield are $55,000 to $64,999 for men (101 | 16.6%) and $40,000 to $44,999 for women (61 | 13.7%).
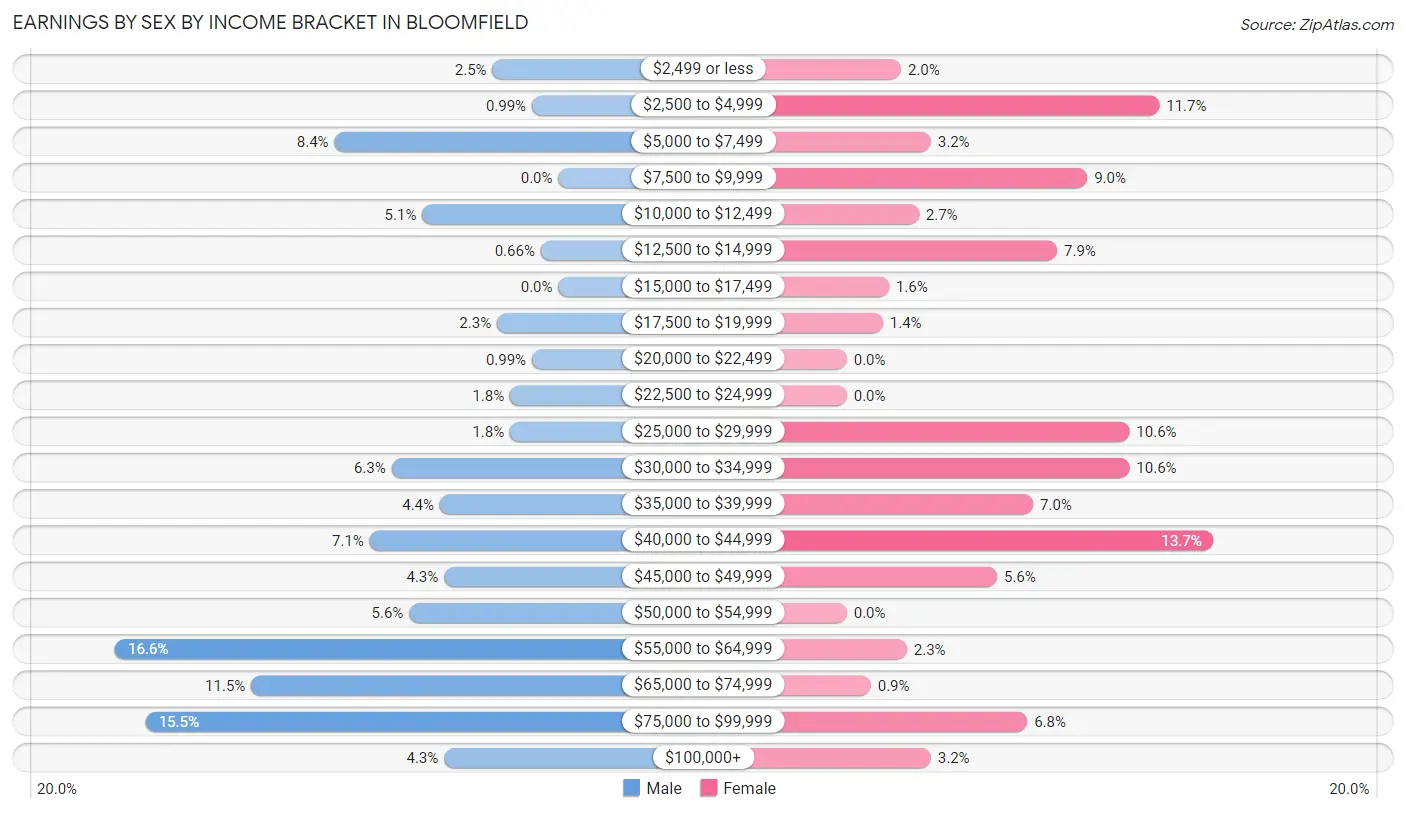
| Income | Male | Female |
| $2,499 or less | 15 (2.5%) | 9 (2.0%) |
| $2,500 to $4,999 | 6 (1.0%) | 52 (11.7%) |
| $5,000 to $7,499 | 51 (8.4%) | 14 (3.2%) |
| $7,500 to $9,999 | 0 (0.0%) | 40 (9.0%) |
| $10,000 to $12,499 | 31 (5.1%) | 12 (2.7%) |
| $12,500 to $14,999 | 4 (0.7%) | 35 (7.9%) |
| $15,000 to $17,499 | 0 (0.0%) | 7 (1.6%) |
| $17,500 to $19,999 | 14 (2.3%) | 6 (1.3%) |
| $20,000 to $22,499 | 6 (1.0%) | 0 (0.0%) |
| $22,500 to $24,999 | 11 (1.8%) | 0 (0.0%) |
| $25,000 to $29,999 | 11 (1.8%) | 47 (10.6%) |
| $30,000 to $34,999 | 38 (6.2%) | 47 (10.6%) |
| $35,000 to $39,999 | 27 (4.4%) | 31 (7.0%) |
| $40,000 to $44,999 | 43 (7.1%) | 61 (13.7%) |
| $45,000 to $49,999 | 26 (4.3%) | 25 (5.6%) |
| $50,000 to $54,999 | 34 (5.6%) | 0 (0.0%) |
| $55,000 to $64,999 | 101 (16.6%) | 10 (2.2%) |
| $65,000 to $74,999 | 70 (11.5%) | 4 (0.9%) |
| $75,000 to $99,999 | 94 (15.5%) | 30 (6.8%) |
| $100,000+ | 26 (4.3%) | 14 (3.2%) |
| Total | 608 (100.0%) | 444 (100.0%) |
Earnings by Sex by Educational Attainment in Bloomfield
Average earnings in Bloomfield are $60,139 for men and $36,071 for women, a difference of 40.0%. Men with an educational attainment of graduate degree enjoy the highest average annual earnings of $115,313, while those with high school diploma education earn the least with $52,292. Women with an educational attainment of college or associate's degree earn the most with the average annual earnings of $40,245, while those with high school diploma education have the smallest earnings of $28,125.
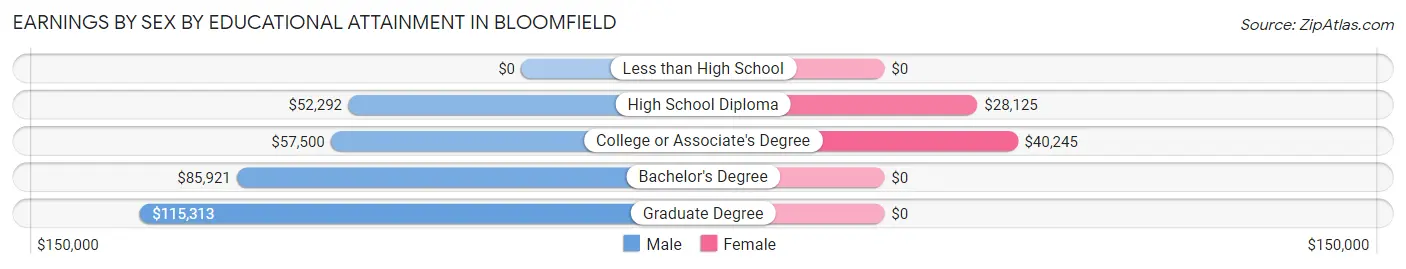
| Educational Attainment | Male Income | Female Income |
| Less than High School | - | - |
| High School Diploma | $52,292 | $28,125 |
| College or Associate's Degree | $57,500 | $40,245 |
| Bachelor's Degree | $85,921 | $0 |
| Graduate Degree | $115,313 | $0 |
| Total | $60,139 | $36,071 |
Family Income in Bloomfield
Family Income Brackets in Bloomfield
According to the Bloomfield family income data, there are 125 families falling into the $50,000 to $74,999 income range, which is the most common income bracket and makes up 21.7% of all families. Conversely, the $15,000 to $24,999 income bracket is the least frequent group with only 6 families (1.0%) belonging to this category.
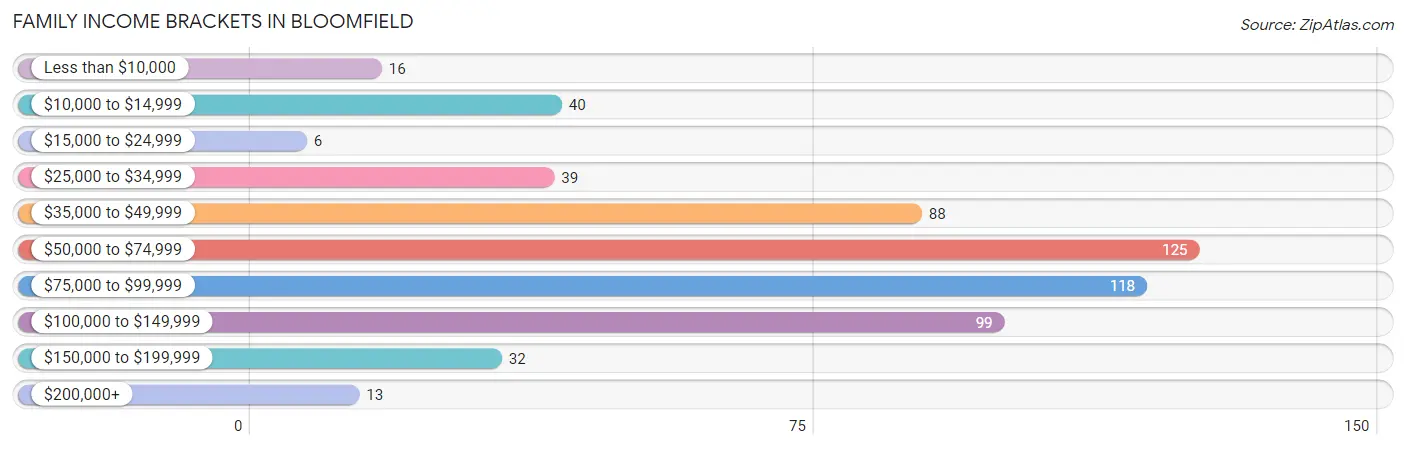
| Income Bracket | # Families | % Families |
| Less than $10,000 | 16 | 2.8% |
| $10,000 to $14,999 | 40 | 6.9% |
| $15,000 to $24,999 | 6 | 1.0% |
| $25,000 to $34,999 | 39 | 6.8% |
| $35,000 to $49,999 | 88 | 15.3% |
| $50,000 to $74,999 | 125 | 21.7% |
| $75,000 to $99,999 | 118 | 20.5% |
| $100,000 to $149,999 | 99 | 17.2% |
| $150,000 to $199,999 | 32 | 5.6% |
| $200,000+ | 13 | 2.3% |
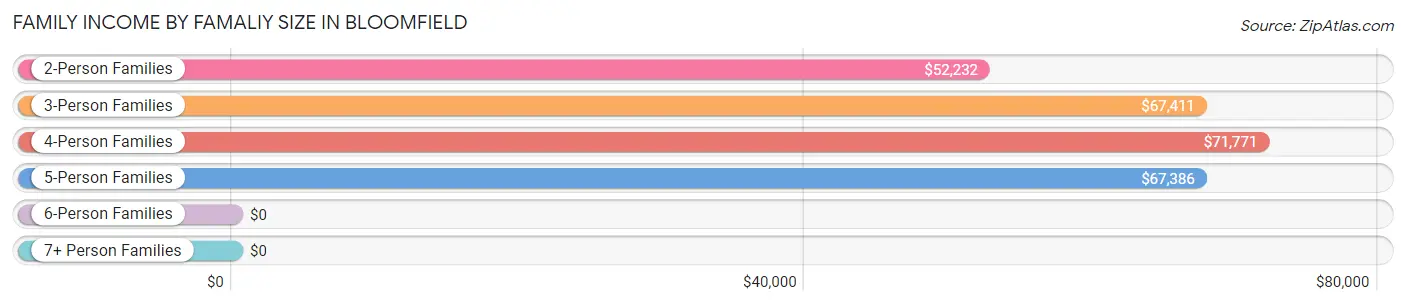
Family Income by Famaliy Size in Bloomfield
4-person families (74 | 12.9%) account for the highest median family income in Bloomfield with $71,771 per family, while 2-person families (316 | 54.9%) have the highest median income of $26,116 per family member.
| Income Bracket | # Families | Median Income |
| 2-Person Families | 316 (54.9%) | $52,232 |
| 3-Person Families | 131 (22.7%) | $67,411 |
| 4-Person Families | 74 (12.9%) | $71,771 |
| 5-Person Families | 35 (6.1%) | $67,386 |
| 6-Person Families | 15 (2.6%) | $0 |
| 7+ Person Families | 5 (0.9%) | $0 |
| Total | 576 (100.0%) | $70,536 |
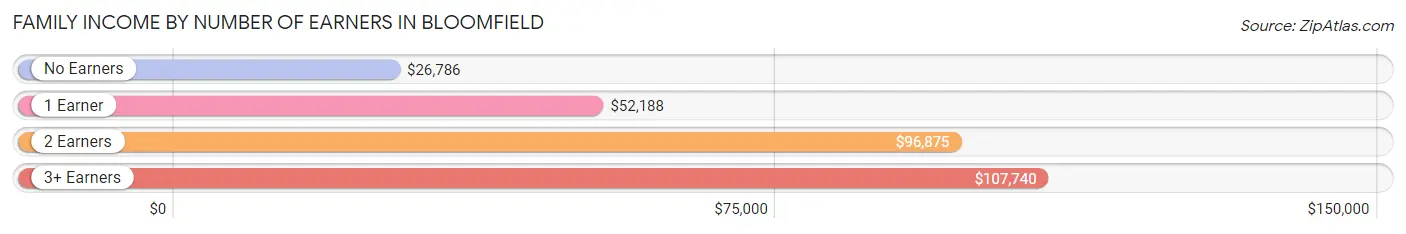
Family Income by Number of Earners in Bloomfield
The median family income in Bloomfield is $70,536, with families comprising 3+ earners (55) having the highest median family income of $107,740, while families with no earners (102) have the lowest median family income of $26,786, accounting for 9.6% and 17.7% of families, respectively.
| Number of Earners | # Families | Median Income |
| No Earners | 102 (17.7%) | $26,786 |
| 1 Earner | 246 (42.7%) | $52,188 |
| 2 Earners | 173 (30.0%) | $96,875 |
| 3+ Earners | 55 (9.6%) | $107,740 |
| Total | 576 (100.0%) | $70,536 |
Household Income in Bloomfield
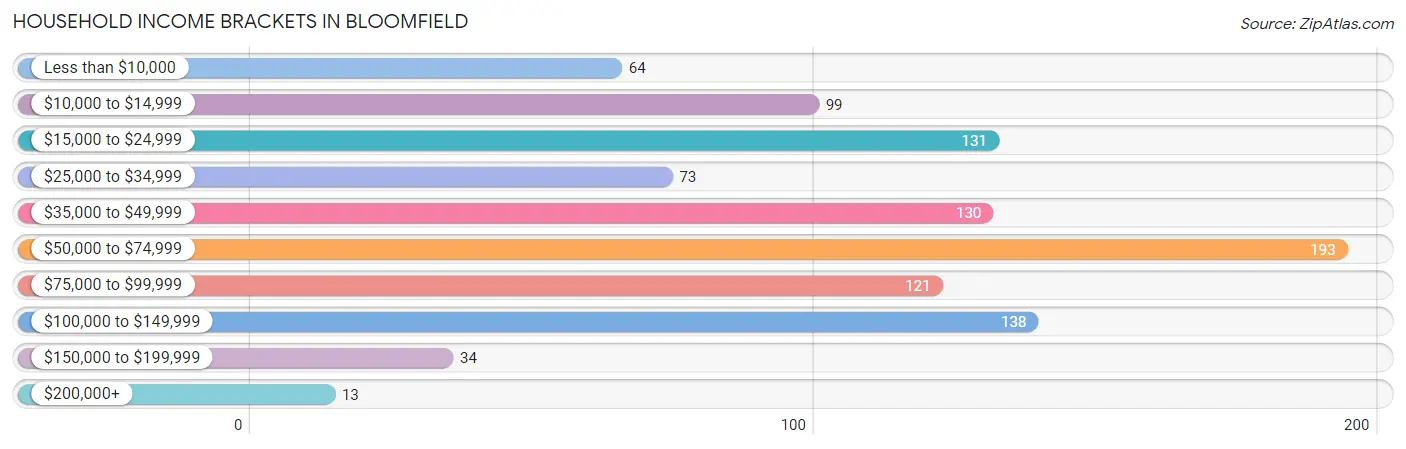
Household Income Brackets in Bloomfield
With 193 households falling in the category, the $50,000 to $74,999 income range is the most frequent in Bloomfield, accounting for 19.4% of all households. In contrast, only 13 households (1.3%) fall into the $200,000+ income bracket, making it the least populous group.
| Income Bracket | # Households | % Households |
| Less than $10,000 | 64 | 6.4% |
| $10,000 to $14,999 | 99 | 9.9% |
| $15,000 to $24,999 | 131 | 13.2% |
| $25,000 to $34,999 | 73 | 7.3% |
| $35,000 to $49,999 | 130 | 13.1% |
| $50,000 to $74,999 | 193 | 19.4% |
| $75,000 to $99,999 | 121 | 12.1% |
| $100,000 to $149,999 | 138 | 13.9% |
| $150,000 to $199,999 | 34 | 3.4% |
| $200,000+ | 13 | 1.3% |
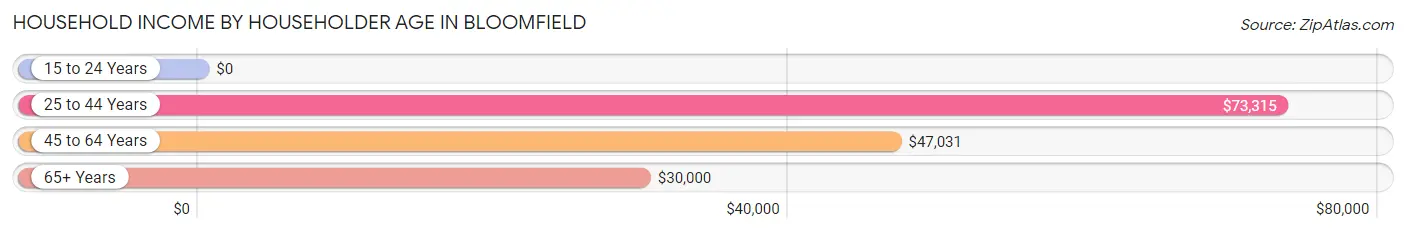
Household Income by Householder Age in Bloomfield
The median household income in Bloomfield is $50,063, with the highest median household income of $73,315 found in the 25 to 44 years age bracket for the primary householder. A total of 257 households (25.8%) fall into this category. Meanwhile, the 15 to 24 years age bracket for the primary householder has the lowest median household income of $0, with 24 households (2.4%) in this group.
| Income Bracket | # Households | Median Income |
| 15 to 24 Years | 24 (2.4%) | $0 |
| 25 to 44 Years | 257 (25.8%) | $73,315 |
| 45 to 64 Years | 351 (35.2%) | $47,031 |
| 65+ Years | 364 (36.5%) | $30,000 |
| Total | 996 (100.0%) | $50,063 |
Poverty in Bloomfield
Income Below Poverty by Sex and Age in Bloomfield
With 10.8% poverty level for males and 17.5% for females among the residents of Bloomfield, under 5 year old males and 15 year old females are the most vulnerable to poverty, with 39 males (54.2%) and 6 females (100.0%) in their respective age groups living below the poverty level.
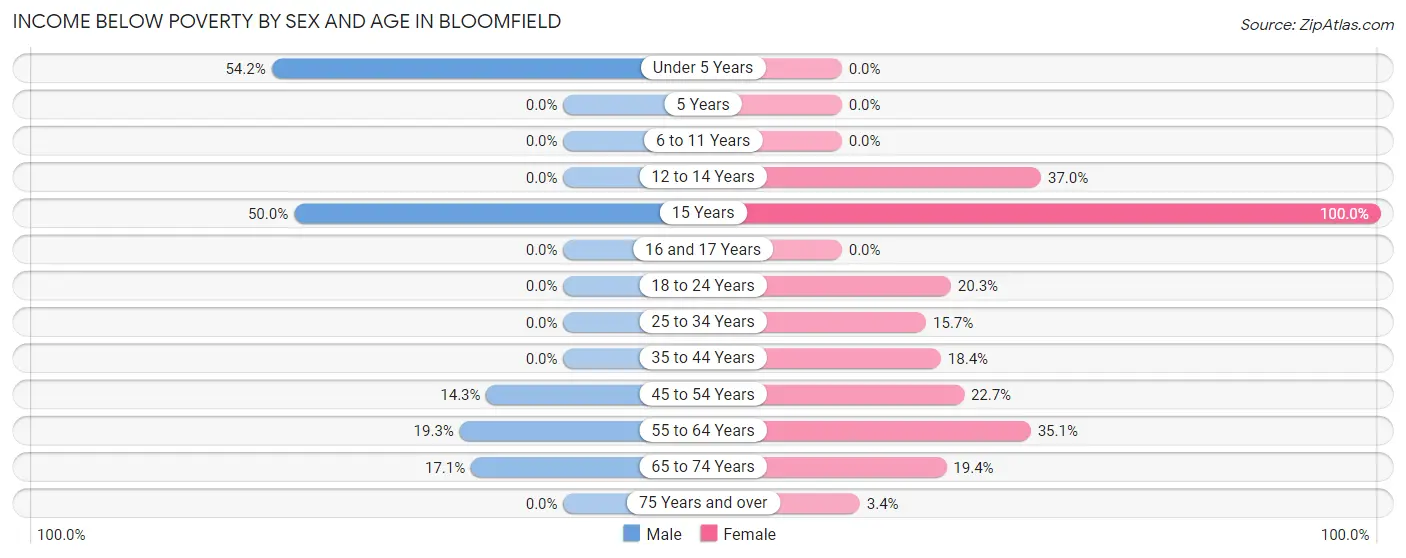
| Age Bracket | Male | Female |
| Under 5 Years | 39 (54.2%) | 0 (0.0%) |
| 5 Years | 0 (0.0%) | 0 (0.0%) |
| 6 to 11 Years | 0 (0.0%) | 0 (0.0%) |
| 12 to 14 Years | 0 (0.0%) | 27 (37.0%) |
| 15 Years | 4 (50.0%) | 6 (100.0%) |
| 16 and 17 Years | 0 (0.0%) | 0 (0.0%) |
| 18 to 24 Years | 0 (0.0%) | 16 (20.3%) |
| 25 to 34 Years | 0 (0.0%) | 23 (15.7%) |
| 35 to 44 Years | 0 (0.0%) | 23 (18.4%) |
| 45 to 54 Years | 18 (14.3%) | 39 (22.7%) |
| 55 to 64 Years | 31 (19.3%) | 47 (35.1%) |
| 65 to 74 Years | 18 (17.1%) | 27 (19.4%) |
| 75 Years and over | 0 (0.0%) | 6 (3.4%) |
| Total | 110 (10.8%) | 214 (17.5%) |
Income Above Poverty by Sex and Age in Bloomfield
According to the poverty statistics in Bloomfield, males aged 5 years and females aged under 5 years are the age groups that are most secure financially, with 100.0% of males and 100.0% of females in these age groups living above the poverty line.
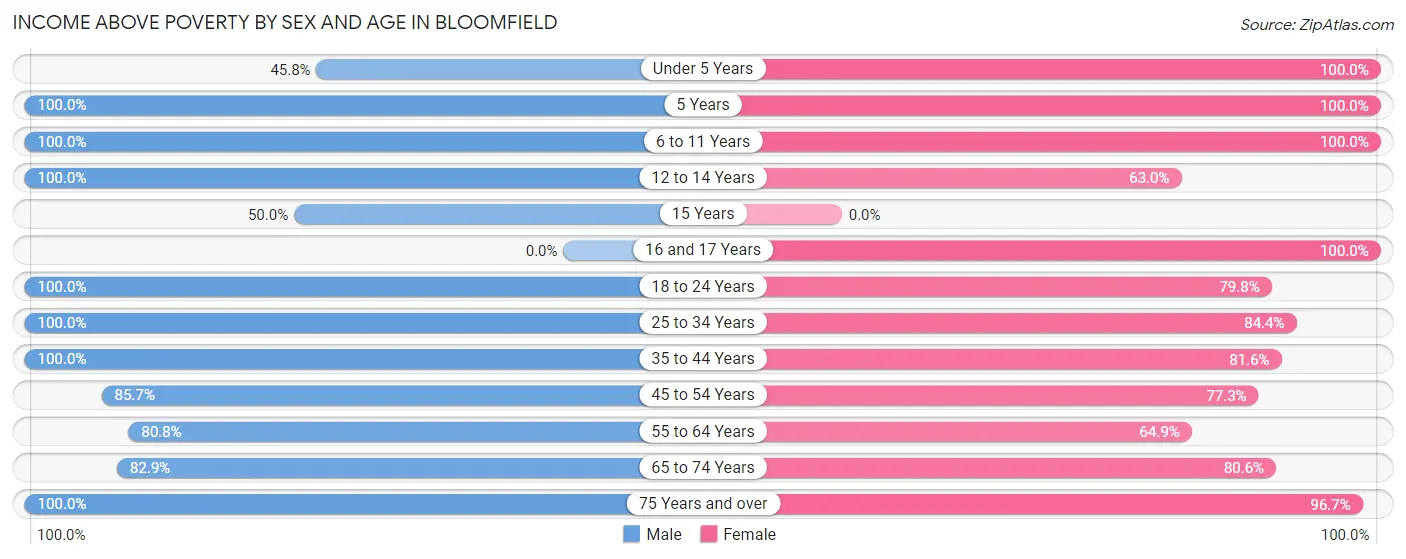
| Age Bracket | Male | Female |
| Under 5 Years | 33 (45.8%) | 42 (100.0%) |
| 5 Years | 12 (100.0%) | 20 (100.0%) |
| 6 to 11 Years | 72 (100.0%) | 46 (100.0%) |
| 12 to 14 Years | 50 (100.0%) | 46 (63.0%) |
| 15 Years | 4 (50.0%) | 0 (0.0%) |
| 16 and 17 Years | 0 (0.0%) | 58 (100.0%) |
| 18 to 24 Years | 69 (100.0%) | 63 (79.7%) |
| 25 to 34 Years | 116 (100.0%) | 124 (84.4%) |
| 35 to 44 Years | 144 (100.0%) | 102 (81.6%) |
| 45 to 54 Years | 108 (85.7%) | 133 (77.3%) |
| 55 to 64 Years | 130 (80.7%) | 87 (64.9%) |
| 65 to 74 Years | 87 (82.9%) | 112 (80.6%) |
| 75 Years and over | 82 (100.0%) | 173 (96.7%) |
| Total | 907 (89.2%) | 1,006 (82.5%) |
Income Below Poverty Among Married-Couple Families in Bloomfield
The poverty statistics for married-couple families in Bloomfield show that 4.3% or 15 of the total 353 families live below the poverty line. Families with 3 or 4 children have the highest poverty rate of 25.0%, comprising of 7 families. On the other hand, families with 1 or 2 children have the lowest poverty rate of 0.0%, which includes 0 families.
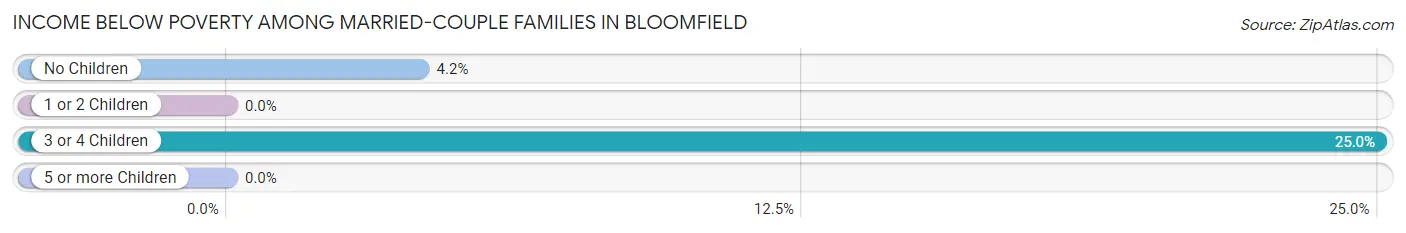
| Children | Above Poverty | Below Poverty |
| No Children | 184 (95.8%) | 8 (4.2%) |
| 1 or 2 Children | 133 (100.0%) | 0 (0.0%) |
| 3 or 4 Children | 21 (75.0%) | 7 (25.0%) |
| 5 or more Children | 0 (0.0%) | 0 (0.0%) |
| Total | 338 (95.8%) | 15 (4.3%) |
Income Below Poverty Among Single-Parent Households in Bloomfield
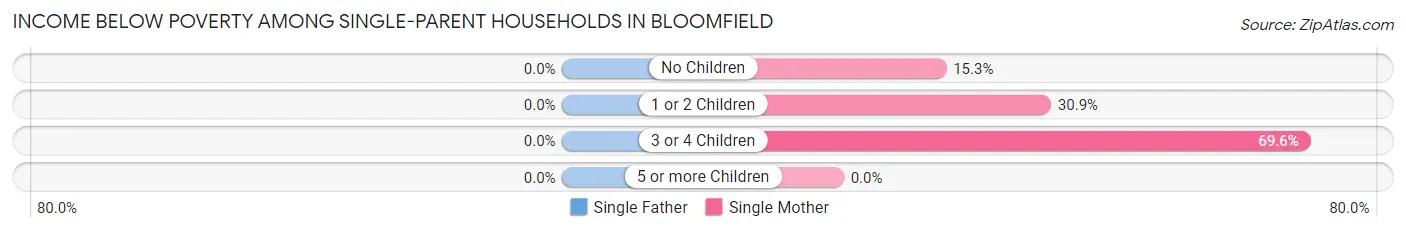
| Children | Single Father | Single Mother |
| No Children | 0 (0.0%) | 11 (15.3%) |
| 1 or 2 Children | 0 (0.0%) | 21 (30.9%) |
| 3 or 4 Children | 0 (0.0%) | 16 (69.6%) |
| 5 or more Children | 0 (0.0%) | 0 (0.0%) |
| Total | 0 (0.0%) | 48 (29.4%) |
Income Below Poverty Among Married-Couple vs Single-Parent Households in Bloomfield
The poverty data for Bloomfield shows that 15 of the married-couple family households (4.3%) and 48 of the single-parent households (21.5%) are living below the poverty level. Within the married-couple family households, those with 3 or 4 children have the highest poverty rate, with 7 households (25.0%) falling below the poverty line. Among the single-parent households, those with 3 or 4 children have the highest poverty rate, with 16 household (42.1%) living below poverty.
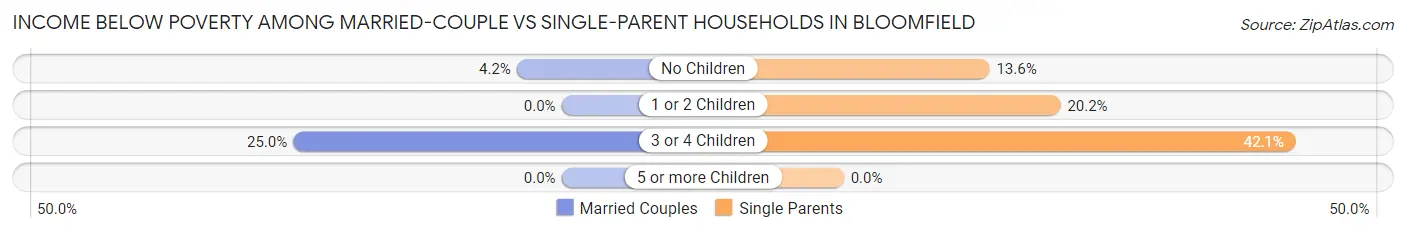
| Children | Married-Couple Families | Single-Parent Households |
| No Children | 8 (4.2%) | 11 (13.6%) |
| 1 or 2 Children | 0 (0.0%) | 21 (20.2%) |
| 3 or 4 Children | 7 (25.0%) | 16 (42.1%) |
| 5 or more Children | 0 (0.0%) | 0 (0.0%) |
| Total | 15 (4.3%) | 48 (21.5%) |
Employment Characteristics in Bloomfield
Employment by Class of Employer in Bloomfield
Among the 883 employed individuals in Bloomfield, private company employees (539 | 61.0%), federal government employees (154 | 17.4%), and not-for-profit organizations (48 | 5.4%) make up the most common classes of employment.
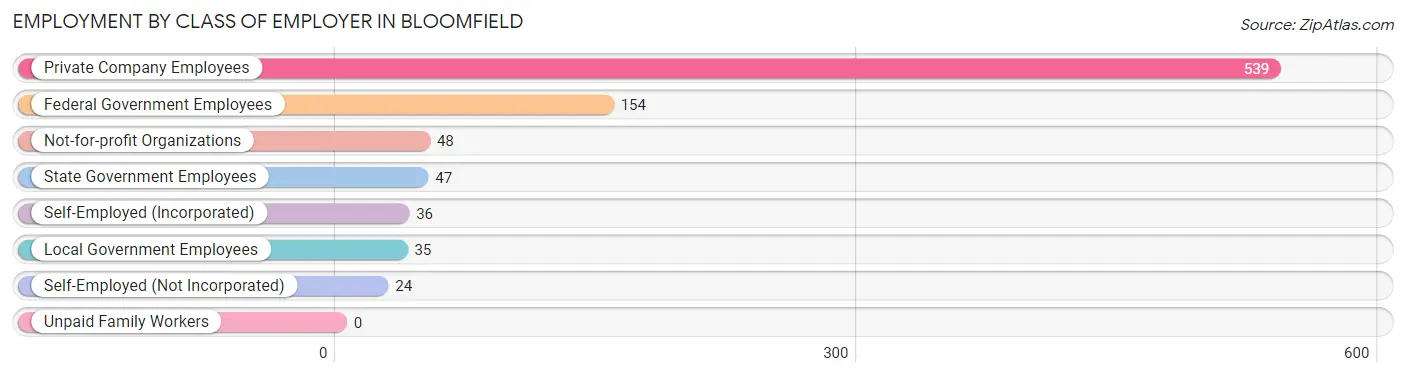
| Employer Class | # Employees | % Employees |
| Private Company Employees | 539 | 61.0% |
| Self-Employed (Incorporated) | 36 | 4.1% |
| Self-Employed (Not Incorporated) | 24 | 2.7% |
| Not-for-profit Organizations | 48 | 5.4% |
| Local Government Employees | 35 | 4.0% |
| State Government Employees | 47 | 5.3% |
| Federal Government Employees | 154 | 17.4% |
| Unpaid Family Workers | 0 | 0.0% |
| Total | 883 | 100.0% |
Employment Status by Age in Bloomfield
According to the labor force statistics for Bloomfield, out of the total population over 16 years of age (1,922), 52.5% or 1,009 individuals are in the labor force, with 9.1% or 92 of them unemployed. The age group with the highest labor force participation rate is 20 to 24 years, with 81.1% or 99 individuals in the labor force. Within the labor force, the 30 to 34 years age range has the highest percentage of unemployed individuals, with 37.5% or 30 of them being unemployed.
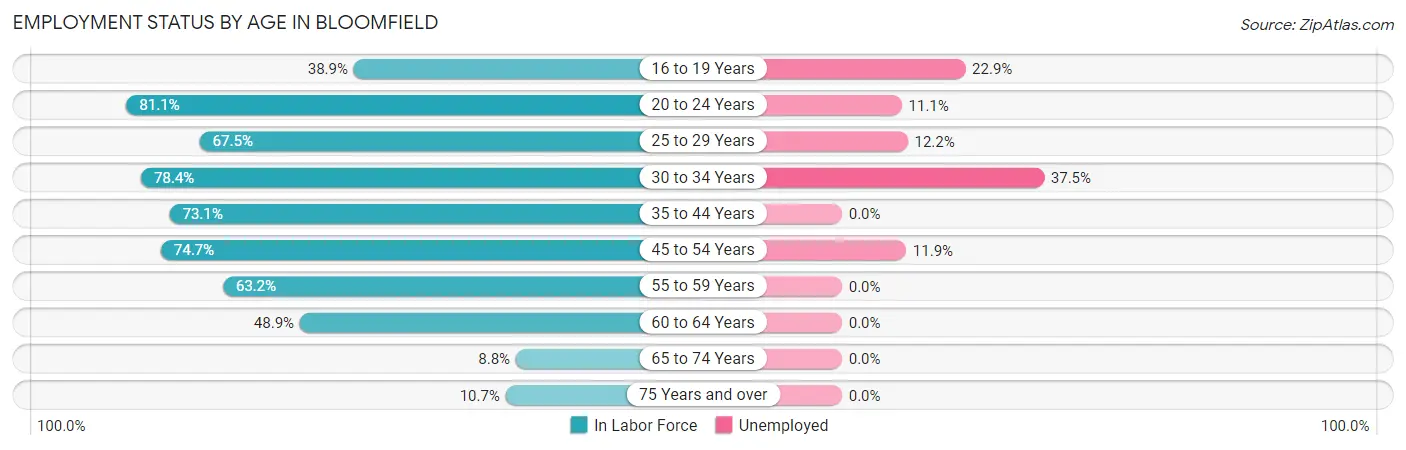
| Age Bracket | In Labor Force | Unemployed |
| 16 to 19 Years | 35 (38.9%) | 8 (22.9%) |
| 20 to 24 Years | 99 (81.1%) | 11 (11.1%) |
| 25 to 29 Years | 131 (67.5%) | 16 (12.2%) |
| 30 to 34 Years | 80 (78.4%) | 30 (37.5%) |
| 35 to 44 Years | 215 (73.1%) | 0 (0.0%) |
| 45 to 54 Years | 227 (74.7%) | 27 (11.9%) |
| 55 to 59 Years | 103 (63.2%) | 0 (0.0%) |
| 60 to 64 Years | 69 (48.9%) | 0 (0.0%) |
| 65 to 74 Years | 22 (8.8%) | 0 (0.0%) |
| 75 Years and over | 28 (10.7%) | 0 (0.0%) |
| Total | 1,009 (52.5%) | 92 (9.1%) |
Employment Status by Educational Attainment in Bloomfield
According to labor force statistics for Bloomfield, 68.9% of individuals (825) out of the total population between 25 and 64 years of age (1,198) are in the labor force, with 8.8% or 73 of them being unemployed. The group with the highest labor force participation rate are those with the educational attainment of college / associate degree, with 83.0% or 357 individuals in the labor force. Within the labor force, individuals with less than high school education have the highest percentage of unemployment, with 76.2% or 16 of them being unemployed.
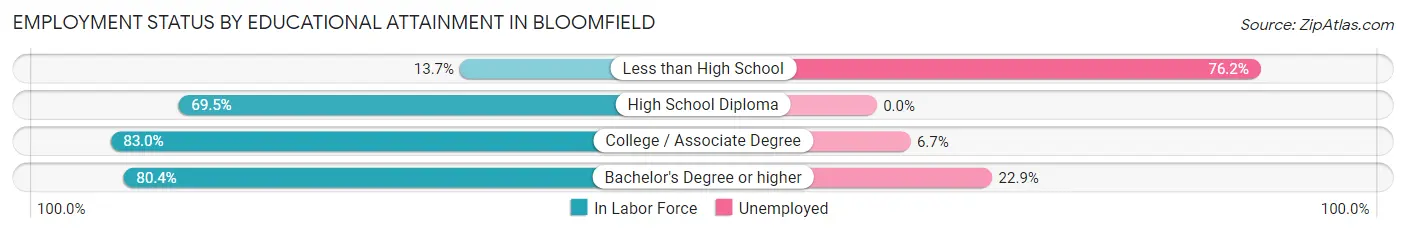
| Educational Attainment | In Labor Force | Unemployed |
| Less than High School | 21 (13.7%) | 117 (76.2%) |
| High School Diploma | 303 (69.5%) | 0 (0.0%) |
| College / Associate Degree | 357 (83.0%) | 29 (6.7%) |
| Bachelor's Degree or higher | 144 (80.4%) | 41 (22.9%) |
| Total | 825 (68.9%) | 105 (8.8%) |
Employment Occupations by Sex in Bloomfield
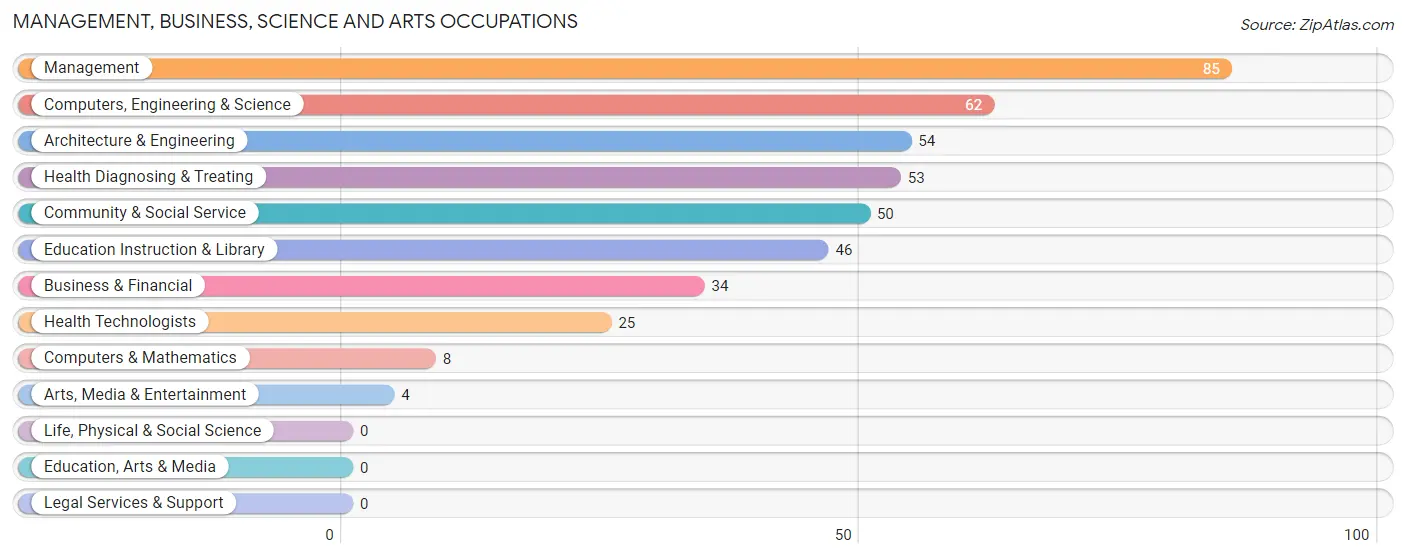
Management, Business, Science and Arts Occupations
The most common Management, Business, Science and Arts occupations in Bloomfield are Management (85 | 9.3%), Computers, Engineering & Science (62 | 6.8%), Architecture & Engineering (54 | 5.9%), Health Diagnosing & Treating (53 | 5.8%), and Community & Social Service (50 | 5.4%).
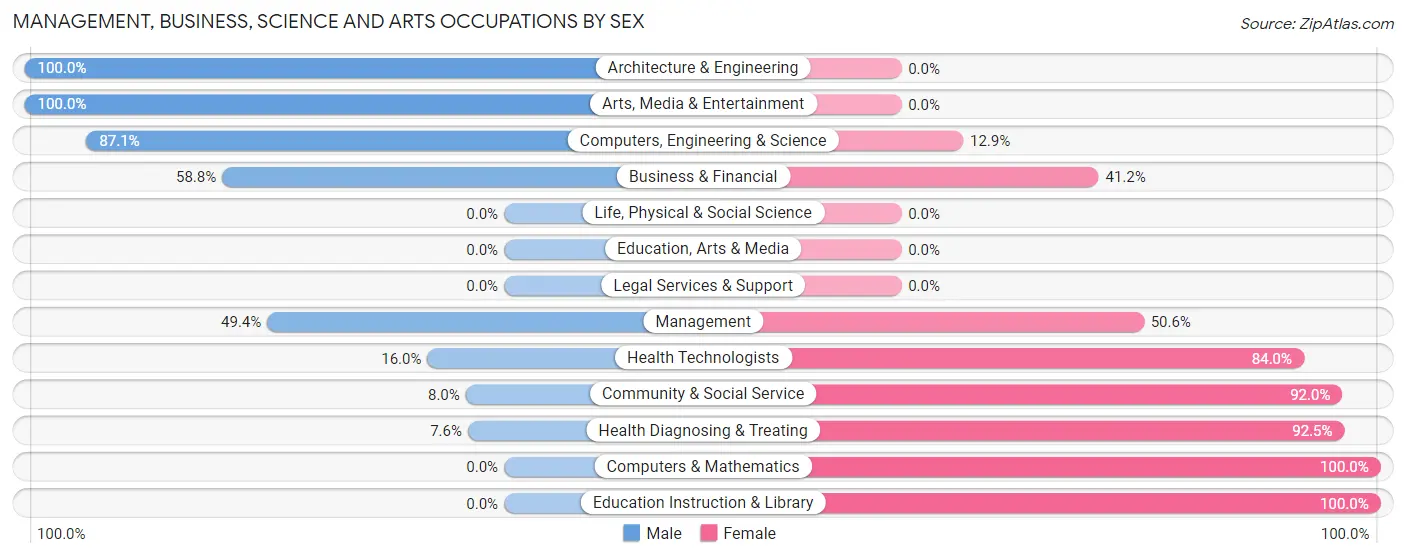
Management, Business, Science and Arts Occupations by Sex
Within the Management, Business, Science and Arts occupations in Bloomfield, the most male-oriented occupations are Architecture & Engineering (100.0%), Arts, Media & Entertainment (100.0%), and Computers, Engineering & Science (87.1%), while the most female-oriented occupations are Computers & Mathematics (100.0%), Education Instruction & Library (100.0%), and Health Diagnosing & Treating (92.4%).
| Occupation | Male | Female |
| Management | 42 (49.4%) | 43 (50.6%) |
| Business & Financial | 20 (58.8%) | 14 (41.2%) |
| Computers, Engineering & Science | 54 (87.1%) | 8 (12.9%) |
| Computers & Mathematics | 0 (0.0%) | 8 (100.0%) |
| Architecture & Engineering | 54 (100.0%) | 0 (0.0%) |
| Life, Physical & Social Science | 0 (0.0%) | 0 (0.0%) |
| Community & Social Service | 4 (8.0%) | 46 (92.0%) |
| Education, Arts & Media | 0 (0.0%) | 0 (0.0%) |
| Legal Services & Support | 0 (0.0%) | 0 (0.0%) |
| Education Instruction & Library | 0 (0.0%) | 46 (100.0%) |
| Arts, Media & Entertainment | 4 (100.0%) | 0 (0.0%) |
| Health Diagnosing & Treating | 4 (7.5%) | 49 (92.4%) |
| Health Technologists | 4 (16.0%) | 21 (84.0%) |
| Total (Category) | 124 (43.7%) | 160 (56.3%) |
| Total (Overall) | 531 (57.9%) | 386 (42.1%) |
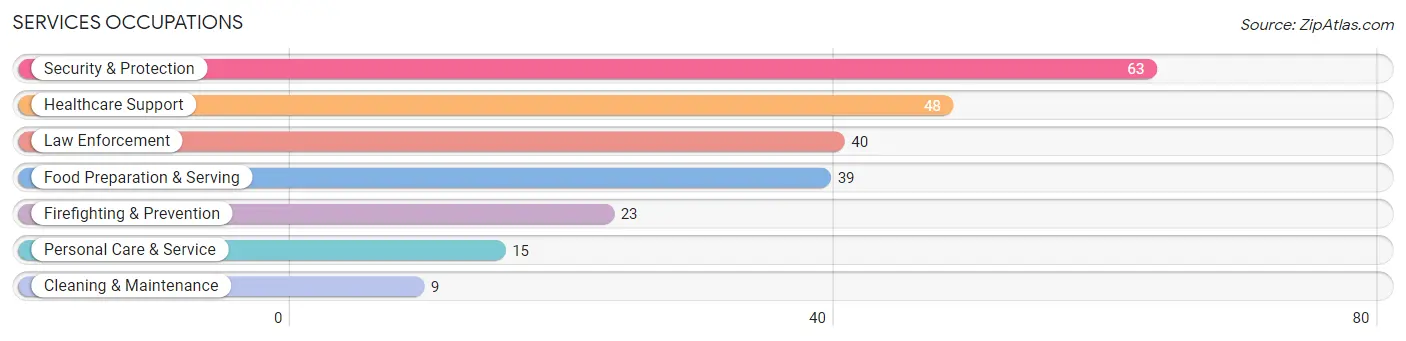
Services Occupations
The most common Services occupations in Bloomfield are Security & Protection (63 | 6.9%), Healthcare Support (48 | 5.2%), Law Enforcement (40 | 4.4%), Food Preparation & Serving (39 | 4.3%), and Firefighting & Prevention (23 | 2.5%).
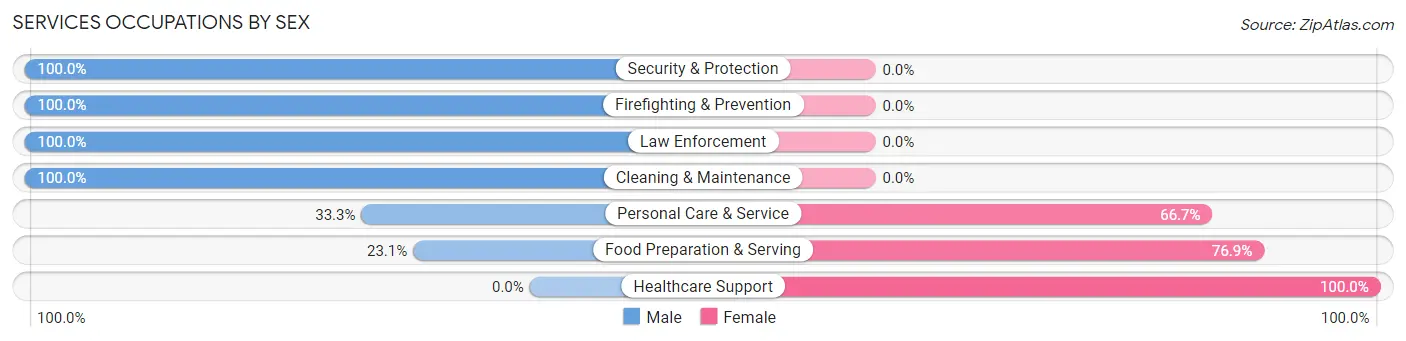
Services Occupations by Sex
Within the Services occupations in Bloomfield, the most male-oriented occupations are Security & Protection (100.0%), Firefighting & Prevention (100.0%), and Law Enforcement (100.0%), while the most female-oriented occupations are Healthcare Support (100.0%), Food Preparation & Serving (76.9%), and Personal Care & Service (66.7%).
| Occupation | Male | Female |
| Healthcare Support | 0 (0.0%) | 48 (100.0%) |
| Security & Protection | 63 (100.0%) | 0 (0.0%) |
| Firefighting & Prevention | 23 (100.0%) | 0 (0.0%) |
| Law Enforcement | 40 (100.0%) | 0 (0.0%) |
| Food Preparation & Serving | 9 (23.1%) | 30 (76.9%) |
| Cleaning & Maintenance | 9 (100.0%) | 0 (0.0%) |
| Personal Care & Service | 5 (33.3%) | 10 (66.7%) |
| Total (Category) | 86 (49.4%) | 88 (50.6%) |
| Total (Overall) | 531 (57.9%) | 386 (42.1%) |
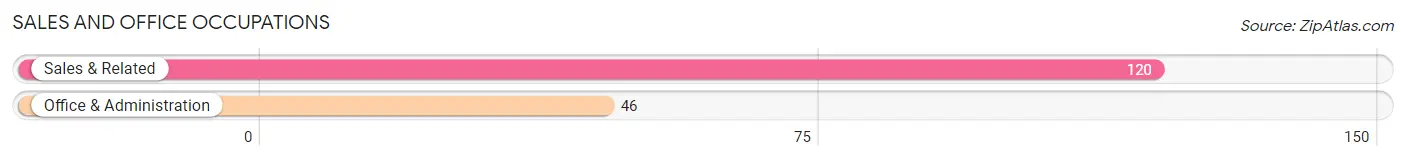
Sales and Office Occupations
The most common Sales and Office occupations in Bloomfield are Sales & Related (120 | 13.1%), and Office & Administration (46 | 5.0%).
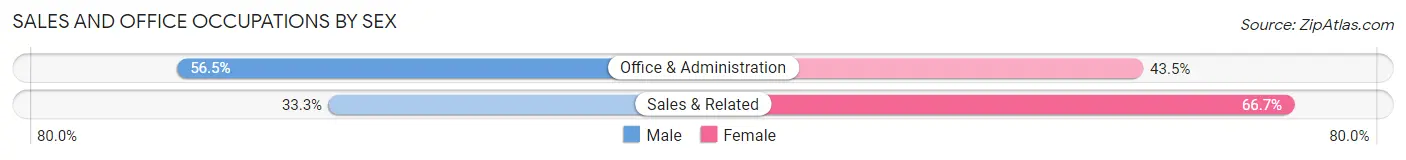
Sales and Office Occupations by Sex
| Occupation | Male | Female |
| Sales & Related | 40 (33.3%) | 80 (66.7%) |
| Office & Administration | 26 (56.5%) | 20 (43.5%) |
| Total (Category) | 66 (39.8%) | 100 (60.2%) |
| Total (Overall) | 531 (57.9%) | 386 (42.1%) |
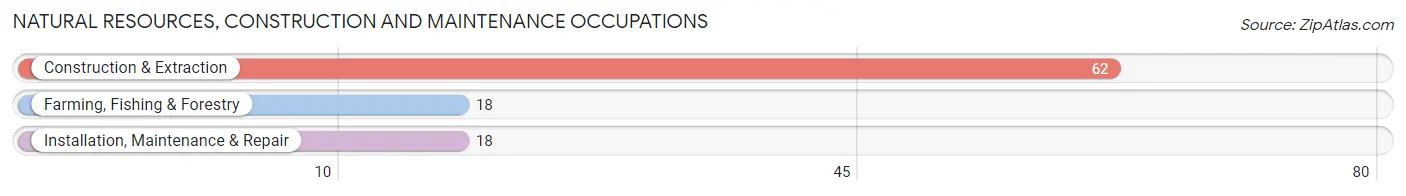
Natural Resources, Construction and Maintenance Occupations
The most common Natural Resources, Construction and Maintenance occupations in Bloomfield are Construction & Extraction (62 | 6.8%), Farming, Fishing & Forestry (18 | 2.0%), and Installation, Maintenance & Repair (18 | 2.0%).
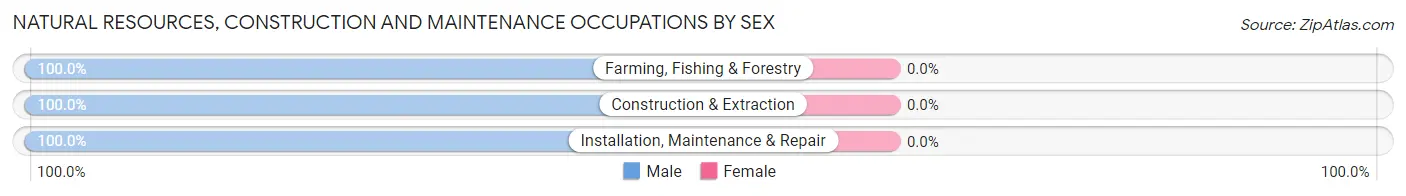
Natural Resources, Construction and Maintenance Occupations by Sex
| Occupation | Male | Female |
| Farming, Fishing & Forestry | 18 (100.0%) | 0 (0.0%) |
| Construction & Extraction | 62 (100.0%) | 0 (0.0%) |
| Installation, Maintenance & Repair | 18 (100.0%) | 0 (0.0%) |
| Total (Category) | 98 (100.0%) | 0 (0.0%) |
| Total (Overall) | 531 (57.9%) | 386 (42.1%) |
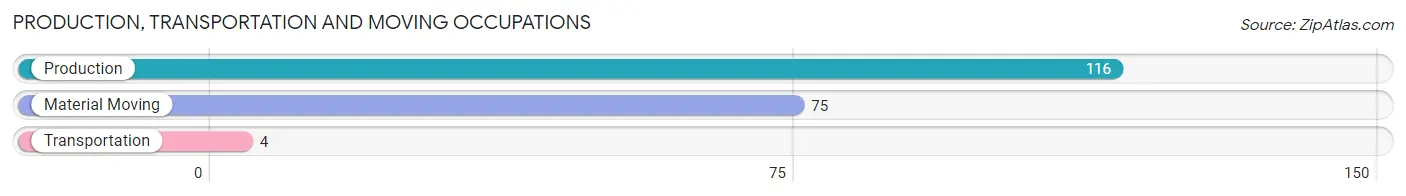
Production, Transportation and Moving Occupations
The most common Production, Transportation and Moving occupations in Bloomfield are Production (116 | 12.7%), Material Moving (75 | 8.2%), and Transportation (4 | 0.4%).
Production, Transportation and Moving Occupations by Sex
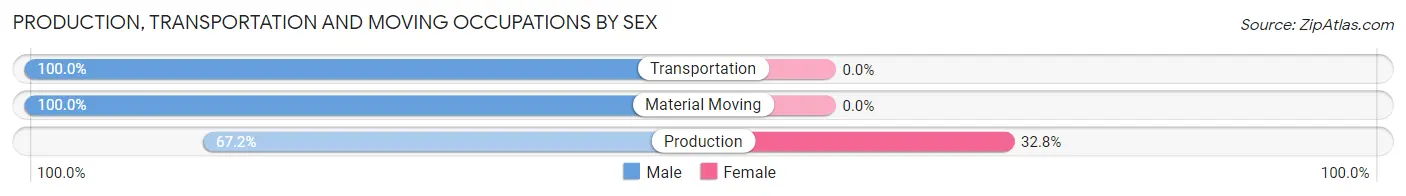
| Occupation | Male | Female |
| Production | 78 (67.2%) | 38 (32.8%) |
| Transportation | 4 (100.0%) | 0 (0.0%) |
| Material Moving | 75 (100.0%) | 0 (0.0%) |
| Total (Category) | 157 (80.5%) | 38 (19.5%) |
| Total (Overall) | 531 (57.9%) | 386 (42.1%) |
Employment Industries by Sex in Bloomfield
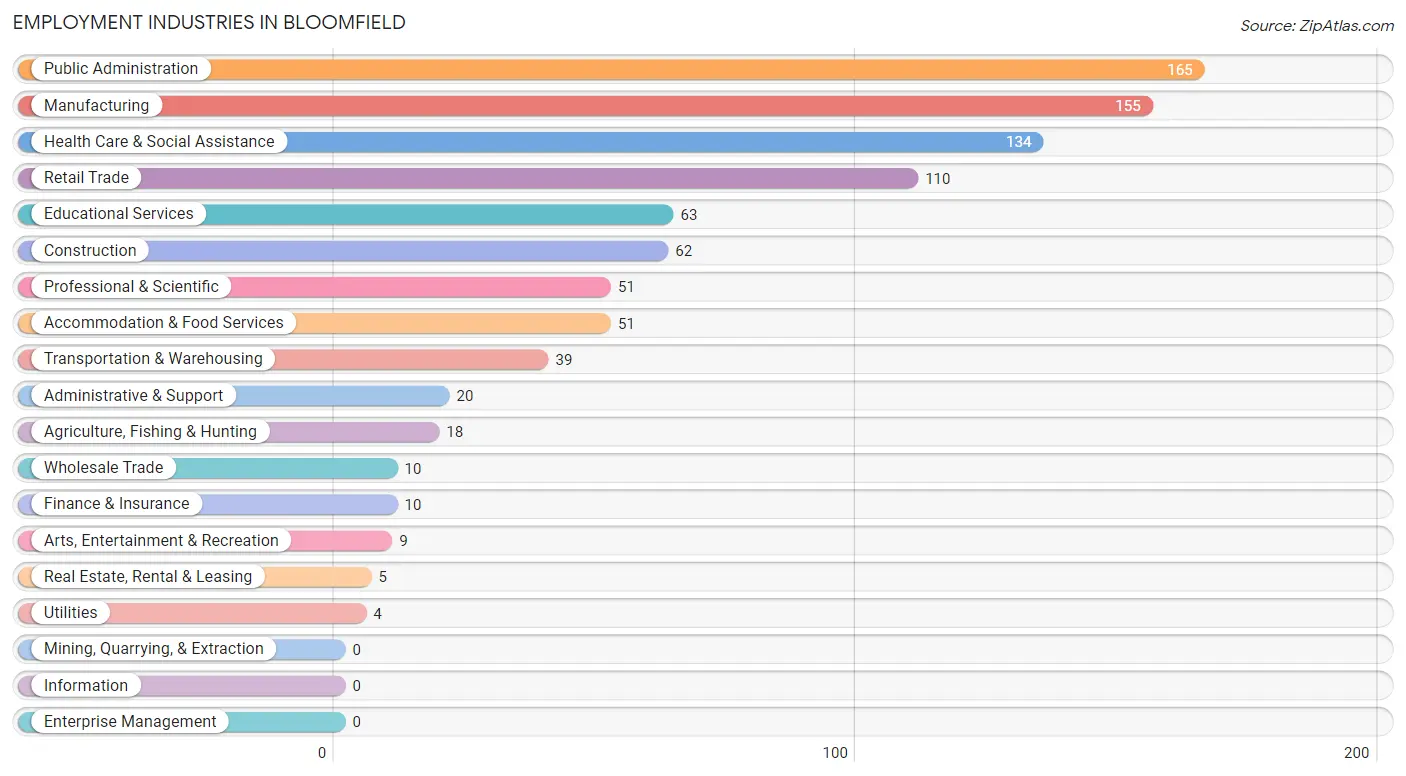
Employment Industries in Bloomfield
The major employment industries in Bloomfield include Public Administration (165 | 18.0%), Manufacturing (155 | 16.9%), Health Care & Social Assistance (134 | 14.6%), Retail Trade (110 | 12.0%), and Educational Services (63 | 6.9%).
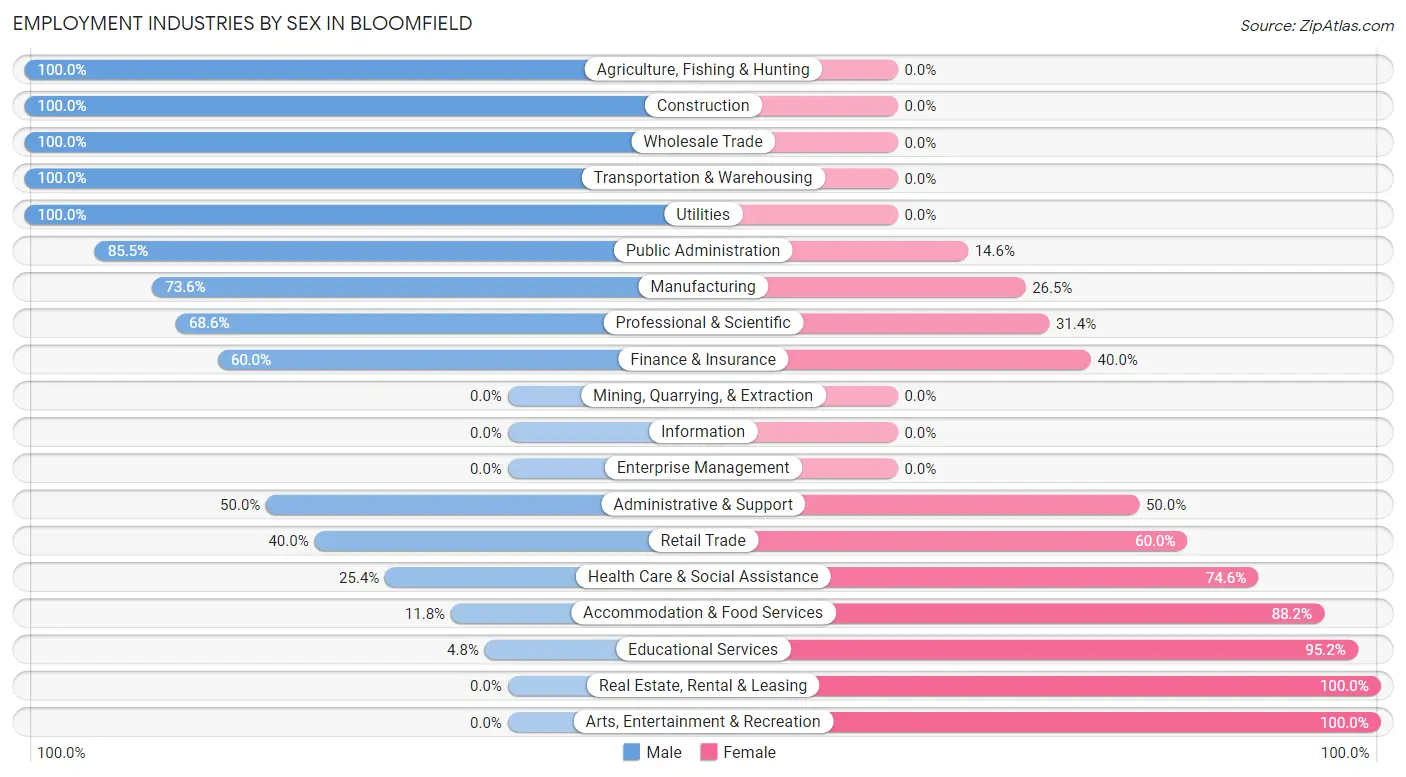
Employment Industries by Sex in Bloomfield
The Bloomfield industries that see more men than women are Agriculture, Fishing & Hunting (100.0%), Construction (100.0%), and Wholesale Trade (100.0%), whereas the industries that tend to have a higher number of women are Real Estate, Rental & Leasing (100.0%), Arts, Entertainment & Recreation (100.0%), and Educational Services (95.2%).
| Industry | Male | Female |
| Agriculture, Fishing & Hunting | 18 (100.0%) | 0 (0.0%) |
| Mining, Quarrying, & Extraction | 0 (0.0%) | 0 (0.0%) |
| Construction | 62 (100.0%) | 0 (0.0%) |
| Manufacturing | 114 (73.6%) | 41 (26.5%) |
| Wholesale Trade | 10 (100.0%) | 0 (0.0%) |
| Retail Trade | 44 (40.0%) | 66 (60.0%) |
| Transportation & Warehousing | 39 (100.0%) | 0 (0.0%) |
| Utilities | 4 (100.0%) | 0 (0.0%) |
| Information | 0 (0.0%) | 0 (0.0%) |
| Finance & Insurance | 6 (60.0%) | 4 (40.0%) |
| Real Estate, Rental & Leasing | 0 (0.0%) | 5 (100.0%) |
| Professional & Scientific | 35 (68.6%) | 16 (31.4%) |
| Enterprise Management | 0 (0.0%) | 0 (0.0%) |
| Administrative & Support | 10 (50.0%) | 10 (50.0%) |
| Educational Services | 3 (4.8%) | 60 (95.2%) |
| Health Care & Social Assistance | 34 (25.4%) | 100 (74.6%) |
| Arts, Entertainment & Recreation | 0 (0.0%) | 9 (100.0%) |
| Accommodation & Food Services | 6 (11.8%) | 45 (88.2%) |
| Public Administration | 141 (85.5%) | 24 (14.5%) |
| Total | 531 (57.9%) | 386 (42.1%) |
Education in Bloomfield
School Enrollment in Bloomfield
The most common levels of schooling among the 452 students in Bloomfield are middle school (123 | 27.2%), elementary school (102 | 22.6%), and high school (102 | 22.6%).
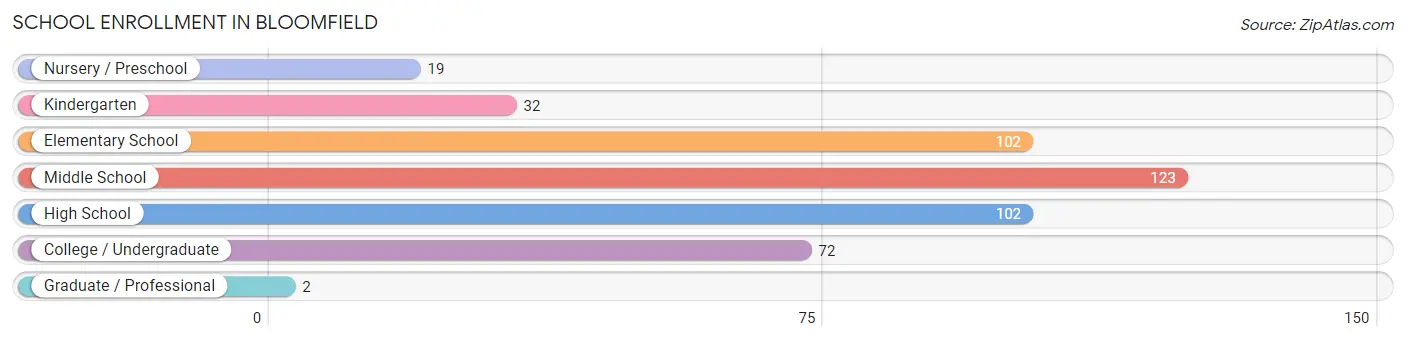
| School Level | # Students | % Students |
| Nursery / Preschool | 19 | 4.2% |
| Kindergarten | 32 | 7.1% |
| Elementary School | 102 | 22.6% |
| Middle School | 123 | 27.2% |
| High School | 102 | 22.6% |
| College / Undergraduate | 72 | 15.9% |
| Graduate / Professional | 2 | 0.4% |
| Total | 452 | 100.0% |
School Enrollment by Age by Funding Source in Bloomfield
Out of a total of 452 students who are enrolled in schools in Bloomfield, 58 (12.8%) attend a private institution, while the remaining 394 (87.2%) are enrolled in public schools. The age group of 35 years and over has the highest likelihood of being enrolled in private schools, with 7 (36.8% in the age bracket) enrolled. Conversely, the age group of 3 to 4 year olds has the lowest likelihood of being enrolled in a private school, with 13 (100.0% in the age bracket) attending a public institution.
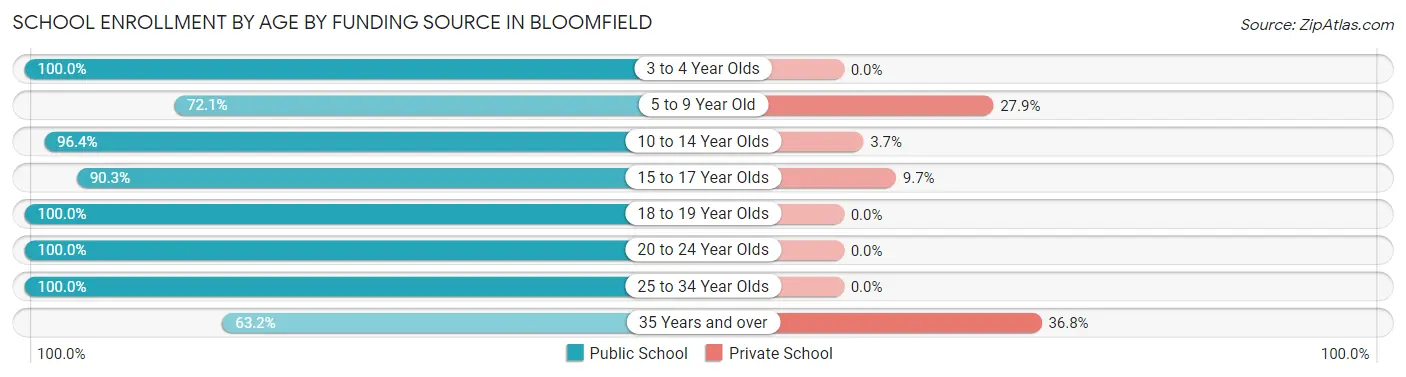
| Age Bracket | Public School | Private School |
| 3 to 4 Year Olds | 13 (100.0%) | 0 (0.0%) |
| 5 to 9 Year Old | 101 (72.1%) | 39 (27.9%) |
| 10 to 14 Year Olds | 132 (96.4%) | 5 (3.6%) |
| 15 to 17 Year Olds | 65 (90.3%) | 7 (9.7%) |
| 18 to 19 Year Olds | 22 (100.0%) | 0 (0.0%) |
| 20 to 24 Year Olds | 24 (100.0%) | 0 (0.0%) |
| 25 to 34 Year Olds | 25 (100.0%) | 0 (0.0%) |
| 35 Years and over | 12 (63.2%) | 7 (36.8%) |
| Total | 394 (87.2%) | 58 (12.8%) |
Educational Attainment by Field of Study in Bloomfield
Arts & humanities (56 | 21.7%), business (46 | 17.8%), education (31 | 12.0%), science & technology (26 | 10.1%), and psychology (23 | 8.9%) are the most common fields of study among 258 individuals in Bloomfield who have obtained a bachelor's degree or higher.
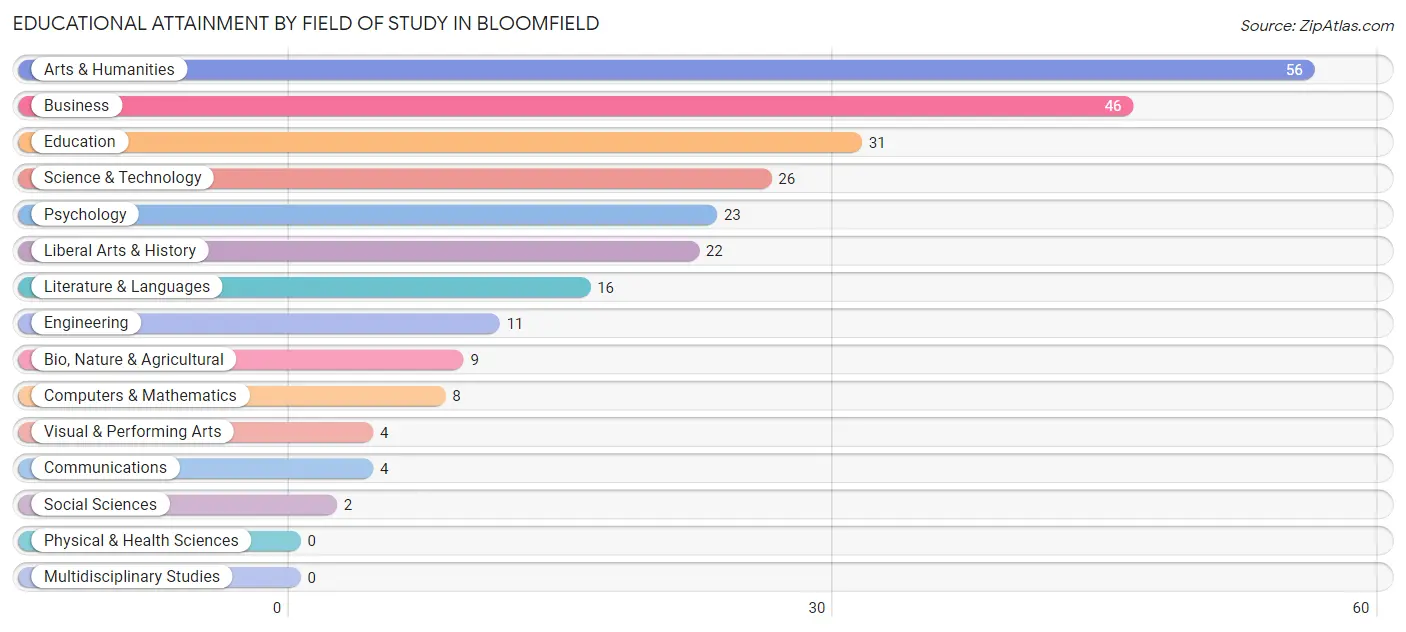
| Field of Study | # Graduates | % Graduates |
| Computers & Mathematics | 8 | 3.1% |
| Bio, Nature & Agricultural | 9 | 3.5% |
| Physical & Health Sciences | 0 | 0.0% |
| Psychology | 23 | 8.9% |
| Social Sciences | 2 | 0.8% |
| Engineering | 11 | 4.3% |
| Multidisciplinary Studies | 0 | 0.0% |
| Science & Technology | 26 | 10.1% |
| Business | 46 | 17.8% |
| Education | 31 | 12.0% |
| Literature & Languages | 16 | 6.2% |
| Liberal Arts & History | 22 | 8.5% |
| Visual & Performing Arts | 4 | 1.5% |
| Communications | 4 | 1.5% |
| Arts & Humanities | 56 | 21.7% |
| Total | 258 | 100.0% |
Transportation & Commute in Bloomfield
Vehicle Availability by Sex in Bloomfield
The most prevalent vehicle ownership categories in Bloomfield are males with 2 vehicles (239, accounting for 45.4%) and females with 2 vehicles (220, making up 66.9%).
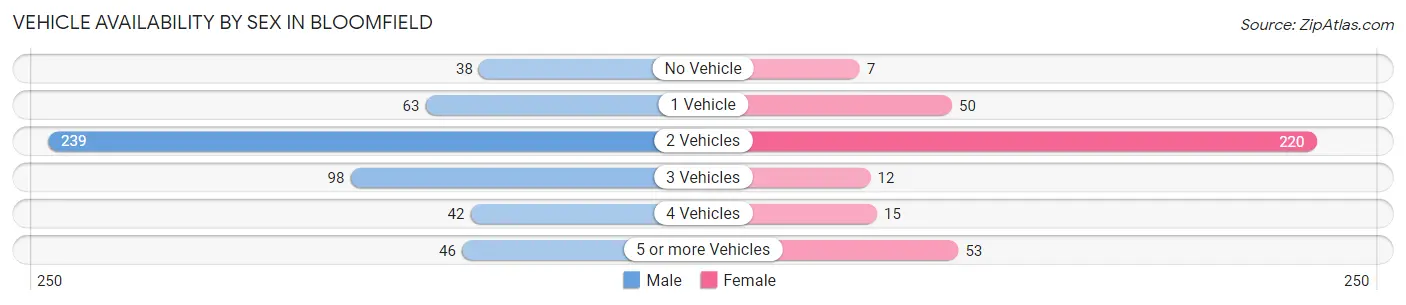
| Vehicles Available | Male | Female |
| No Vehicle | 38 (7.2%) | 7 (2.0%) |
| 1 Vehicle | 63 (12.0%) | 50 (14.0%) |
| 2 Vehicles | 239 (45.4%) | 220 (61.6%) |
| 3 Vehicles | 98 (18.6%) | 12 (3.4%) |
| 4 Vehicles | 42 (8.0%) | 15 (4.2%) |
| 5 or more Vehicles | 46 (8.7%) | 53 (14.8%) |
| Total | 526 (100.0%) | 357 (100.0%) |
Commute Time in Bloomfield
The most frequently occuring commute durations in Bloomfield are 20 to 24 minutes (170 commuters, 19.7%), 5 to 9 minutes (121 commuters, 14.0%), and 45 to 59 minutes (93 commuters, 10.8%).
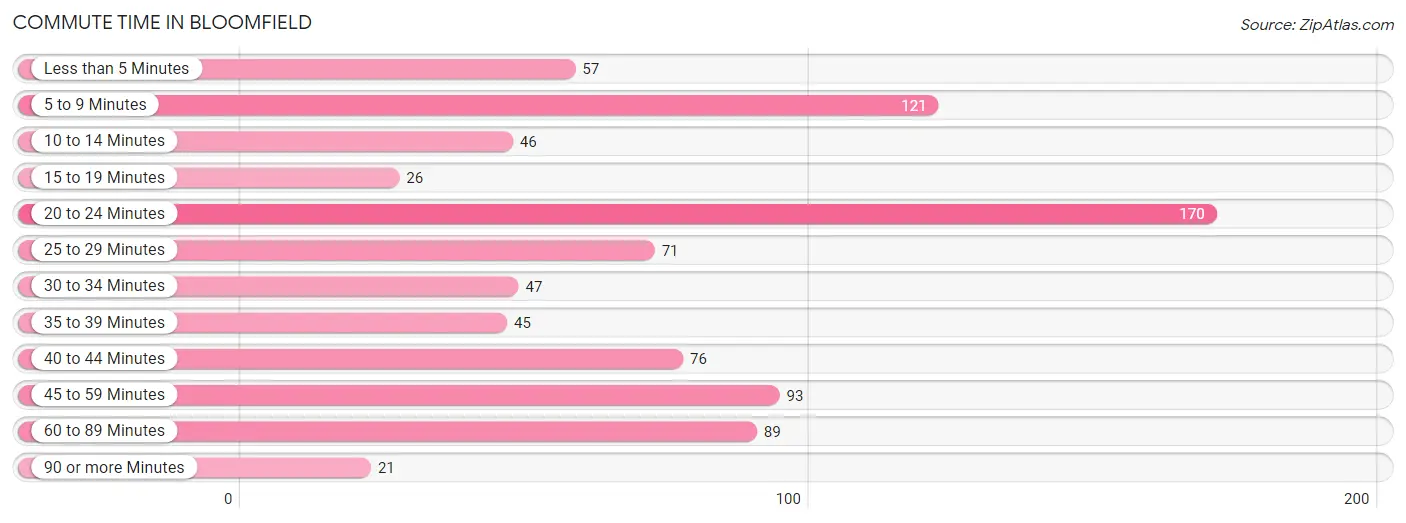
| Commute Time | # Commuters | % Commuters |
| Less than 5 Minutes | 57 | 6.6% |
| 5 to 9 Minutes | 121 | 14.0% |
| 10 to 14 Minutes | 46 | 5.3% |
| 15 to 19 Minutes | 26 | 3.0% |
| 20 to 24 Minutes | 170 | 19.7% |
| 25 to 29 Minutes | 71 | 8.2% |
| 30 to 34 Minutes | 47 | 5.4% |
| 35 to 39 Minutes | 45 | 5.2% |
| 40 to 44 Minutes | 76 | 8.8% |
| 45 to 59 Minutes | 93 | 10.8% |
| 60 to 89 Minutes | 89 | 10.3% |
| 90 or more Minutes | 21 | 2.4% |
Commute Time by Sex in Bloomfield
The most common commute times in Bloomfield are 20 to 24 minutes (113 commuters, 21.5%) for males and 5 to 9 minutes (77 commuters, 22.9%) for females.
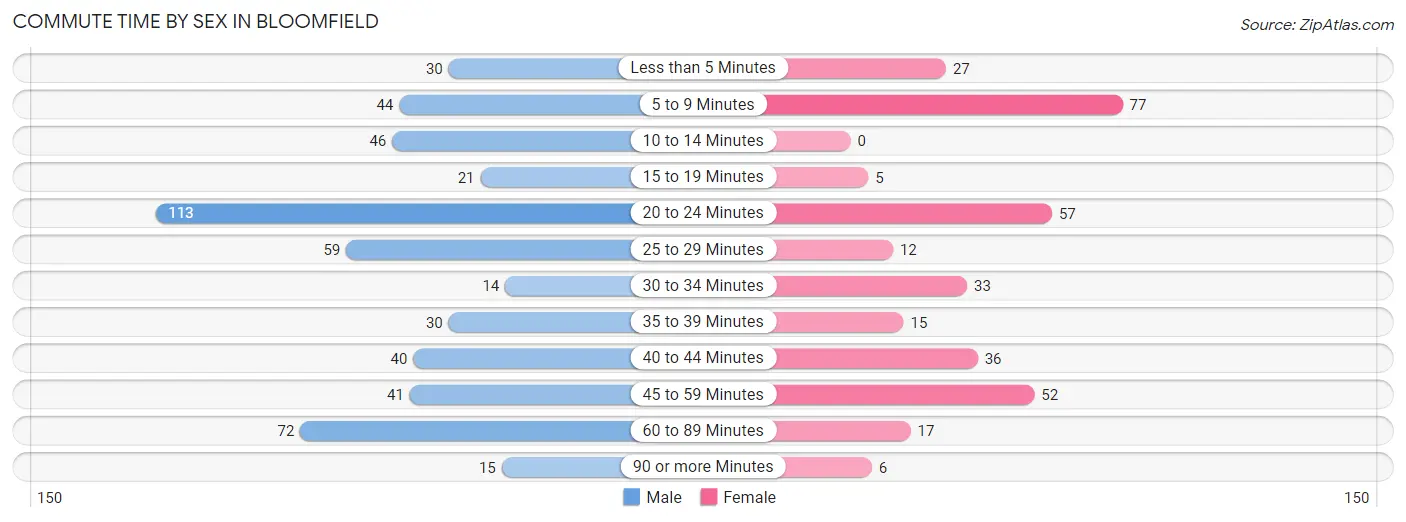
| Commute Time | Male | Female |
| Less than 5 Minutes | 30 (5.7%) | 27 (8.0%) |
| 5 to 9 Minutes | 44 (8.4%) | 77 (22.9%) |
| 10 to 14 Minutes | 46 (8.8%) | 0 (0.0%) |
| 15 to 19 Minutes | 21 (4.0%) | 5 (1.5%) |
| 20 to 24 Minutes | 113 (21.5%) | 57 (16.9%) |
| 25 to 29 Minutes | 59 (11.2%) | 12 (3.6%) |
| 30 to 34 Minutes | 14 (2.7%) | 33 (9.8%) |
| 35 to 39 Minutes | 30 (5.7%) | 15 (4.4%) |
| 40 to 44 Minutes | 40 (7.6%) | 36 (10.7%) |
| 45 to 59 Minutes | 41 (7.8%) | 52 (15.4%) |
| 60 to 89 Minutes | 72 (13.7%) | 17 (5.0%) |
| 90 or more Minutes | 15 (2.9%) | 6 (1.8%) |
Time of Departure to Work by Sex in Bloomfield
The most frequent times of departure to work in Bloomfield are 6:00 AM to 6:29 AM (175, 33.3%) for males and 6:00 AM to 6:29 AM (67, 19.9%) for females.
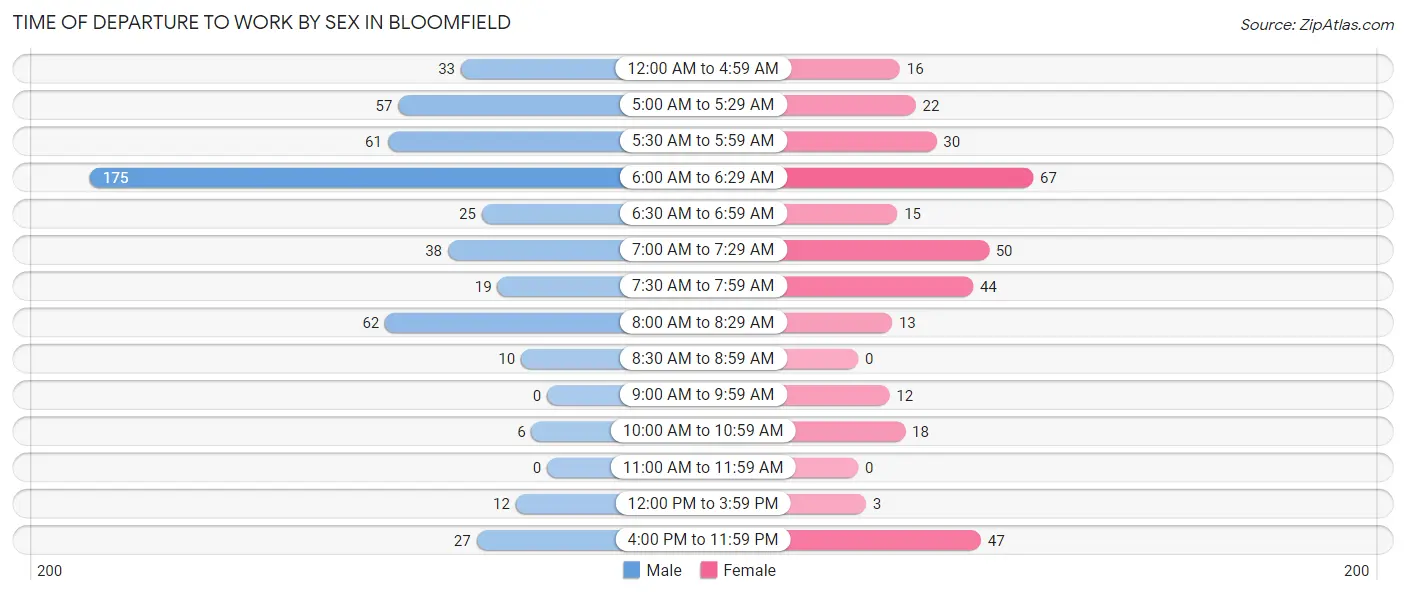
| Time of Departure | Male | Female |
| 12:00 AM to 4:59 AM | 33 (6.3%) | 16 (4.8%) |
| 5:00 AM to 5:29 AM | 57 (10.9%) | 22 (6.5%) |
| 5:30 AM to 5:59 AM | 61 (11.6%) | 30 (8.9%) |
| 6:00 AM to 6:29 AM | 175 (33.3%) | 67 (19.9%) |
| 6:30 AM to 6:59 AM | 25 (4.8%) | 15 (4.4%) |
| 7:00 AM to 7:29 AM | 38 (7.2%) | 50 (14.8%) |
| 7:30 AM to 7:59 AM | 19 (3.6%) | 44 (13.1%) |
| 8:00 AM to 8:29 AM | 62 (11.8%) | 13 (3.9%) |
| 8:30 AM to 8:59 AM | 10 (1.9%) | 0 (0.0%) |
| 9:00 AM to 9:59 AM | 0 (0.0%) | 12 (3.6%) |
| 10:00 AM to 10:59 AM | 6 (1.1%) | 18 (5.3%) |
| 11:00 AM to 11:59 AM | 0 (0.0%) | 0 (0.0%) |
| 12:00 PM to 3:59 PM | 12 (2.3%) | 3 (0.9%) |
| 4:00 PM to 11:59 PM | 27 (5.1%) | 47 (14.0%) |
| Total | 525 (100.0%) | 337 (100.0%) |
Housing Occupancy in Bloomfield
Occupancy by Ownership in Bloomfield
Of the total 996 dwellings in Bloomfield, owner-occupied units account for 634 (63.6%), while renter-occupied units make up 362 (36.3%).
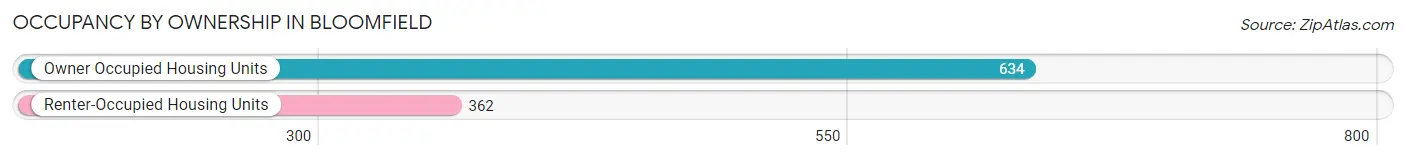
| Occupancy | # Housing Units | % Housing Units |
| Owner Occupied Housing Units | 634 | 63.6% |
| Renter-Occupied Housing Units | 362 | 36.3% |
| Total Occupied Housing Units | 996 | 100.0% |
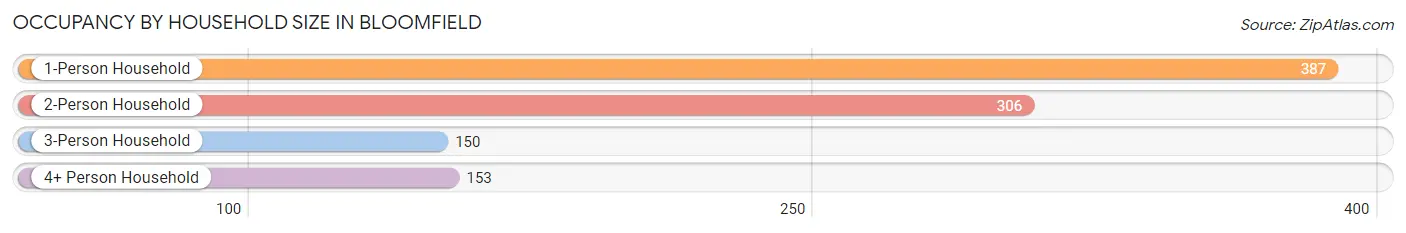
Occupancy by Household Size in Bloomfield
| Household Size | # Housing Units | % Housing Units |
| 1-Person Household | 387 | 38.9% |
| 2-Person Household | 306 | 30.7% |
| 3-Person Household | 150 | 15.1% |
| 4+ Person Household | 153 | 15.4% |
| Total Housing Units | 996 | 100.0% |
Occupancy by Ownership by Household Size in Bloomfield
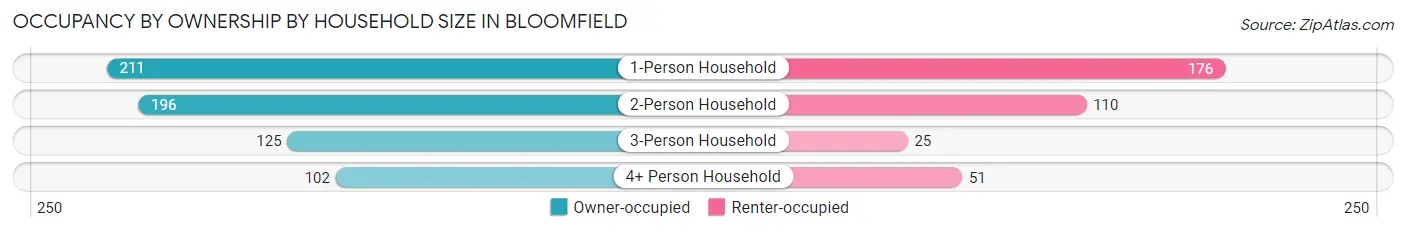
| Household Size | Owner-occupied | Renter-occupied |
| 1-Person Household | 211 (54.5%) | 176 (45.5%) |
| 2-Person Household | 196 (64.0%) | 110 (35.9%) |
| 3-Person Household | 125 (83.3%) | 25 (16.7%) |
| 4+ Person Household | 102 (66.7%) | 51 (33.3%) |
| Total Housing Units | 634 (63.6%) | 362 (36.3%) |
Occupancy by Educational Attainment in Bloomfield
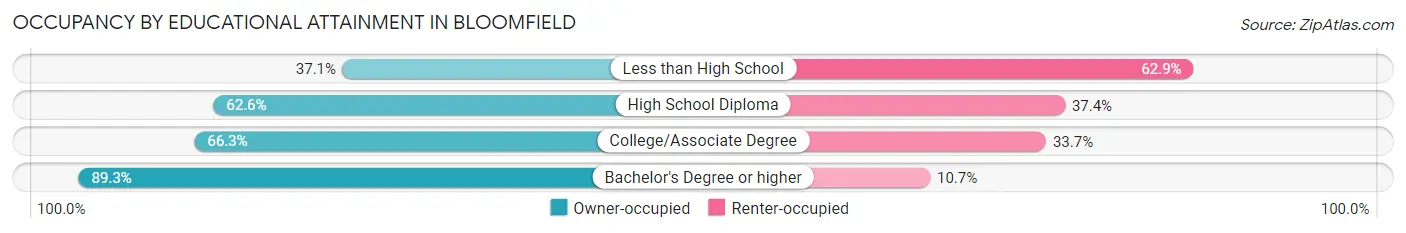
| Household Size | Owner-occupied | Renter-occupied |
| Less than High School | 46 (37.1%) | 78 (62.9%) |
| High School Diploma | 234 (62.6%) | 140 (37.4%) |
| College/Associate Degree | 262 (66.3%) | 133 (33.7%) |
| Bachelor's Degree or higher | 92 (89.3%) | 11 (10.7%) |
Occupancy by Age of Householder in Bloomfield
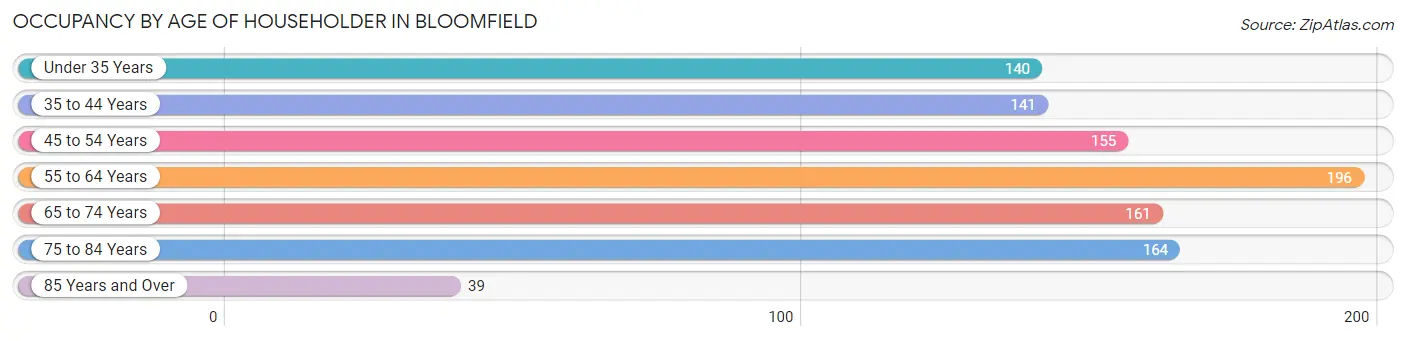
| Age Bracket | # Households | % Households |
| Under 35 Years | 140 | 14.1% |
| 35 to 44 Years | 141 | 14.2% |
| 45 to 54 Years | 155 | 15.6% |
| 55 to 64 Years | 196 | 19.7% |
| 65 to 74 Years | 161 | 16.2% |
| 75 to 84 Years | 164 | 16.5% |
| 85 Years and Over | 39 | 3.9% |
| Total | 996 | 100.0% |
Housing Finances in Bloomfield
Median Income by Occupancy in Bloomfield
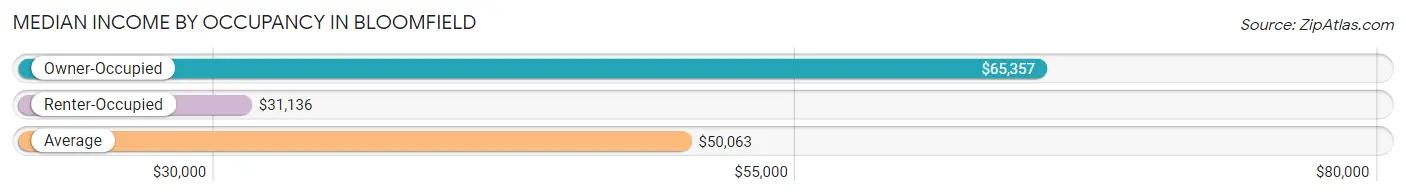
| Occupancy Type | # Households | Median Income |
| Owner-Occupied | 634 (63.6%) | $65,357 |
| Renter-Occupied | 362 (36.3%) | $31,136 |
| Average | 996 (100.0%) | $50,063 |
Occupancy by Householder Income Bracket in Bloomfield
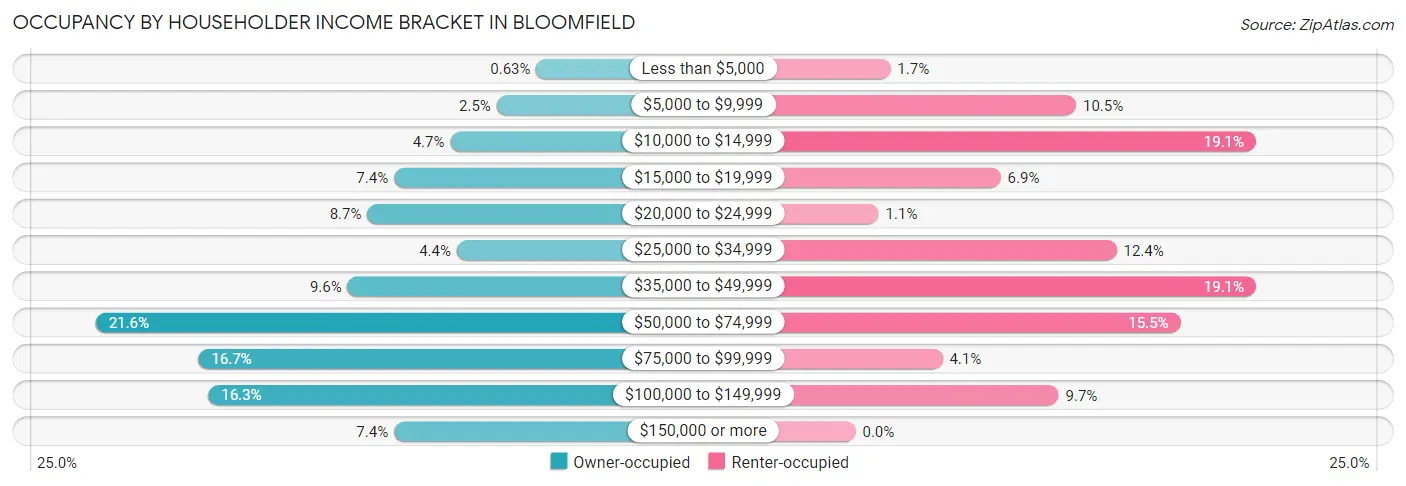
| Income Bracket | Owner-occupied | Renter-occupied |
| Less than $5,000 | 4 (0.6%) | 6 (1.7%) |
| $5,000 to $9,999 | 16 (2.5%) | 38 (10.5%) |
| $10,000 to $14,999 | 30 (4.7%) | 69 (19.1%) |
| $15,000 to $19,999 | 47 (7.4%) | 25 (6.9%) |
| $20,000 to $24,999 | 55 (8.7%) | 4 (1.1%) |
| $25,000 to $34,999 | 28 (4.4%) | 45 (12.4%) |
| $35,000 to $49,999 | 61 (9.6%) | 69 (19.1%) |
| $50,000 to $74,999 | 137 (21.6%) | 56 (15.5%) |
| $75,000 to $99,999 | 106 (16.7%) | 15 (4.1%) |
| $100,000 to $149,999 | 103 (16.3%) | 35 (9.7%) |
| $150,000 or more | 47 (7.4%) | 0 (0.0%) |
| Total | 634 (100.0%) | 362 (100.0%) |
Monthly Housing Cost Tiers in Bloomfield
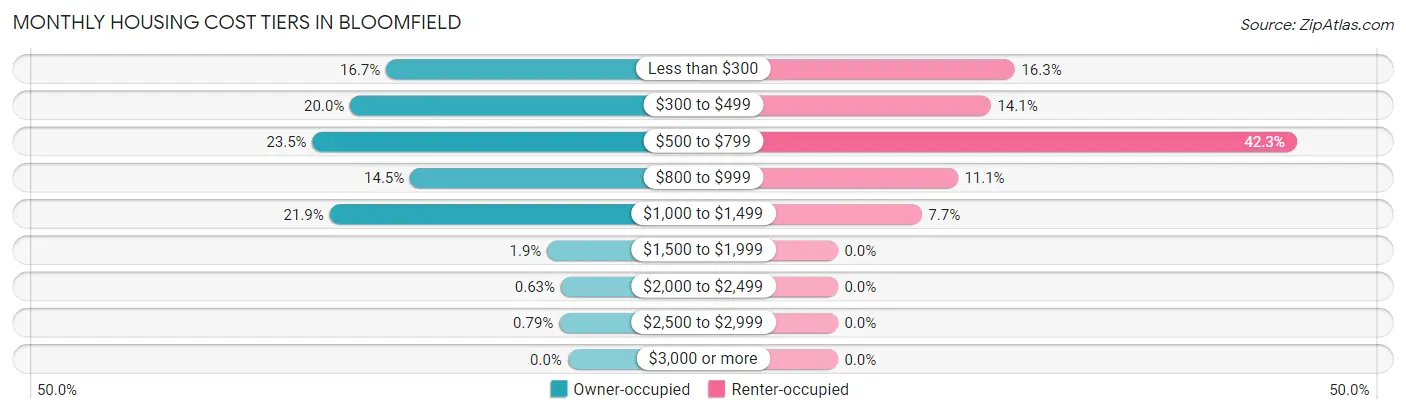
| Monthly Cost | Owner-occupied | Renter-occupied |
| Less than $300 | 106 (16.7%) | 59 (16.3%) |
| $300 to $499 | 127 (20.0%) | 51 (14.1%) |
| $500 to $799 | 149 (23.5%) | 153 (42.3%) |
| $800 to $999 | 92 (14.5%) | 40 (11.1%) |
| $1,000 to $1,499 | 139 (21.9%) | 28 (7.7%) |
| $1,500 to $1,999 | 12 (1.9%) | 0 (0.0%) |
| $2,000 to $2,499 | 4 (0.6%) | 0 (0.0%) |
| $2,500 to $2,999 | 5 (0.8%) | 0 (0.0%) |
| $3,000 or more | 0 (0.0%) | 0 (0.0%) |
| Total | 634 (100.0%) | 362 (100.0%) |
Physical Housing Characteristics in Bloomfield
Housing Structures in Bloomfield
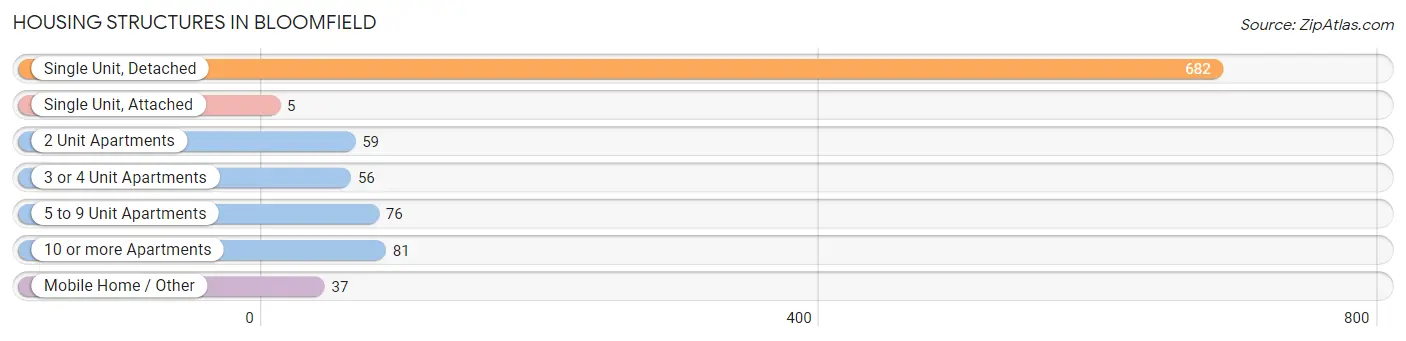
| Structure Type | # Housing Units | % Housing Units |
| Single Unit, Detached | 682 | 68.5% |
| Single Unit, Attached | 5 | 0.5% |
| 2 Unit Apartments | 59 | 5.9% |
| 3 or 4 Unit Apartments | 56 | 5.6% |
| 5 to 9 Unit Apartments | 76 | 7.6% |
| 10 or more Apartments | 81 | 8.1% |
| Mobile Home / Other | 37 | 3.7% |
| Total | 996 | 100.0% |
Housing Structures by Occupancy in Bloomfield
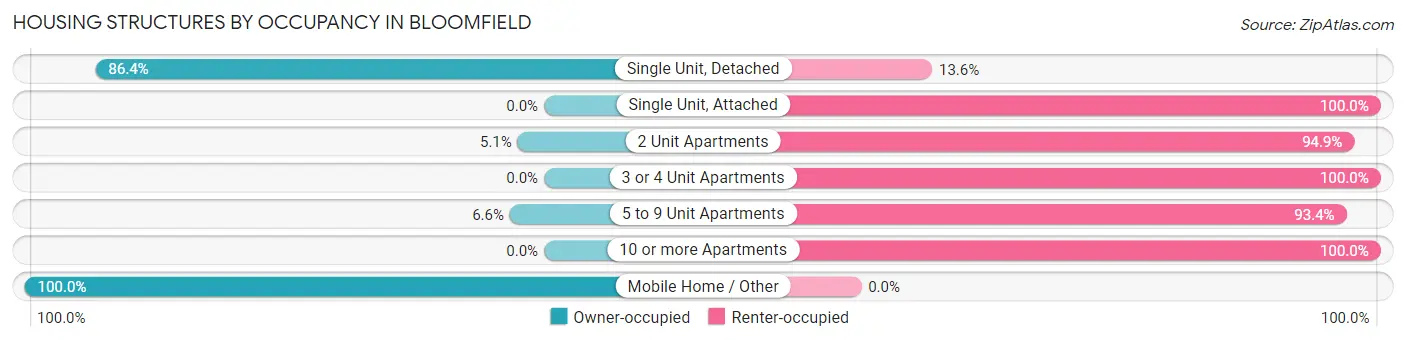
| Structure Type | Owner-occupied | Renter-occupied |
| Single Unit, Detached | 589 (86.4%) | 93 (13.6%) |
| Single Unit, Attached | 0 (0.0%) | 5 (100.0%) |
| 2 Unit Apartments | 3 (5.1%) | 56 (94.9%) |
| 3 or 4 Unit Apartments | 0 (0.0%) | 56 (100.0%) |
| 5 to 9 Unit Apartments | 5 (6.6%) | 71 (93.4%) |
| 10 or more Apartments | 0 (0.0%) | 81 (100.0%) |
| Mobile Home / Other | 37 (100.0%) | 0 (0.0%) |
| Total | 634 (63.6%) | 362 (36.3%) |
Housing Structures by Number of Rooms in Bloomfield
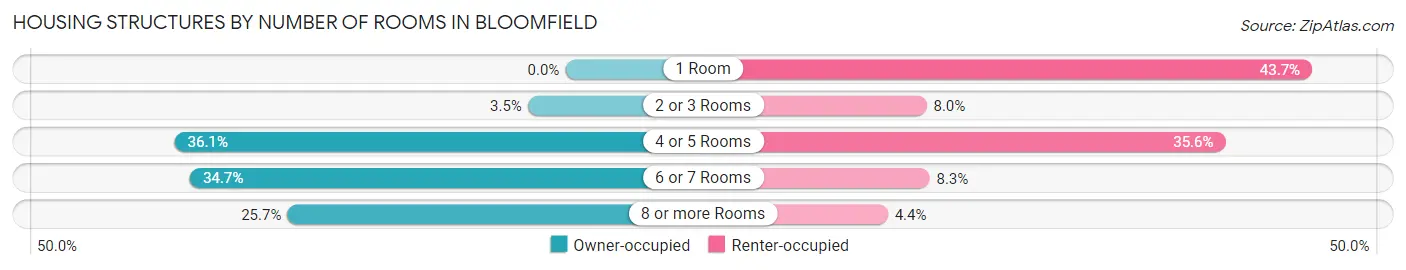
| Number of Rooms | Owner-occupied | Renter-occupied |
| 1 Room | 0 (0.0%) | 158 (43.6%) |
| 2 or 3 Rooms | 22 (3.5%) | 29 (8.0%) |
| 4 or 5 Rooms | 229 (36.1%) | 129 (35.6%) |
| 6 or 7 Rooms | 220 (34.7%) | 30 (8.3%) |
| 8 or more Rooms | 163 (25.7%) | 16 (4.4%) |
| Total | 634 (100.0%) | 362 (100.0%) |
Housing Structure by Heating Type in Bloomfield
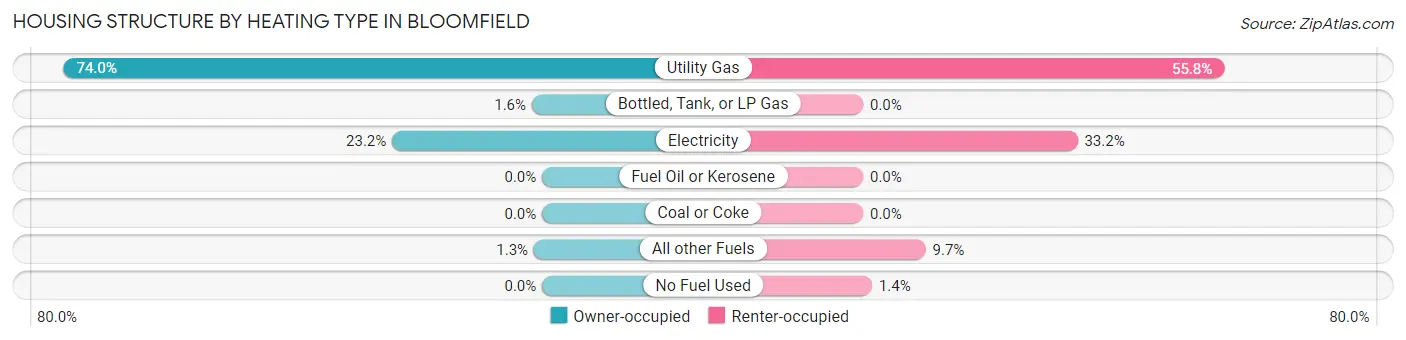
| Heating Type | Owner-occupied | Renter-occupied |
| Utility Gas | 469 (74.0%) | 202 (55.8%) |
| Bottled, Tank, or LP Gas | 10 (1.6%) | 0 (0.0%) |
| Electricity | 147 (23.2%) | 120 (33.2%) |
| Fuel Oil or Kerosene | 0 (0.0%) | 0 (0.0%) |
| Coal or Coke | 0 (0.0%) | 0 (0.0%) |
| All other Fuels | 8 (1.3%) | 35 (9.7%) |
| No Fuel Used | 0 (0.0%) | 5 (1.4%) |
| Total | 634 (100.0%) | 362 (100.0%) |
Household Vehicle Usage in Bloomfield
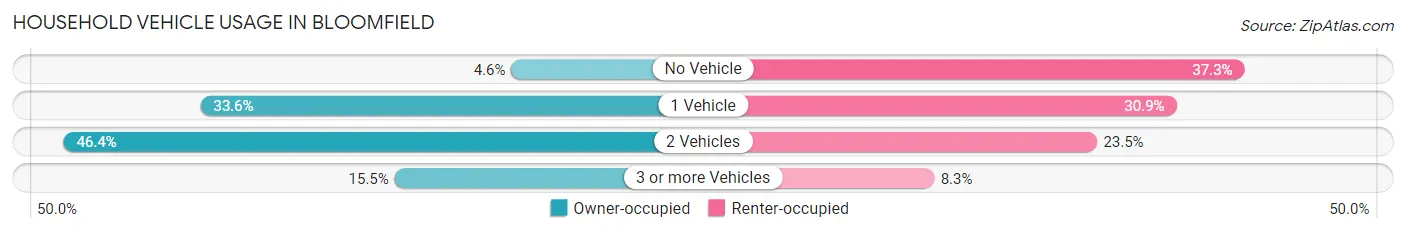
| Vehicles per Household | Owner-occupied | Renter-occupied |
| No Vehicle | 29 (4.6%) | 135 (37.3%) |
| 1 Vehicle | 213 (33.6%) | 112 (30.9%) |
| 2 Vehicles | 294 (46.4%) | 85 (23.5%) |
| 3 or more Vehicles | 98 (15.5%) | 30 (8.3%) |
| Total | 634 (100.0%) | 362 (100.0%) |
Real Estate & Mortgages in Bloomfield
Real Estate and Mortgage Overview in Bloomfield
| Characteristic | Without Mortgage | With Mortgage |
| Housing Units | 276 | 358 |
| Median Property Value | $92,000 | $109,300 |
| Median Household Income | $46,964 | $43 |
| Monthly Housing Costs | $357 | $0 |
| Real Estate Taxes | $475 | $4 |
Property Value by Mortgage Status in Bloomfield
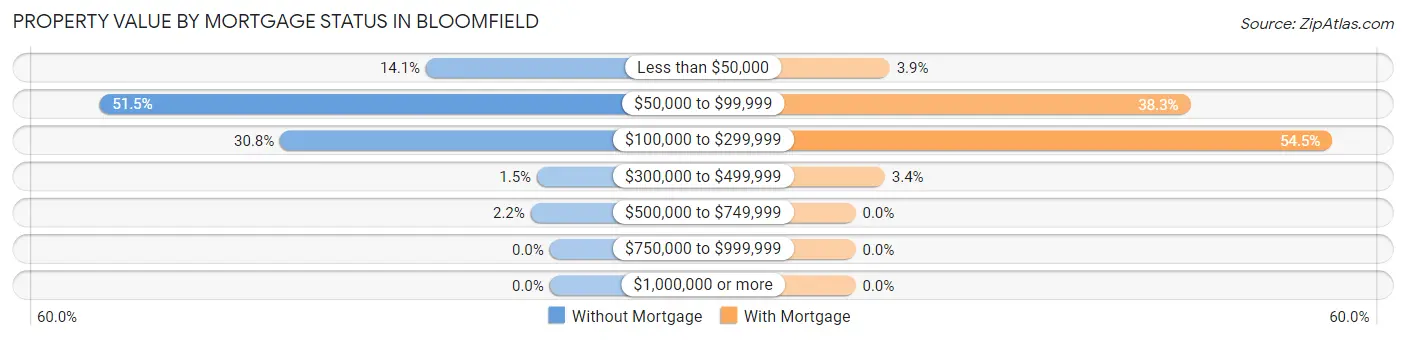
| Property Value | Without Mortgage | With Mortgage |
| Less than $50,000 | 39 (14.1%) | 14 (3.9%) |
| $50,000 to $99,999 | 142 (51.4%) | 137 (38.3%) |
| $100,000 to $299,999 | 85 (30.8%) | 195 (54.5%) |
| $300,000 to $499,999 | 4 (1.5%) | 12 (3.4%) |
| $500,000 to $749,999 | 6 (2.2%) | 0 (0.0%) |
| $750,000 to $999,999 | 0 (0.0%) | 0 (0.0%) |
| $1,000,000 or more | 0 (0.0%) | 0 (0.0%) |
| Total | 276 (100.0%) | 358 (100.0%) |
Household Income by Mortgage Status in Bloomfield
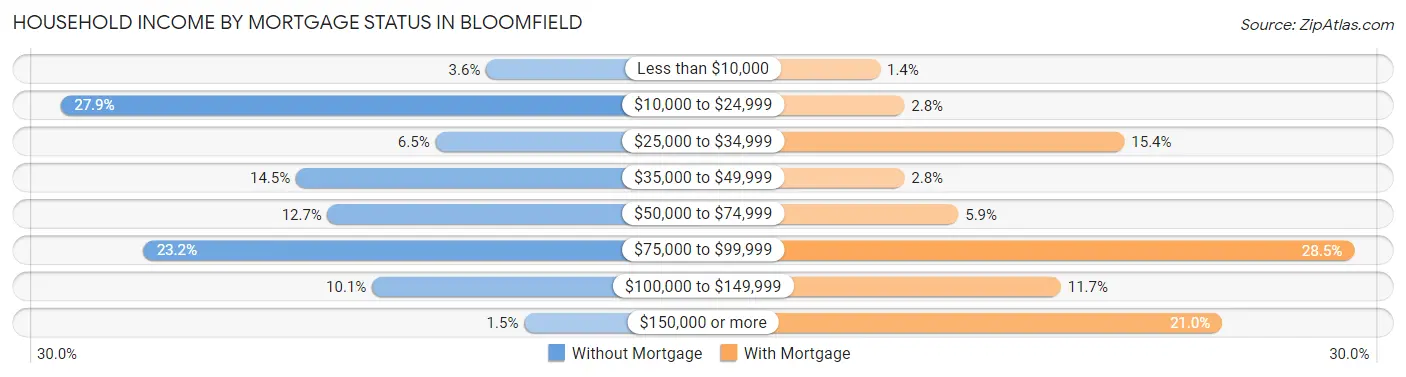
| Household Income | Without Mortgage | With Mortgage |
| Less than $10,000 | 10 (3.6%) | 5 (1.4%) |
| $10,000 to $24,999 | 77 (27.9%) | 10 (2.8%) |
| $25,000 to $34,999 | 18 (6.5%) | 55 (15.4%) |
| $35,000 to $49,999 | 40 (14.5%) | 10 (2.8%) |
| $50,000 to $74,999 | 35 (12.7%) | 21 (5.9%) |
| $75,000 to $99,999 | 64 (23.2%) | 102 (28.5%) |
| $100,000 to $149,999 | 28 (10.1%) | 42 (11.7%) |
| $150,000 or more | 4 (1.5%) | 75 (20.9%) |
| Total | 276 (100.0%) | 358 (100.0%) |
Property Value to Household Income Ratio in Bloomfield
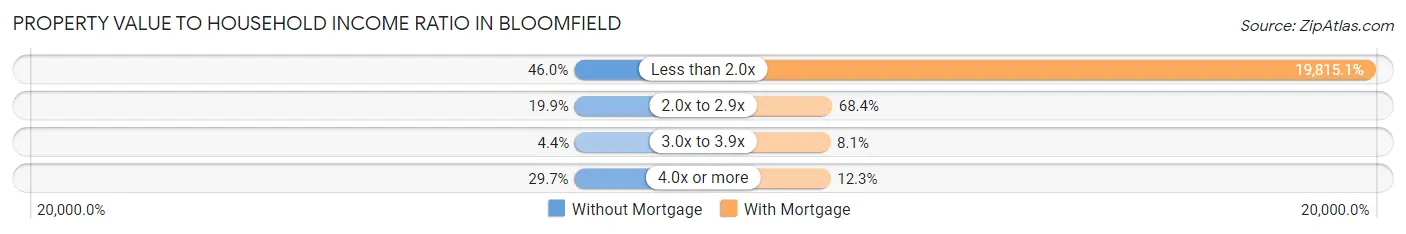
| Value-to-Income Ratio | Without Mortgage | With Mortgage |
| Less than 2.0x | 127 (46.0%) | 70,938 (19,815.1%) |
| 2.0x to 2.9x | 55 (19.9%) | 245 (68.4%) |
| 3.0x to 3.9x | 12 (4.3%) | 29 (8.1%) |
| 4.0x or more | 82 (29.7%) | 44 (12.3%) |
| Total | 276 (100.0%) | 358 (100.0%) |
Real Estate Taxes by Mortgage Status in Bloomfield
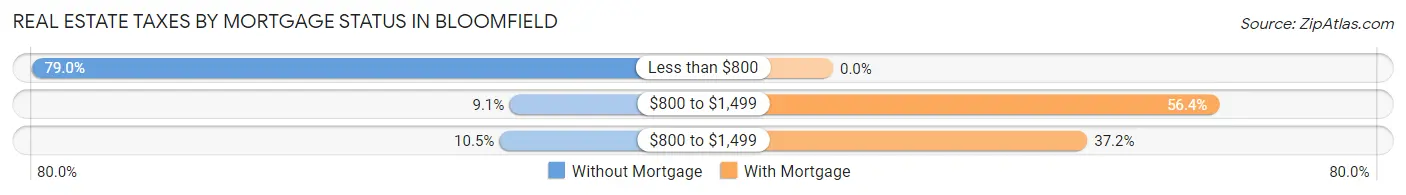
| Property Taxes | Without Mortgage | With Mortgage |
| Less than $800 | 218 (79.0%) | 0 (0.0%) |
| $800 to $1,499 | 25 (9.1%) | 202 (56.4%) |
| $800 to $1,499 | 29 (10.5%) | 133 (37.1%) |
| Total | 276 (100.0%) | 358 (100.0%) |
Health & Disability in Bloomfield
Health Insurance Coverage by Age in Bloomfield
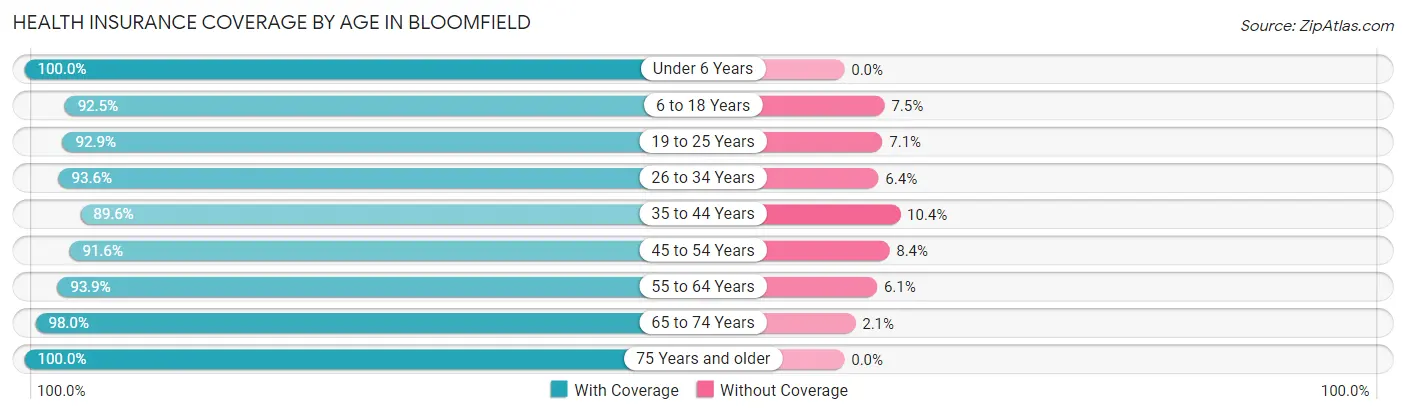
| Age Bracket | With Coverage | Without Coverage |
| Under 6 Years | 146 (100.0%) | 0 (0.0%) |
| 6 to 18 Years | 321 (92.5%) | 26 (7.5%) |
| 19 to 25 Years | 144 (92.9%) | 11 (7.1%) |
| 26 to 34 Years | 221 (93.6%) | 15 (6.4%) |
| 35 to 44 Years | 241 (89.6%) | 28 (10.4%) |
| 45 to 54 Years | 273 (91.6%) | 25 (8.4%) |
| 55 to 64 Years | 277 (93.9%) | 18 (6.1%) |
| 65 to 74 Years | 239 (98.0%) | 5 (2.1%) |
| 75 Years and older | 261 (100.0%) | 0 (0.0%) |
| Total | 2,123 (94.3%) | 128 (5.7%) |
Health Insurance Coverage by Citizenship Status in Bloomfield
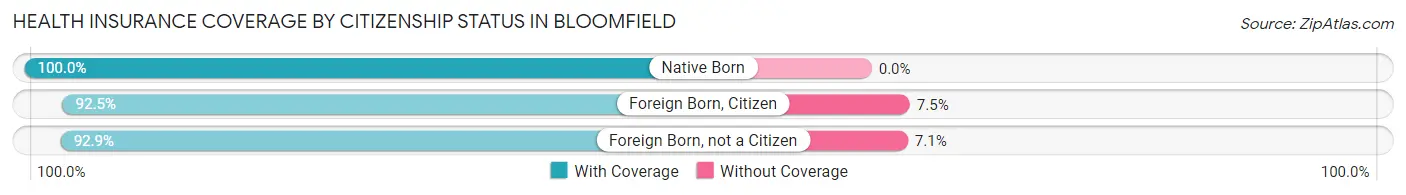
| Citizenship Status | With Coverage | Without Coverage |
| Native Born | 146 (100.0%) | 0 (0.0%) |
| Foreign Born, Citizen | 321 (92.5%) | 26 (7.5%) |
| Foreign Born, not a Citizen | 144 (92.9%) | 11 (7.1%) |
Health Insurance Coverage by Household Income in Bloomfield
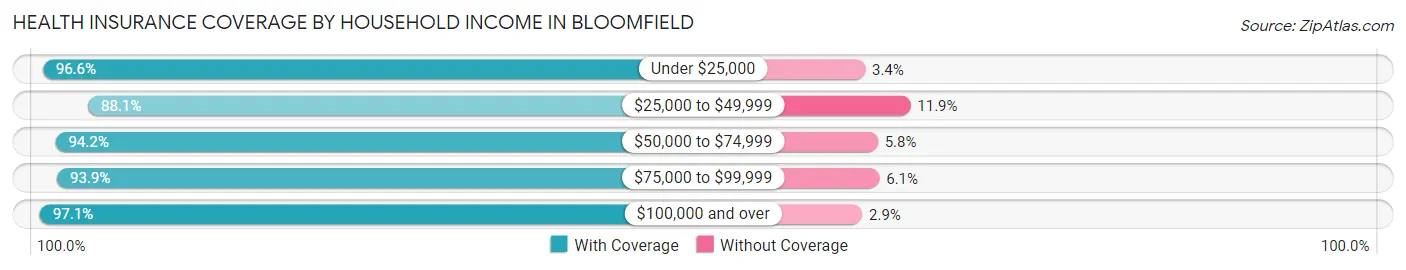
| Household Income | With Coverage | Without Coverage |
| Under $25,000 | 367 (96.6%) | 13 (3.4%) |
| $25,000 to $49,999 | 355 (88.1%) | 48 (11.9%) |
| $50,000 to $74,999 | 488 (94.2%) | 30 (5.8%) |
| $75,000 to $99,999 | 293 (93.9%) | 19 (6.1%) |
| $100,000 and over | 610 (97.1%) | 18 (2.9%) |
Public vs Private Health Insurance Coverage by Age in Bloomfield
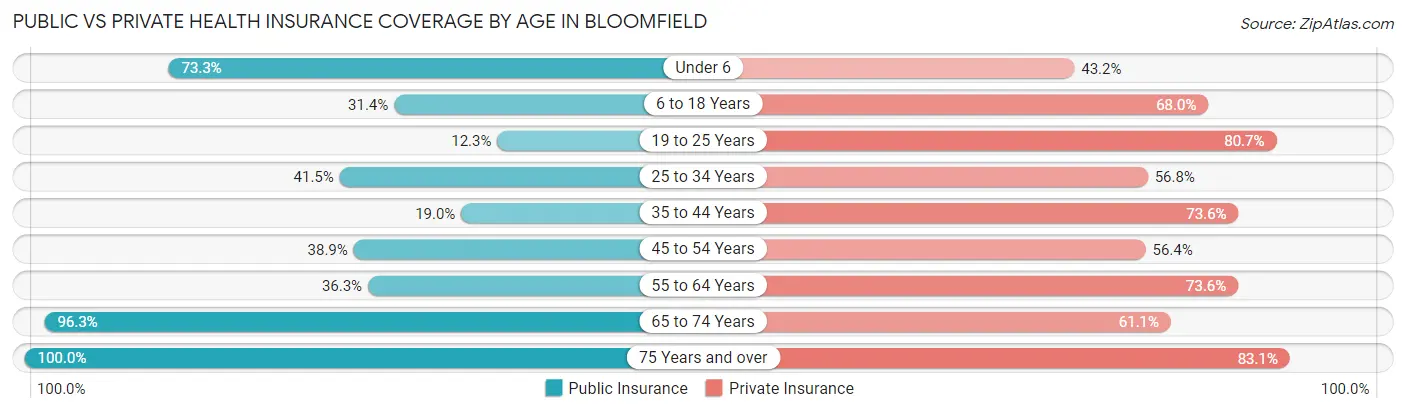
| Age Bracket | Public Insurance | Private Insurance |
| Under 6 | 107 (73.3%) | 63 (43.1%) |
| 6 to 18 Years | 109 (31.4%) | 236 (68.0%) |
| 19 to 25 Years | 19 (12.3%) | 125 (80.6%) |
| 25 to 34 Years | 98 (41.5%) | 134 (56.8%) |
| 35 to 44 Years | 51 (19.0%) | 198 (73.6%) |
| 45 to 54 Years | 116 (38.9%) | 168 (56.4%) |
| 55 to 64 Years | 107 (36.3%) | 217 (73.6%) |
| 65 to 74 Years | 235 (96.3%) | 149 (61.1%) |
| 75 Years and over | 261 (100.0%) | 217 (83.1%) |
| Total | 1,103 (49.0%) | 1,507 (66.9%) |
Disability Status by Sex by Age in Bloomfield
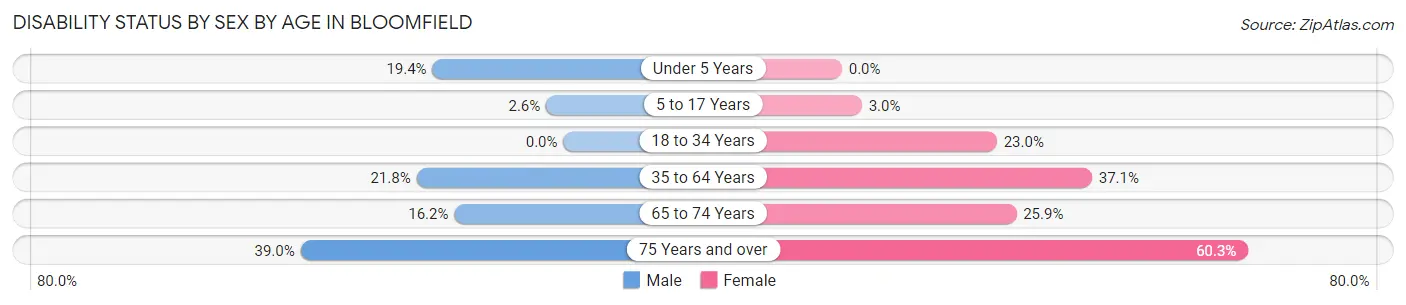
| Age Bracket | Male | Female |
| Under 5 Years | 14 (19.4%) | 0 (0.0%) |
| 5 to 17 Years | 4 (2.6%) | 6 (3.0%) |
| 18 to 34 Years | 0 (0.0%) | 52 (23.0%) |
| 35 to 64 Years | 94 (21.8%) | 160 (37.1%) |
| 65 to 74 Years | 17 (16.2%) | 36 (25.9%) |
| 75 Years and over | 32 (39.0%) | 108 (60.3%) |
Disability Class by Sex by Age in Bloomfield
Disability Class: Hearing Difficulty
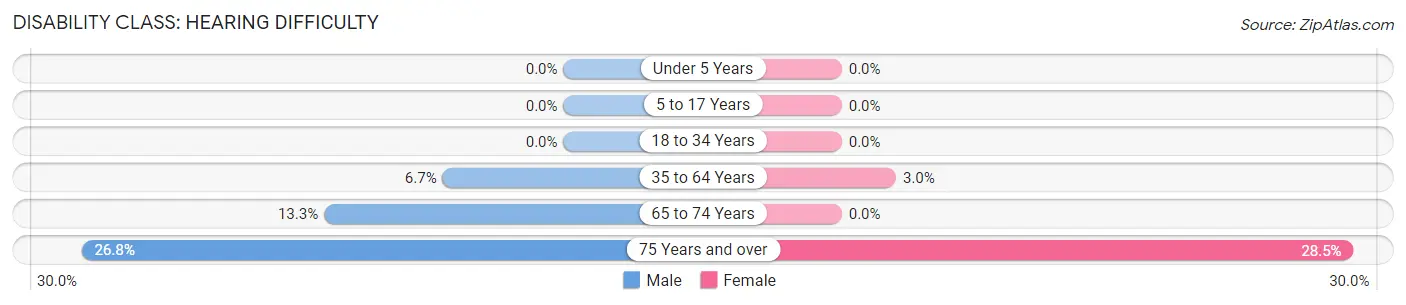
| Age Bracket | Male | Female |
| Under 5 Years | 0 (0.0%) | 0 (0.0%) |
| 5 to 17 Years | 0 (0.0%) | 0 (0.0%) |
| 18 to 34 Years | 0 (0.0%) | 0 (0.0%) |
| 35 to 64 Years | 29 (6.7%) | 13 (3.0%) |
| 65 to 74 Years | 14 (13.3%) | 0 (0.0%) |
| 75 Years and over | 22 (26.8%) | 51 (28.5%) |
Disability Class: Vision Difficulty
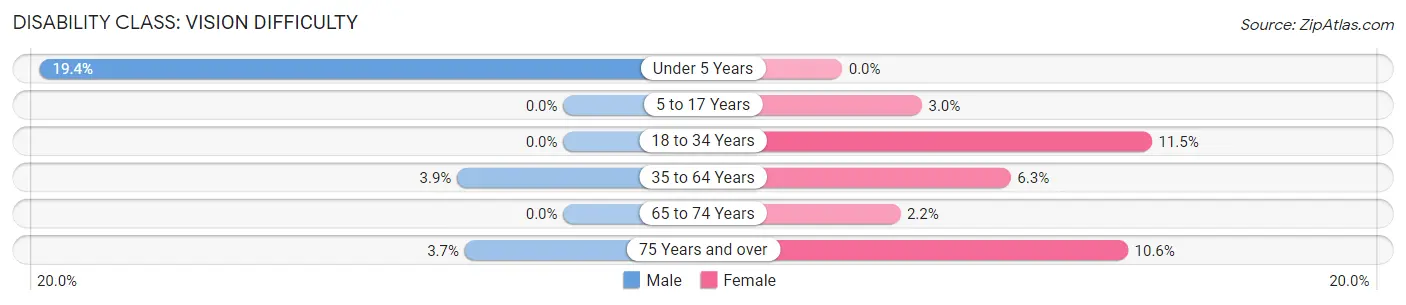
| Age Bracket | Male | Female |
| Under 5 Years | 14 (19.4%) | 0 (0.0%) |
| 5 to 17 Years | 0 (0.0%) | 6 (3.0%) |
| 18 to 34 Years | 0 (0.0%) | 26 (11.5%) |
| 35 to 64 Years | 17 (3.9%) | 27 (6.3%) |
| 65 to 74 Years | 0 (0.0%) | 3 (2.2%) |
| 75 Years and over | 3 (3.7%) | 19 (10.6%) |
Disability Class: Cognitive Difficulty
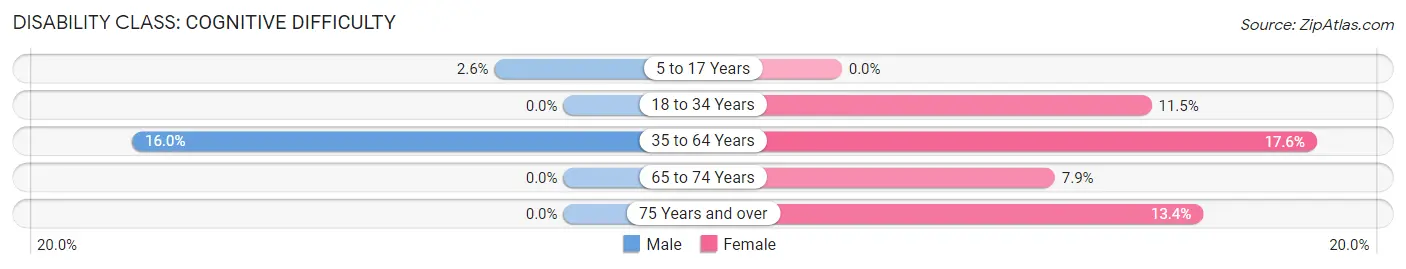
| Age Bracket | Male | Female |
| 5 to 17 Years | 4 (2.6%) | 0 (0.0%) |
| 18 to 34 Years | 0 (0.0%) | 26 (11.5%) |
| 35 to 64 Years | 69 (16.0%) | 76 (17.6%) |
| 65 to 74 Years | 0 (0.0%) | 11 (7.9%) |
| 75 Years and over | 0 (0.0%) | 24 (13.4%) |
Disability Class: Ambulatory Difficulty
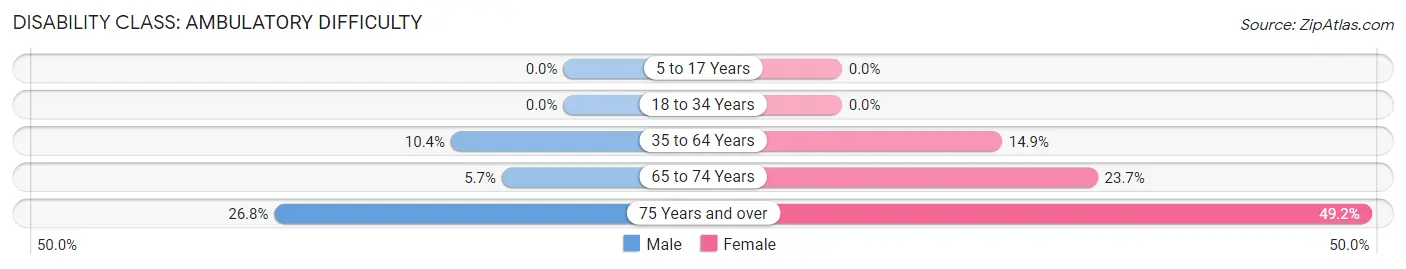
| Age Bracket | Male | Female |
| 5 to 17 Years | 0 (0.0%) | 0 (0.0%) |
| 18 to 34 Years | 0 (0.0%) | 0 (0.0%) |
| 35 to 64 Years | 45 (10.4%) | 64 (14.8%) |
| 65 to 74 Years | 6 (5.7%) | 33 (23.7%) |
| 75 Years and over | 22 (26.8%) | 88 (49.2%) |
Disability Class: Self-Care Difficulty
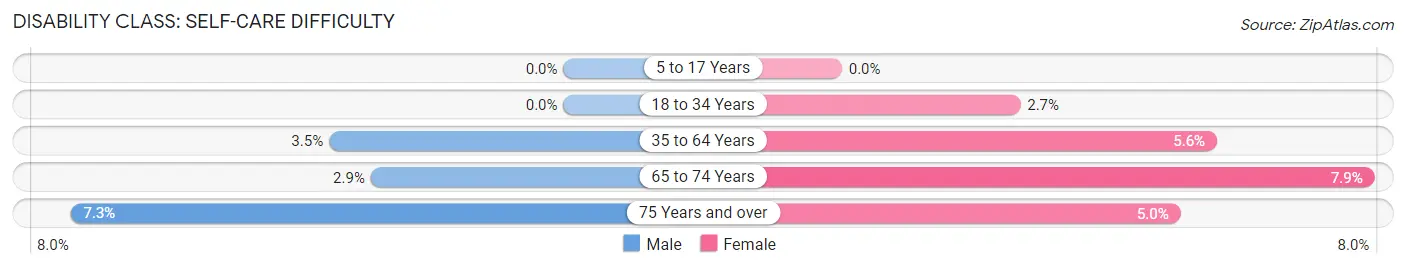
| Age Bracket | Male | Female |
| 5 to 17 Years | 0 (0.0%) | 0 (0.0%) |
| 18 to 34 Years | 0 (0.0%) | 6 (2.6%) |
| 35 to 64 Years | 15 (3.5%) | 24 (5.6%) |
| 65 to 74 Years | 3 (2.9%) | 11 (7.9%) |
| 75 Years and over | 6 (7.3%) | 9 (5.0%) |
Technology Access in Bloomfield
Computing Device Access in Bloomfield
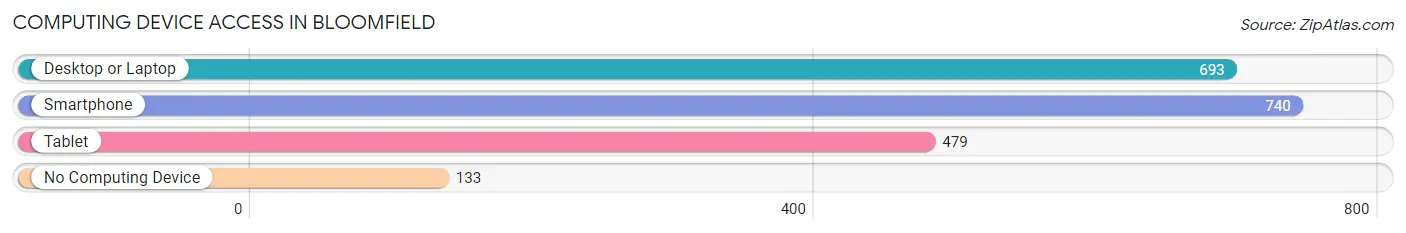
| Device Type | # Households | % Households |
| Desktop or Laptop | 693 | 69.6% |
| Smartphone | 740 | 74.3% |
| Tablet | 479 | 48.1% |
| No Computing Device | 133 | 13.4% |
| Total | 996 | 100.0% |
Internet Access in Bloomfield
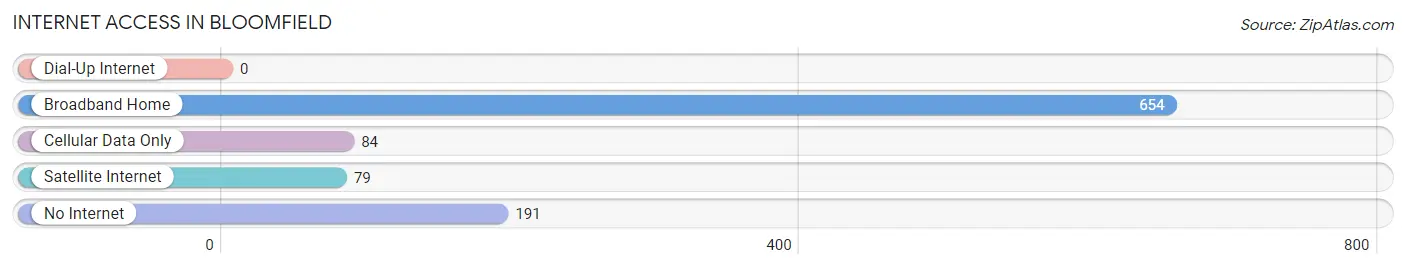
| Internet Type | # Households | % Households |
| Dial-Up Internet | 0 | 0.0% |
| Broadband Home | 654 | 65.7% |
| Cellular Data Only | 84 | 8.4% |
| Satellite Internet | 79 | 7.9% |
| No Internet | 191 | 19.2% |
| Total | 996 | 100.0% |
Bloomfield Summary
Bloomfield, Indiana is a small town located in Greene County, Indiana. It is situated in the southwestern part of the state, about 40 miles southwest of Indianapolis. The town has a population of approximately 2,500 people and is part of the Bloomington Metropolitan Statistical Area.
History
Bloomfield was founded in 1820 by a group of settlers from North Carolina. The town was named after the blooming wildflowers that grew in the area. The town was incorporated in 1837 and has remained a small, rural community ever since.
The town was an important stop on the Monon Railroad, which ran from Chicago to Louisville. The railroad brought many new people to the area and helped to spur economic growth. The town also had a thriving agricultural industry, with many farmers growing corn, wheat, and other crops.
In the late 19th century, the town was home to several factories, including a flour mill, a sawmill, and a brickyard. These factories provided employment for many of the town’s residents.
Geography
Bloomfield is located in southwestern Indiana, about 40 miles southwest of Indianapolis. The town is situated in a rural area, surrounded by rolling hills and farmland. The town is located on the banks of the White River, which flows through the area.
The town has a total area of 1.3 square miles, all of which is land. The town has a humid continental climate, with hot summers and cold winters.
Economy
The economy of Bloomfield is largely based on agriculture. The town is home to several farms, which grow corn, wheat, and other crops. The town also has a thriving tourism industry, with many visitors coming to the area to enjoy the natural beauty of the area.
The town is also home to several small businesses, including restaurants, shops, and other services. The town is also home to a few manufacturing companies, which produce a variety of products.
Demographics
As of the 2010 census, the population of Bloomfield was 2,500. The town has a median household income of $37,000 and a median family income of $45,000. The town is predominantly white, with about 95% of the population being white. The town also has a small Hispanic population, with about 4% of the population being Hispanic.
Conclusion
Bloomfield, Indiana is a small town located in Greene County, Indiana. It is situated in the southwestern part of the state, about 40 miles southwest of Indianapolis. The town has a population of approximately 2,500 people and is part of the Bloomington Metropolitan Statistical Area. The town has a largely agricultural economy, with many farms growing corn, wheat, and other crops. The town also has a thriving tourism industry, with many visitors coming to the area to enjoy the natural beauty of the area. The town is predominantly white, with about 95% of the population being white. The town also has a small Hispanic population, with about 4% of the population being Hispanic.
Common Questions
What is the Total Population of Bloomfield?
Total Population of Bloomfield is 2,337.
What is the Total Male Population of Bloomfield?
Total Male Population of Bloomfield is 1,117.
What is the Total Female Population of Bloomfield?
Total Female Population of Bloomfield is 1,220.
What is the Ratio of Males per 100 Females in Bloomfield?
There are 91.56 Males per 100 Females in Bloomfield.
What is the Ratio of Females per 100 Males in Bloomfield?
There are 109.22 Females per 100 Males in Bloomfield.
What is the Median Population Age in Bloomfield?
Median Population Age in Bloomfield is 44.1 Years.
What is the Average Family Size in Bloomfield
Average Family Size in Bloomfield is 3.0 People.
What is the Average Household Size in Bloomfield
Average Household Size in Bloomfield is 2.2 People.
What is Per Capita Income in Bloomfield?
Per Capita income in Bloomfield is $27,403.
What is the Median Family Income in Bloomfield?
Median Family Income in Bloomfield is $70,536.
What is the Median Household income in Bloomfield?
Median Household Income in Bloomfield is $50,063.
What is Income or Wage Gap in Bloomfield?
Income or Wage Gap in Bloomfield is 41.8%.
Women in Bloomfield earn 58.2 cents for every dollar earned by a man.
What is Inequality or Gini Index in Bloomfield?
Inequality or Gini Index in Bloomfield is 0.42.
How Large is the Labor Force in Bloomfield?
There are 1,009 People in the Labor Forcein in Bloomfield.
What is the Percentage of People in the Labor Force in Bloomfield?
52.5% of People are in the Labor Force in Bloomfield.
What is the Unemployment Rate in Bloomfield?
Unemployment Rate in Bloomfield is 9.1%.