French Lick, IN
French Lick Map
French Lick Overview
1,752
TOTAL POPULATION
886
MALE POPULATION
866
FEMALE POPULATION
102.31
MALES / 100 FEMALES
97.74
FEMALES / 100 MALES
41.1
MEDIAN AGE
2.8
AVG FAMILY SIZE
2.2
AVG HOUSEHOLD SIZE
$27,849
PER CAPITA INCOME
$69,444
AVG FAMILY INCOME
$55,074
AVG HOUSEHOLD INCOME
14.8%
WAGE / INCOME GAP [ % ]
85.2¢/ $1
WAGE / INCOME GAP [ $ ]
0.41
INEQUALITY / GINI INDEX
870
LABOR FORCE [ PEOPLE ]
62.8%
PERCENT IN LABOR FORCE
1.0%
UNEMPLOYMENT RATE
French Lick Zip Codes
French Lick Area Codes
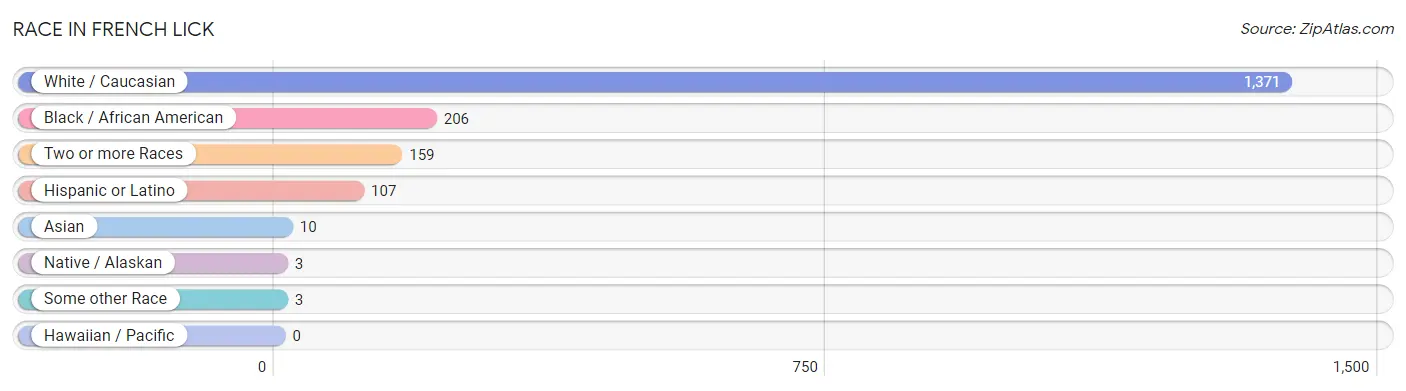
Race in French Lick
The most populous races in French Lick are White / Caucasian (1,371 | 78.2%), Black / African American (206 | 11.8%), and Two or more Races (159 | 9.1%).
| Race | # Population | % Population |
| Asian | 10 | 0.6% |
| Black / African American | 206 | 11.8% |
| Hawaiian / Pacific | 0 | 0.0% |
| Hispanic or Latino | 107 | 6.1% |
| Native / Alaskan | 3 | 0.2% |
| White / Caucasian | 1,371 | 78.2% |
| Two or more Races | 159 | 9.1% |
| Some other Race | 3 | 0.2% |
| Total | 1,752 | 100.0% |
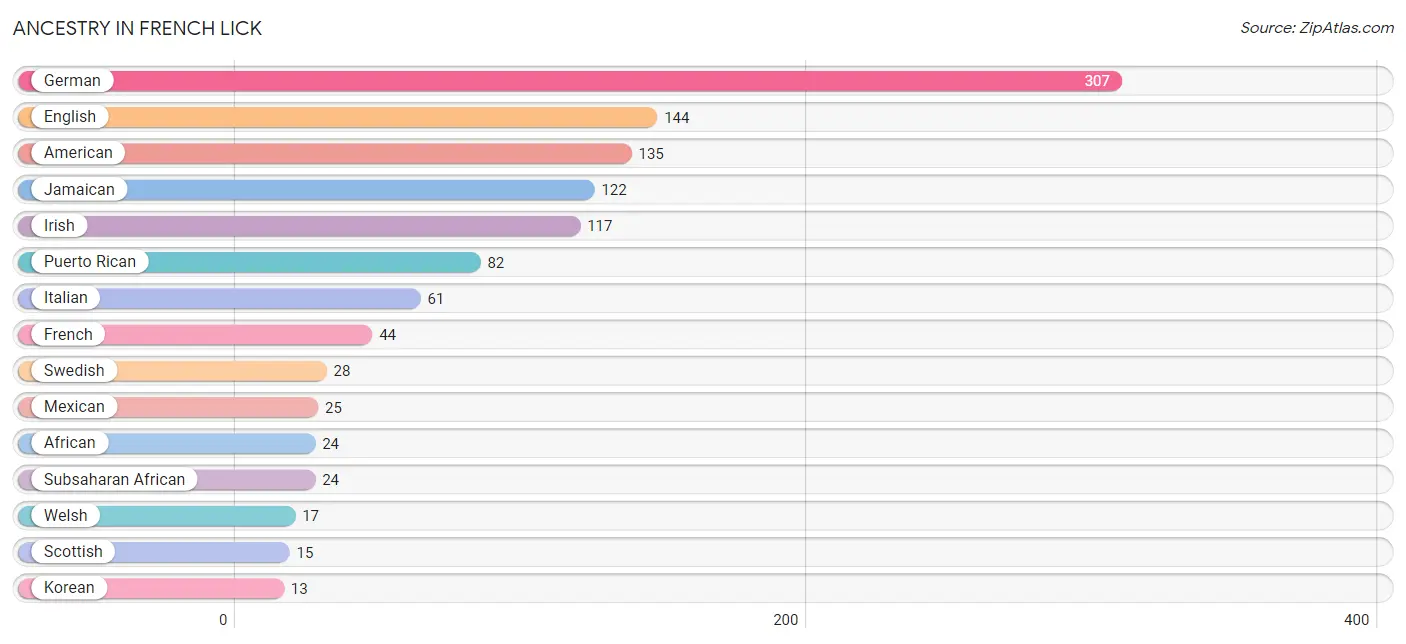
Ancestry in French Lick
The most populous ancestries reported in French Lick are German (307 | 17.5%), English (144 | 8.2%), American (135 | 7.7%), Jamaican (122 | 7.0%), and Irish (117 | 6.7%), together accounting for 47.1% of all French Lick residents.
| Ancestry | # Population | % Population |
| African | 24 | 1.4% |
| American | 135 | 7.7% |
| Arab | 8 | 0.5% |
| Belgian | 6 | 0.3% |
| British | 5 | 0.3% |
| Cherokee | 5 | 0.3% |
| Eastern European | 5 | 0.3% |
| English | 144 | 8.2% |
| European | 6 | 0.3% |
| French | 44 | 2.5% |
| German | 307 | 17.5% |
| Greek | 7 | 0.4% |
| Hungarian | 4 | 0.2% |
| Indian (Asian) | 5 | 0.3% |
| Irish | 117 | 6.7% |
| Italian | 61 | 3.5% |
| Jamaican | 122 | 7.0% |
| Korean | 13 | 0.7% |
| Lebanese | 8 | 0.5% |
| Mexican | 25 | 1.4% |
| Polish | 5 | 0.3% |
| Puerto Rican | 82 | 4.7% |
| Scotch-Irish | 11 | 0.6% |
| Scottish | 15 | 0.9% |
| Subsaharan African | 24 | 1.4% |
| Swedish | 28 | 1.6% |
| Swiss | 2 | 0.1% |
| Welsh | 17 | 1.0% | View All 28 Rows |
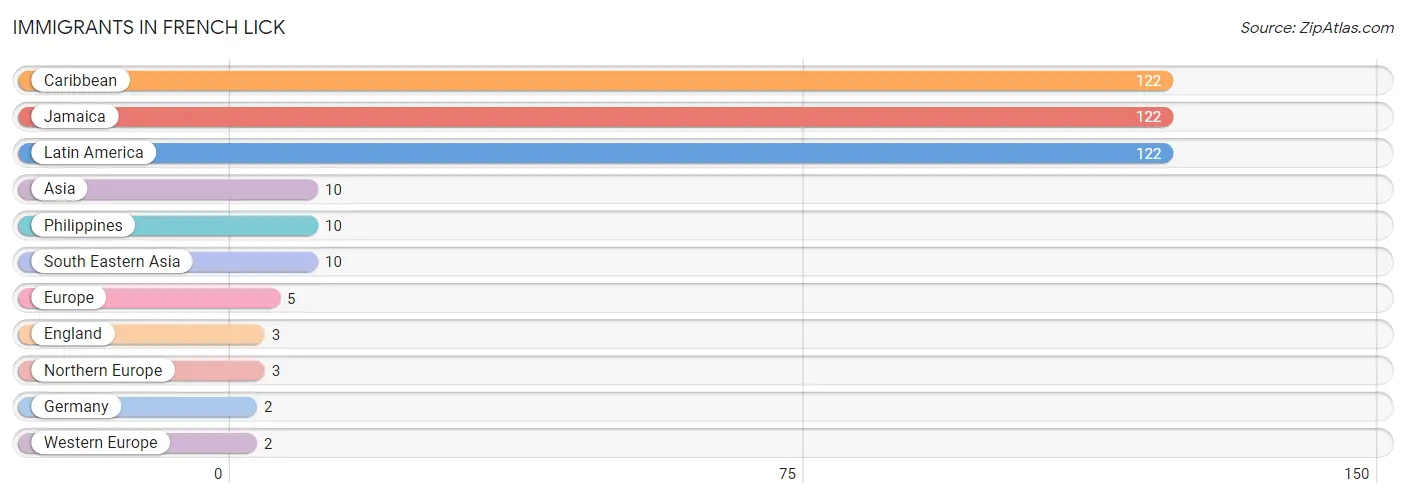
Immigrants in French Lick
The most numerous immigrant groups reported in French Lick came from Caribbean (122 | 7.0%), Jamaica (122 | 7.0%), Latin America (122 | 7.0%), Asia (10 | 0.6%), and Philippines (10 | 0.6%), together accounting for 22.0% of all French Lick residents.
| Immigration Origin | # Population | % Population |
| Asia | 10 | 0.6% |
| Caribbean | 122 | 7.0% |
| England | 3 | 0.2% |
| Europe | 5 | 0.3% |
| Germany | 2 | 0.1% |
| Jamaica | 122 | 7.0% |
| Latin America | 122 | 7.0% |
| Northern Europe | 3 | 0.2% |
| Philippines | 10 | 0.6% |
| South Eastern Asia | 10 | 0.6% |
| Western Europe | 2 | 0.1% | View All 11 Rows |
Sex and Age in French Lick
Sex and Age in French Lick
The most populous age groups in French Lick are 40 to 44 Years (154 | 17.4%) for men and 40 to 44 Years (106 | 12.2%) for women.
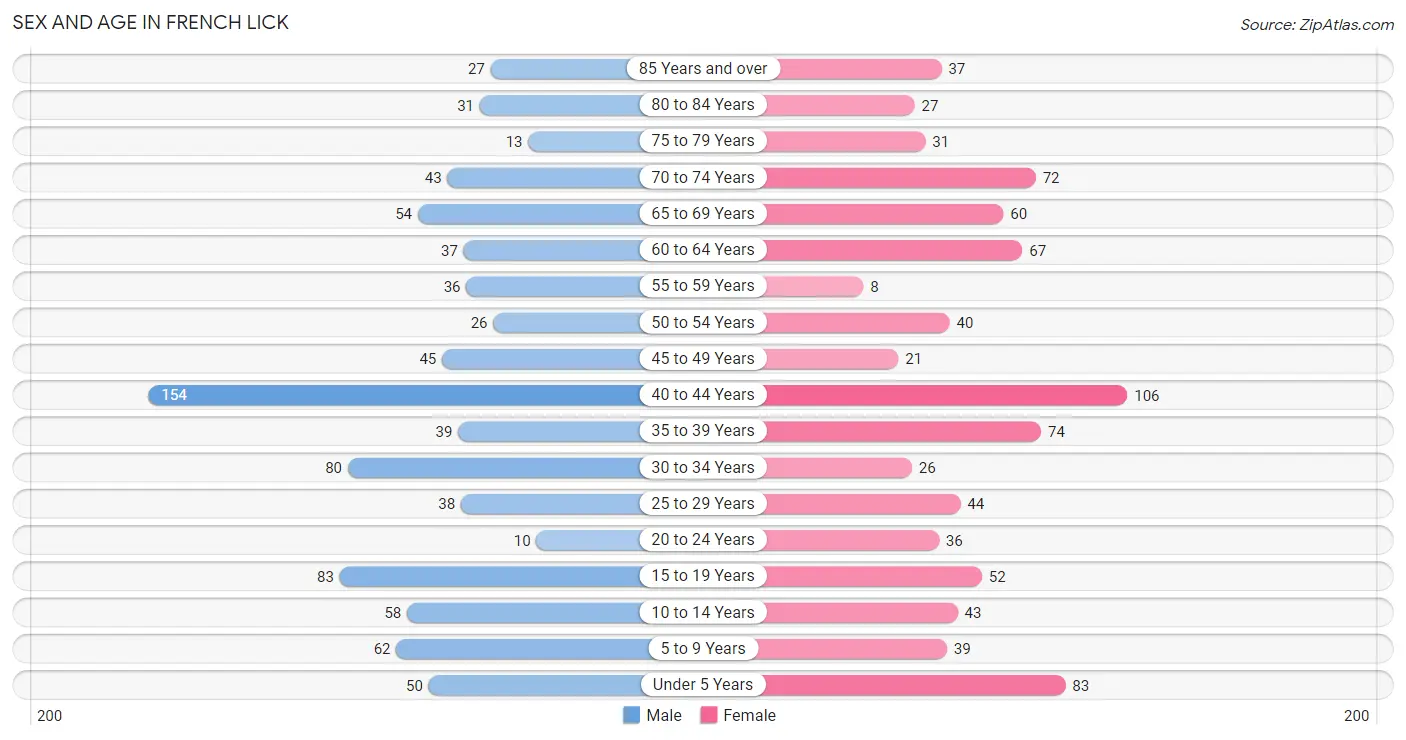
| Age Bracket | Male | Female |
| Under 5 Years | 50 (5.6%) | 83 (9.6%) |
| 5 to 9 Years | 62 (7.0%) | 39 (4.5%) |
| 10 to 14 Years | 58 (6.6%) | 43 (5.0%) |
| 15 to 19 Years | 83 (9.4%) | 52 (6.0%) |
| 20 to 24 Years | 10 (1.1%) | 36 (4.2%) |
| 25 to 29 Years | 38 (4.3%) | 44 (5.1%) |
| 30 to 34 Years | 80 (9.0%) | 26 (3.0%) |
| 35 to 39 Years | 39 (4.4%) | 74 (8.6%) |
| 40 to 44 Years | 154 (17.4%) | 106 (12.2%) |
| 45 to 49 Years | 45 (5.1%) | 21 (2.4%) |
| 50 to 54 Years | 26 (2.9%) | 40 (4.6%) |
| 55 to 59 Years | 36 (4.1%) | 8 (0.9%) |
| 60 to 64 Years | 37 (4.2%) | 67 (7.7%) |
| 65 to 69 Years | 54 (6.1%) | 60 (6.9%) |
| 70 to 74 Years | 43 (4.9%) | 72 (8.3%) |
| 75 to 79 Years | 13 (1.5%) | 31 (3.6%) |
| 80 to 84 Years | 31 (3.5%) | 27 (3.1%) |
| 85 Years and over | 27 (3.0%) | 37 (4.3%) |
| Total | 886 (100.0%) | 866 (100.0%) |
Families and Households in French Lick
Median Family Size in French Lick
The median family size in French Lick is 2.78 persons per family, with single female/mother families (103 | 23.8%) accounting for the largest median family size of 3.2 persons per family. On the other hand, single male/father families (110 | 25.5%) represent the smallest median family size with 1.80 persons per family.
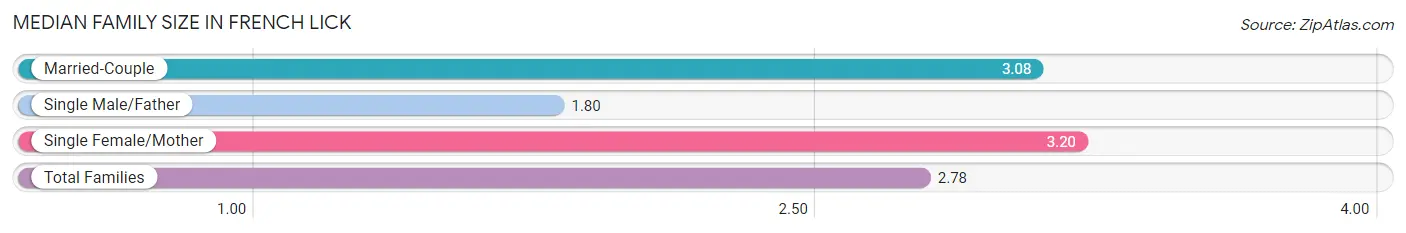
| Family Type | # Families | Family Size |
| Married-Couple | 219 (50.7%) | 3.08 |
| Single Male/Father | 110 (25.5%) | 1.80 |
| Single Female/Mother | 103 (23.8%) | 3.20 |
| Total Families | 432 (100.0%) | 2.78 |
Median Household Size in French Lick
The median household size in French Lick is 2.17 persons per household, with single female/mother households (103 | 13.4%) accounting for the largest median household size of 3.42 persons per household. non-family households (335 | 43.7%) represent the smallest median household size with 1.13 persons per household.
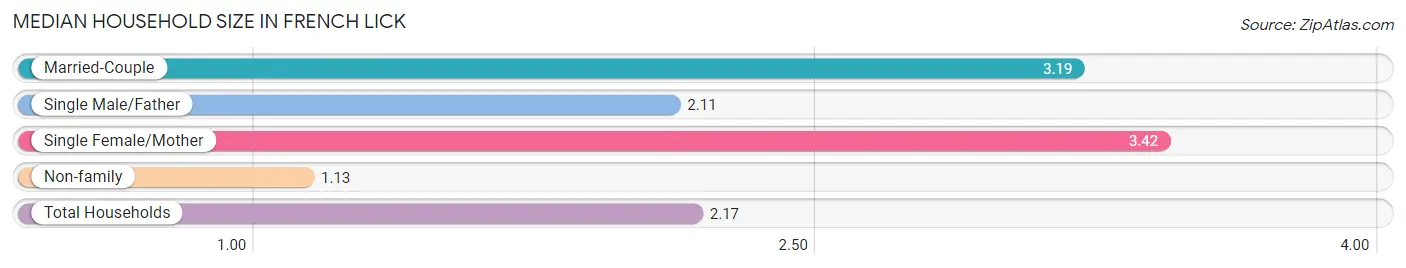
| Household Type | # Households | Household Size |
| Married-Couple | 219 (28.5%) | 3.19 |
| Single Male/Father | 110 (14.3%) | 2.11 |
| Single Female/Mother | 103 (13.4%) | 3.42 |
| Non-family | 335 (43.7%) | 1.13 |
| Total Households | 767 (100.0%) | 2.17 |
Household Size by Marriage Status in French Lick
Out of a total of 767 households in French Lick, 432 (56.3%) are family households, while 335 (43.7%) are nonfamily households. The most numerous type of family households are 4-person households, comprising 138, and the most common type of nonfamily households are 1-person households, comprising 307.
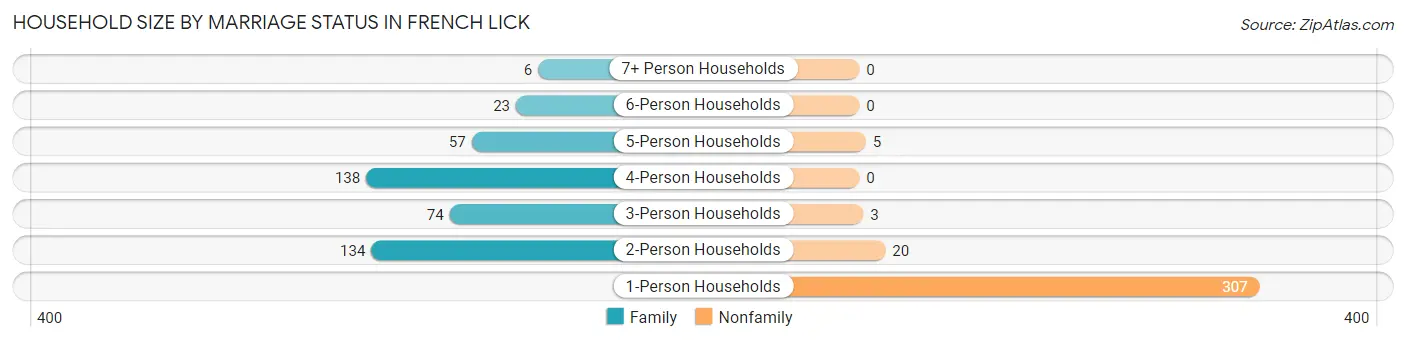
| Household Size | Family Households | Nonfamily Households |
| 1-Person Households | - | 307 (40.0%) |
| 2-Person Households | 134 (17.5%) | 20 (2.6%) |
| 3-Person Households | 74 (9.7%) | 3 (0.4%) |
| 4-Person Households | 138 (18.0%) | 0 (0.0%) |
| 5-Person Households | 57 (7.4%) | 5 (0.6%) |
| 6-Person Households | 23 (3.0%) | 0 (0.0%) |
| 7+ Person Households | 6 (0.8%) | 0 (0.0%) |
| Total | 432 (56.3%) | 335 (43.7%) |
Female Fertility in French Lick
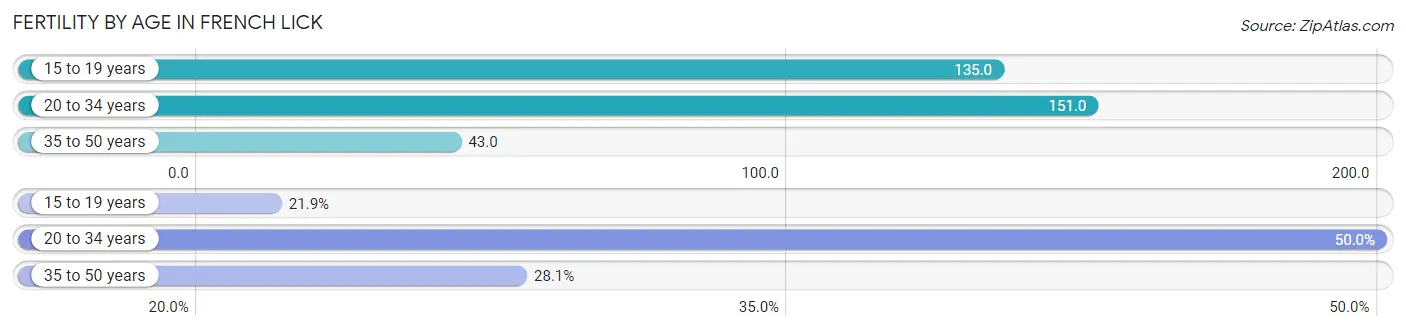
Fertility by Age in French Lick
Average fertility rate in French Lick is 87.0 births per 1,000 women. Women in the age bracket of 20 to 34 years have the highest fertility rate with 151.0 births per 1,000 women. Women in the age bracket of 20 to 34 years acount for 50.0% of all women with births.
| Age Bracket | Women with Births | Births / 1,000 Women |
| 15 to 19 years | 7 (21.9%) | 135.0 |
| 20 to 34 years | 16 (50.0%) | 151.0 |
| 35 to 50 years | 9 (28.1%) | 43.0 |
| Total | 32 (100.0%) | 87.0 |
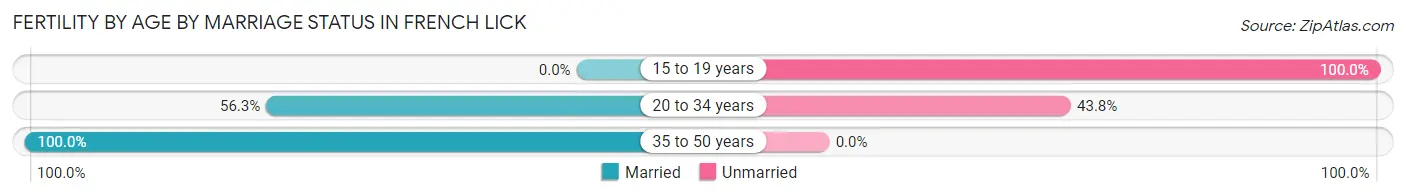
Fertility by Age by Marriage Status in French Lick
56.2% of women with births (32) in French Lick are married. The highest percentage of unmarried women with births falls into 15 to 19 years age bracket with 100.0% of them unmarried at the time of birth, while the lowest percentage of unmarried women with births belong to 35 to 50 years age bracket with 0.0% of them unmarried.
| Age Bracket | Married | Unmarried |
| 15 to 19 years | 0 (0.0%) | 7 (100.0%) |
| 20 to 34 years | 9 (56.2%) | 7 (43.8%) |
| 35 to 50 years | 9 (100.0%) | 0 (0.0%) |
| Total | 18 (56.2%) | 14 (43.8%) |
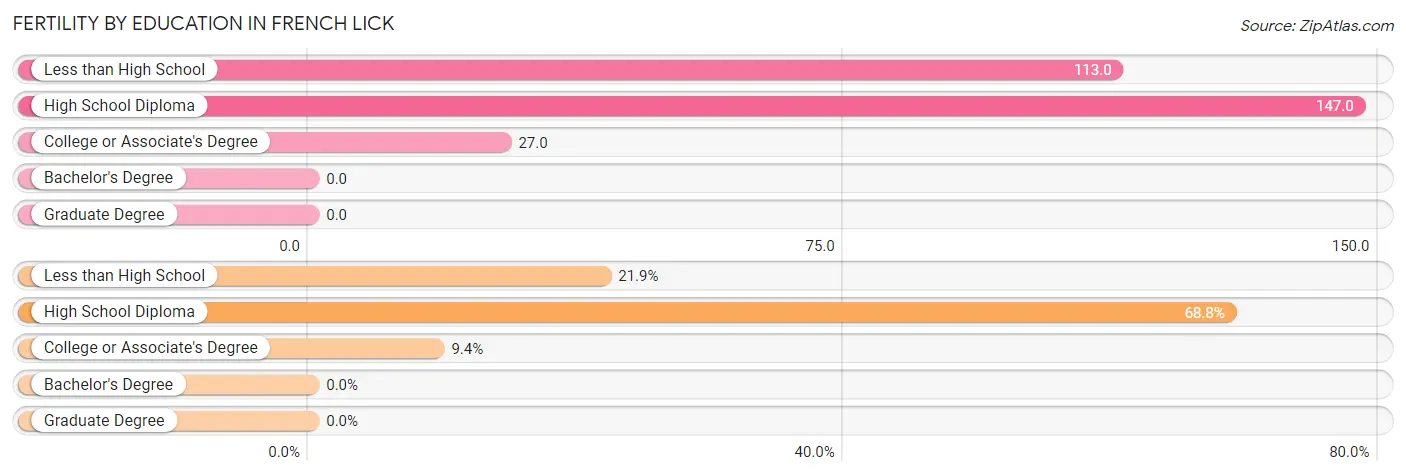
Fertility by Education in French Lick
| Educational Attainment | Women with Births | Births / 1,000 Women |
| Less than High School | 7 (21.9%) | 113.0 |
| High School Diploma | 22 (68.8%) | 147.0 |
| College or Associate's Degree | 3 (9.4%) | 27.0 |
| Bachelor's Degree | 0 (0.0%) | 0.0 |
| Graduate Degree | 0 (0.0%) | 0.0 |
| Total | 32 (100.0%) | 87.0 |
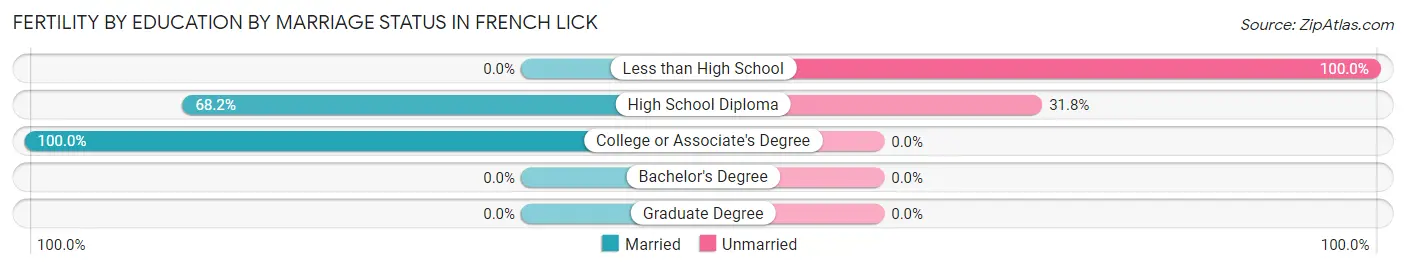
Fertility by Education by Marriage Status in French Lick
43.8% of women with births in French Lick are unmarried. Women with the educational attainment of college or associate's degree are most likely to be married with 100.0% of them married at childbirth, while women with the educational attainment of less than high school are least likely to be married with 100.0% of them unmarried at childbirth.
| Educational Attainment | Married | Unmarried |
| Less than High School | 0 (0.0%) | 7 (100.0%) |
| High School Diploma | 15 (68.2%) | 7 (31.8%) |
| College or Associate's Degree | 3 (100.0%) | 0 (0.0%) |
| Bachelor's Degree | 0 (0.0%) | 0 (0.0%) |
| Graduate Degree | 0 (0.0%) | 0 (0.0%) |
| Total | 18 (56.2%) | 14 (43.8%) |
Income in French Lick
Income Overview in French Lick
Per Capita Income in French Lick is $27,849, while median incomes of families and households are $69,444 and $55,074 respectively.
| Characteristic | Number | Measure |
| Per Capita Income | 1,752 | $27,849 |
| Median Family Income | 432 | $69,444 |
| Mean Family Income | 432 | $67,269 |
| Median Household Income | 767 | $55,074 |
| Mean Household Income | 767 | $65,275 |
| Income Deficit | 432 | $0 |
| Wage / Income Gap (%) | 1,752 | 14.75% |
| Wage / Income Gap ($) | 1,752 | 85.25¢ per $1 |
| Gini / Inequality Index | 1,752 | 0.41 |
Earnings by Sex in French Lick
Average Earnings in French Lick are $34,107, $36,580 for men and $31,183 for women, a difference of 14.7%.
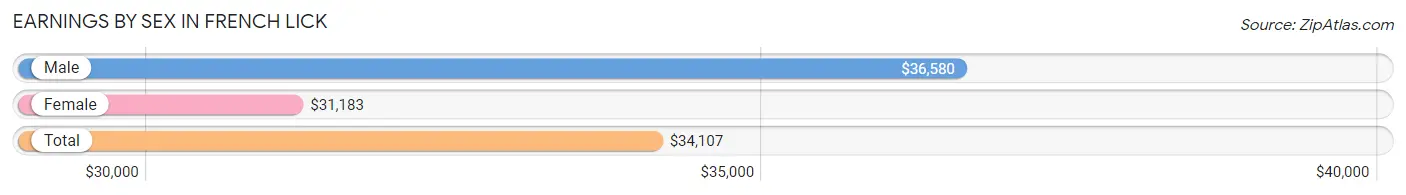
| Sex | Number | Average Earnings |
| Male | 499 (53.3%) | $36,580 |
| Female | 437 (46.7%) | $31,183 |
| Total | 936 (100.0%) | $34,107 |
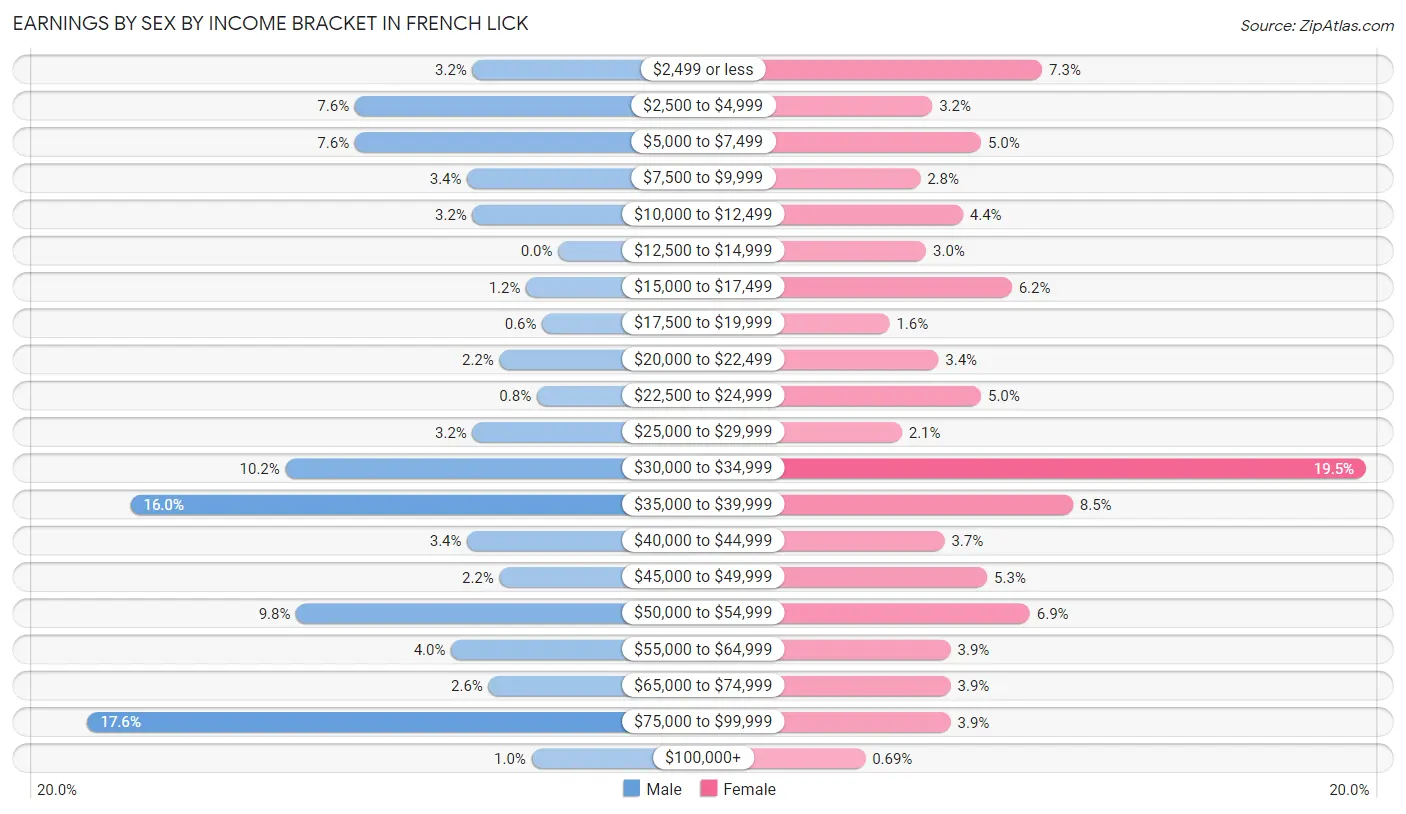
Earnings by Sex by Income Bracket in French Lick
The most common earnings brackets in French Lick are $75,000 to $99,999 for men (88 | 17.6%) and $30,000 to $34,999 for women (85 | 19.5%).
| Income | Male | Female |
| $2,499 or less | 16 (3.2%) | 32 (7.3%) |
| $2,500 to $4,999 | 38 (7.6%) | 14 (3.2%) |
| $5,000 to $7,499 | 38 (7.6%) | 22 (5.0%) |
| $7,500 to $9,999 | 17 (3.4%) | 12 (2.8%) |
| $10,000 to $12,499 | 16 (3.2%) | 19 (4.3%) |
| $12,500 to $14,999 | 0 (0.0%) | 13 (3.0%) |
| $15,000 to $17,499 | 6 (1.2%) | 27 (6.2%) |
| $17,500 to $19,999 | 3 (0.6%) | 7 (1.6%) |
| $20,000 to $22,499 | 11 (2.2%) | 15 (3.4%) |
| $22,500 to $24,999 | 4 (0.8%) | 22 (5.0%) |
| $25,000 to $29,999 | 16 (3.2%) | 9 (2.1%) |
| $30,000 to $34,999 | 51 (10.2%) | 85 (19.5%) |
| $35,000 to $39,999 | 80 (16.0%) | 37 (8.5%) |
| $40,000 to $44,999 | 17 (3.4%) | 16 (3.7%) |
| $45,000 to $49,999 | 11 (2.2%) | 23 (5.3%) |
| $50,000 to $54,999 | 49 (9.8%) | 30 (6.9%) |
| $55,000 to $64,999 | 20 (4.0%) | 17 (3.9%) |
| $65,000 to $74,999 | 13 (2.6%) | 17 (3.9%) |
| $75,000 to $99,999 | 88 (17.6%) | 17 (3.9%) |
| $100,000+ | 5 (1.0%) | 3 (0.7%) |
| Total | 499 (100.0%) | 437 (100.0%) |
Earnings by Sex by Educational Attainment in French Lick
Average earnings in French Lick are $38,796 for men and $32,254 for women, a difference of 16.9%. Men with an educational attainment of college or associate's degree enjoy the highest average annual earnings of $53,750, while those with less than high school education earn the least with $33,000. Women with an educational attainment of graduate degree earn the most with the average annual earnings of $72,625, while those with high school diploma education have the smallest earnings of $30,852.
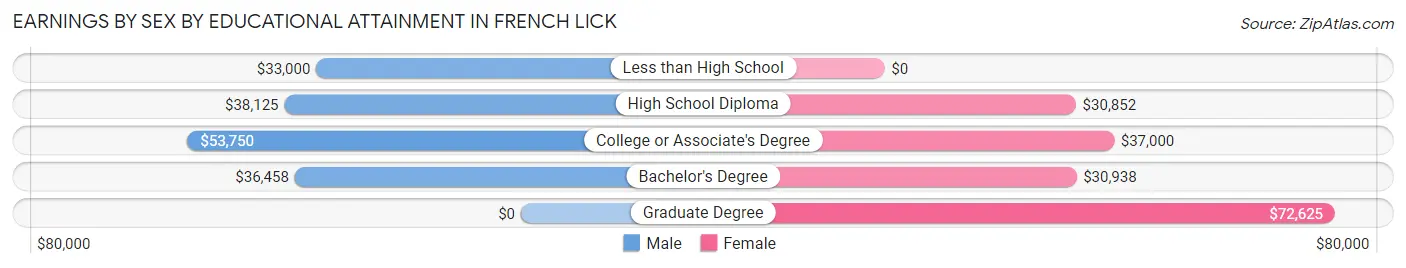
| Educational Attainment | Male Income | Female Income |
| Less than High School | $33,000 | $0 |
| High School Diploma | $38,125 | $30,852 |
| College or Associate's Degree | $53,750 | $37,000 |
| Bachelor's Degree | $36,458 | $30,938 |
| Graduate Degree | - | - |
| Total | $38,796 | $32,254 |
Family Income in French Lick
Family Income Brackets in French Lick
According to the French Lick family income data, there are 157 families falling into the $75,000 to $99,999 income range, which is the most common income bracket and makes up 36.3% of all families.
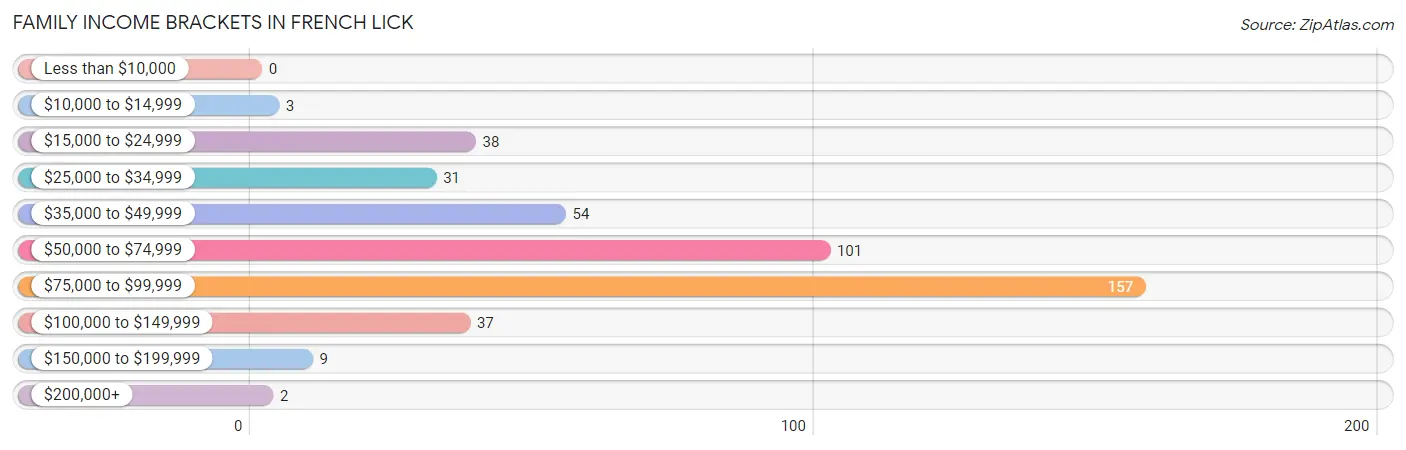
| Income Bracket | # Families | % Families |
| Less than $10,000 | 0 | 0.0% |
| $10,000 to $14,999 | 3 | 0.7% |
| $15,000 to $24,999 | 38 | 8.8% |
| $25,000 to $34,999 | 31 | 7.2% |
| $35,000 to $49,999 | 54 | 12.5% |
| $50,000 to $74,999 | 101 | 23.4% |
| $75,000 to $99,999 | 157 | 36.3% |
| $100,000 to $149,999 | 37 | 8.6% |
| $150,000 to $199,999 | 9 | 2.1% |
| $200,000+ | 2 | 0.5% |
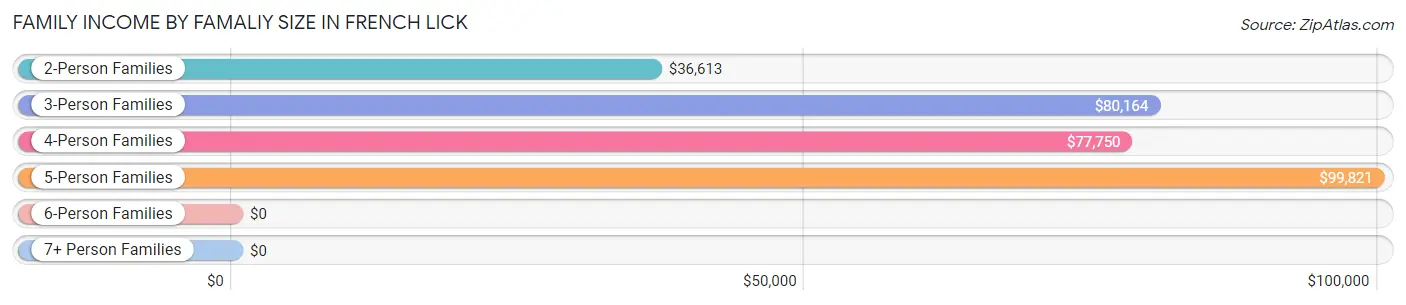
Family Income by Famaliy Size in French Lick
5-person families (43 | 10.0%) account for the highest median family income in French Lick with $99,821 per family, while 3-person families (150 | 34.7%) have the highest median income of $26,721 per family member.
| Income Bracket | # Families | Median Income |
| 2-Person Families | 142 (32.9%) | $36,613 |
| 3-Person Families | 150 (34.7%) | $80,164 |
| 4-Person Families | 71 (16.4%) | $77,750 |
| 5-Person Families | 43 (10.0%) | $99,821 |
| 6-Person Families | 23 (5.3%) | $0 |
| 7+ Person Families | 3 (0.7%) | $0 |
| Total | 432 (100.0%) | $69,444 |
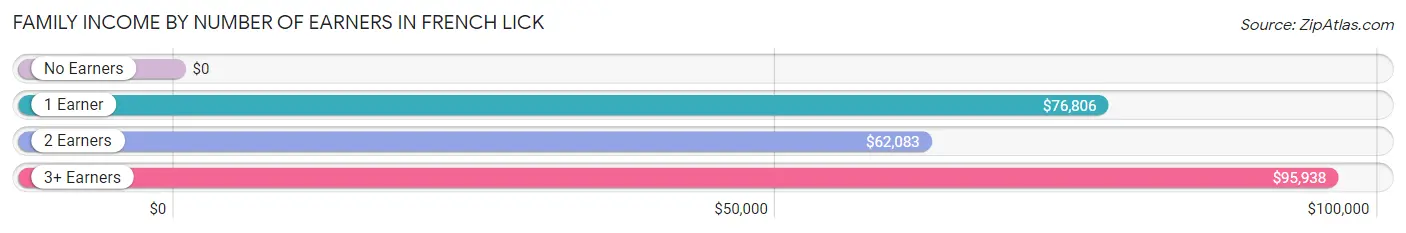
Family Income by Number of Earners in French Lick
| Number of Earners | # Families | Median Income |
| No Earners | 48 (11.1%) | $0 |
| 1 Earner | 185 (42.8%) | $76,806 |
| 2 Earners | 142 (32.9%) | $62,083 |
| 3+ Earners | 57 (13.2%) | $95,938 |
| Total | 432 (100.0%) | $69,444 |
Household Income in French Lick
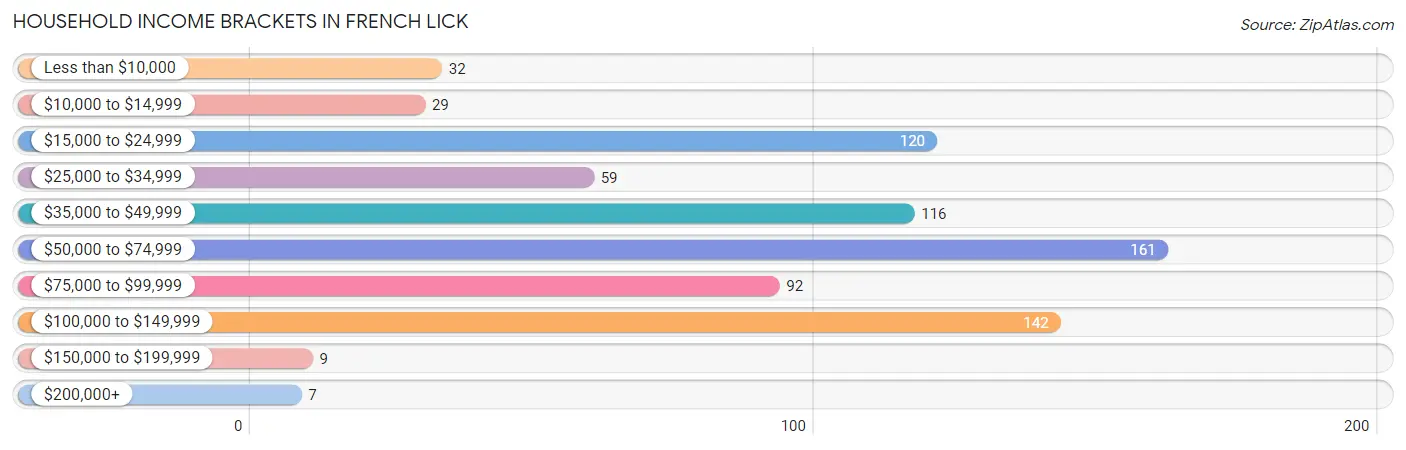
Household Income Brackets in French Lick
With 161 households falling in the category, the $50,000 to $74,999 income range is the most frequent in French Lick, accounting for 21.0% of all households. In contrast, only 7 households (0.9%) fall into the $200,000+ income bracket, making it the least populous group.
| Income Bracket | # Households | % Households |
| Less than $10,000 | 32 | 4.2% |
| $10,000 to $14,999 | 29 | 3.8% |
| $15,000 to $24,999 | 120 | 15.6% |
| $25,000 to $34,999 | 59 | 7.7% |
| $35,000 to $49,999 | 116 | 15.1% |
| $50,000 to $74,999 | 161 | 21.0% |
| $75,000 to $99,999 | 92 | 12.0% |
| $100,000 to $149,999 | 142 | 18.5% |
| $150,000 to $199,999 | 9 | 1.2% |
| $200,000+ | 7 | 0.9% |
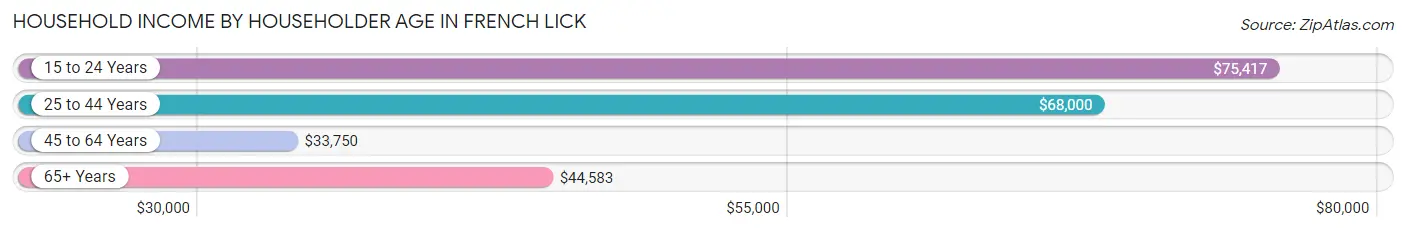
Household Income by Householder Age in French Lick
The median household income in French Lick is $55,074, with the highest median household income of $75,417 found in the 15 to 24 years age bracket for the primary householder. A total of 19 households (2.5%) fall into this category. Meanwhile, the 45 to 64 years age bracket for the primary householder has the lowest median household income of $33,750, with 151 households (19.7%) in this group.
| Income Bracket | # Households | Median Income |
| 15 to 24 Years | 19 (2.5%) | $75,417 |
| 25 to 44 Years | 346 (45.1%) | $68,000 |
| 45 to 64 Years | 151 (19.7%) | $33,750 |
| 65+ Years | 251 (32.7%) | $44,583 |
| Total | 767 (100.0%) | $55,074 |
Poverty in French Lick
Income Below Poverty by Sex and Age in French Lick
With 7.4% poverty level for males and 13.0% for females among the residents of French Lick, 55 to 64 year old males and 5 year old females are the most vulnerable to poverty, with 19 males (26.0%) and 2 females (100.0%) in their respective age groups living below the poverty level.
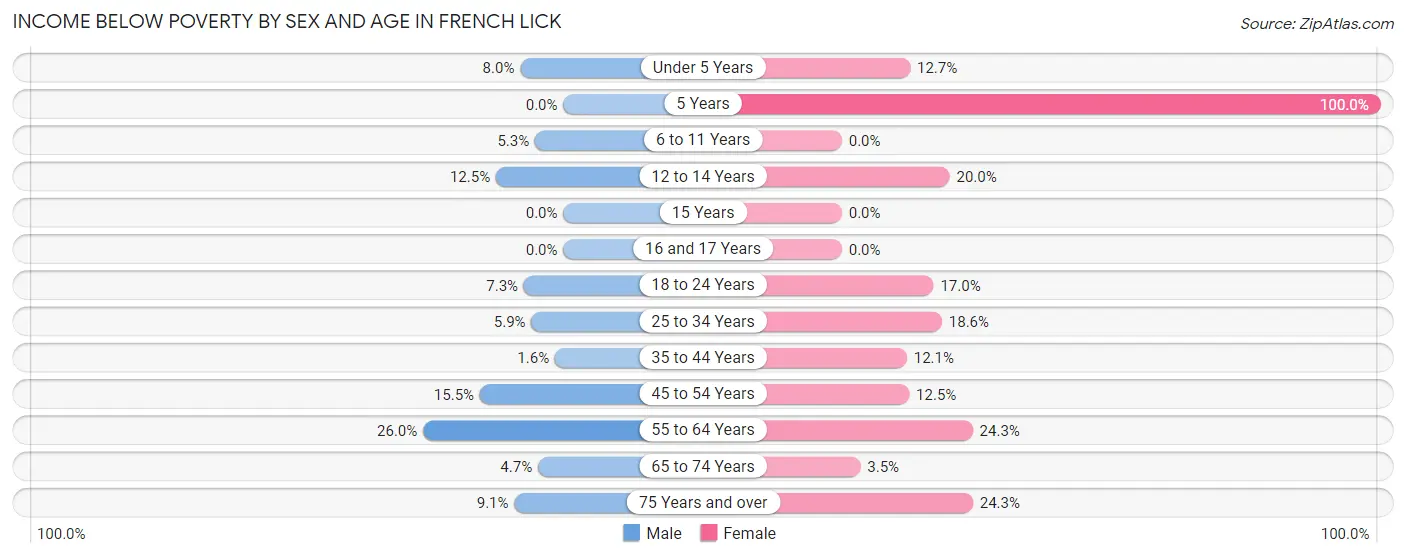
| Age Bracket | Male | Female |
| Under 5 Years | 4 (8.0%) | 10 (12.7%) |
| 5 Years | 0 (0.0%) | 2 (100.0%) |
| 6 to 11 Years | 5 (5.3%) | 0 (0.0%) |
| 12 to 14 Years | 2 (12.5%) | 4 (20.0%) |
| 15 Years | 0 (0.0%) | 0 (0.0%) |
| 16 and 17 Years | 0 (0.0%) | 0 (0.0%) |
| 18 to 24 Years | 3 (7.3%) | 8 (17.0%) |
| 25 to 34 Years | 7 (5.9%) | 13 (18.6%) |
| 35 to 44 Years | 3 (1.5%) | 21 (12.1%) |
| 45 to 54 Years | 11 (15.5%) | 7 (12.5%) |
| 55 to 64 Years | 19 (26.0%) | 17 (24.3%) |
| 65 to 74 Years | 4 (4.7%) | 4 (3.5%) |
| 75 Years and over | 5 (9.1%) | 18 (24.3%) |
| Total | 63 (7.4%) | 104 (13.0%) |
Income Above Poverty by Sex and Age in French Lick
According to the poverty statistics in French Lick, males aged 5 years and females aged 6 to 11 years are the age groups that are most secure financially, with 100.0% of males and 100.0% of females in these age groups living above the poverty line.
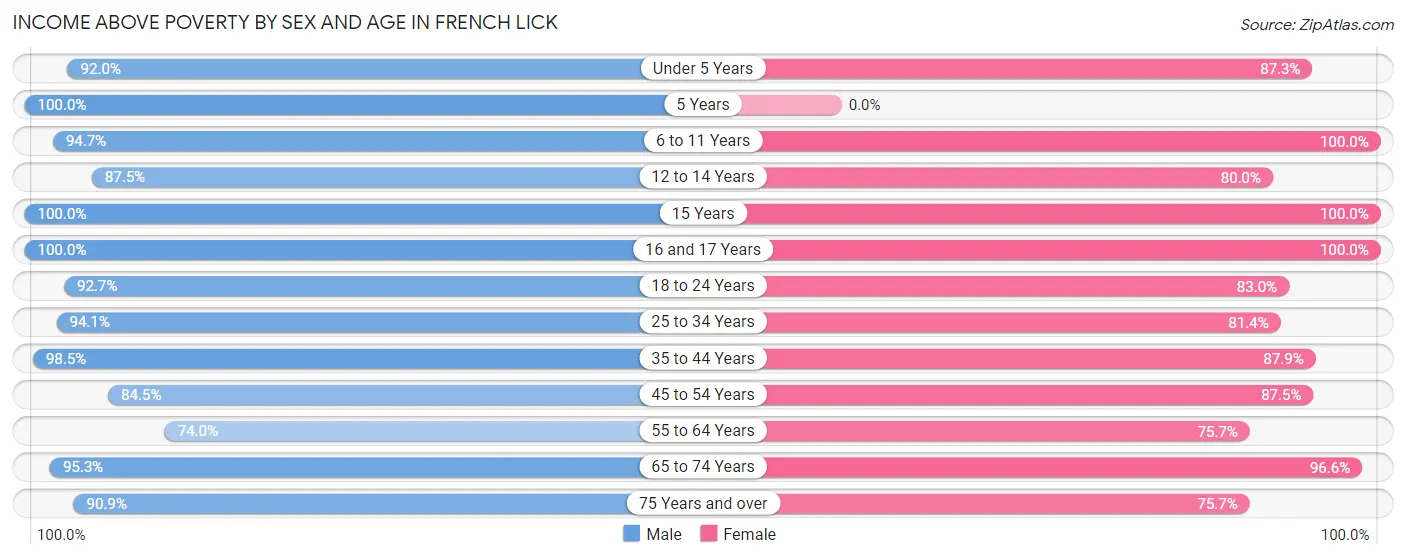
| Age Bracket | Male | Female |
| Under 5 Years | 46 (92.0%) | 69 (87.3%) |
| 5 Years | 3 (100.0%) | 0 (0.0%) |
| 6 to 11 Years | 90 (94.7%) | 51 (100.0%) |
| 12 to 14 Years | 14 (87.5%) | 16 (80.0%) |
| 15 Years | 3 (100.0%) | 29 (100.0%) |
| 16 and 17 Years | 49 (100.0%) | 12 (100.0%) |
| 18 to 24 Years | 38 (92.7%) | 39 (83.0%) |
| 25 to 34 Years | 111 (94.1%) | 57 (81.4%) |
| 35 to 44 Years | 190 (98.5%) | 153 (87.9%) |
| 45 to 54 Years | 60 (84.5%) | 49 (87.5%) |
| 55 to 64 Years | 54 (74.0%) | 53 (75.7%) |
| 65 to 74 Years | 81 (95.3%) | 112 (96.6%) |
| 75 Years and over | 50 (90.9%) | 56 (75.7%) |
| Total | 789 (92.6%) | 696 (87.0%) |
Income Below Poverty Among Married-Couple Families in French Lick
The poverty statistics for married-couple families in French Lick show that 2.3% or 5 of the total 219 families live below the poverty line. Families with no children have the highest poverty rate of 5.4%, comprising of 5 families. On the other hand, families with 1 or 2 children have the lowest poverty rate of 0.0%, which includes 0 families.
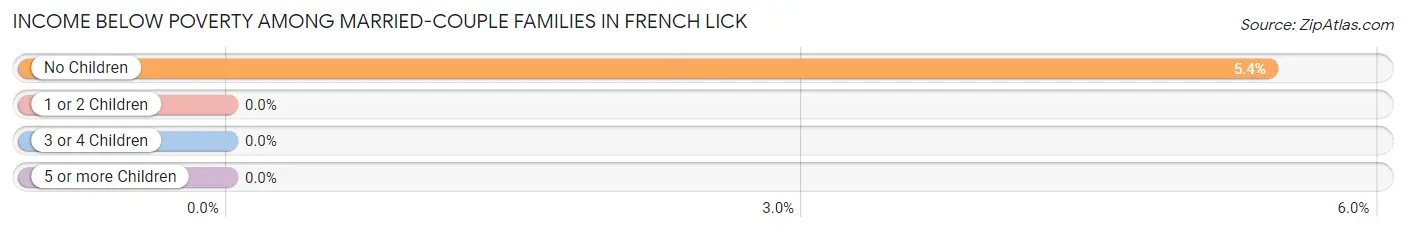
| Children | Above Poverty | Below Poverty |
| No Children | 87 (94.6%) | 5 (5.4%) |
| 1 or 2 Children | 104 (100.0%) | 0 (0.0%) |
| 3 or 4 Children | 23 (100.0%) | 0 (0.0%) |
| 5 or more Children | 0 (0.0%) | 0 (0.0%) |
| Total | 214 (97.7%) | 5 (2.3%) |
Income Below Poverty Among Single-Parent Households in French Lick
According to the poverty data in French Lick, 3.6% or 4 single-father households and 14.6% or 15 single-mother households are living below the poverty line. Among single-father households, those with 1 or 2 children have the highest poverty rate, with 4 households (3.8%) experiencing poverty. Likewise, among single-mother households, those with 3 or 4 children have the highest poverty rate, with 10 households (52.6%) falling below the poverty line.
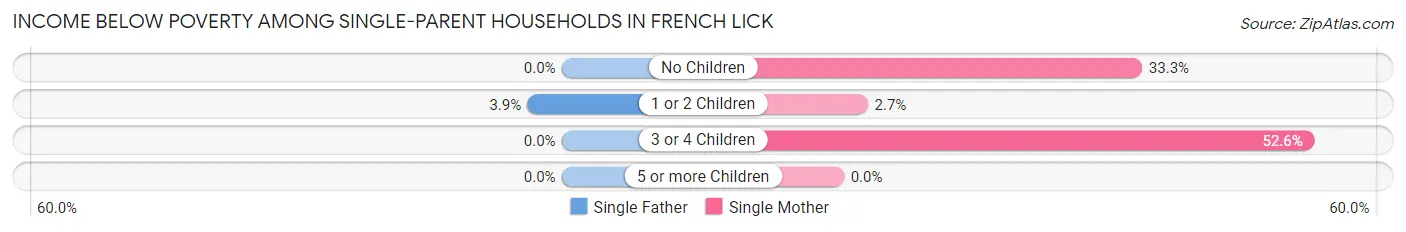
| Children | Single Father | Single Mother |
| No Children | 0 (0.0%) | 3 (33.3%) |
| 1 or 2 Children | 4 (3.8%) | 2 (2.7%) |
| 3 or 4 Children | 0 (0.0%) | 10 (52.6%) |
| 5 or more Children | 0 (0.0%) | 0 (0.0%) |
| Total | 4 (3.6%) | 15 (14.6%) |
Income Below Poverty Among Married-Couple vs Single-Parent Households in French Lick
The poverty data for French Lick shows that 5 of the married-couple family households (2.3%) and 19 of the single-parent households (8.9%) are living below the poverty level. Within the married-couple family households, those with no children have the highest poverty rate, with 5 households (5.4%) falling below the poverty line. Among the single-parent households, those with 3 or 4 children have the highest poverty rate, with 10 household (52.6%) living below poverty.
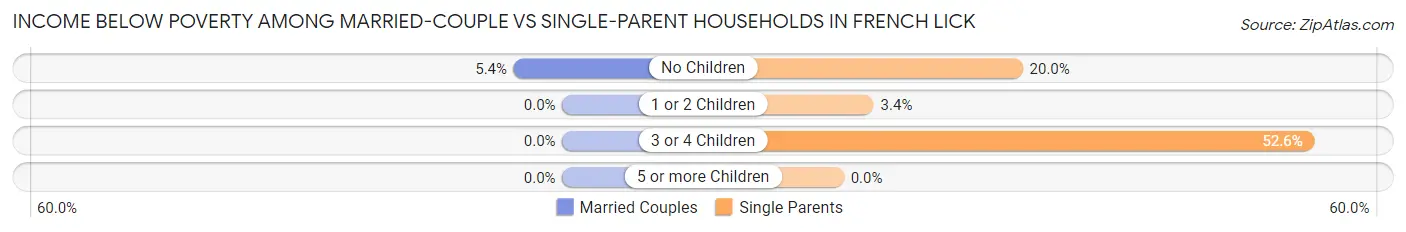
| Children | Married-Couple Families | Single-Parent Households |
| No Children | 5 (5.4%) | 3 (20.0%) |
| 1 or 2 Children | 0 (0.0%) | 6 (3.4%) |
| 3 or 4 Children | 0 (0.0%) | 10 (52.6%) |
| 5 or more Children | 0 (0.0%) | 0 (0.0%) |
| Total | 5 (2.3%) | 19 (8.9%) |
Employment Characteristics in French Lick
Employment by Class of Employer in French Lick
Among the 840 employed individuals in French Lick, private company employees (714 | 85.0%), local government employees (43 | 5.1%), and not-for-profit organizations (41 | 4.9%) make up the most common classes of employment.
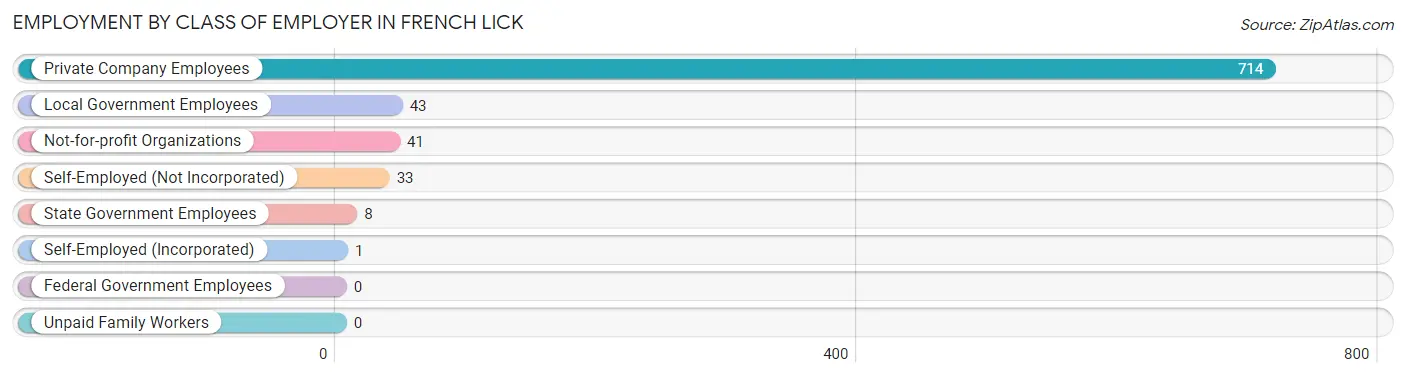
| Employer Class | # Employees | % Employees |
| Private Company Employees | 714 | 85.0% |
| Self-Employed (Incorporated) | 1 | 0.1% |
| Self-Employed (Not Incorporated) | 33 | 3.9% |
| Not-for-profit Organizations | 41 | 4.9% |
| Local Government Employees | 43 | 5.1% |
| State Government Employees | 8 | 0.9% |
| Federal Government Employees | 0 | 0.0% |
| Unpaid Family Workers | 0 | 0.0% |
| Total | 840 | 100.0% |
Employment Status by Age in French Lick
According to the labor force statistics for French Lick, out of the total population over 16 years of age (1,385), 62.8% or 870 individuals are in the labor force, with 1.0% or 9 of them unemployed. The age group with the highest labor force participation rate is 25 to 29 years, with 95.1% or 78 individuals in the labor force. Within the labor force, the 25 to 29 years age range has the highest percentage of unemployed individuals, with 9.0% or 7 of them being unemployed.
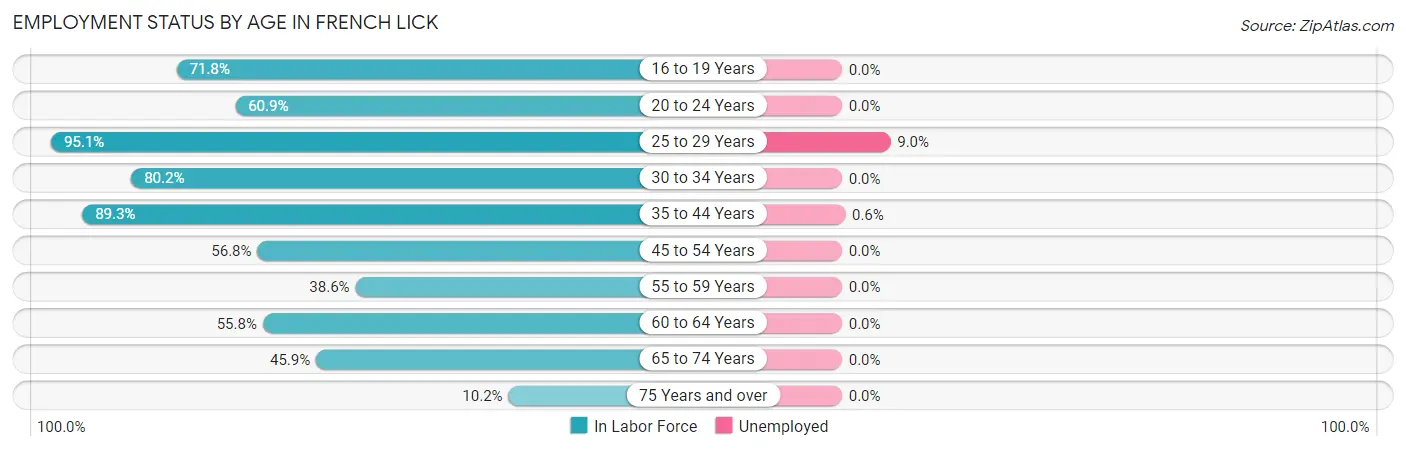
| Age Bracket | In Labor Force | Unemployed |
| 16 to 19 Years | 74 (71.8%) | 0 (0.0%) |
| 20 to 24 Years | 28 (60.9%) | 0 (0.0%) |
| 25 to 29 Years | 78 (95.1%) | 7 (9.0%) |
| 30 to 34 Years | 85 (80.2%) | 0 (0.0%) |
| 35 to 44 Years | 333 (89.3%) | 2 (0.6%) |
| 45 to 54 Years | 75 (56.8%) | 0 (0.0%) |
| 55 to 59 Years | 17 (38.6%) | 0 (0.0%) |
| 60 to 64 Years | 58 (55.8%) | 0 (0.0%) |
| 65 to 74 Years | 105 (45.9%) | 0 (0.0%) |
| 75 Years and over | 17 (10.2%) | 0 (0.0%) |
| Total | 870 (62.8%) | 9 (1.0%) |
Employment Status by Educational Attainment in French Lick
According to labor force statistics for French Lick, 76.8% of individuals (646) out of the total population between 25 and 64 years of age (841) are in the labor force, with 1.4% or 9 of them being unemployed. The group with the highest labor force participation rate are those with the educational attainment of bachelor's degree or higher, with 92.4% or 85 individuals in the labor force. Within the labor force, individuals with less than high school education have the highest percentage of unemployment, with 3.9% or 2 of them being unemployed.
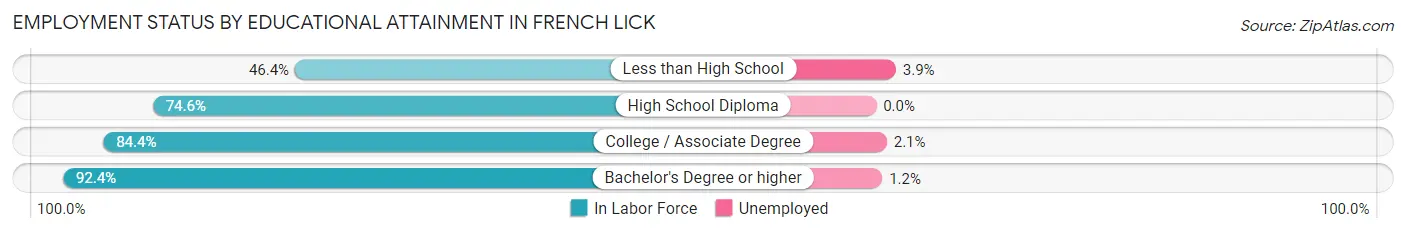
| Educational Attainment | In Labor Force | Unemployed |
| Less than High School | 51 (46.4%) | 4 (3.9%) |
| High School Diploma | 223 (74.6%) | 0 (0.0%) |
| College / Associate Degree | 287 (84.4%) | 7 (2.1%) |
| Bachelor's Degree or higher | 85 (92.4%) | 1 (1.2%) |
| Total | 646 (76.8%) | 12 (1.4%) |
Employment Occupations by Sex in French Lick
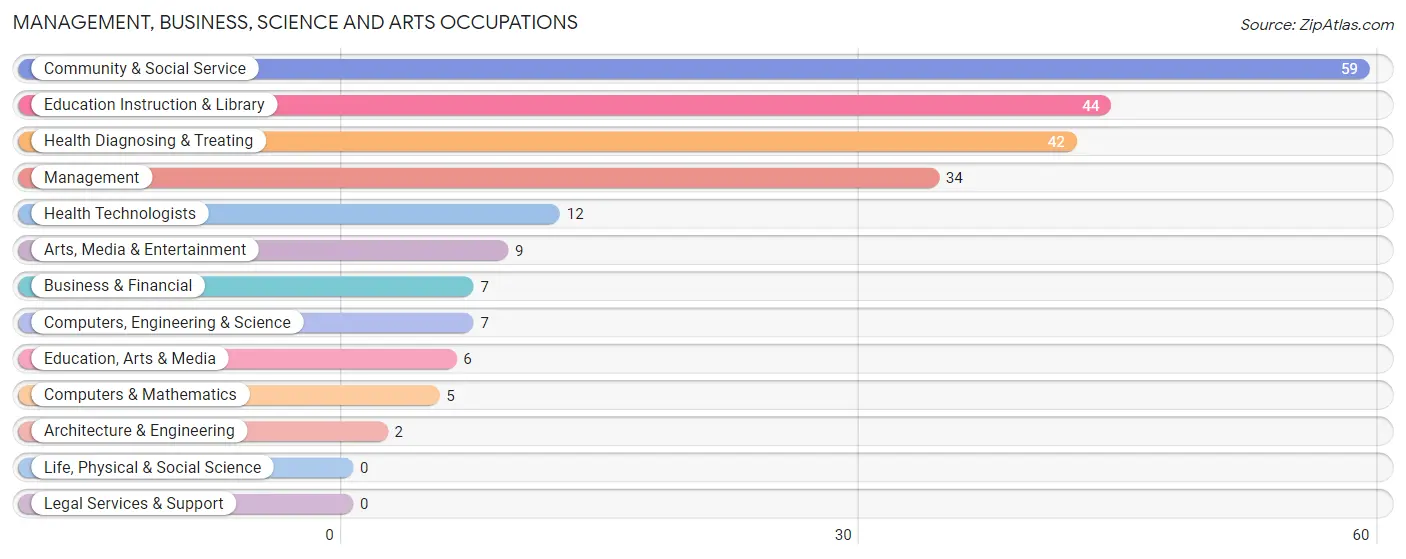
Management, Business, Science and Arts Occupations
The most common Management, Business, Science and Arts occupations in French Lick are Community & Social Service (59 | 6.9%), Education Instruction & Library (44 | 5.1%), Health Diagnosing & Treating (42 | 4.9%), Management (34 | 4.0%), and Health Technologists (12 | 1.4%).
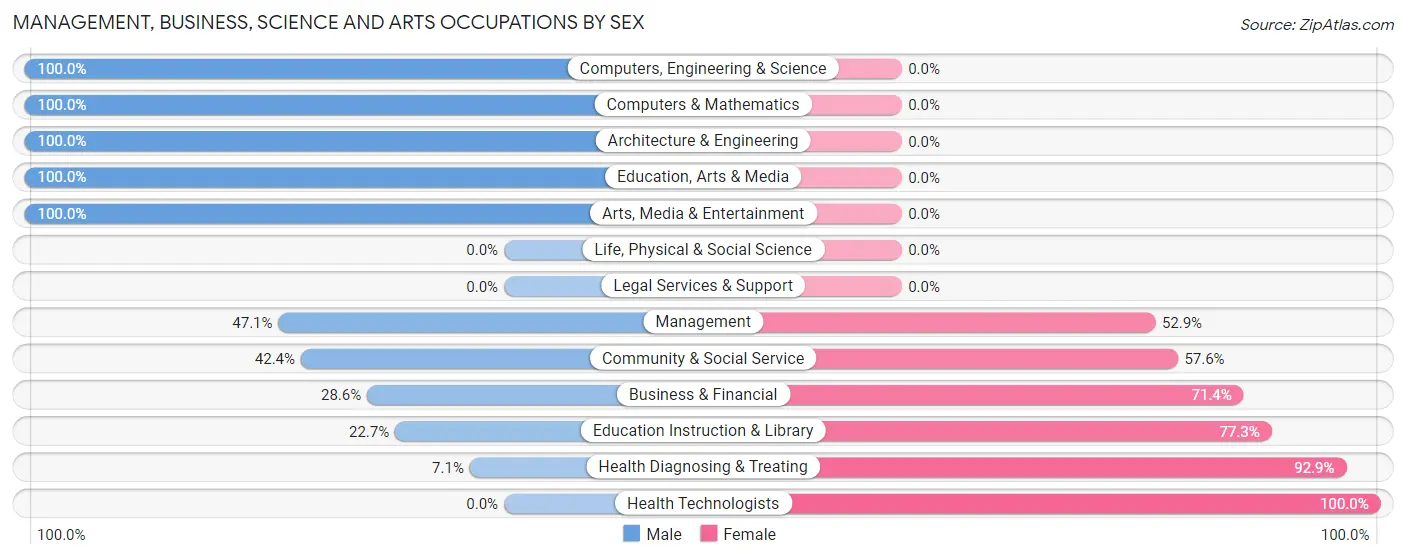
Management, Business, Science and Arts Occupations by Sex
Within the Management, Business, Science and Arts occupations in French Lick, the most male-oriented occupations are Computers, Engineering & Science (100.0%), Computers & Mathematics (100.0%), and Architecture & Engineering (100.0%), while the most female-oriented occupations are Health Technologists (100.0%), Health Diagnosing & Treating (92.9%), and Education Instruction & Library (77.3%).
| Occupation | Male | Female |
| Management | 16 (47.1%) | 18 (52.9%) |
| Business & Financial | 2 (28.6%) | 5 (71.4%) |
| Computers, Engineering & Science | 7 (100.0%) | 0 (0.0%) |
| Computers & Mathematics | 5 (100.0%) | 0 (0.0%) |
| Architecture & Engineering | 2 (100.0%) | 0 (0.0%) |
| Life, Physical & Social Science | 0 (0.0%) | 0 (0.0%) |
| Community & Social Service | 25 (42.4%) | 34 (57.6%) |
| Education, Arts & Media | 6 (100.0%) | 0 (0.0%) |
| Legal Services & Support | 0 (0.0%) | 0 (0.0%) |
| Education Instruction & Library | 10 (22.7%) | 34 (77.3%) |
| Arts, Media & Entertainment | 9 (100.0%) | 0 (0.0%) |
| Health Diagnosing & Treating | 3 (7.1%) | 39 (92.9%) |
| Health Technologists | 0 (0.0%) | 12 (100.0%) |
| Total (Category) | 53 (35.6%) | 96 (64.4%) |
| Total (Overall) | 448 (52.0%) | 413 (48.0%) |
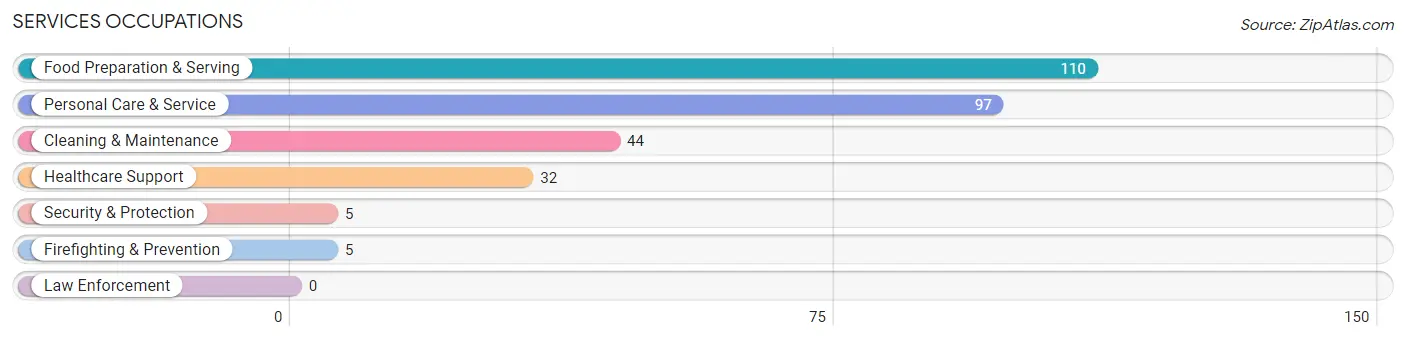
Services Occupations
The most common Services occupations in French Lick are Food Preparation & Serving (110 | 12.8%), Personal Care & Service (97 | 11.3%), Cleaning & Maintenance (44 | 5.1%), Healthcare Support (32 | 3.7%), and Security & Protection (5 | 0.6%).
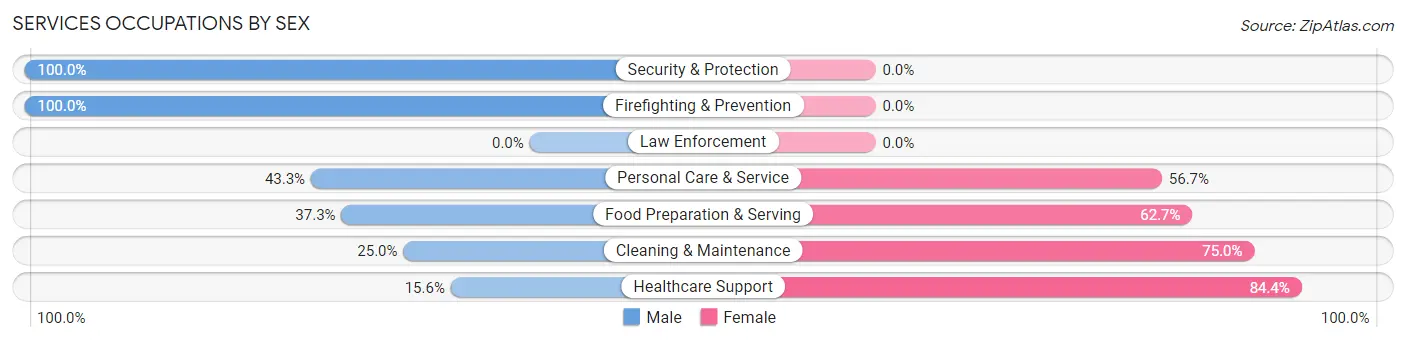
Services Occupations by Sex
Within the Services occupations in French Lick, the most male-oriented occupations are Security & Protection (100.0%), Firefighting & Prevention (100.0%), and Personal Care & Service (43.3%), while the most female-oriented occupations are Healthcare Support (84.4%), Cleaning & Maintenance (75.0%), and Food Preparation & Serving (62.7%).
| Occupation | Male | Female |
| Healthcare Support | 5 (15.6%) | 27 (84.4%) |
| Security & Protection | 5 (100.0%) | 0 (0.0%) |
| Firefighting & Prevention | 5 (100.0%) | 0 (0.0%) |
| Law Enforcement | 0 (0.0%) | 0 (0.0%) |
| Food Preparation & Serving | 41 (37.3%) | 69 (62.7%) |
| Cleaning & Maintenance | 11 (25.0%) | 33 (75.0%) |
| Personal Care & Service | 42 (43.3%) | 55 (56.7%) |
| Total (Category) | 104 (36.1%) | 184 (63.9%) |
| Total (Overall) | 448 (52.0%) | 413 (48.0%) |
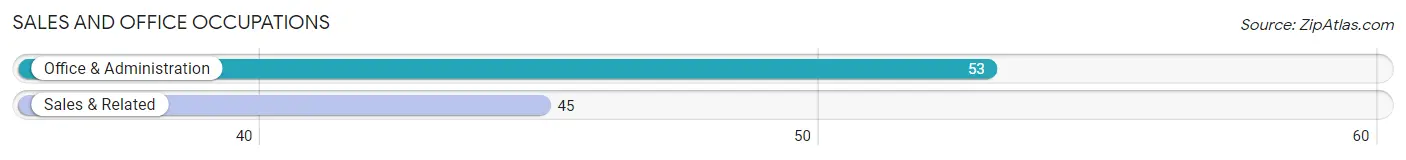
Sales and Office Occupations
The most common Sales and Office occupations in French Lick are Office & Administration (53 | 6.2%), and Sales & Related (45 | 5.2%).
Sales and Office Occupations by Sex
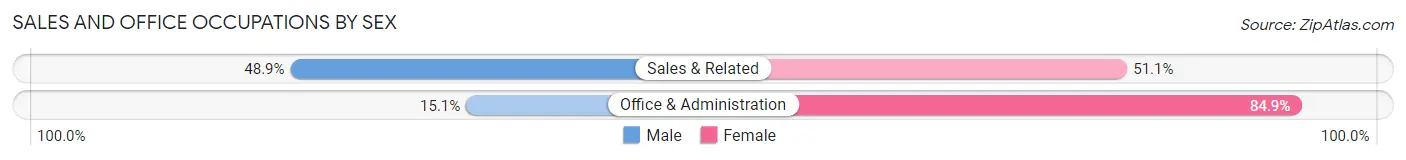
| Occupation | Male | Female |
| Sales & Related | 22 (48.9%) | 23 (51.1%) |
| Office & Administration | 8 (15.1%) | 45 (84.9%) |
| Total (Category) | 30 (30.6%) | 68 (69.4%) |
| Total (Overall) | 448 (52.0%) | 413 (48.0%) |
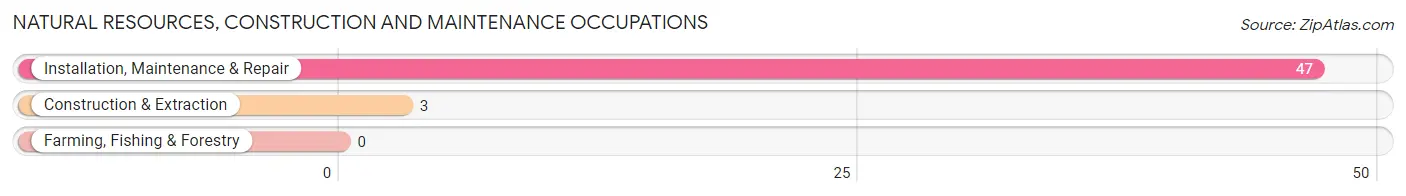
Natural Resources, Construction and Maintenance Occupations
The most common Natural Resources, Construction and Maintenance occupations in French Lick are Installation, Maintenance & Repair (47 | 5.5%), and Construction & Extraction (3 | 0.4%).
Natural Resources, Construction and Maintenance Occupations by Sex
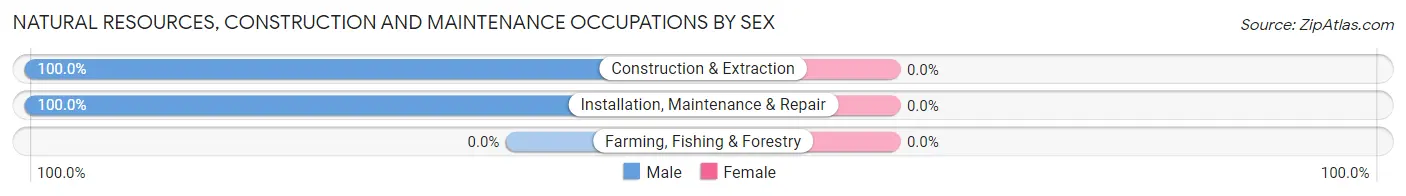
| Occupation | Male | Female |
| Farming, Fishing & Forestry | 0 (0.0%) | 0 (0.0%) |
| Construction & Extraction | 3 (100.0%) | 0 (0.0%) |
| Installation, Maintenance & Repair | 47 (100.0%) | 0 (0.0%) |
| Total (Category) | 50 (100.0%) | 0 (0.0%) |
| Total (Overall) | 448 (52.0%) | 413 (48.0%) |
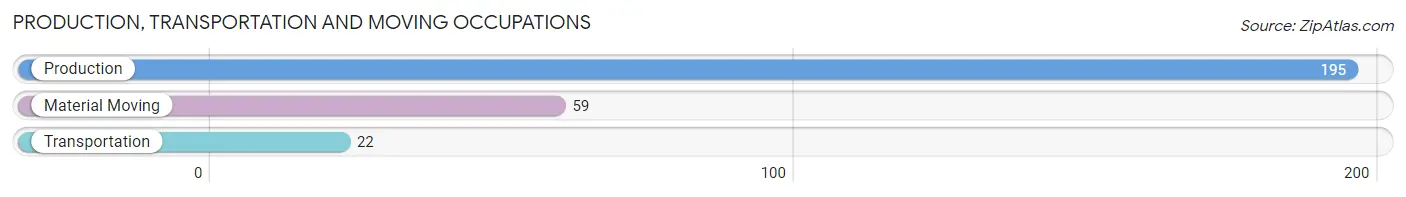
Production, Transportation and Moving Occupations
The most common Production, Transportation and Moving occupations in French Lick are Production (195 | 22.7%), Material Moving (59 | 6.9%), and Transportation (22 | 2.6%).
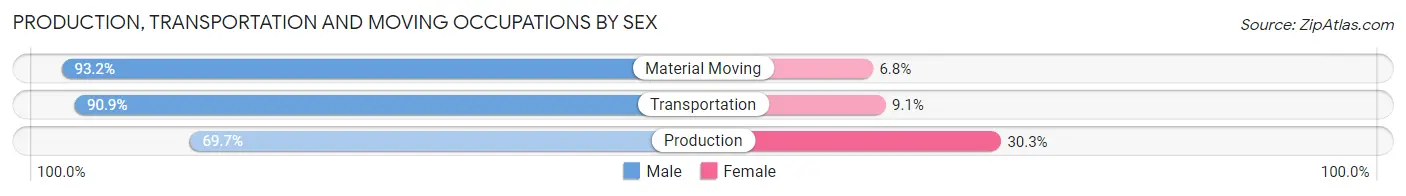
Production, Transportation and Moving Occupations by Sex
| Occupation | Male | Female |
| Production | 136 (69.7%) | 59 (30.3%) |
| Transportation | 20 (90.9%) | 2 (9.1%) |
| Material Moving | 55 (93.2%) | 4 (6.8%) |
| Total (Category) | 211 (76.4%) | 65 (23.5%) |
| Total (Overall) | 448 (52.0%) | 413 (48.0%) |
Employment Industries by Sex in French Lick
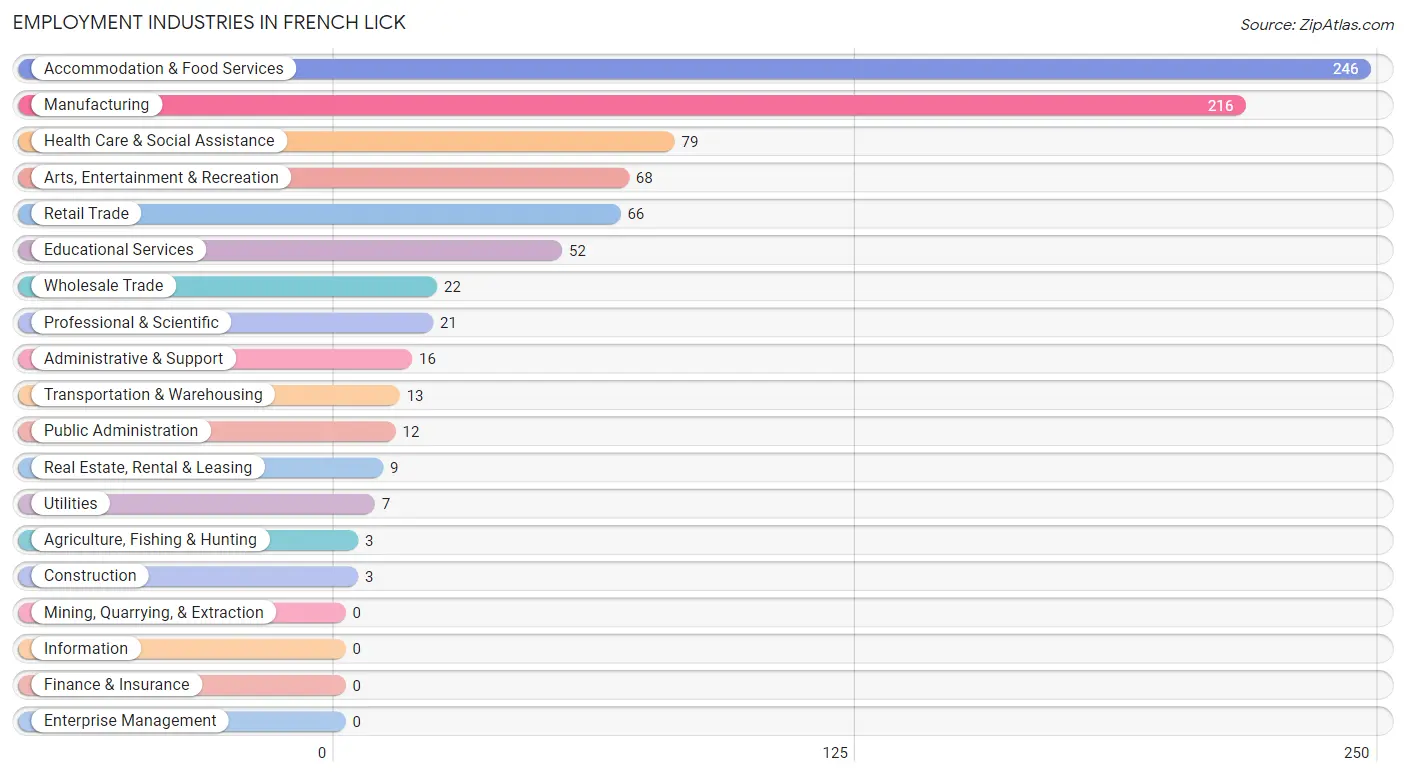
Employment Industries in French Lick
The major employment industries in French Lick include Accommodation & Food Services (246 | 28.6%), Manufacturing (216 | 25.1%), Health Care & Social Assistance (79 | 9.2%), Arts, Entertainment & Recreation (68 | 7.9%), and Retail Trade (66 | 7.7%).
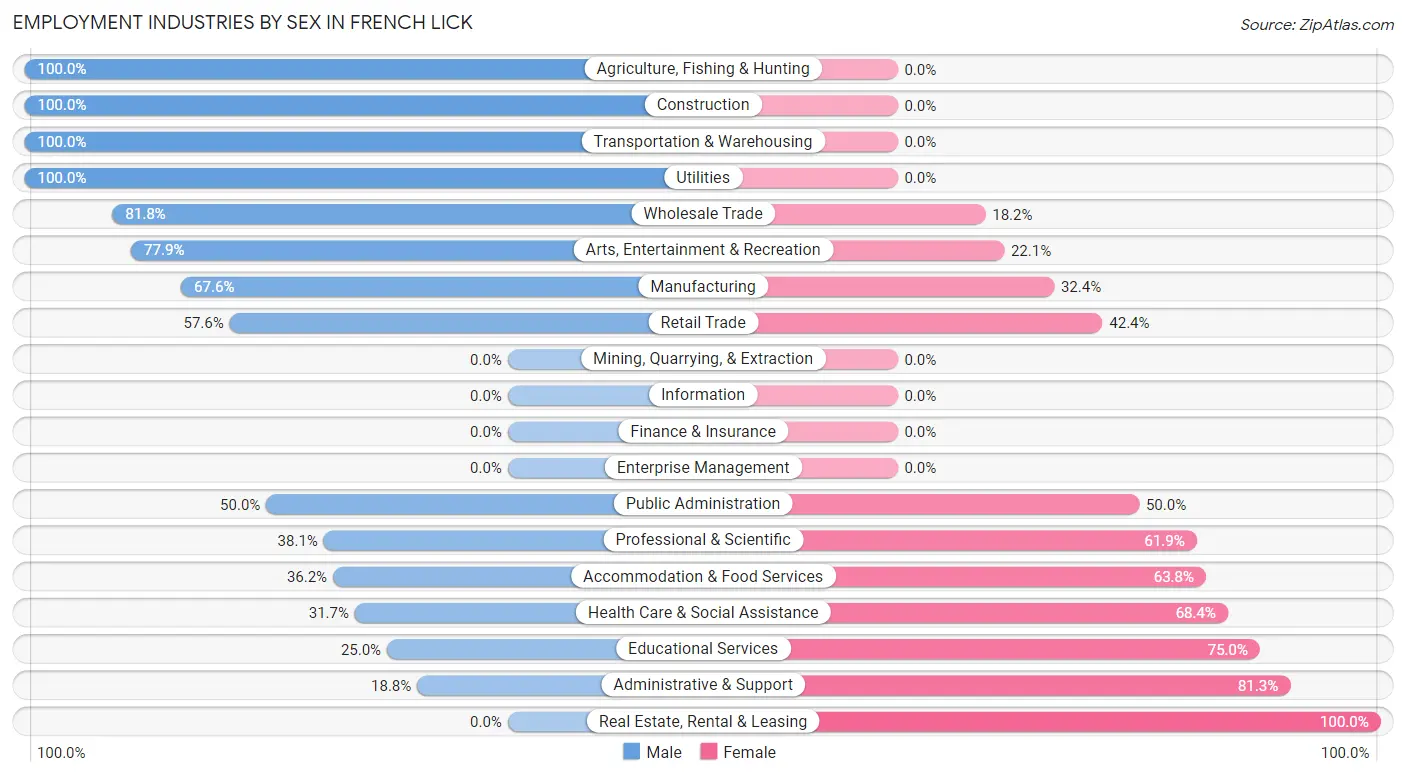
Employment Industries by Sex in French Lick
The French Lick industries that see more men than women are Agriculture, Fishing & Hunting (100.0%), Construction (100.0%), and Transportation & Warehousing (100.0%), whereas the industries that tend to have a higher number of women are Real Estate, Rental & Leasing (100.0%), Administrative & Support (81.2%), and Educational Services (75.0%).
| Industry | Male | Female |
| Agriculture, Fishing & Hunting | 3 (100.0%) | 0 (0.0%) |
| Mining, Quarrying, & Extraction | 0 (0.0%) | 0 (0.0%) |
| Construction | 3 (100.0%) | 0 (0.0%) |
| Manufacturing | 146 (67.6%) | 70 (32.4%) |
| Wholesale Trade | 18 (81.8%) | 4 (18.2%) |
| Retail Trade | 38 (57.6%) | 28 (42.4%) |
| Transportation & Warehousing | 13 (100.0%) | 0 (0.0%) |
| Utilities | 7 (100.0%) | 0 (0.0%) |
| Information | 0 (0.0%) | 0 (0.0%) |
| Finance & Insurance | 0 (0.0%) | 0 (0.0%) |
| Real Estate, Rental & Leasing | 0 (0.0%) | 9 (100.0%) |
| Professional & Scientific | 8 (38.1%) | 13 (61.9%) |
| Enterprise Management | 0 (0.0%) | 0 (0.0%) |
| Administrative & Support | 3 (18.8%) | 13 (81.2%) |
| Educational Services | 13 (25.0%) | 39 (75.0%) |
| Health Care & Social Assistance | 25 (31.7%) | 54 (68.3%) |
| Arts, Entertainment & Recreation | 53 (77.9%) | 15 (22.1%) |
| Accommodation & Food Services | 89 (36.2%) | 157 (63.8%) |
| Public Administration | 6 (50.0%) | 6 (50.0%) |
| Total | 448 (52.0%) | 413 (48.0%) |
Education in French Lick
School Enrollment in French Lick
The most common levels of schooling among the 339 students in French Lick are high school (99 | 29.2%), middle school (91 | 26.8%), and elementary school (72 | 21.2%).
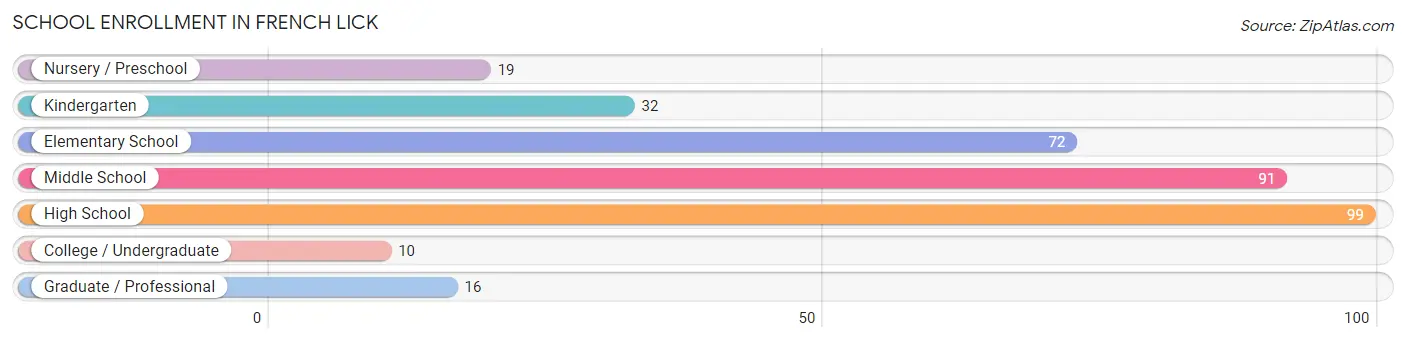
| School Level | # Students | % Students |
| Nursery / Preschool | 19 | 5.6% |
| Kindergarten | 32 | 9.4% |
| Elementary School | 72 | 21.2% |
| Middle School | 91 | 26.8% |
| High School | 99 | 29.2% |
| College / Undergraduate | 10 | 2.9% |
| Graduate / Professional | 16 | 4.7% |
| Total | 339 | 100.0% |
School Enrollment by Age by Funding Source in French Lick
Out of a total of 339 students who are enrolled in schools in French Lick, 29 (8.6%) attend a private institution, while the remaining 310 (91.4%) are enrolled in public schools. The age group of 5 to 9 year old has the highest likelihood of being enrolled in private schools, with 24 (24.7% in the age bracket) enrolled. Conversely, the age group of 15 to 17 year olds has the lowest likelihood of being enrolled in a private school, with 79 (100.0% in the age bracket) attending a public institution.
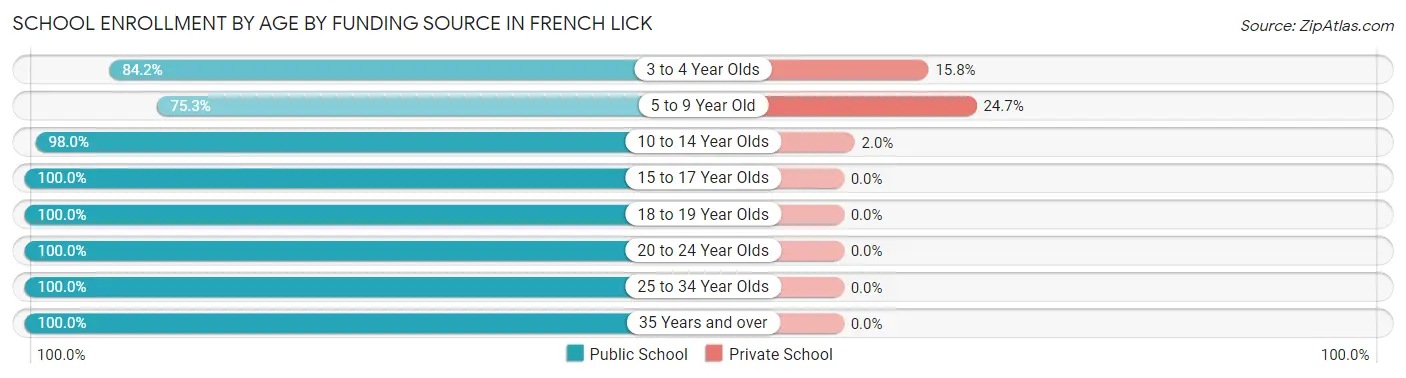
| Age Bracket | Public School | Private School |
| 3 to 4 Year Olds | 16 (84.2%) | 3 (15.8%) |
| 5 to 9 Year Old | 73 (75.3%) | 24 (24.7%) |
| 10 to 14 Year Olds | 96 (98.0%) | 2 (2.0%) |
| 15 to 17 Year Olds | 79 (100.0%) | 0 (0.0%) |
| 18 to 19 Year Olds | 20 (100.0%) | 0 (0.0%) |
| 20 to 24 Year Olds | 3 (100.0%) | 0 (0.0%) |
| 25 to 34 Year Olds | 3 (100.0%) | 0 (0.0%) |
| 35 Years and over | 20 (100.0%) | 0 (0.0%) |
| Total | 310 (91.4%) | 29 (8.6%) |
Educational Attainment by Field of Study in French Lick
Education (58 | 40.3%), science & technology (16 | 11.1%), psychology (13 | 9.0%), bio, nature & agricultural (11 | 7.6%), and physical & health sciences (10 | 6.9%) are the most common fields of study among 144 individuals in French Lick who have obtained a bachelor's degree or higher.
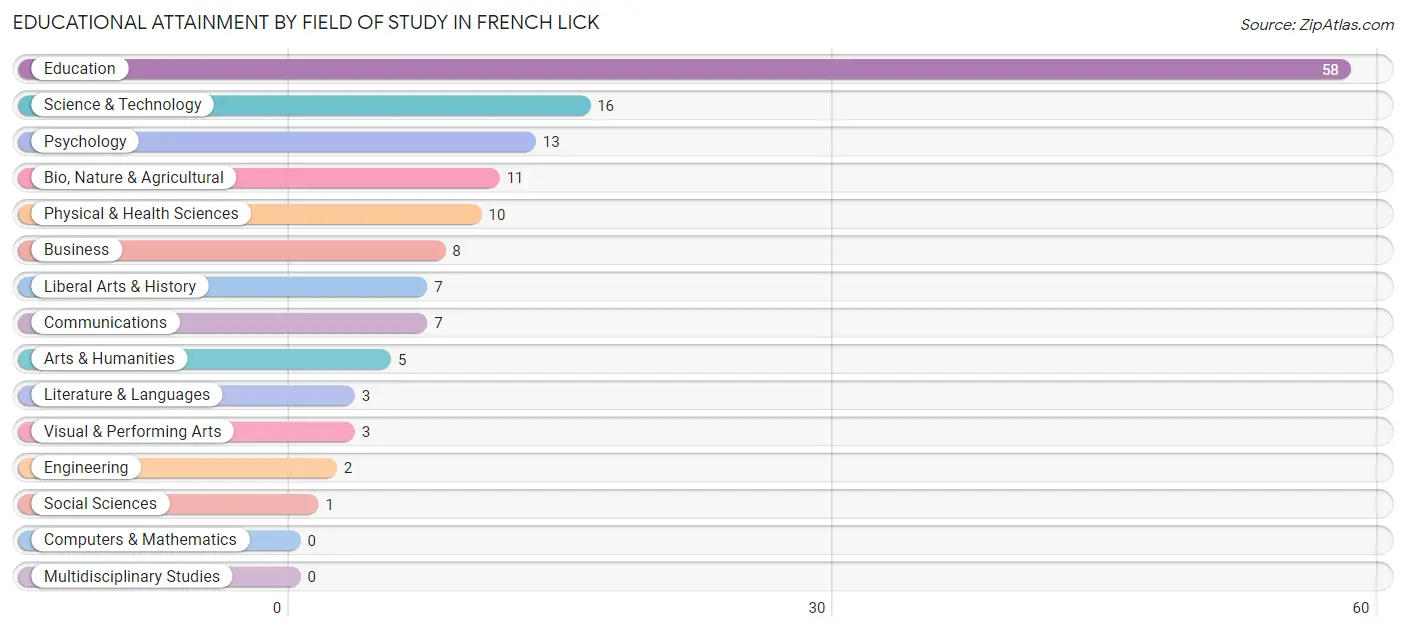
| Field of Study | # Graduates | % Graduates |
| Computers & Mathematics | 0 | 0.0% |
| Bio, Nature & Agricultural | 11 | 7.6% |
| Physical & Health Sciences | 10 | 6.9% |
| Psychology | 13 | 9.0% |
| Social Sciences | 1 | 0.7% |
| Engineering | 2 | 1.4% |
| Multidisciplinary Studies | 0 | 0.0% |
| Science & Technology | 16 | 11.1% |
| Business | 8 | 5.6% |
| Education | 58 | 40.3% |
| Literature & Languages | 3 | 2.1% |
| Liberal Arts & History | 7 | 4.9% |
| Visual & Performing Arts | 3 | 2.1% |
| Communications | 7 | 4.9% |
| Arts & Humanities | 5 | 3.5% |
| Total | 144 | 100.0% |
Transportation & Commute in French Lick
Vehicle Availability by Sex in French Lick
The most prevalent vehicle ownership categories in French Lick are males with 2 vehicles (231, accounting for 52.9%) and females with 2 vehicles (183, making up 57.3%).
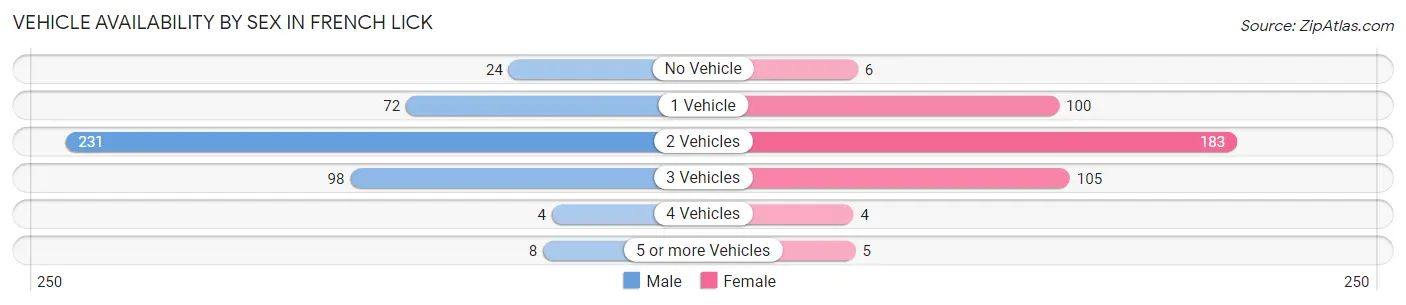
| Vehicles Available | Male | Female |
| No Vehicle | 24 (5.5%) | 6 (1.5%) |
| 1 Vehicle | 72 (16.5%) | 100 (24.8%) |
| 2 Vehicles | 231 (52.9%) | 183 (45.4%) |
| 3 Vehicles | 98 (22.4%) | 105 (26.1%) |
| 4 Vehicles | 4 (0.9%) | 4 (1.0%) |
| 5 or more Vehicles | 8 (1.8%) | 5 (1.2%) |
| Total | 437 (100.0%) | 403 (100.0%) |
Commute Time in French Lick
The most frequently occuring commute durations in French Lick are 5 to 9 minutes (299 commuters, 35.9%), less than 5 minutes (157 commuters, 18.9%), and 10 to 14 minutes (81 commuters, 9.7%).
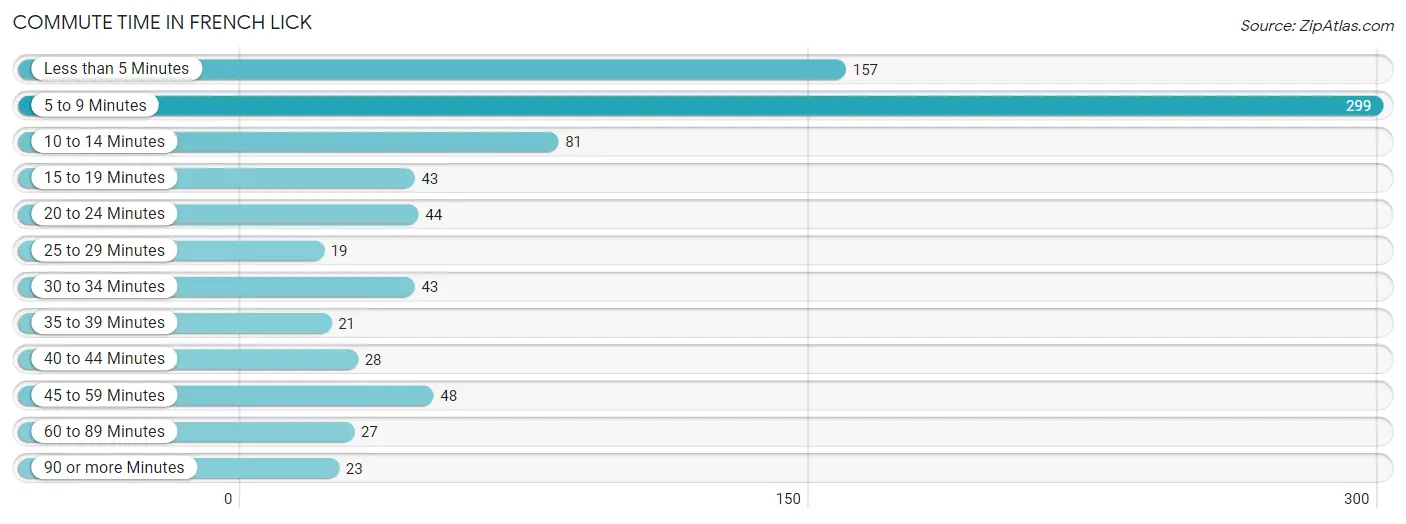
| Commute Time | # Commuters | % Commuters |
| Less than 5 Minutes | 157 | 18.9% |
| 5 to 9 Minutes | 299 | 35.9% |
| 10 to 14 Minutes | 81 | 9.7% |
| 15 to 19 Minutes | 43 | 5.2% |
| 20 to 24 Minutes | 44 | 5.3% |
| 25 to 29 Minutes | 19 | 2.3% |
| 30 to 34 Minutes | 43 | 5.2% |
| 35 to 39 Minutes | 21 | 2.5% |
| 40 to 44 Minutes | 28 | 3.4% |
| 45 to 59 Minutes | 48 | 5.8% |
| 60 to 89 Minutes | 27 | 3.2% |
| 90 or more Minutes | 23 | 2.8% |
Commute Time by Sex in French Lick
The most common commute times in French Lick are 5 to 9 minutes (126 commuters, 28.9%) for males and 5 to 9 minutes (173 commuters, 43.6%) for females.
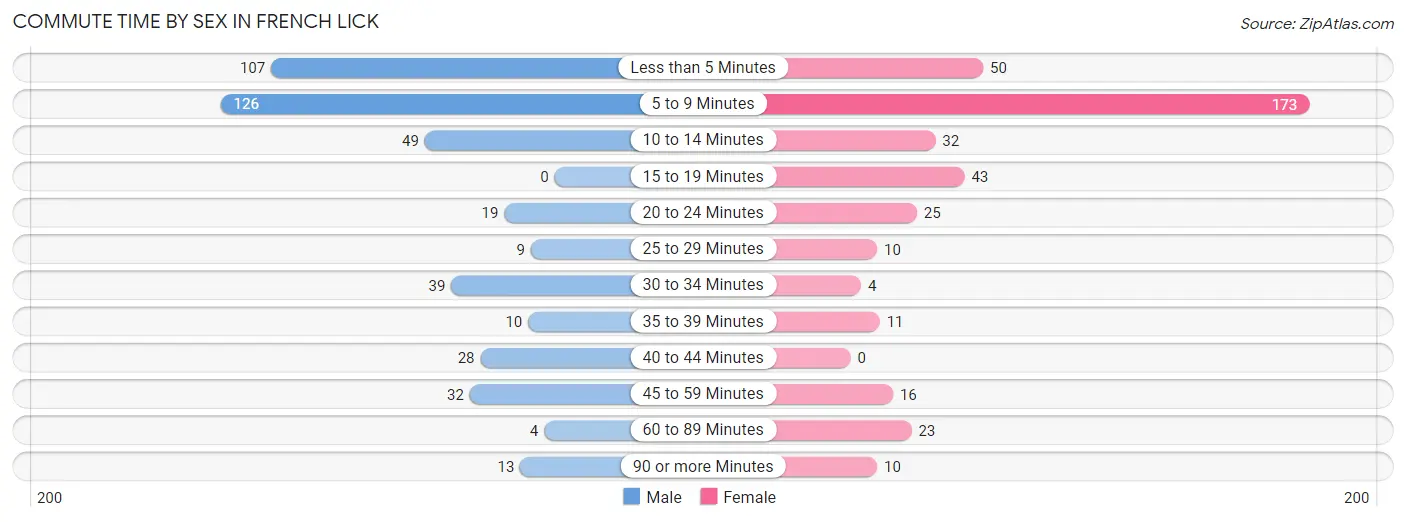
| Commute Time | Male | Female |
| Less than 5 Minutes | 107 (24.5%) | 50 (12.6%) |
| 5 to 9 Minutes | 126 (28.9%) | 173 (43.6%) |
| 10 to 14 Minutes | 49 (11.2%) | 32 (8.1%) |
| 15 to 19 Minutes | 0 (0.0%) | 43 (10.8%) |
| 20 to 24 Minutes | 19 (4.4%) | 25 (6.3%) |
| 25 to 29 Minutes | 9 (2.1%) | 10 (2.5%) |
| 30 to 34 Minutes | 39 (8.9%) | 4 (1.0%) |
| 35 to 39 Minutes | 10 (2.3%) | 11 (2.8%) |
| 40 to 44 Minutes | 28 (6.4%) | 0 (0.0%) |
| 45 to 59 Minutes | 32 (7.3%) | 16 (4.0%) |
| 60 to 89 Minutes | 4 (0.9%) | 23 (5.8%) |
| 90 or more Minutes | 13 (3.0%) | 10 (2.5%) |
Time of Departure to Work by Sex in French Lick
The most frequent times of departure to work in French Lick are 12:00 AM to 4:59 AM (82, 18.8%) for males and 4:00 PM to 11:59 PM (81, 20.4%) for females.
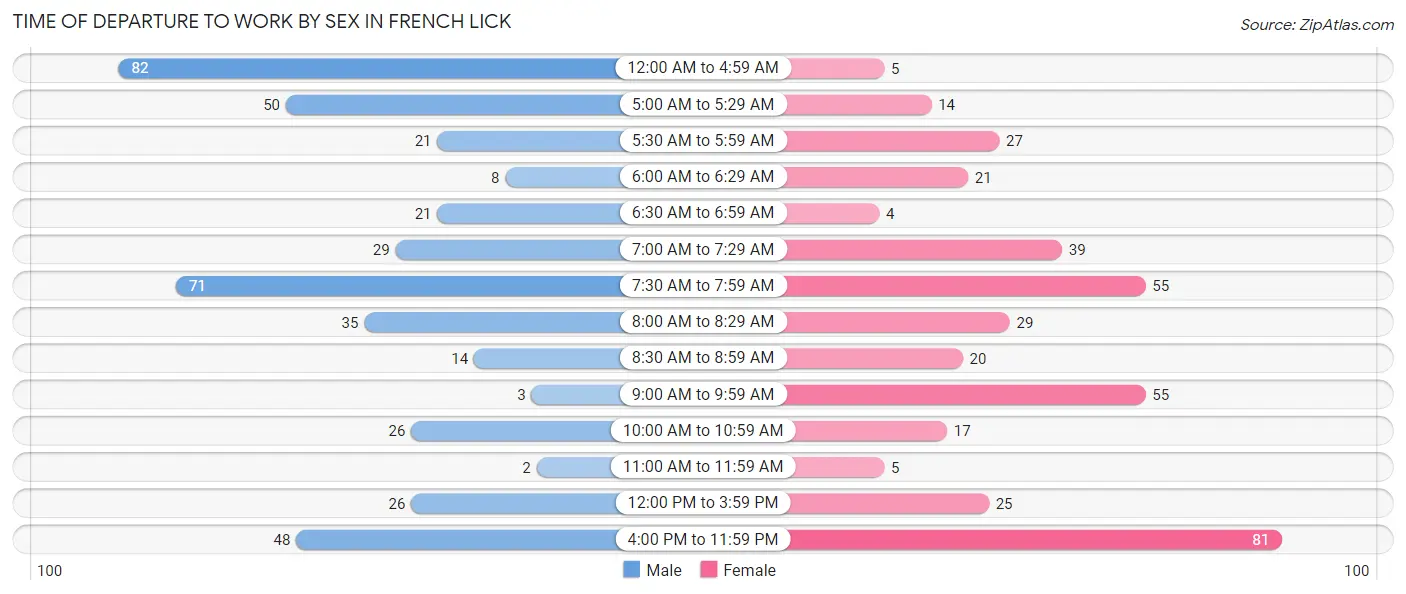
| Time of Departure | Male | Female |
| 12:00 AM to 4:59 AM | 82 (18.8%) | 5 (1.3%) |
| 5:00 AM to 5:29 AM | 50 (11.5%) | 14 (3.5%) |
| 5:30 AM to 5:59 AM | 21 (4.8%) | 27 (6.8%) |
| 6:00 AM to 6:29 AM | 8 (1.8%) | 21 (5.3%) |
| 6:30 AM to 6:59 AM | 21 (4.8%) | 4 (1.0%) |
| 7:00 AM to 7:29 AM | 29 (6.7%) | 39 (9.8%) |
| 7:30 AM to 7:59 AM | 71 (16.3%) | 55 (13.9%) |
| 8:00 AM to 8:29 AM | 35 (8.0%) | 29 (7.3%) |
| 8:30 AM to 8:59 AM | 14 (3.2%) | 20 (5.0%) |
| 9:00 AM to 9:59 AM | 3 (0.7%) | 55 (13.9%) |
| 10:00 AM to 10:59 AM | 26 (6.0%) | 17 (4.3%) |
| 11:00 AM to 11:59 AM | 2 (0.5%) | 5 (1.3%) |
| 12:00 PM to 3:59 PM | 26 (6.0%) | 25 (6.3%) |
| 4:00 PM to 11:59 PM | 48 (11.0%) | 81 (20.4%) |
| Total | 436 (100.0%) | 397 (100.0%) |
Housing Occupancy in French Lick
Occupancy by Ownership in French Lick
Of the total 767 dwellings in French Lick, owner-occupied units account for 490 (63.9%), while renter-occupied units make up 277 (36.1%).
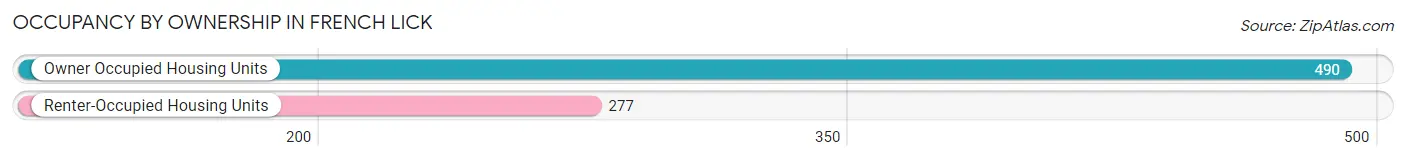
| Occupancy | # Housing Units | % Housing Units |
| Owner Occupied Housing Units | 490 | 63.9% |
| Renter-Occupied Housing Units | 277 | 36.1% |
| Total Occupied Housing Units | 767 | 100.0% |
Occupancy by Household Size in French Lick
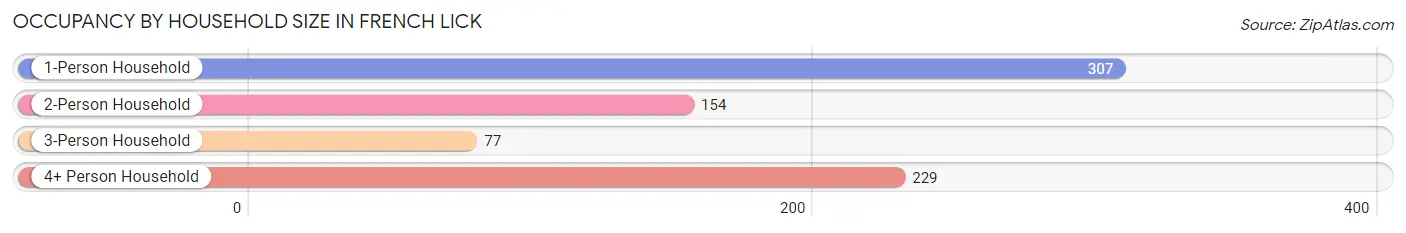
| Household Size | # Housing Units | % Housing Units |
| 1-Person Household | 307 | 40.0% |
| 2-Person Household | 154 | 20.1% |
| 3-Person Household | 77 | 10.0% |
| 4+ Person Household | 229 | 29.9% |
| Total Housing Units | 767 | 100.0% |
Occupancy by Ownership by Household Size in French Lick
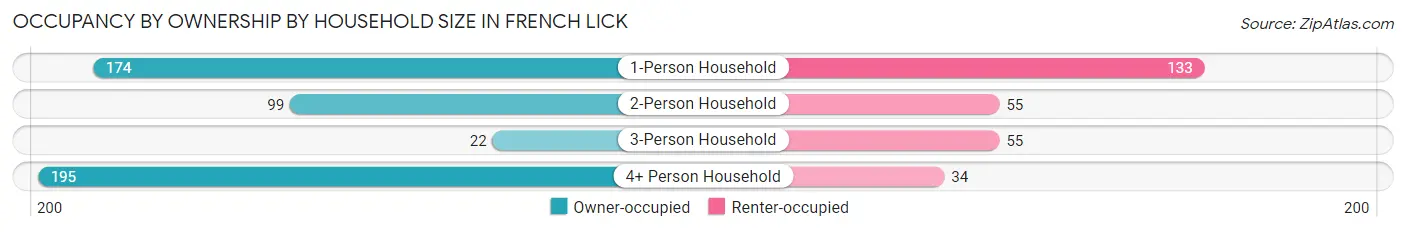
| Household Size | Owner-occupied | Renter-occupied |
| 1-Person Household | 174 (56.7%) | 133 (43.3%) |
| 2-Person Household | 99 (64.3%) | 55 (35.7%) |
| 3-Person Household | 22 (28.6%) | 55 (71.4%) |
| 4+ Person Household | 195 (85.2%) | 34 (14.8%) |
| Total Housing Units | 490 (63.9%) | 277 (36.1%) |
Occupancy by Educational Attainment in French Lick
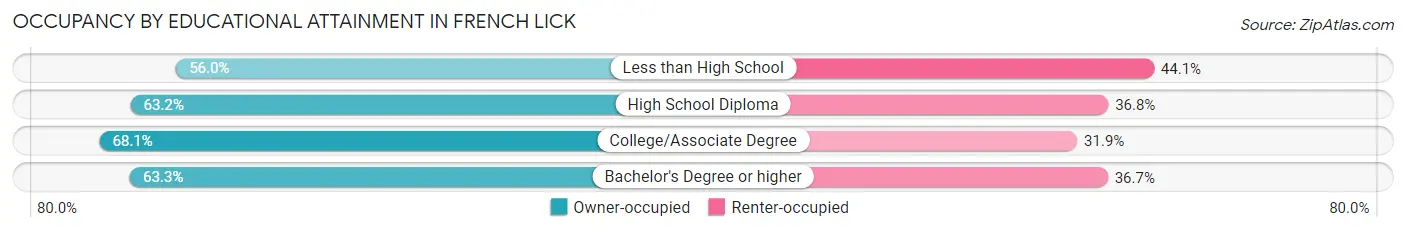
| Household Size | Owner-occupied | Renter-occupied |
| Less than High School | 47 (55.9%) | 37 (44.1%) |
| High School Diploma | 225 (63.2%) | 131 (36.8%) |
| College/Associate Degree | 156 (68.1%) | 73 (31.9%) |
| Bachelor's Degree or higher | 62 (63.3%) | 36 (36.7%) |
Occupancy by Age of Householder in French Lick
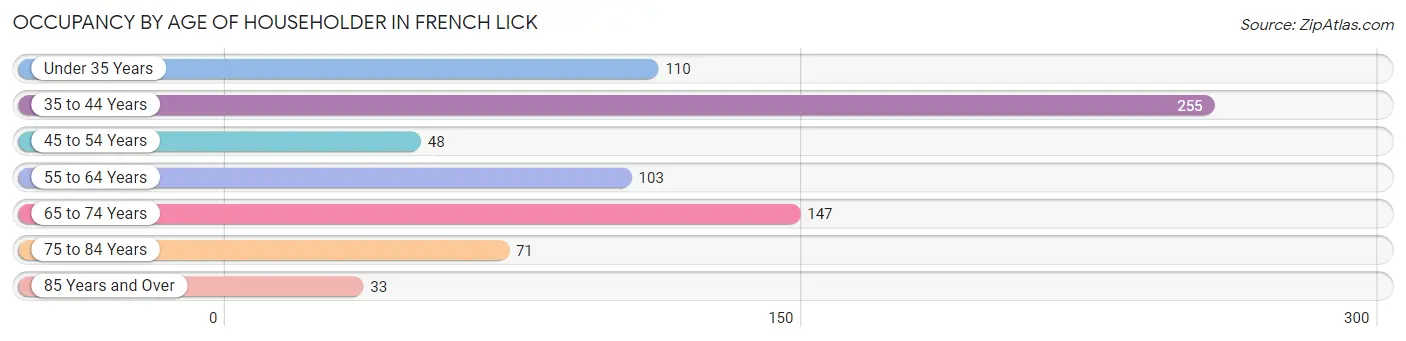
| Age Bracket | # Households | % Households |
| Under 35 Years | 110 | 14.3% |
| 35 to 44 Years | 255 | 33.3% |
| 45 to 54 Years | 48 | 6.3% |
| 55 to 64 Years | 103 | 13.4% |
| 65 to 74 Years | 147 | 19.2% |
| 75 to 84 Years | 71 | 9.3% |
| 85 Years and Over | 33 | 4.3% |
| Total | 767 | 100.0% |
Housing Finances in French Lick
Median Income by Occupancy in French Lick
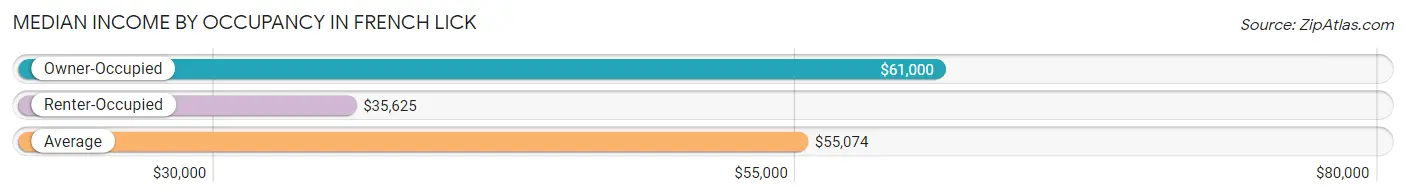
| Occupancy Type | # Households | Median Income |
| Owner-Occupied | 490 (63.9%) | $61,000 |
| Renter-Occupied | 277 (36.1%) | $35,625 |
| Average | 767 (100.0%) | $55,074 |
Occupancy by Householder Income Bracket in French Lick
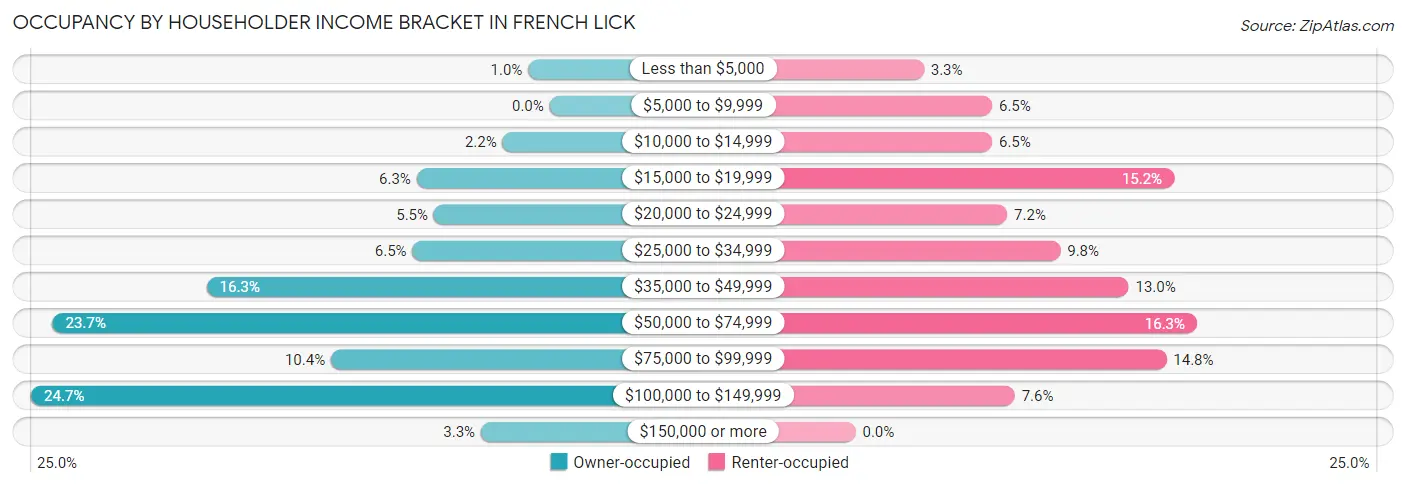
| Income Bracket | Owner-occupied | Renter-occupied |
| Less than $5,000 | 5 (1.0%) | 9 (3.3%) |
| $5,000 to $9,999 | 0 (0.0%) | 18 (6.5%) |
| $10,000 to $14,999 | 11 (2.2%) | 18 (6.5%) |
| $15,000 to $19,999 | 31 (6.3%) | 42 (15.2%) |
| $20,000 to $24,999 | 27 (5.5%) | 20 (7.2%) |
| $25,000 to $34,999 | 32 (6.5%) | 27 (9.8%) |
| $35,000 to $49,999 | 80 (16.3%) | 36 (13.0%) |
| $50,000 to $74,999 | 116 (23.7%) | 45 (16.3%) |
| $75,000 to $99,999 | 51 (10.4%) | 41 (14.8%) |
| $100,000 to $149,999 | 121 (24.7%) | 21 (7.6%) |
| $150,000 or more | 16 (3.3%) | 0 (0.0%) |
| Total | 490 (100.0%) | 277 (100.0%) |
Monthly Housing Cost Tiers in French Lick
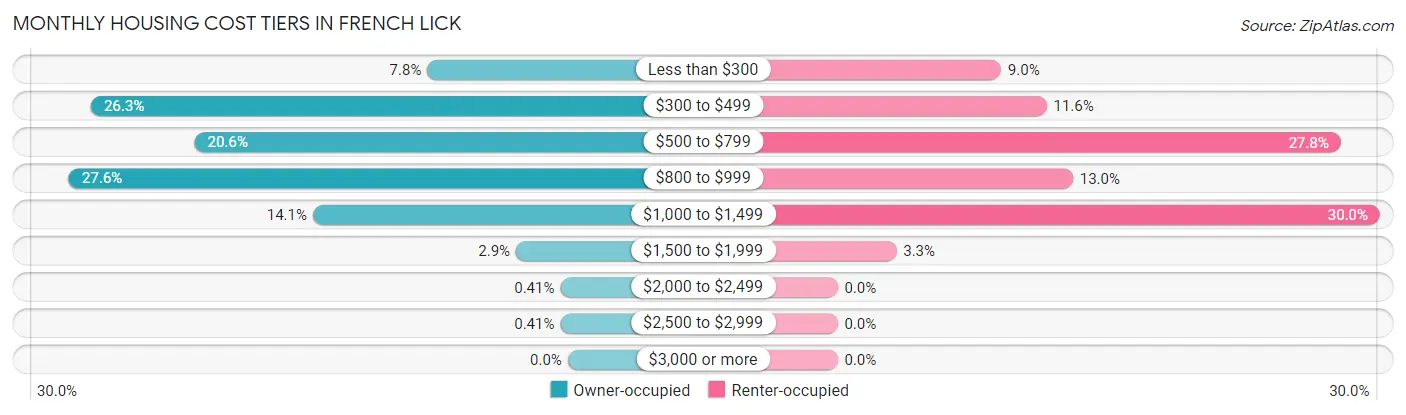
| Monthly Cost | Owner-occupied | Renter-occupied |
| Less than $300 | 38 (7.8%) | 25 (9.0%) |
| $300 to $499 | 129 (26.3%) | 32 (11.6%) |
| $500 to $799 | 101 (20.6%) | 77 (27.8%) |
| $800 to $999 | 135 (27.6%) | 36 (13.0%) |
| $1,000 to $1,499 | 69 (14.1%) | 83 (30.0%) |
| $1,500 to $1,999 | 14 (2.9%) | 9 (3.3%) |
| $2,000 to $2,499 | 2 (0.4%) | 0 (0.0%) |
| $2,500 to $2,999 | 2 (0.4%) | 0 (0.0%) |
| $3,000 or more | 0 (0.0%) | 0 (0.0%) |
| Total | 490 (100.0%) | 277 (100.0%) |
Physical Housing Characteristics in French Lick
Housing Structures in French Lick
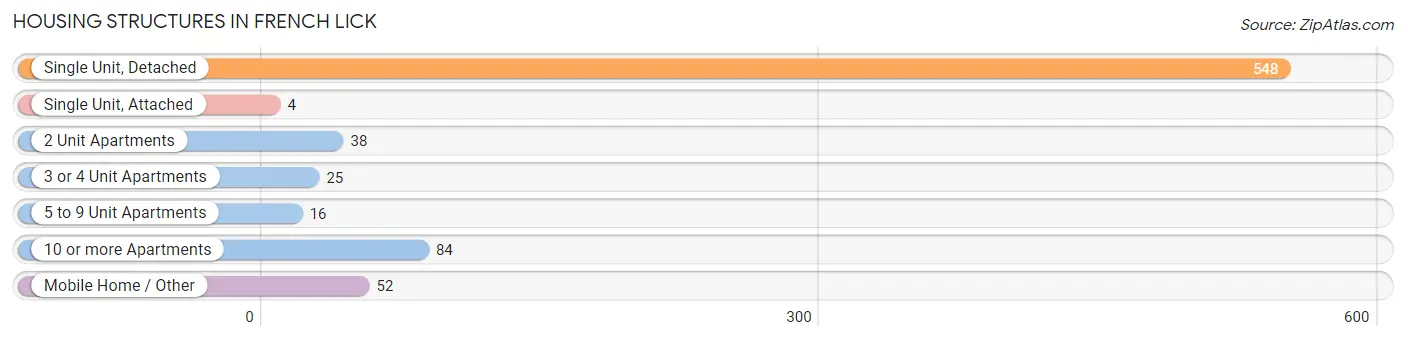
| Structure Type | # Housing Units | % Housing Units |
| Single Unit, Detached | 548 | 71.5% |
| Single Unit, Attached | 4 | 0.5% |
| 2 Unit Apartments | 38 | 5.0% |
| 3 or 4 Unit Apartments | 25 | 3.3% |
| 5 to 9 Unit Apartments | 16 | 2.1% |
| 10 or more Apartments | 84 | 11.0% |
| Mobile Home / Other | 52 | 6.8% |
| Total | 767 | 100.0% |
Housing Structures by Occupancy in French Lick
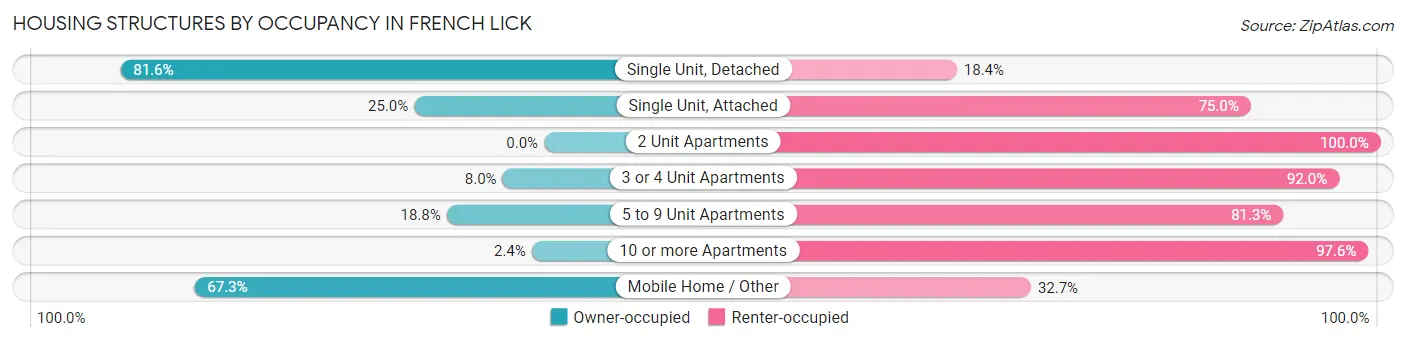
| Structure Type | Owner-occupied | Renter-occupied |
| Single Unit, Detached | 447 (81.6%) | 101 (18.4%) |
| Single Unit, Attached | 1 (25.0%) | 3 (75.0%) |
| 2 Unit Apartments | 0 (0.0%) | 38 (100.0%) |
| 3 or 4 Unit Apartments | 2 (8.0%) | 23 (92.0%) |
| 5 to 9 Unit Apartments | 3 (18.8%) | 13 (81.2%) |
| 10 or more Apartments | 2 (2.4%) | 82 (97.6%) |
| Mobile Home / Other | 35 (67.3%) | 17 (32.7%) |
| Total | 490 (63.9%) | 277 (36.1%) |
Housing Structures by Number of Rooms in French Lick
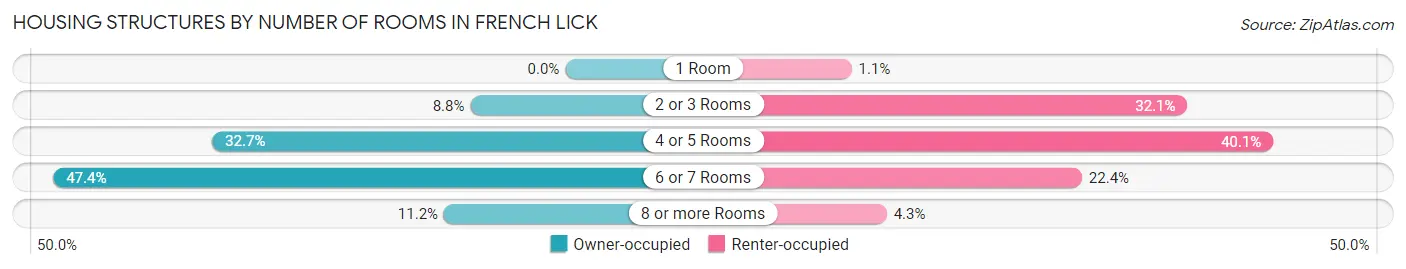
| Number of Rooms | Owner-occupied | Renter-occupied |
| 1 Room | 0 (0.0%) | 3 (1.1%) |
| 2 or 3 Rooms | 43 (8.8%) | 89 (32.1%) |
| 4 or 5 Rooms | 160 (32.7%) | 111 (40.1%) |
| 6 or 7 Rooms | 232 (47.3%) | 62 (22.4%) |
| 8 or more Rooms | 55 (11.2%) | 12 (4.3%) |
| Total | 490 (100.0%) | 277 (100.0%) |
Housing Structure by Heating Type in French Lick
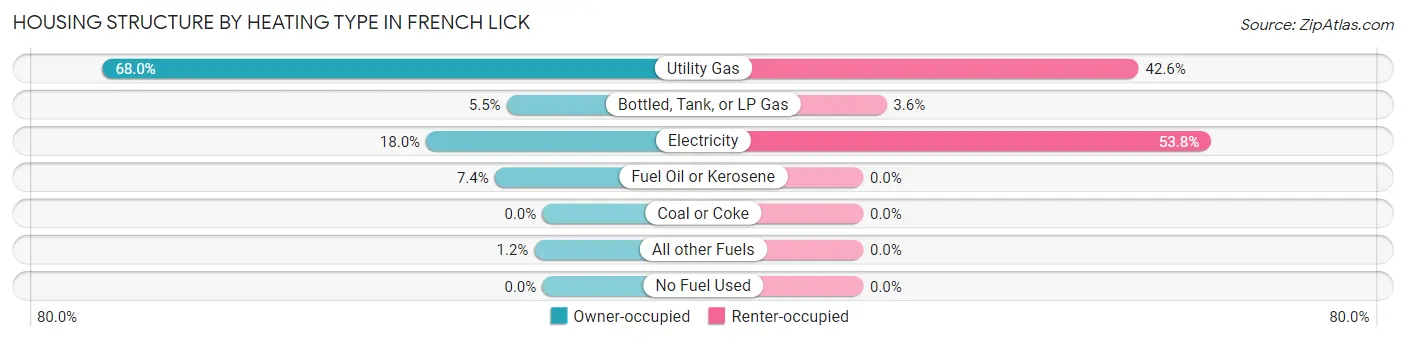
| Heating Type | Owner-occupied | Renter-occupied |
| Utility Gas | 333 (68.0%) | 118 (42.6%) |
| Bottled, Tank, or LP Gas | 27 (5.5%) | 10 (3.6%) |
| Electricity | 88 (18.0%) | 149 (53.8%) |
| Fuel Oil or Kerosene | 36 (7.3%) | 0 (0.0%) |
| Coal or Coke | 0 (0.0%) | 0 (0.0%) |
| All other Fuels | 6 (1.2%) | 0 (0.0%) |
| No Fuel Used | 0 (0.0%) | 0 (0.0%) |
| Total | 490 (100.0%) | 277 (100.0%) |
Household Vehicle Usage in French Lick
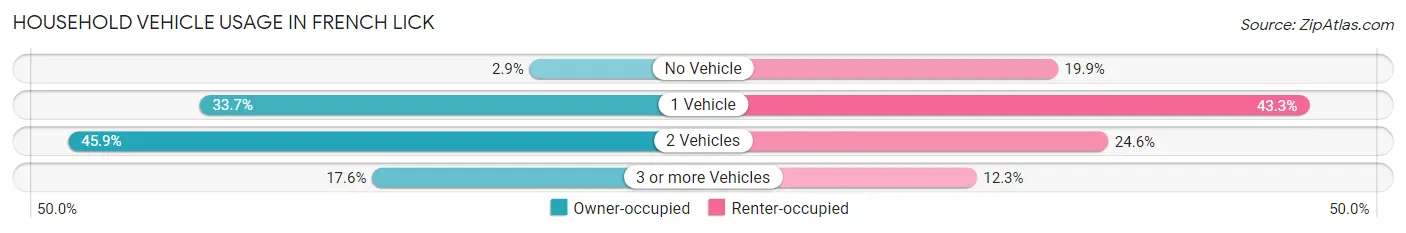
| Vehicles per Household | Owner-occupied | Renter-occupied |
| No Vehicle | 14 (2.9%) | 55 (19.9%) |
| 1 Vehicle | 165 (33.7%) | 120 (43.3%) |
| 2 Vehicles | 225 (45.9%) | 68 (24.5%) |
| 3 or more Vehicles | 86 (17.5%) | 34 (12.3%) |
| Total | 490 (100.0%) | 277 (100.0%) |
Real Estate & Mortgages in French Lick
Real Estate and Mortgage Overview in French Lick
| Characteristic | Without Mortgage | With Mortgage |
| Housing Units | 204 | 286 |
| Median Property Value | $82,400 | $79,700 |
| Median Household Income | $43,333 | $5 |
| Monthly Housing Costs | $413 | $0 |
| Real Estate Taxes | $500 | $4 |
Property Value by Mortgage Status in French Lick
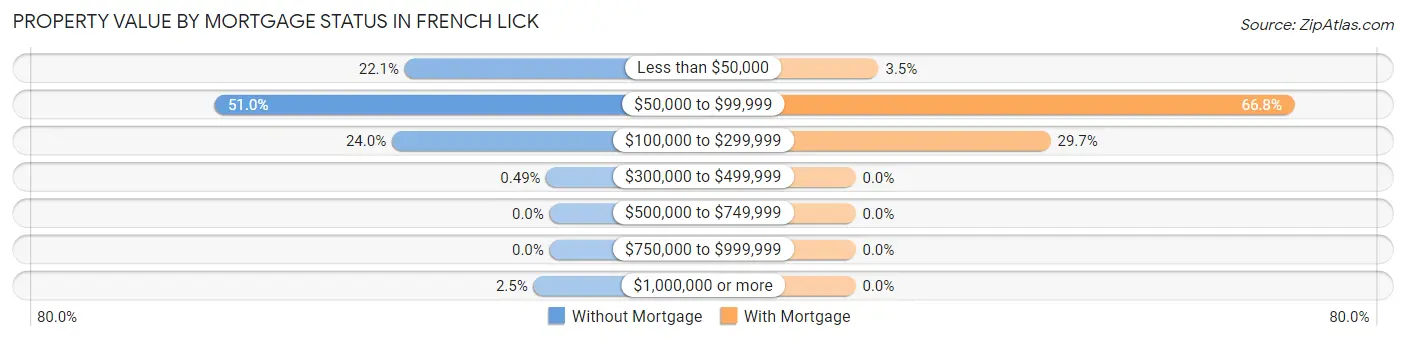
| Property Value | Without Mortgage | With Mortgage |
| Less than $50,000 | 45 (22.1%) | 10 (3.5%) |
| $50,000 to $99,999 | 104 (51.0%) | 191 (66.8%) |
| $100,000 to $299,999 | 49 (24.0%) | 85 (29.7%) |
| $300,000 to $499,999 | 1 (0.5%) | 0 (0.0%) |
| $500,000 to $749,999 | 0 (0.0%) | 0 (0.0%) |
| $750,000 to $999,999 | 0 (0.0%) | 0 (0.0%) |
| $1,000,000 or more | 5 (2.5%) | 0 (0.0%) |
| Total | 204 (100.0%) | 286 (100.0%) |
Household Income by Mortgage Status in French Lick
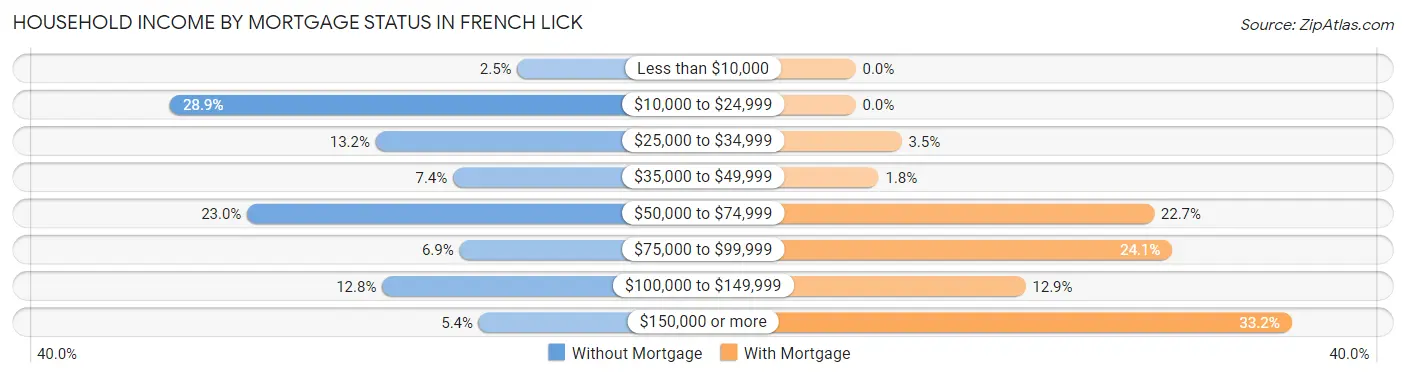
| Household Income | Without Mortgage | With Mortgage |
| Less than $10,000 | 5 (2.5%) | 0 (0.0%) |
| $10,000 to $24,999 | 59 (28.9%) | 0 (0.0%) |
| $25,000 to $34,999 | 27 (13.2%) | 10 (3.5%) |
| $35,000 to $49,999 | 15 (7.3%) | 5 (1.8%) |
| $50,000 to $74,999 | 47 (23.0%) | 65 (22.7%) |
| $75,000 to $99,999 | 14 (6.9%) | 69 (24.1%) |
| $100,000 to $149,999 | 26 (12.8%) | 37 (12.9%) |
| $150,000 or more | 11 (5.4%) | 95 (33.2%) |
| Total | 204 (100.0%) | 286 (100.0%) |
Property Value to Household Income Ratio in French Lick
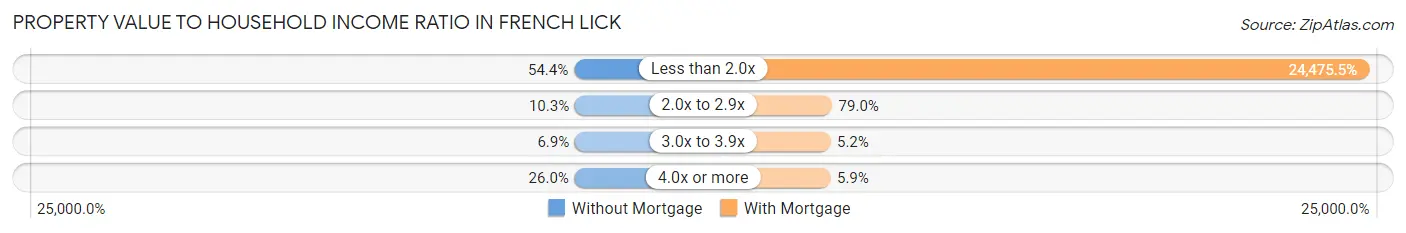
| Value-to-Income Ratio | Without Mortgage | With Mortgage |
| Less than 2.0x | 111 (54.4%) | 70,000 (24,475.5%) |
| 2.0x to 2.9x | 21 (10.3%) | 226 (79.0%) |
| 3.0x to 3.9x | 14 (6.9%) | 15 (5.2%) |
| 4.0x or more | 53 (26.0%) | 17 (5.9%) |
| Total | 204 (100.0%) | 286 (100.0%) |
Real Estate Taxes by Mortgage Status in French Lick
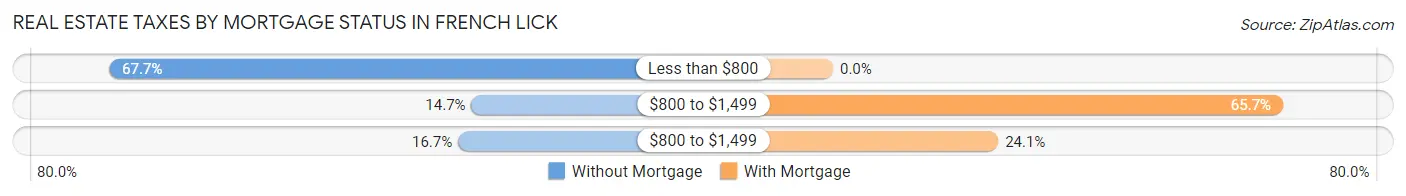
| Property Taxes | Without Mortgage | With Mortgage |
| Less than $800 | 138 (67.6%) | 0 (0.0%) |
| $800 to $1,499 | 30 (14.7%) | 188 (65.7%) |
| $800 to $1,499 | 34 (16.7%) | 69 (24.1%) |
| Total | 204 (100.0%) | 286 (100.0%) |
Health & Disability in French Lick
Health Insurance Coverage by Age in French Lick
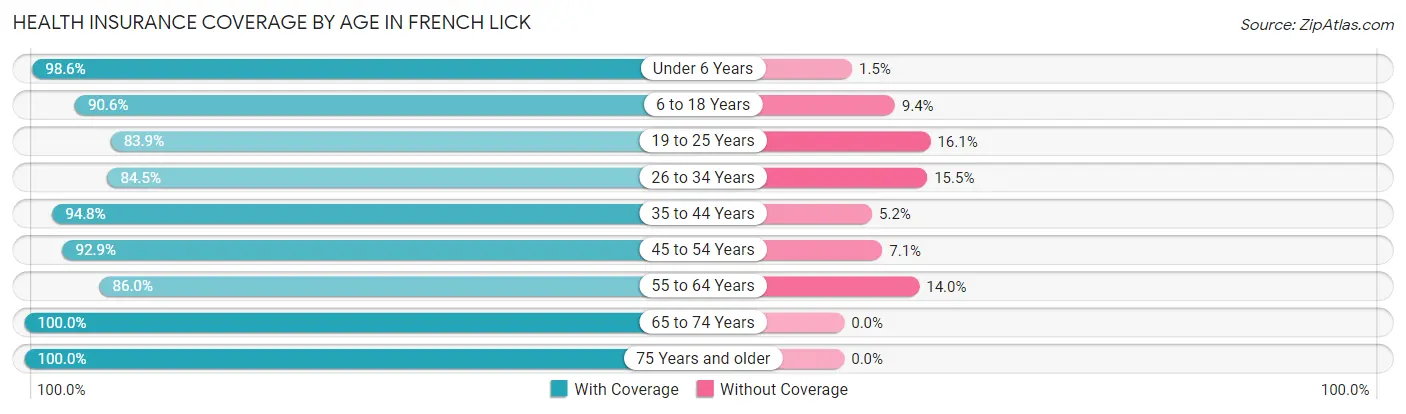
| Age Bracket | With Coverage | Without Coverage |
| Under 6 Years | 136 (98.6%) | 2 (1.5%) |
| 6 to 18 Years | 298 (90.6%) | 31 (9.4%) |
| 19 to 25 Years | 47 (83.9%) | 9 (16.1%) |
| 26 to 34 Years | 153 (84.5%) | 28 (15.5%) |
| 35 to 44 Years | 348 (94.8%) | 19 (5.2%) |
| 45 to 54 Years | 118 (92.9%) | 9 (7.1%) |
| 55 to 64 Years | 123 (86.0%) | 20 (14.0%) |
| 65 to 74 Years | 201 (100.0%) | 0 (0.0%) |
| 75 Years and older | 129 (100.0%) | 0 (0.0%) |
| Total | 1,553 (92.9%) | 118 (7.1%) |
Health Insurance Coverage by Citizenship Status in French Lick
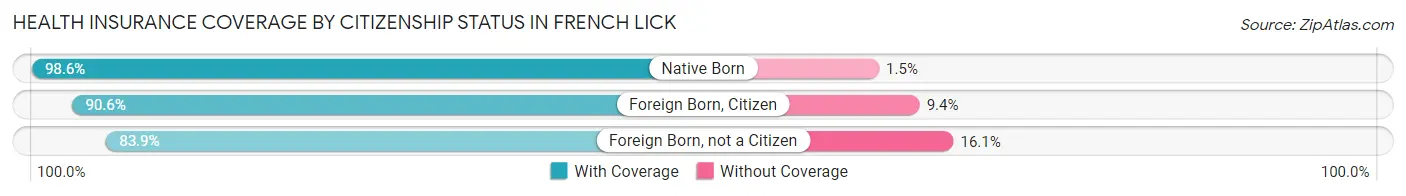
| Citizenship Status | With Coverage | Without Coverage |
| Native Born | 136 (98.6%) | 2 (1.5%) |
| Foreign Born, Citizen | 298 (90.6%) | 31 (9.4%) |
| Foreign Born, not a Citizen | 47 (83.9%) | 9 (16.1%) |
Health Insurance Coverage by Household Income in French Lick
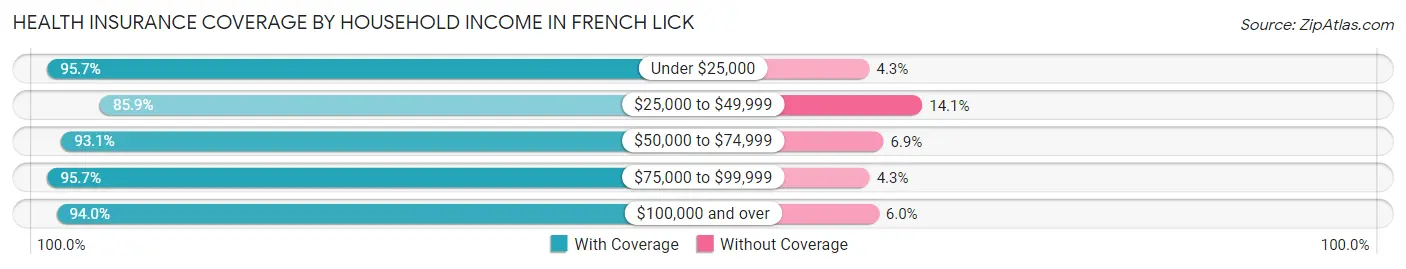
| Household Income | With Coverage | Without Coverage |
| Under $25,000 | 225 (95.7%) | 10 (4.3%) |
| $25,000 to $49,999 | 255 (85.9%) | 42 (14.1%) |
| $50,000 to $74,999 | 352 (93.1%) | 26 (6.9%) |
| $75,000 to $99,999 | 290 (95.7%) | 13 (4.3%) |
| $100,000 and over | 423 (94.0%) | 27 (6.0%) |
Public vs Private Health Insurance Coverage by Age in French Lick
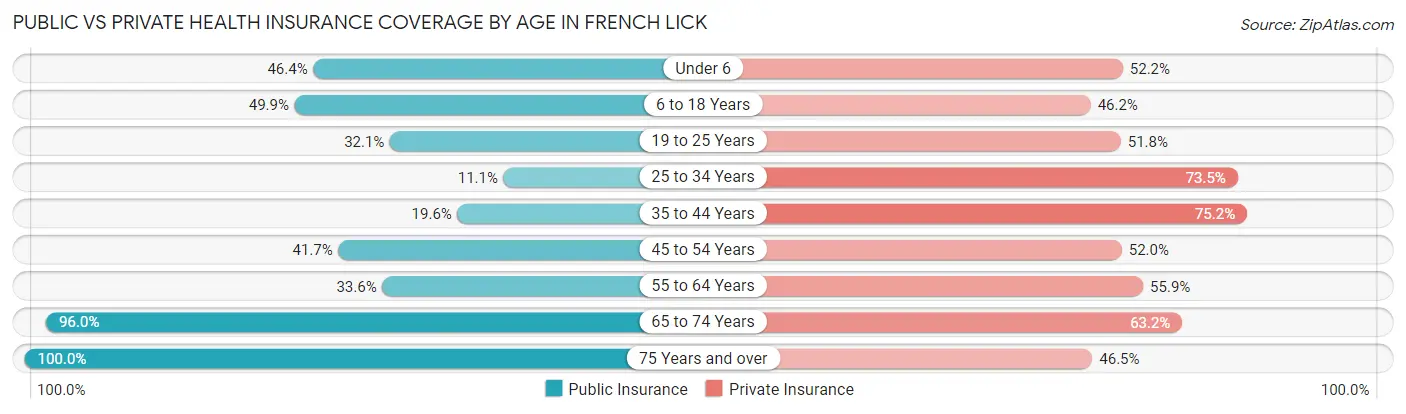
| Age Bracket | Public Insurance | Private Insurance |
| Under 6 | 64 (46.4%) | 72 (52.2%) |
| 6 to 18 Years | 164 (49.8%) | 152 (46.2%) |
| 19 to 25 Years | 18 (32.1%) | 29 (51.8%) |
| 25 to 34 Years | 20 (11.1%) | 133 (73.5%) |
| 35 to 44 Years | 72 (19.6%) | 276 (75.2%) |
| 45 to 54 Years | 53 (41.7%) | 66 (52.0%) |
| 55 to 64 Years | 48 (33.6%) | 80 (55.9%) |
| 65 to 74 Years | 193 (96.0%) | 127 (63.2%) |
| 75 Years and over | 129 (100.0%) | 60 (46.5%) |
| Total | 761 (45.5%) | 995 (59.6%) |
Disability Status by Sex by Age in French Lick
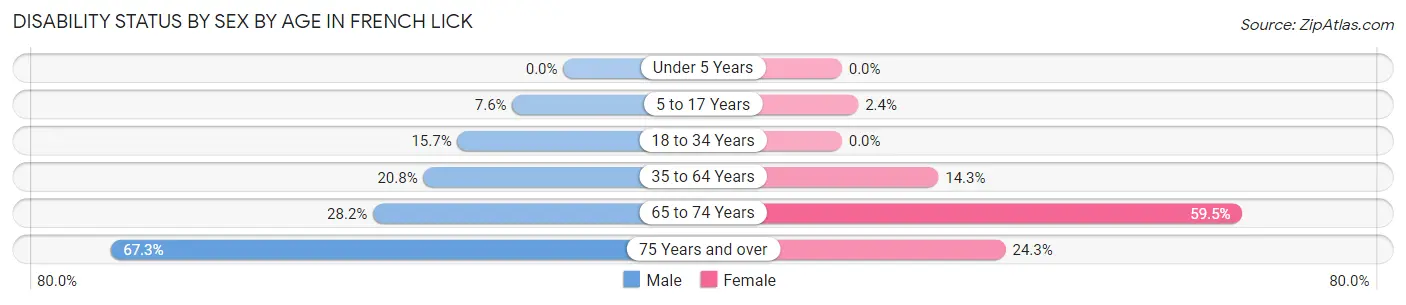
| Age Bracket | Male | Female |
| Under 5 Years | 0 (0.0%) | 0 (0.0%) |
| 5 to 17 Years | 13 (7.6%) | 3 (2.4%) |
| 18 to 34 Years | 25 (15.7%) | 0 (0.0%) |
| 35 to 64 Years | 70 (20.8%) | 43 (14.3%) |
| 65 to 74 Years | 24 (28.2%) | 69 (59.5%) |
| 75 Years and over | 37 (67.3%) | 18 (24.3%) |
Disability Class by Sex by Age in French Lick
Disability Class: Hearing Difficulty
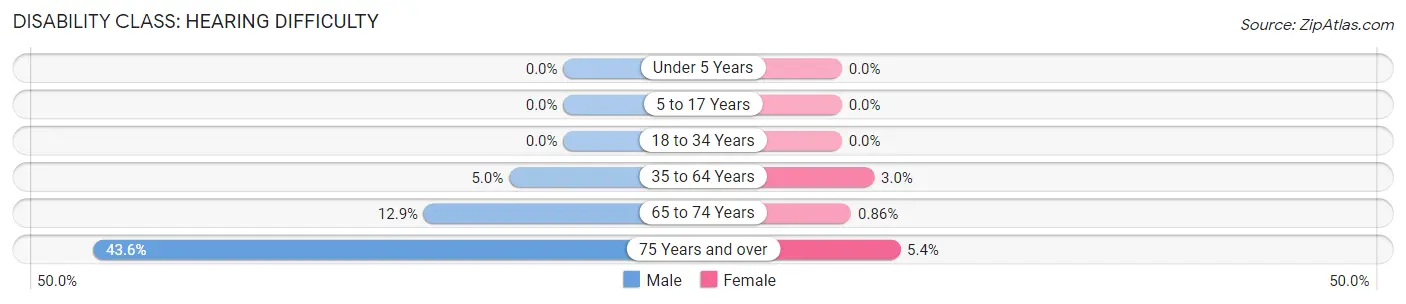
| Age Bracket | Male | Female |
| Under 5 Years | 0 (0.0%) | 0 (0.0%) |
| 5 to 17 Years | 0 (0.0%) | 0 (0.0%) |
| 18 to 34 Years | 0 (0.0%) | 0 (0.0%) |
| 35 to 64 Years | 17 (5.0%) | 9 (3.0%) |
| 65 to 74 Years | 11 (12.9%) | 1 (0.9%) |
| 75 Years and over | 24 (43.6%) | 4 (5.4%) |
Disability Class: Vision Difficulty
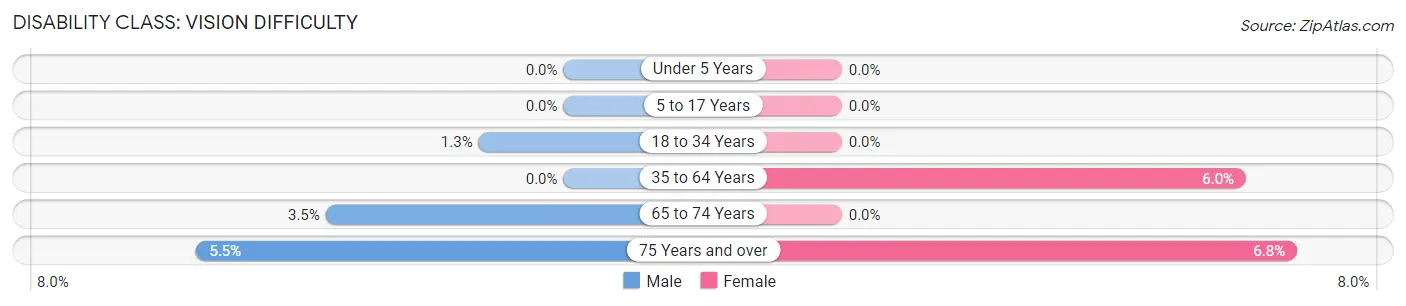
| Age Bracket | Male | Female |
| Under 5 Years | 0 (0.0%) | 0 (0.0%) |
| 5 to 17 Years | 0 (0.0%) | 0 (0.0%) |
| 18 to 34 Years | 2 (1.3%) | 0 (0.0%) |
| 35 to 64 Years | 0 (0.0%) | 18 (6.0%) |
| 65 to 74 Years | 3 (3.5%) | 0 (0.0%) |
| 75 Years and over | 3 (5.4%) | 5 (6.8%) |
Disability Class: Cognitive Difficulty
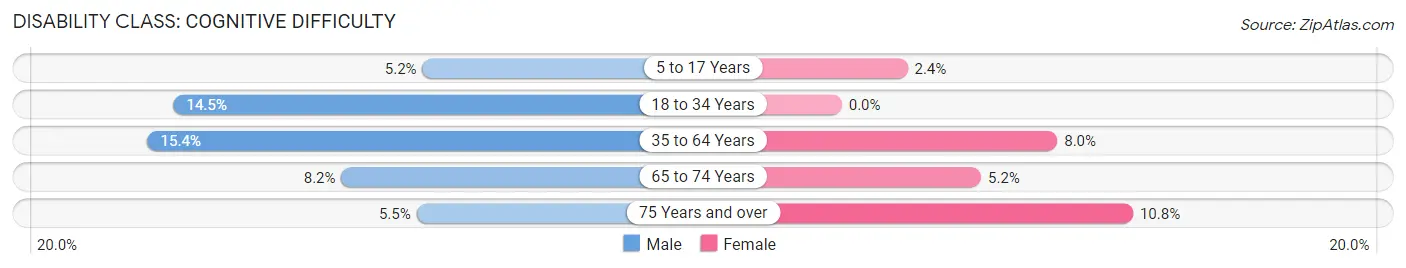
| Age Bracket | Male | Female |
| 5 to 17 Years | 9 (5.2%) | 3 (2.4%) |
| 18 to 34 Years | 23 (14.5%) | 0 (0.0%) |
| 35 to 64 Years | 52 (15.4%) | 24 (8.0%) |
| 65 to 74 Years | 7 (8.2%) | 6 (5.2%) |
| 75 Years and over | 3 (5.4%) | 8 (10.8%) |
Disability Class: Ambulatory Difficulty
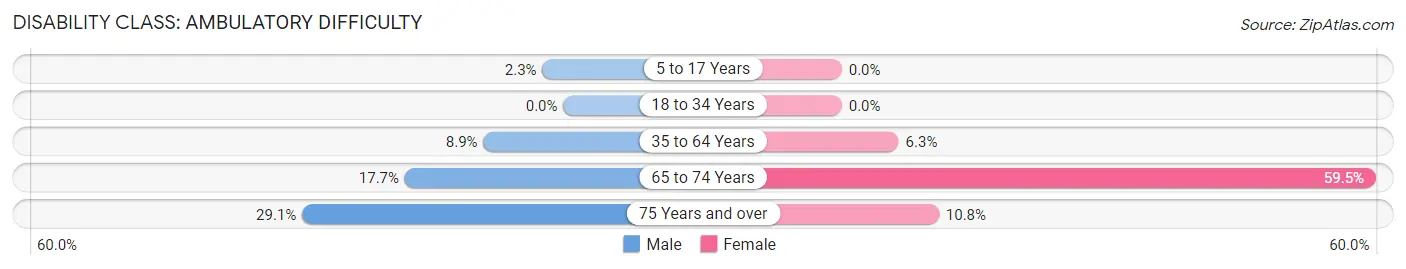
| Age Bracket | Male | Female |
| 5 to 17 Years | 4 (2.3%) | 0 (0.0%) |
| 18 to 34 Years | 0 (0.0%) | 0 (0.0%) |
| 35 to 64 Years | 30 (8.9%) | 19 (6.3%) |
| 65 to 74 Years | 15 (17.6%) | 69 (59.5%) |
| 75 Years and over | 16 (29.1%) | 8 (10.8%) |
Disability Class: Self-Care Difficulty
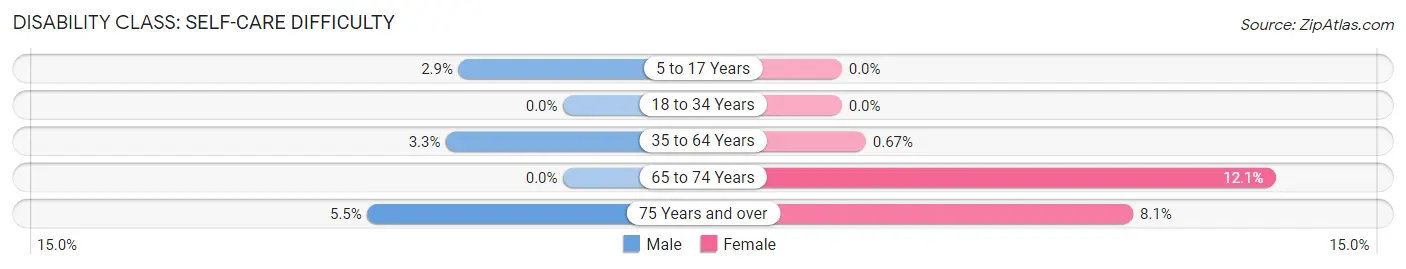
| Age Bracket | Male | Female |
| 5 to 17 Years | 5 (2.9%) | 0 (0.0%) |
| 18 to 34 Years | 0 (0.0%) | 0 (0.0%) |
| 35 to 64 Years | 11 (3.3%) | 2 (0.7%) |
| 65 to 74 Years | 0 (0.0%) | 14 (12.1%) |
| 75 Years and over | 3 (5.4%) | 6 (8.1%) |
Technology Access in French Lick
Computing Device Access in French Lick
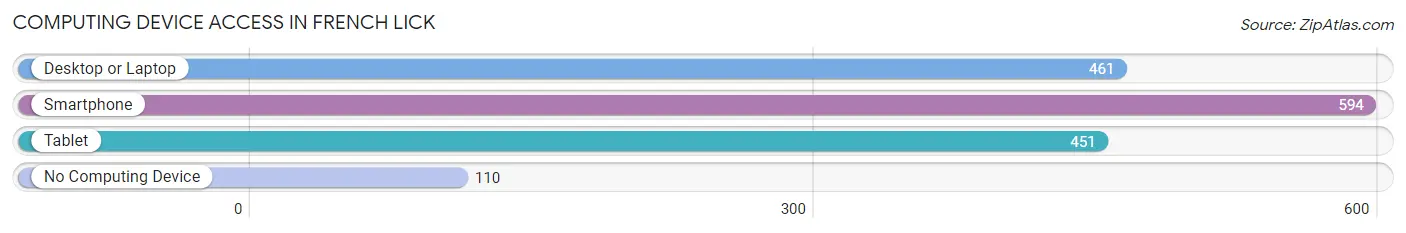
| Device Type | # Households | % Households |
| Desktop or Laptop | 461 | 60.1% |
| Smartphone | 594 | 77.4% |
| Tablet | 451 | 58.8% |
| No Computing Device | 110 | 14.3% |
| Total | 767 | 100.0% |
Internet Access in French Lick
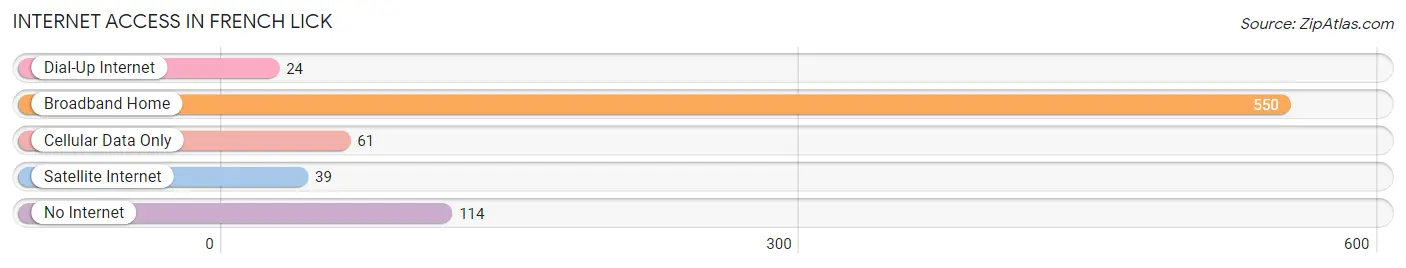
| Internet Type | # Households | % Households |
| Dial-Up Internet | 24 | 3.1% |
| Broadband Home | 550 | 71.7% |
| Cellular Data Only | 61 | 8.0% |
| Satellite Internet | 39 | 5.1% |
| No Internet | 114 | 14.9% |
| Total | 767 | 100.0% |
French Lick Summary
French Lick is a small town located in the southern part of Indiana, in the United States. It is situated in Orange County, and is part of the French Lick-West Baden metropolitan area. The town has a population of 1,807 people, according to the 2010 census.
History
The area that is now French Lick was first settled in 1811 by William and Mary French. The French family had migrated from Kentucky and established a trading post in the area. The town was officially founded in 1857 and was named after the French family.
The town was originally a small farming community, but it soon became a popular resort destination due to its natural springs. The town was known for its mineral springs, which were believed to have healing properties. The town was also known for its casino, which was built in the late 19th century.
The town was also home to the French Lick Springs Hotel, which was built in 1845. The hotel was a popular destination for celebrities and politicians, including President Benjamin Harrison. The hotel was destroyed by fire in 1897, but was rebuilt and reopened in 1901.
Geography
French Lick is located in the southern part of Indiana, in Orange County. It is situated in the French Lick-West Baden metropolitan area. The town is located at the intersection of State Road 145 and State Road 56.
The town is situated in a hilly area, with the highest point being the summit of French Lick Hill, which is 845 feet above sea level. The town is located in the Central Till Plains region of Indiana, and is part of the Wabash Valley.
The town is located near the Patoka River, which is a tributary of the Wabash River. The town is also located near the Hoosier National Forest, which is a popular destination for outdoor activities.
Economy
The economy of French Lick is largely based on tourism. The town is home to the French Lick Resort, which is a popular destination for visitors. The resort features a casino, a golf course, and a spa.
The town is also home to several other businesses, including restaurants, shops, and hotels. The town is also home to the French Lick Winery, which produces a variety of wines.
Demographics
According to the 2010 census, the population of French Lick was 1,807 people. The town has a median age of 44.7 years, and a median household income of $37,917.
The town is predominantly white, with 92.3% of the population being white. The town also has a small African American population, with 4.2% of the population being African American. The town also has a small Hispanic population, with 1.7% of the population being Hispanic.
Conclusion
French Lick is a small town located in the southern part of Indiana. The town has a population of 1,807 people, and is known for its mineral springs and casino. The town is a popular destination for tourists, and is home to the French Lick Resort. The town has a predominantly white population, with 92.3% of the population being white. The town also has a small African American and Hispanic population. The town has a median household income of $37,917, and is home to several businesses, including restaurants, shops, and hotels.
Common Questions
What is the Total Population of French Lick?
Total Population of French Lick is 1,752.
What is the Total Male Population of French Lick?
Total Male Population of French Lick is 886.
What is the Total Female Population of French Lick?
Total Female Population of French Lick is 866.
What is the Ratio of Males per 100 Females in French Lick?
There are 102.31 Males per 100 Females in French Lick.
What is the Ratio of Females per 100 Males in French Lick?
There are 97.74 Females per 100 Males in French Lick.
What is the Median Population Age in French Lick?
Median Population Age in French Lick is 41.1 Years.
What is the Average Family Size in French Lick
Average Family Size in French Lick is 2.8 People.
What is the Average Household Size in French Lick
Average Household Size in French Lick is 2.2 People.
What is Per Capita Income in French Lick?
Per Capita income in French Lick is $27,849.
What is the Median Family Income in French Lick?
Median Family Income in French Lick is $69,444.
What is the Median Household income in French Lick?
Median Household Income in French Lick is $55,074.
What is Income or Wage Gap in French Lick?
Income or Wage Gap in French Lick is 14.8%.
Women in French Lick earn 85.2 cents for every dollar earned by a man.
What is Inequality or Gini Index in French Lick?
Inequality or Gini Index in French Lick is 0.41.
How Large is the Labor Force in French Lick?
There are 870 People in the Labor Forcein in French Lick.
What is the Percentage of People in the Labor Force in French Lick?
62.8% of People are in the Labor Force in French Lick.
What is the Unemployment Rate in French Lick?
Unemployment Rate in French Lick is 1.0%.