South Haven, IN
South Haven Map
South Haven Overview
7,237
TOTAL POPULATION
3,601
MALE POPULATION
3,636
FEMALE POPULATION
99.04
MALES / 100 FEMALES
100.97
FEMALES / 100 MALES
38.3
MEDIAN AGE
3.0
AVG FAMILY SIZE
2.6
AVG HOUSEHOLD SIZE
$33,293
PER CAPITA INCOME
$78,426
AVG FAMILY INCOME
$72,068
AVG HOUSEHOLD INCOME
28.2%
WAGE / INCOME GAP [ % ]
71.8¢/ $1
WAGE / INCOME GAP [ $ ]
0.42
INEQUALITY / GINI INDEX
3,705
LABOR FORCE [ PEOPLE ]
63.9%
PERCENT IN LABOR FORCE
3.9%
UNEMPLOYMENT RATE
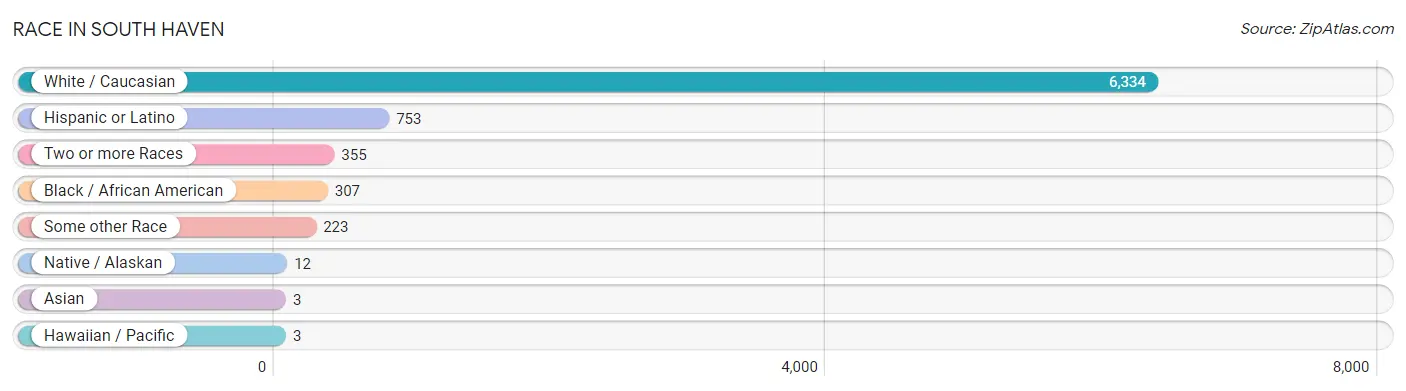
Race in South Haven
The most populous races in South Haven are White / Caucasian (6,334 | 87.5%), Hispanic or Latino (753 | 10.4%), and Two or more Races (355 | 4.9%).
| Race | # Population | % Population |
| Asian | 3 | 0.0% |
| Black / African American | 307 | 4.2% |
| Hawaiian / Pacific | 3 | 0.0% |
| Hispanic or Latino | 753 | 10.4% |
| Native / Alaskan | 12 | 0.2% |
| White / Caucasian | 6,334 | 87.5% |
| Two or more Races | 355 | 4.9% |
| Some other Race | 223 | 3.1% |
| Total | 7,237 | 100.0% |
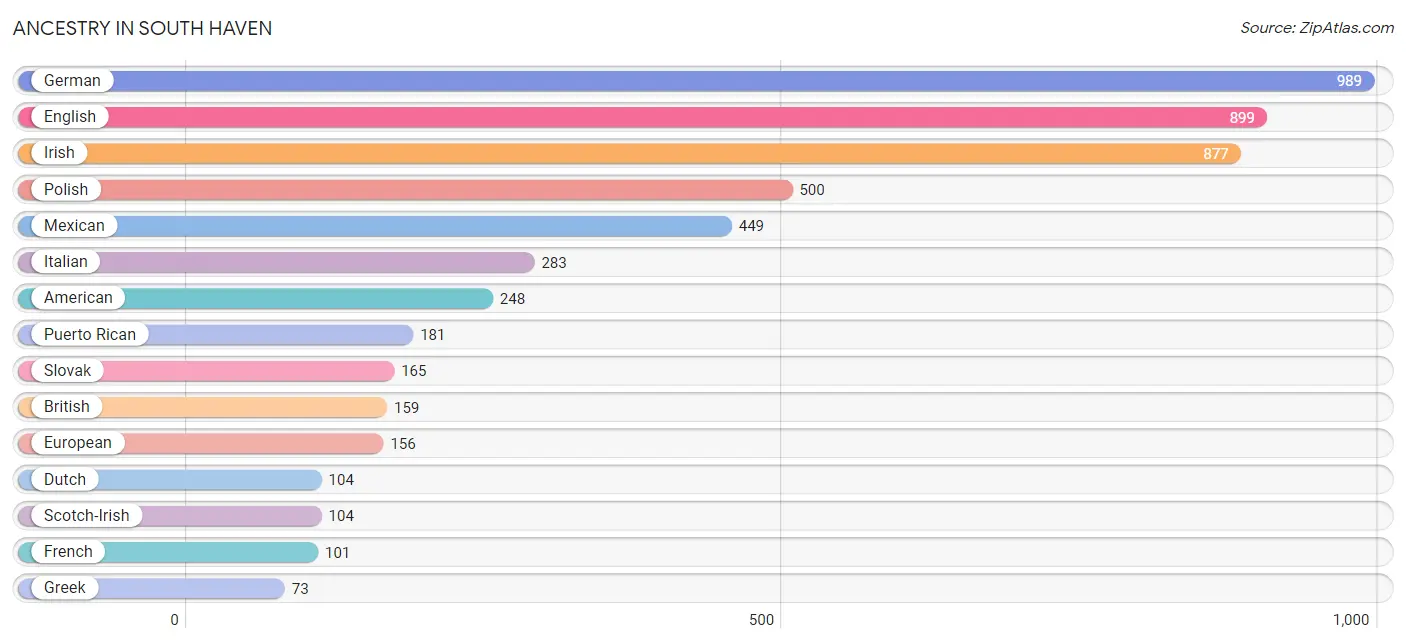
Ancestry in South Haven
The most populous ancestries reported in South Haven are German (989 | 13.7%), English (899 | 12.4%), Irish (877 | 12.1%), Polish (500 | 6.9%), and Mexican (449 | 6.2%), together accounting for 51.3% of all South Haven residents.
| Ancestry | # Population | % Population |
| American | 248 | 3.4% |
| Australian | 4 | 0.1% |
| Belgian | 7 | 0.1% |
| Bolivian | 11 | 0.2% |
| British | 159 | 2.2% |
| Central American | 10 | 0.1% |
| Cherokee | 39 | 0.5% |
| Chippewa | 26 | 0.4% |
| Croatian | 32 | 0.4% |
| Cuban | 34 | 0.5% |
| Dominican | 12 | 0.2% |
| Dutch | 104 | 1.4% |
| English | 899 | 12.4% |
| European | 156 | 2.2% |
| French | 101 | 1.4% |
| French Canadian | 30 | 0.4% |
| German | 989 | 13.7% |
| Greek | 73 | 1.0% |
| Honduran | 10 | 0.1% |
| Hungarian | 36 | 0.5% |
| Irish | 877 | 12.1% |
| Italian | 283 | 3.9% |
| Korean | 3 | 0.0% |
| Mexican | 449 | 6.2% |
| Native Hawaiian | 3 | 0.0% |
| Norwegian | 16 | 0.2% |
| Peruvian | 9 | 0.1% |
| Polish | 500 | 6.9% |
| Puerto Rican | 181 | 2.5% |
| Russian | 56 | 0.8% |
| Scandinavian | 7 | 0.1% |
| Scotch-Irish | 104 | 1.4% |
| Scottish | 31 | 0.4% |
| Serbian | 26 | 0.4% |
| Slavic | 8 | 0.1% |
| Slovak | 165 | 2.3% |
| South American | 20 | 0.3% |
| Spaniard | 15 | 0.2% |
| Spanish | 32 | 0.4% |
| Swedish | 25 | 0.4% |
| Welsh | 31 | 0.4% | View All 41 Rows |
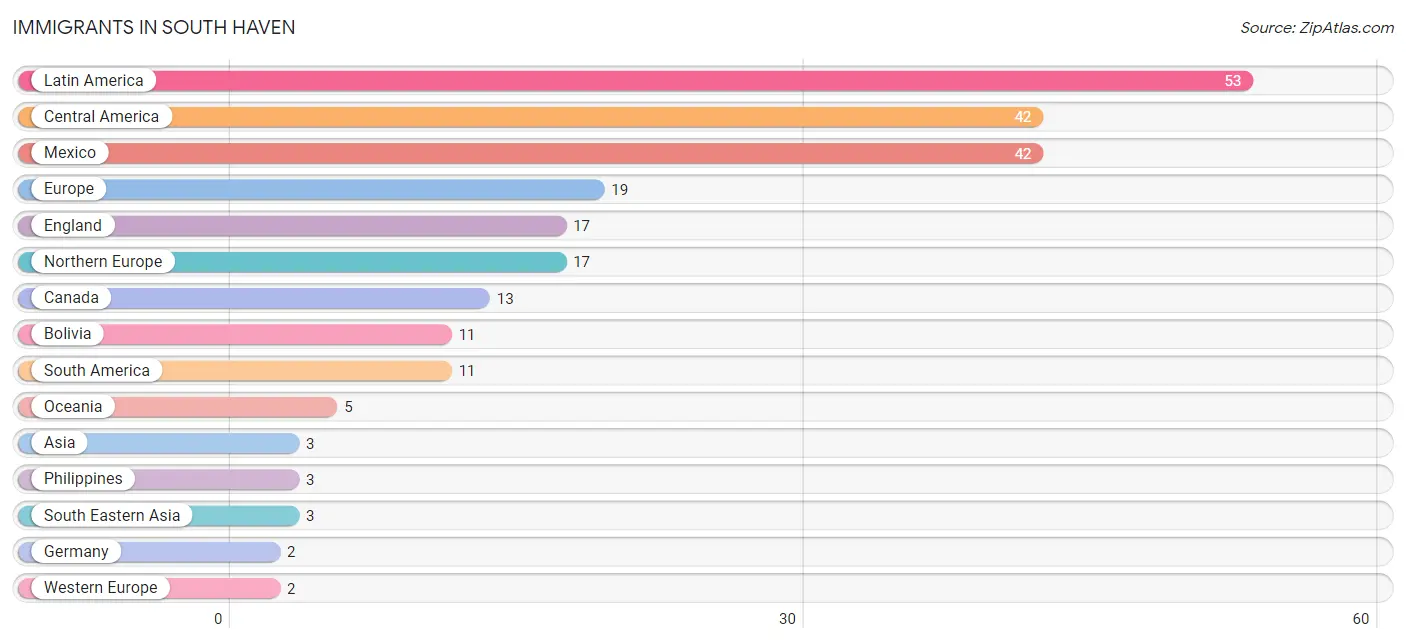
Immigrants in South Haven
The most numerous immigrant groups reported in South Haven came from Latin America (53 | 0.7%), Central America (42 | 0.6%), Mexico (42 | 0.6%), Europe (19 | 0.3%), and England (17 | 0.2%), together accounting for 2.4% of all South Haven residents.
| Immigration Origin | # Population | % Population |
| Asia | 3 | 0.0% |
| Bolivia | 11 | 0.2% |
| Canada | 13 | 0.2% |
| Central America | 42 | 0.6% |
| England | 17 | 0.2% |
| Europe | 19 | 0.3% |
| Germany | 2 | 0.0% |
| Latin America | 53 | 0.7% |
| Mexico | 42 | 0.6% |
| Northern Europe | 17 | 0.2% |
| Oceania | 5 | 0.1% |
| Philippines | 3 | 0.0% |
| South America | 11 | 0.2% |
| South Eastern Asia | 3 | 0.0% |
| Western Europe | 2 | 0.0% | View All 15 Rows |
Sex and Age in South Haven
Sex and Age in South Haven
The most populous age groups in South Haven are 50 to 54 Years (338 | 9.4%) for men and 55 to 59 Years (324 | 8.9%) for women.
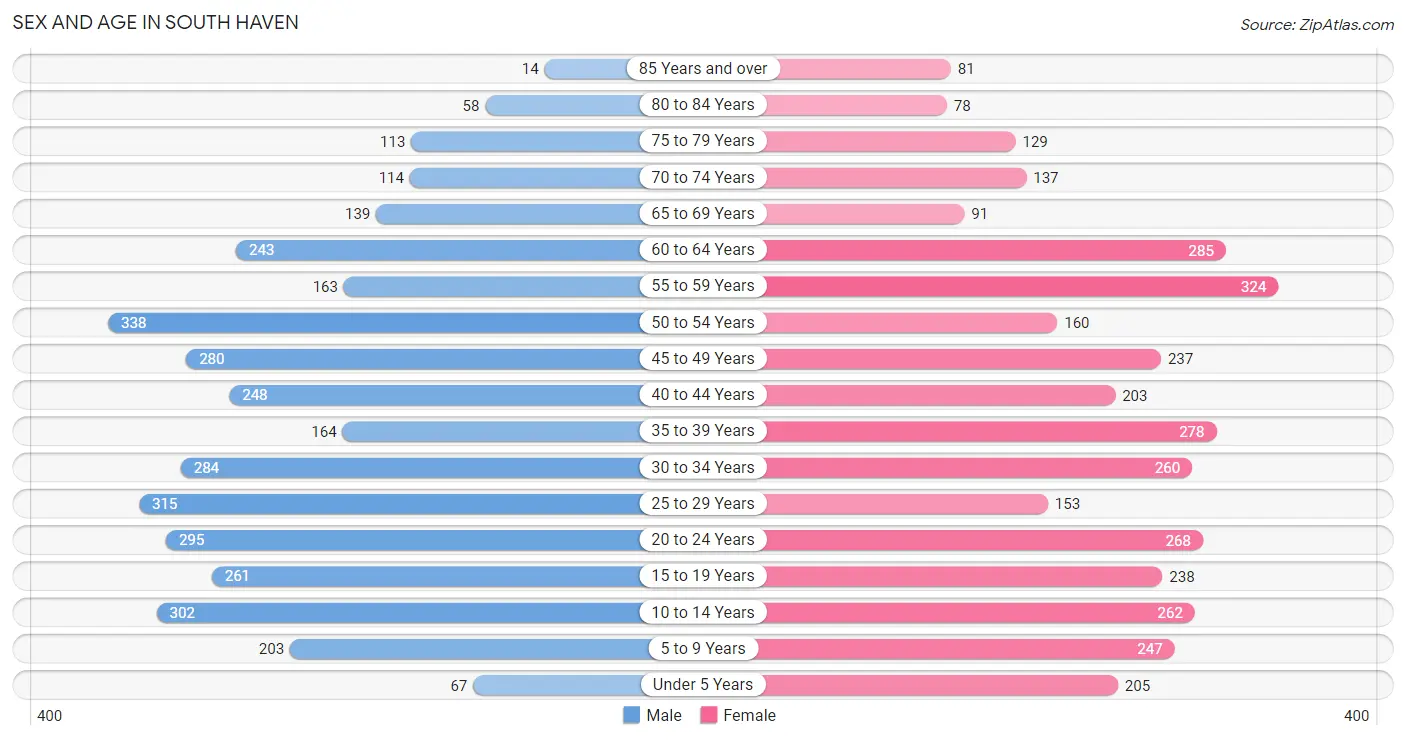
| Age Bracket | Male | Female |
| Under 5 Years | 67 (1.9%) | 205 (5.6%) |
| 5 to 9 Years | 203 (5.6%) | 247 (6.8%) |
| 10 to 14 Years | 302 (8.4%) | 262 (7.2%) |
| 15 to 19 Years | 261 (7.2%) | 238 (6.6%) |
| 20 to 24 Years | 295 (8.2%) | 268 (7.4%) |
| 25 to 29 Years | 315 (8.7%) | 153 (4.2%) |
| 30 to 34 Years | 284 (7.9%) | 260 (7.1%) |
| 35 to 39 Years | 164 (4.5%) | 278 (7.6%) |
| 40 to 44 Years | 248 (6.9%) | 203 (5.6%) |
| 45 to 49 Years | 280 (7.8%) | 237 (6.5%) |
| 50 to 54 Years | 338 (9.4%) | 160 (4.4%) |
| 55 to 59 Years | 163 (4.5%) | 324 (8.9%) |
| 60 to 64 Years | 243 (6.8%) | 285 (7.8%) |
| 65 to 69 Years | 139 (3.9%) | 91 (2.5%) |
| 70 to 74 Years | 114 (3.2%) | 137 (3.8%) |
| 75 to 79 Years | 113 (3.1%) | 129 (3.5%) |
| 80 to 84 Years | 58 (1.6%) | 78 (2.1%) |
| 85 Years and over | 14 (0.4%) | 81 (2.2%) |
| Total | 3,601 (100.0%) | 3,636 (100.0%) |
Families and Households in South Haven
Median Family Size in South Haven
The median family size in South Haven is 3.04 persons per family, with married-couple families (1,364 | 69.5%) accounting for the largest median family size of 3.1 persons per family. On the other hand, single male/father families (233 | 11.9%) represent the smallest median family size with 2.85 persons per family.
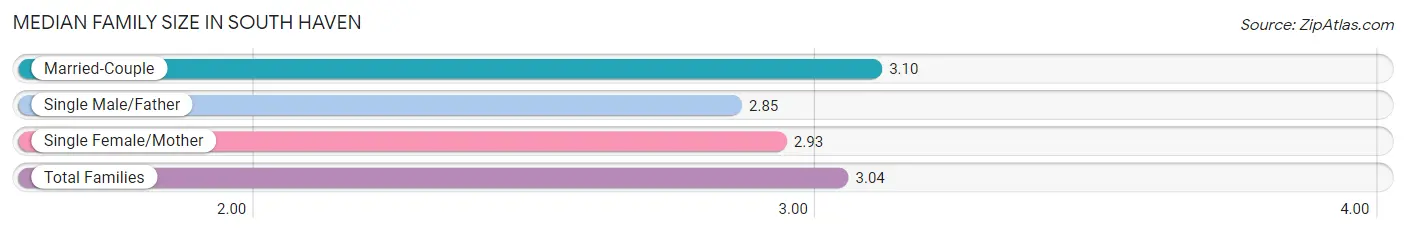
| Family Type | # Families | Family Size |
| Married-Couple | 1,364 (69.5%) | 3.10 |
| Single Male/Father | 233 (11.9%) | 2.85 |
| Single Female/Mother | 367 (18.7%) | 2.93 |
| Total Families | 1,964 (100.0%) | 3.04 |
Median Household Size in South Haven
The median household size in South Haven is 2.63 persons per household, with single male/father households (233 | 8.5%) accounting for the largest median household size of 3.42 persons per household. non-family households (787 | 28.6%) represent the smallest median household size with 1.31 persons per household.
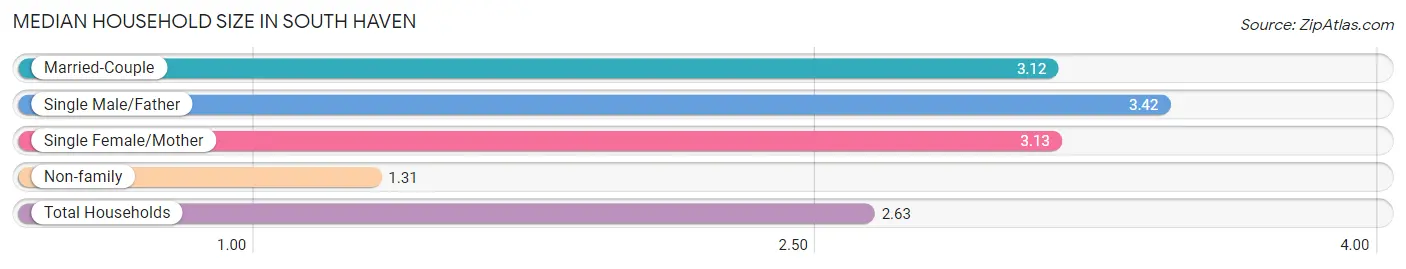
| Household Type | # Households | Household Size |
| Married-Couple | 1,364 (49.6%) | 3.12 |
| Single Male/Father | 233 (8.5%) | 3.42 |
| Single Female/Mother | 367 (13.3%) | 3.13 |
| Non-family | 787 (28.6%) | 1.31 |
| Total Households | 2,751 (100.0%) | 2.63 |
Household Size by Marriage Status in South Haven
Out of a total of 2,751 households in South Haven, 1,964 (71.4%) are family households, while 787 (28.6%) are nonfamily households. The most numerous type of family households are 2-person households, comprising 867, and the most common type of nonfamily households are 1-person households, comprising 545.
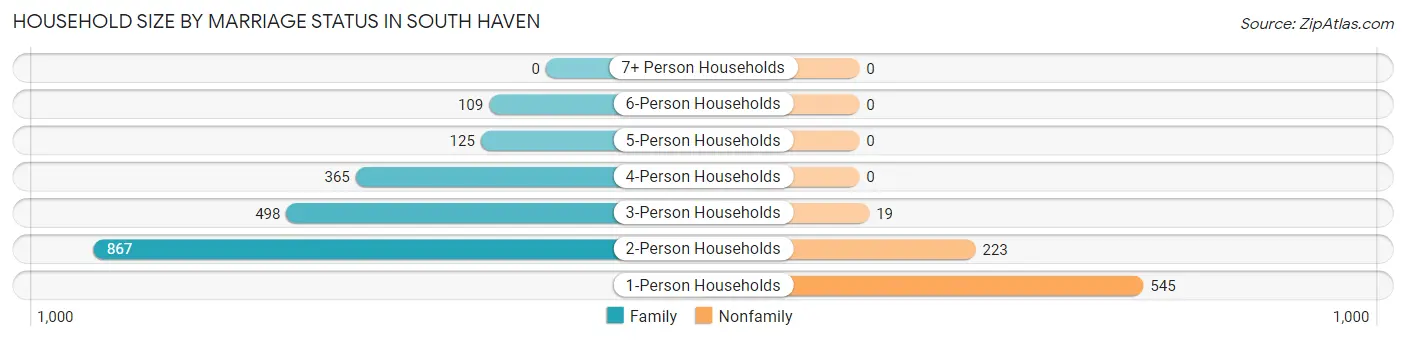
| Household Size | Family Households | Nonfamily Households |
| 1-Person Households | - | 545 (19.8%) |
| 2-Person Households | 867 (31.5%) | 223 (8.1%) |
| 3-Person Households | 498 (18.1%) | 19 (0.7%) |
| 4-Person Households | 365 (13.3%) | 0 (0.0%) |
| 5-Person Households | 125 (4.5%) | 0 (0.0%) |
| 6-Person Households | 109 (4.0%) | 0 (0.0%) |
| 7+ Person Households | 0 (0.0%) | 0 (0.0%) |
| Total | 1,964 (71.4%) | 787 (28.6%) |
Female Fertility in South Haven
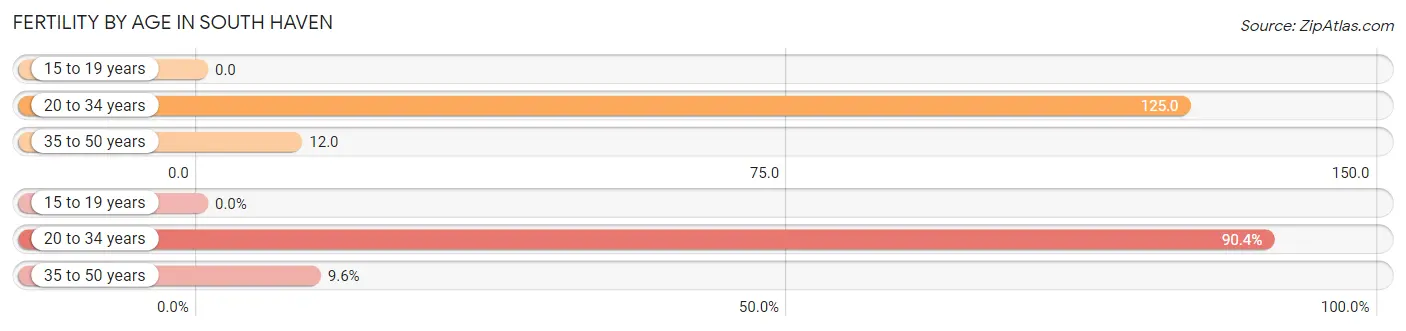
Fertility by Age in South Haven
Average fertility rate in South Haven is 56.0 births per 1,000 women. Women in the age bracket of 20 to 34 years have the highest fertility rate with 125.0 births per 1,000 women. Women in the age bracket of 20 to 34 years acount for 90.4% of all women with births.
| Age Bracket | Women with Births | Births / 1,000 Women |
| 15 to 19 years | 0 (0.0%) | 0.0 |
| 20 to 34 years | 85 (90.4%) | 125.0 |
| 35 to 50 years | 9 (9.6%) | 12.0 |
| Total | 94 (100.0%) | 56.0 |
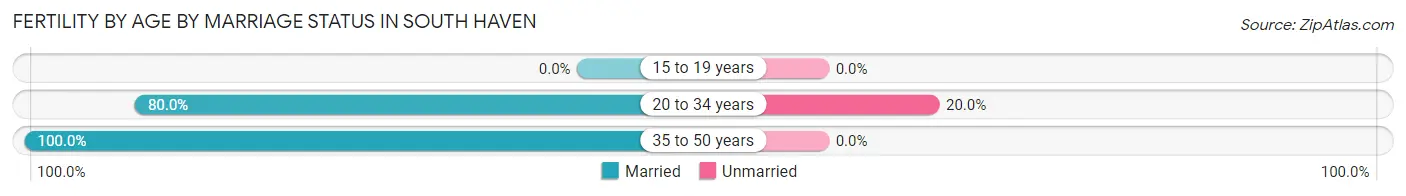
Fertility by Age by Marriage Status in South Haven
81.9% of women with births (94) in South Haven are married. The highest percentage of unmarried women with births falls into 20 to 34 years age bracket with 20.0% of them unmarried at the time of birth, while the lowest percentage of unmarried women with births belong to 35 to 50 years age bracket with 0.0% of them unmarried.
| Age Bracket | Married | Unmarried |
| 15 to 19 years | 0 (0.0%) | 0 (0.0%) |
| 20 to 34 years | 68 (80.0%) | 17 (20.0%) |
| 35 to 50 years | 9 (100.0%) | 0 (0.0%) |
| Total | 77 (81.9%) | 17 (18.1%) |
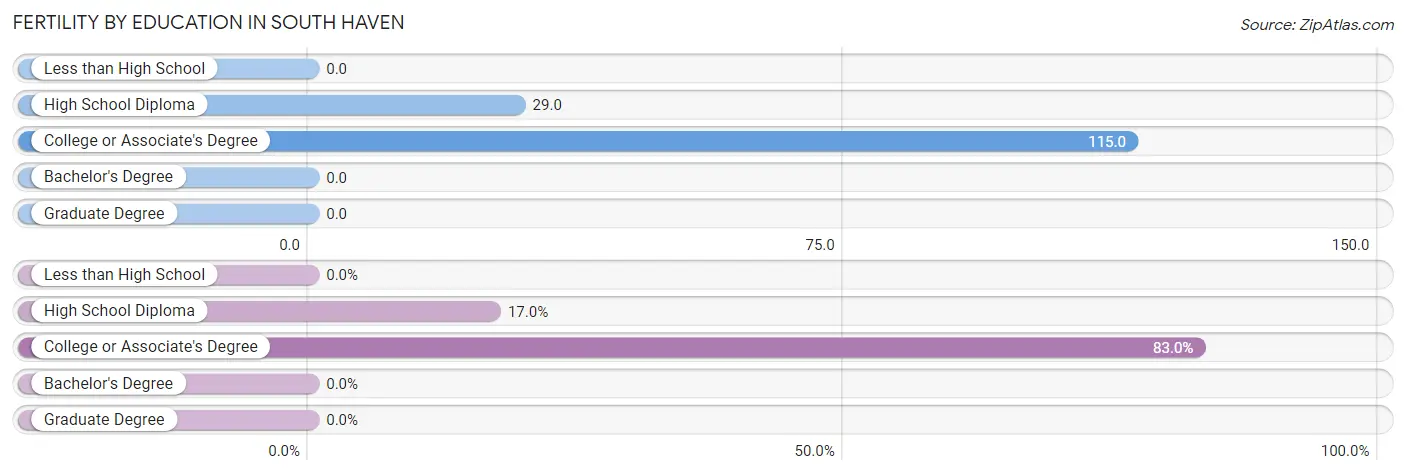
Fertility by Education in South Haven
| Educational Attainment | Women with Births | Births / 1,000 Women |
| Less than High School | 0 (0.0%) | 0.0 |
| High School Diploma | 16 (17.0%) | 29.0 |
| College or Associate's Degree | 78 (83.0%) | 115.0 |
| Bachelor's Degree | 0 (0.0%) | 0.0 |
| Graduate Degree | 0 (0.0%) | 0.0 |
| Total | 94 (100.0%) | 56.0 |
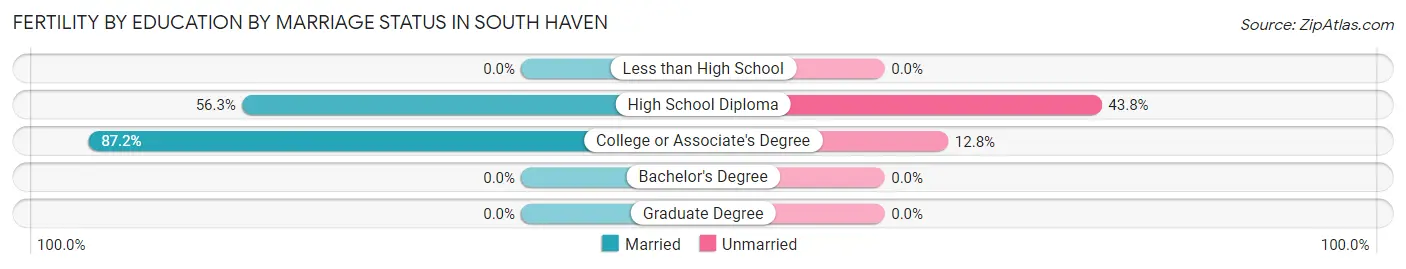
Fertility by Education by Marriage Status in South Haven
18.1% of women with births in South Haven are unmarried. Women with the educational attainment of college or associate's degree are most likely to be married with 87.2% of them married at childbirth, while women with the educational attainment of high school diploma are least likely to be married with 43.8% of them unmarried at childbirth.
| Educational Attainment | Married | Unmarried |
| Less than High School | 0 (0.0%) | 0 (0.0%) |
| High School Diploma | 9 (56.2%) | 7 (43.8%) |
| College or Associate's Degree | 68 (87.2%) | 10 (12.8%) |
| Bachelor's Degree | 0 (0.0%) | 0 (0.0%) |
| Graduate Degree | 0 (0.0%) | 0 (0.0%) |
| Total | 77 (81.9%) | 17 (18.1%) |
Income in South Haven
Income Overview in South Haven
Per Capita Income in South Haven is $33,293, while median incomes of families and households are $78,426 and $72,068 respectively.
| Characteristic | Number | Measure |
| Per Capita Income | 7,237 | $33,293 |
| Median Family Income | 1,964 | $78,426 |
| Mean Family Income | 1,964 | $79,952 |
| Median Household Income | 2,751 | $72,068 |
| Mean Household Income | 2,751 | $85,942 |
| Income Deficit | 1,964 | $0 |
| Wage / Income Gap (%) | 7,237 | 28.18% |
| Wage / Income Gap ($) | 7,237 | 71.82¢ per $1 |
| Gini / Inequality Index | 7,237 | 0.42 |
Earnings by Sex in South Haven
Average Earnings in South Haven are $38,595, $44,193 for men and $31,739 for women, a difference of 28.2%.
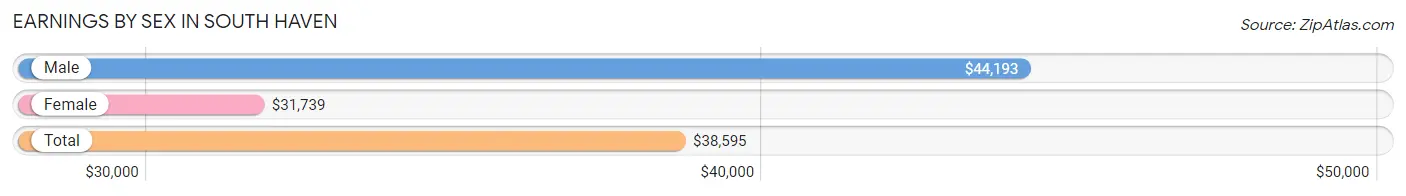
| Sex | Number | Average Earnings |
| Male | 2,005 (54.1%) | $44,193 |
| Female | 1,702 (45.9%) | $31,739 |
| Total | 3,707 (100.0%) | $38,595 |
Earnings by Sex by Income Bracket in South Haven
The most common earnings brackets in South Haven are $100,000+ for men (309 | 15.4%) and $50,000 to $54,999 for women (202 | 11.9%).
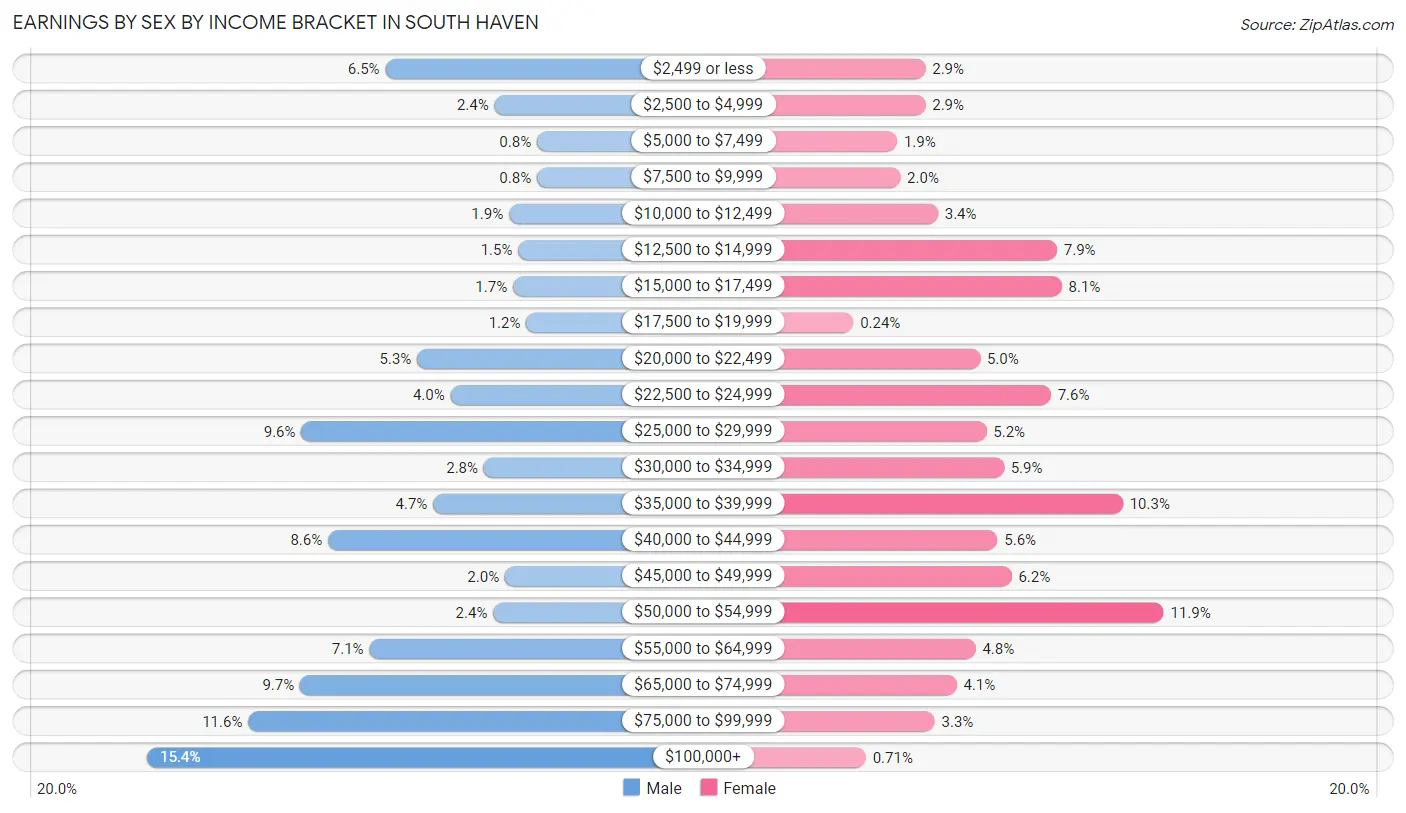
| Income | Male | Female |
| $2,499 or less | 130 (6.5%) | 50 (2.9%) |
| $2,500 to $4,999 | 48 (2.4%) | 50 (2.9%) |
| $5,000 to $7,499 | 16 (0.8%) | 32 (1.9%) |
| $7,500 to $9,999 | 16 (0.8%) | 34 (2.0%) |
| $10,000 to $12,499 | 37 (1.8%) | 58 (3.4%) |
| $12,500 to $14,999 | 30 (1.5%) | 134 (7.9%) |
| $15,000 to $17,499 | 34 (1.7%) | 137 (8.1%) |
| $17,500 to $19,999 | 24 (1.2%) | 4 (0.2%) |
| $20,000 to $22,499 | 106 (5.3%) | 85 (5.0%) |
| $22,500 to $24,999 | 81 (4.0%) | 130 (7.6%) |
| $25,000 to $29,999 | 193 (9.6%) | 89 (5.2%) |
| $30,000 to $34,999 | 56 (2.8%) | 100 (5.9%) |
| $35,000 to $39,999 | 94 (4.7%) | 176 (10.3%) |
| $40,000 to $44,999 | 173 (8.6%) | 96 (5.6%) |
| $45,000 to $49,999 | 40 (2.0%) | 105 (6.2%) |
| $50,000 to $54,999 | 49 (2.4%) | 202 (11.9%) |
| $55,000 to $64,999 | 142 (7.1%) | 82 (4.8%) |
| $65,000 to $74,999 | 194 (9.7%) | 70 (4.1%) |
| $75,000 to $99,999 | 233 (11.6%) | 56 (3.3%) |
| $100,000+ | 309 (15.4%) | 12 (0.7%) |
| Total | 2,005 (100.0%) | 1,702 (100.0%) |
Earnings by Sex by Educational Attainment in South Haven
Average earnings in South Haven are $52,957 for men and $37,757 for women, a difference of 28.7%. Men with an educational attainment of graduate degree enjoy the highest average annual earnings of $74,010, while those with less than high school education earn the least with $42,792. Women with an educational attainment of graduate degree earn the most with the average annual earnings of $61,250, while those with high school diploma education have the smallest earnings of $31,278.
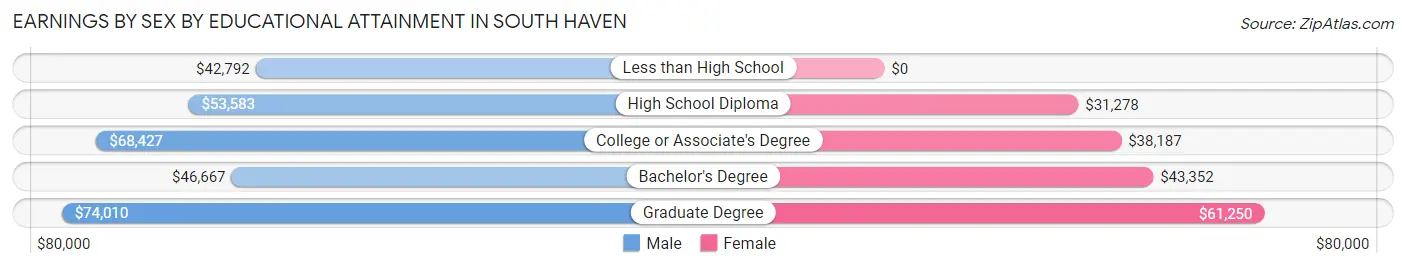
| Educational Attainment | Male Income | Female Income |
| Less than High School | $42,792 | $0 |
| High School Diploma | $53,583 | $31,278 |
| College or Associate's Degree | $68,427 | $38,187 |
| Bachelor's Degree | $46,667 | $43,352 |
| Graduate Degree | $74,010 | $61,250 |
| Total | $52,957 | $37,757 |
Family Income in South Haven
Family Income Brackets in South Haven
According to the South Haven family income data, there are 473 families falling into the $75,000 to $99,999 income range, which is the most common income bracket and makes up 24.1% of all families. Conversely, the less than $10,000 income bracket is the least frequent group with only 10 families (0.5%) belonging to this category.
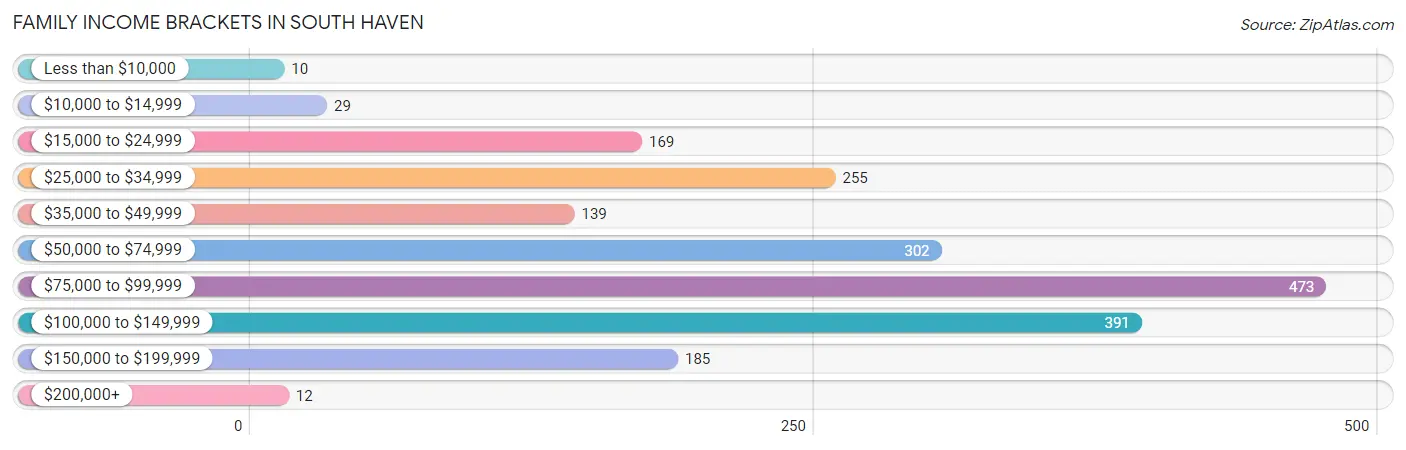
| Income Bracket | # Families | % Families |
| Less than $10,000 | 10 | 0.5% |
| $10,000 to $14,999 | 29 | 1.5% |
| $15,000 to $24,999 | 169 | 8.6% |
| $25,000 to $34,999 | 255 | 13.0% |
| $35,000 to $49,999 | 139 | 7.1% |
| $50,000 to $74,999 | 302 | 15.4% |
| $75,000 to $99,999 | 473 | 24.1% |
| $100,000 to $149,999 | 391 | 19.9% |
| $150,000 to $199,999 | 185 | 9.4% |
| $200,000+ | 12 | 0.6% |
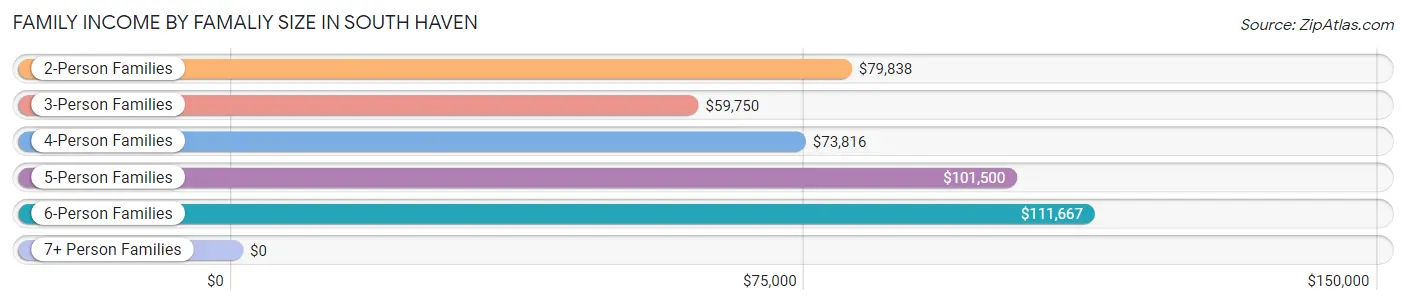
Family Income by Famaliy Size in South Haven
6-person families (104 | 5.3%) account for the highest median family income in South Haven with $111,667 per family, while 2-person families (939 | 47.8%) have the highest median income of $39,919 per family member.
| Income Bracket | # Families | Median Income |
| 2-Person Families | 939 (47.8%) | $79,838 |
| 3-Person Families | 539 (27.4%) | $59,750 |
| 4-Person Families | 274 (14.0%) | $73,816 |
| 5-Person Families | 108 (5.5%) | $101,500 |
| 6-Person Families | 104 (5.3%) | $111,667 |
| 7+ Person Families | 0 (0.0%) | $0 |
| Total | 1,964 (100.0%) | $78,426 |
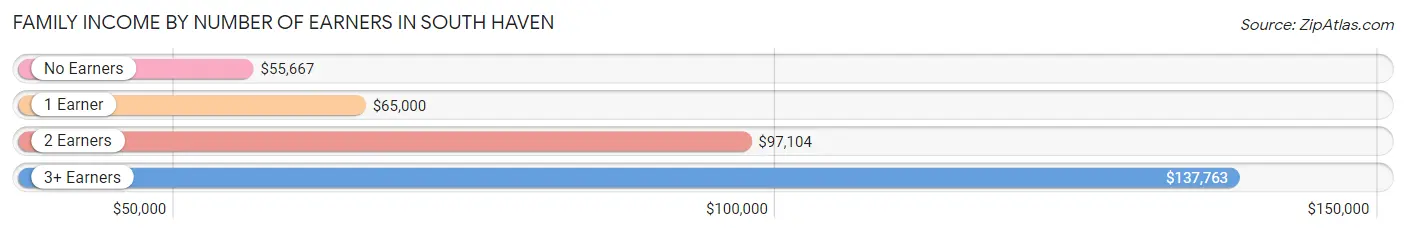
Family Income by Number of Earners in South Haven
The median family income in South Haven is $78,426, with families comprising 3+ earners (112) having the highest median family income of $137,763, while families with no earners (330) have the lowest median family income of $55,667, accounting for 5.7% and 16.8% of families, respectively.
| Number of Earners | # Families | Median Income |
| No Earners | 330 (16.8%) | $55,667 |
| 1 Earner | 756 (38.5%) | $65,000 |
| 2 Earners | 766 (39.0%) | $97,104 |
| 3+ Earners | 112 (5.7%) | $137,763 |
| Total | 1,964 (100.0%) | $78,426 |
Household Income in South Haven
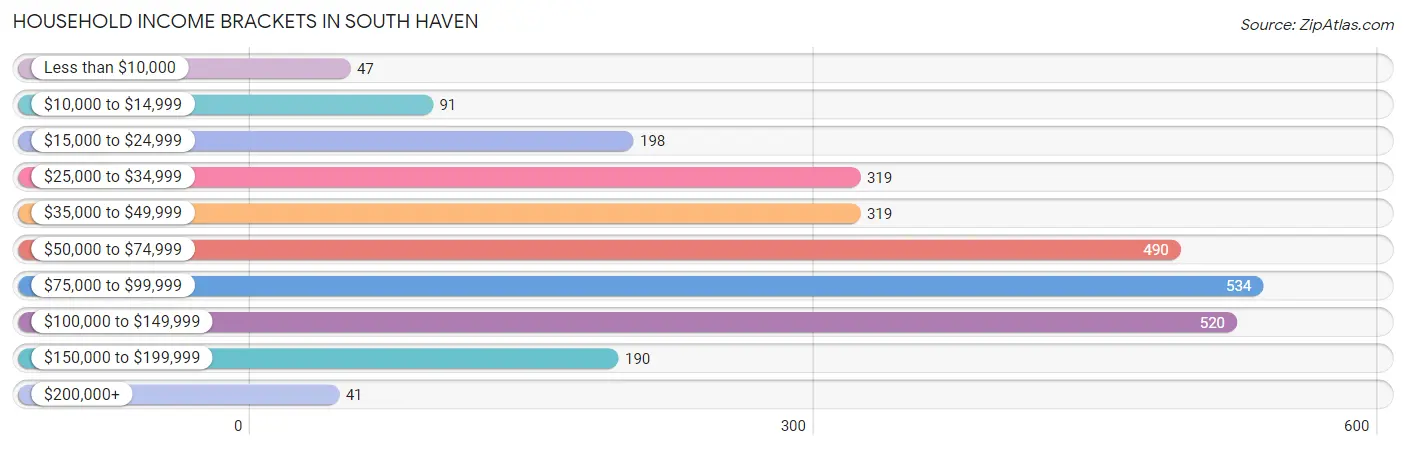
Household Income Brackets in South Haven
With 534 households falling in the category, the $75,000 to $99,999 income range is the most frequent in South Haven, accounting for 19.4% of all households. In contrast, only 41 households (1.5%) fall into the $200,000+ income bracket, making it the least populous group.
| Income Bracket | # Households | % Households |
| Less than $10,000 | 47 | 1.7% |
| $10,000 to $14,999 | 91 | 3.3% |
| $15,000 to $24,999 | 198 | 7.2% |
| $25,000 to $34,999 | 319 | 11.6% |
| $35,000 to $49,999 | 319 | 11.6% |
| $50,000 to $74,999 | 490 | 17.8% |
| $75,000 to $99,999 | 534 | 19.4% |
| $100,000 to $149,999 | 520 | 18.9% |
| $150,000 to $199,999 | 190 | 6.9% |
| $200,000+ | 41 | 1.5% |
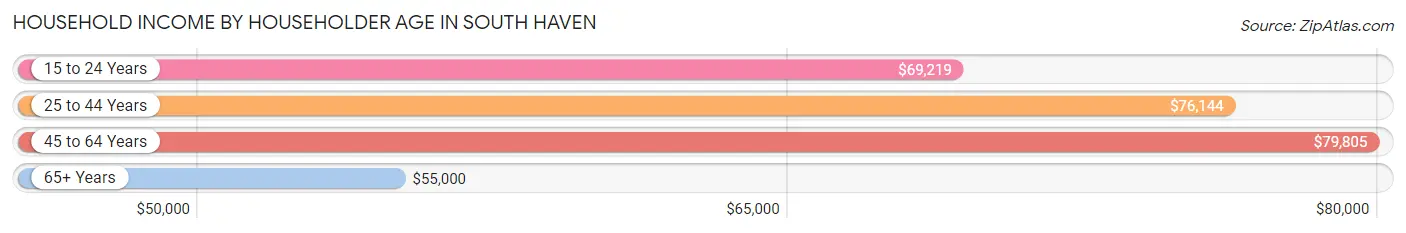
Household Income by Householder Age in South Haven
The median household income in South Haven is $72,068, with the highest median household income of $79,805 found in the 45 to 64 years age bracket for the primary householder. A total of 1,179 households (42.9%) fall into this category. Meanwhile, the 65+ years age bracket for the primary householder has the lowest median household income of $55,000, with 554 households (20.1%) in this group.
| Income Bracket | # Households | Median Income |
| 15 to 24 Years | 147 (5.3%) | $69,219 |
| 25 to 44 Years | 871 (31.7%) | $76,144 |
| 45 to 64 Years | 1,179 (42.9%) | $79,805 |
| 65+ Years | 554 (20.1%) | $55,000 |
| Total | 2,751 (100.0%) | $72,068 |
Poverty in South Haven
Income Below Poverty by Sex and Age in South Haven
With 13.3% poverty level for males and 12.4% for females among the residents of South Haven, 15 year old males and 12 to 14 year old females are the most vulnerable to poverty, with 119 males (100.0%) and 54 females (31.2%) in their respective age groups living below the poverty level.
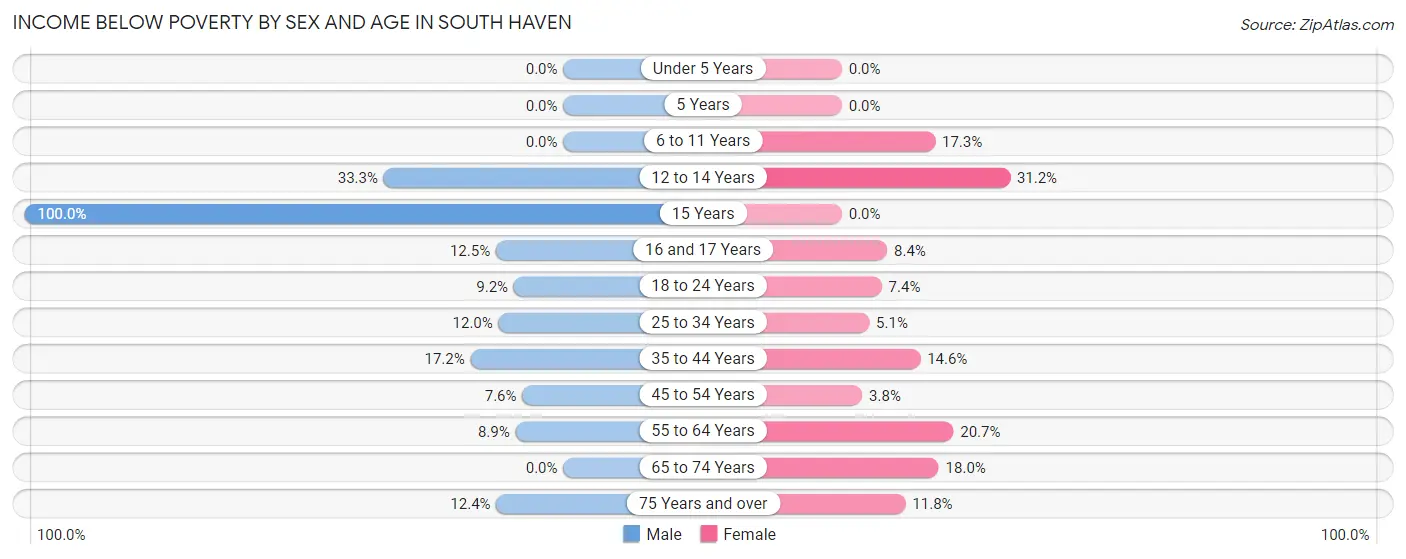
| Age Bracket | Male | Female |
| Under 5 Years | 0 (0.0%) | 0 (0.0%) |
| 5 Years | 0 (0.0%) | 0 (0.0%) |
| 6 to 11 Years | 0 (0.0%) | 55 (17.3%) |
| 12 to 14 Years | 68 (33.3%) | 54 (31.2%) |
| 15 Years | 119 (100.0%) | 0 (0.0%) |
| 16 and 17 Years | 11 (12.5%) | 9 (8.4%) |
| 18 to 24 Years | 32 (9.2%) | 27 (7.4%) |
| 25 to 34 Years | 72 (12.0%) | 21 (5.1%) |
| 35 to 44 Years | 71 (17.2%) | 70 (14.5%) |
| 45 to 54 Years | 47 (7.6%) | 15 (3.8%) |
| 55 to 64 Years | 36 (8.9%) | 126 (20.7%) |
| 65 to 74 Years | 0 (0.0%) | 41 (18.0%) |
| 75 Years and over | 23 (12.4%) | 34 (11.8%) |
| Total | 479 (13.3%) | 452 (12.4%) |
Income Above Poverty by Sex and Age in South Haven
According to the poverty statistics in South Haven, males aged under 5 years and females aged under 5 years are the age groups that are most secure financially, with 100.0% of males and 100.0% of females in these age groups living above the poverty line.
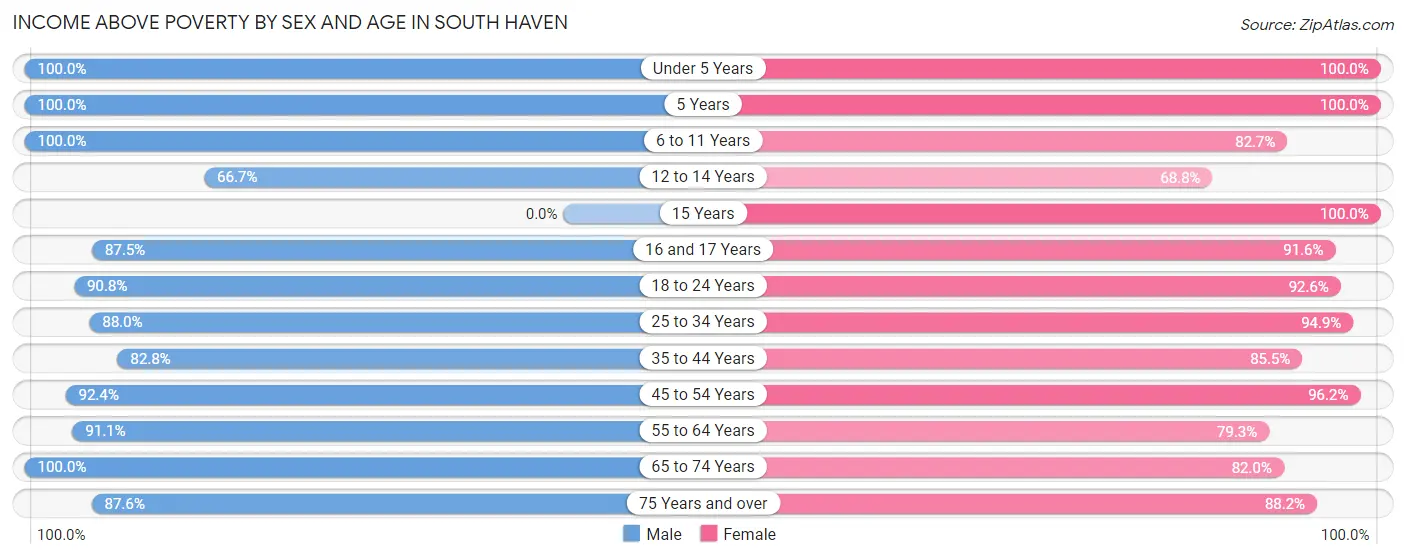
| Age Bracket | Male | Female |
| Under 5 Years | 67 (100.0%) | 205 (100.0%) |
| 5 Years | 66 (100.0%) | 17 (100.0%) |
| 6 to 11 Years | 227 (100.0%) | 263 (82.7%) |
| 12 to 14 Years | 136 (66.7%) | 119 (68.8%) |
| 15 Years | 0 (0.0%) | 34 (100.0%) |
| 16 and 17 Years | 77 (87.5%) | 98 (91.6%) |
| 18 to 24 Years | 317 (90.8%) | 338 (92.6%) |
| 25 to 34 Years | 527 (88.0%) | 392 (94.9%) |
| 35 to 44 Years | 341 (82.8%) | 411 (85.5%) |
| 45 to 54 Years | 571 (92.4%) | 382 (96.2%) |
| 55 to 64 Years | 370 (91.1%) | 483 (79.3%) |
| 65 to 74 Years | 253 (100.0%) | 187 (82.0%) |
| 75 Years and over | 162 (87.6%) | 254 (88.2%) |
| Total | 3,114 (86.7%) | 3,183 (87.6%) |
Income Below Poverty Among Married-Couple Families in South Haven
The poverty statistics for married-couple families in South Haven show that 5.4% or 74 of the total 1,364 families live below the poverty line. Families with 1 or 2 children have the highest poverty rate of 7.7%, comprising of 32 families. On the other hand, families with 3 or 4 children have the lowest poverty rate of 0.0%, which includes 0 families.
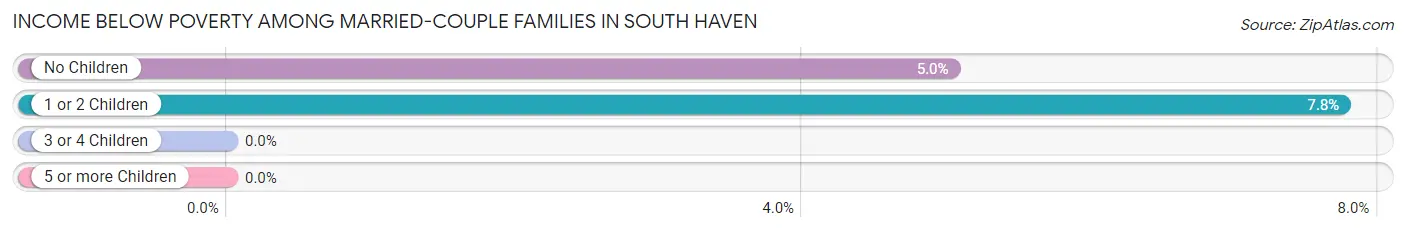
| Children | Above Poverty | Below Poverty |
| No Children | 793 (95.0%) | 42 (5.0%) |
| 1 or 2 Children | 381 (92.2%) | 32 (7.7%) |
| 3 or 4 Children | 116 (100.0%) | 0 (0.0%) |
| 5 or more Children | 0 (0.0%) | 0 (0.0%) |
| Total | 1,290 (94.6%) | 74 (5.4%) |
Income Below Poverty Among Single-Parent Households in South Haven
According to the poverty data in South Haven, 17.6% or 41 single-father households and 30.5% or 112 single-mother households are living below the poverty line. Among single-father households, those with 3 or 4 children have the highest poverty rate, with 41 households (71.9%) experiencing poverty. Likewise, among single-mother households, those with 1 or 2 children have the highest poverty rate, with 98 households (59.8%) falling below the poverty line.
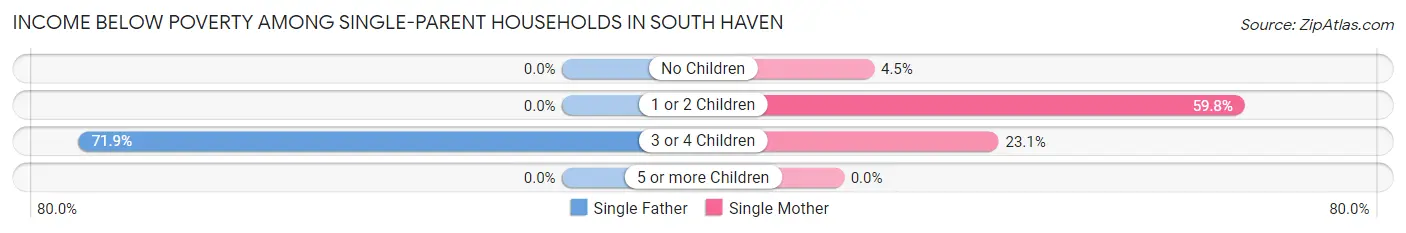
| Children | Single Father | Single Mother |
| No Children | 0 (0.0%) | 8 (4.5%) |
| 1 or 2 Children | 0 (0.0%) | 98 (59.8%) |
| 3 or 4 Children | 41 (71.9%) | 6 (23.1%) |
| 5 or more Children | 0 (0.0%) | 0 (0.0%) |
| Total | 41 (17.6%) | 112 (30.5%) |
Income Below Poverty Among Married-Couple vs Single-Parent Households in South Haven
The poverty data for South Haven shows that 74 of the married-couple family households (5.4%) and 153 of the single-parent households (25.5%) are living below the poverty level. Within the married-couple family households, those with 1 or 2 children have the highest poverty rate, with 32 households (7.7%) falling below the poverty line. Among the single-parent households, those with 3 or 4 children have the highest poverty rate, with 47 household (56.6%) living below poverty.
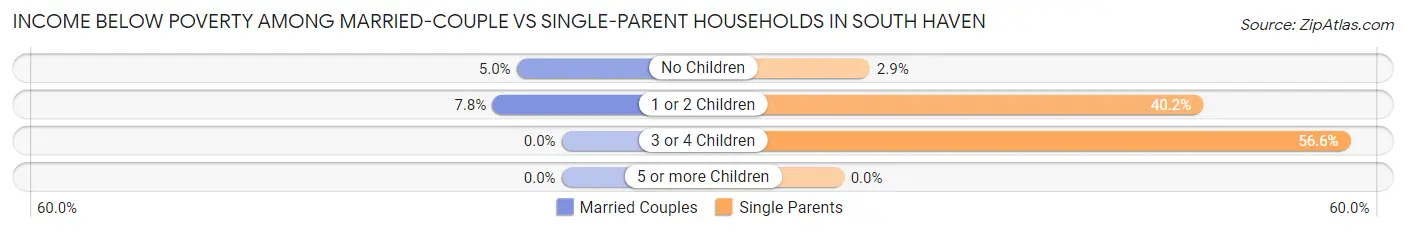
| Children | Married-Couple Families | Single-Parent Households |
| No Children | 42 (5.0%) | 8 (2.9%) |
| 1 or 2 Children | 32 (7.7%) | 98 (40.2%) |
| 3 or 4 Children | 0 (0.0%) | 47 (56.6%) |
| 5 or more Children | 0 (0.0%) | 0 (0.0%) |
| Total | 74 (5.4%) | 153 (25.5%) |
Employment Characteristics in South Haven
Employment by Class of Employer in South Haven
Among the 3,454 employed individuals in South Haven, private company employees (2,781 | 80.5%), not-for-profit organizations (268 | 7.8%), and local government employees (222 | 6.4%) make up the most common classes of employment.
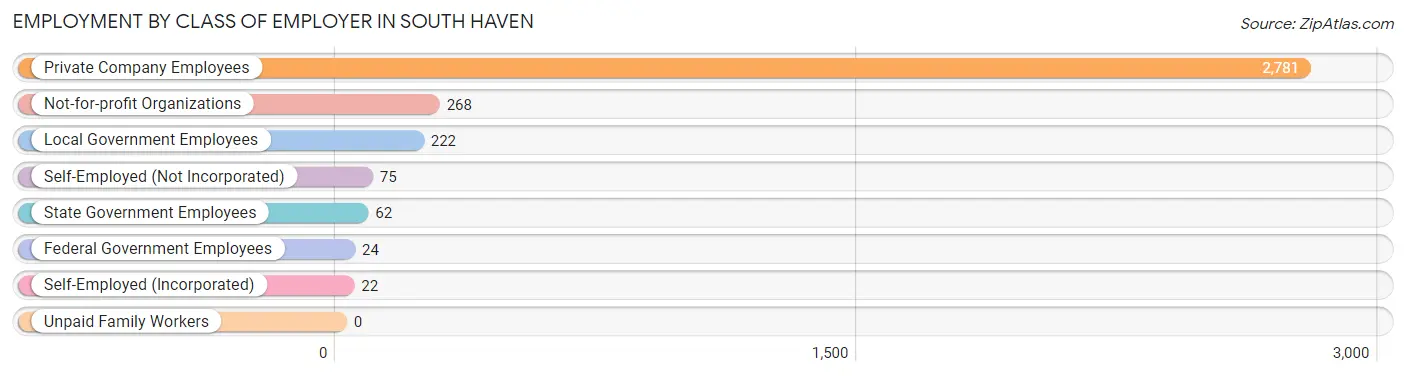
| Employer Class | # Employees | % Employees |
| Private Company Employees | 2,781 | 80.5% |
| Self-Employed (Incorporated) | 22 | 0.6% |
| Self-Employed (Not Incorporated) | 75 | 2.2% |
| Not-for-profit Organizations | 268 | 7.8% |
| Local Government Employees | 222 | 6.4% |
| State Government Employees | 62 | 1.8% |
| Federal Government Employees | 24 | 0.7% |
| Unpaid Family Workers | 0 | 0.0% |
| Total | 3,454 | 100.0% |
Employment Status by Age in South Haven
According to the labor force statistics for South Haven, out of the total population over 16 years of age (5,798), 63.9% or 3,705 individuals are in the labor force, with 3.9% or 144 of them unemployed. The age group with the highest labor force participation rate is 20 to 24 years, with 85.1% or 479 individuals in the labor force. Within the labor force, the 16 to 19 years age range has the highest percentage of unemployed individuals, with 11.9% or 17 of them being unemployed.
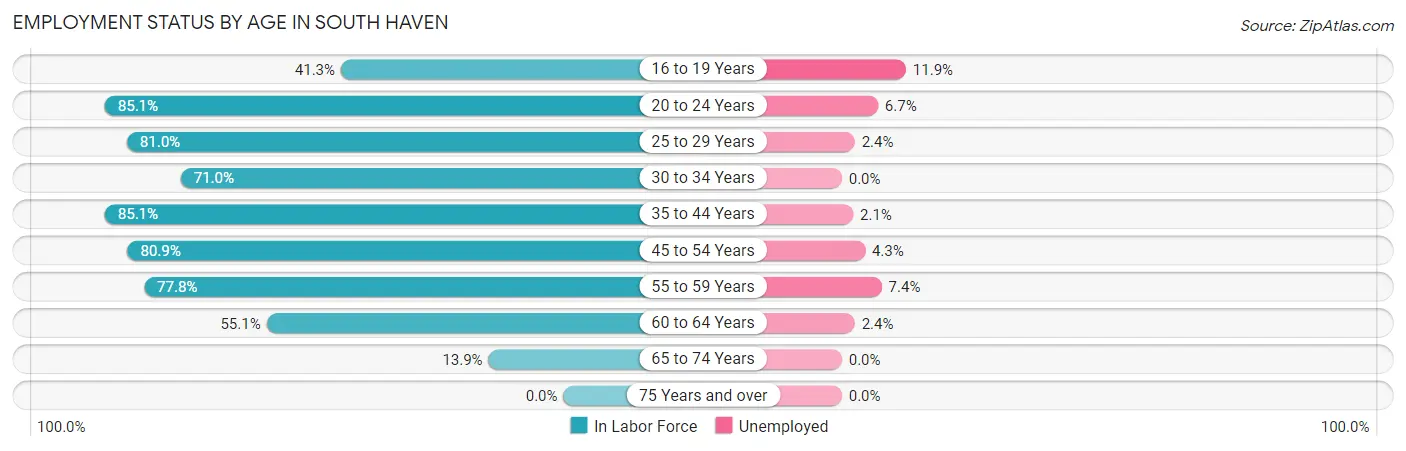
| Age Bracket | In Labor Force | Unemployed |
| 16 to 19 Years | 143 (41.3%) | 17 (11.9%) |
| 20 to 24 Years | 479 (85.1%) | 32 (6.7%) |
| 25 to 29 Years | 379 (81.0%) | 9 (2.4%) |
| 30 to 34 Years | 386 (71.0%) | 0 (0.0%) |
| 35 to 44 Years | 760 (85.1%) | 16 (2.1%) |
| 45 to 54 Years | 821 (80.9%) | 35 (4.3%) |
| 55 to 59 Years | 379 (77.8%) | 28 (7.4%) |
| 60 to 64 Years | 291 (55.1%) | 7 (2.4%) |
| 65 to 74 Years | 67 (13.9%) | 0 (0.0%) |
| 75 Years and over | 0 (0.0%) | 0 (0.0%) |
| Total | 3,705 (63.9%) | 144 (3.9%) |
Employment Status by Educational Attainment in South Haven
According to labor force statistics for South Haven, 76.6% of individuals (3,014) out of the total population between 25 and 64 years of age (3,935) are in the labor force, with 3.1% or 93 of them being unemployed. The group with the highest labor force participation rate are those with the educational attainment of bachelor's degree or higher, with 84.2% or 395 individuals in the labor force. Within the labor force, individuals with bachelor's degree or higher education have the highest percentage of unemployment, with 4.8% or 19 of them being unemployed.
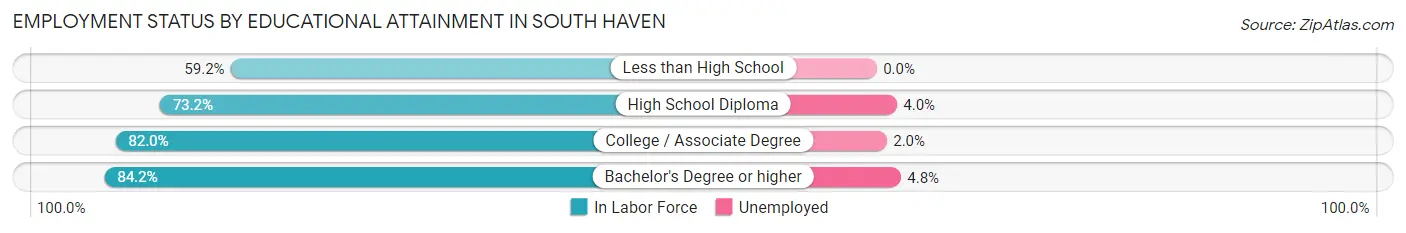
| Educational Attainment | In Labor Force | Unemployed |
| Less than High School | 158 (59.2%) | 0 (0.0%) |
| High School Diploma | 1,335 (73.2%) | 73 (4.0%) |
| College / Associate Degree | 1,128 (82.0%) | 28 (2.0%) |
| Bachelor's Degree or higher | 395 (84.2%) | 23 (4.8%) |
| Total | 3,014 (76.6%) | 122 (3.1%) |
Employment Occupations by Sex in South Haven
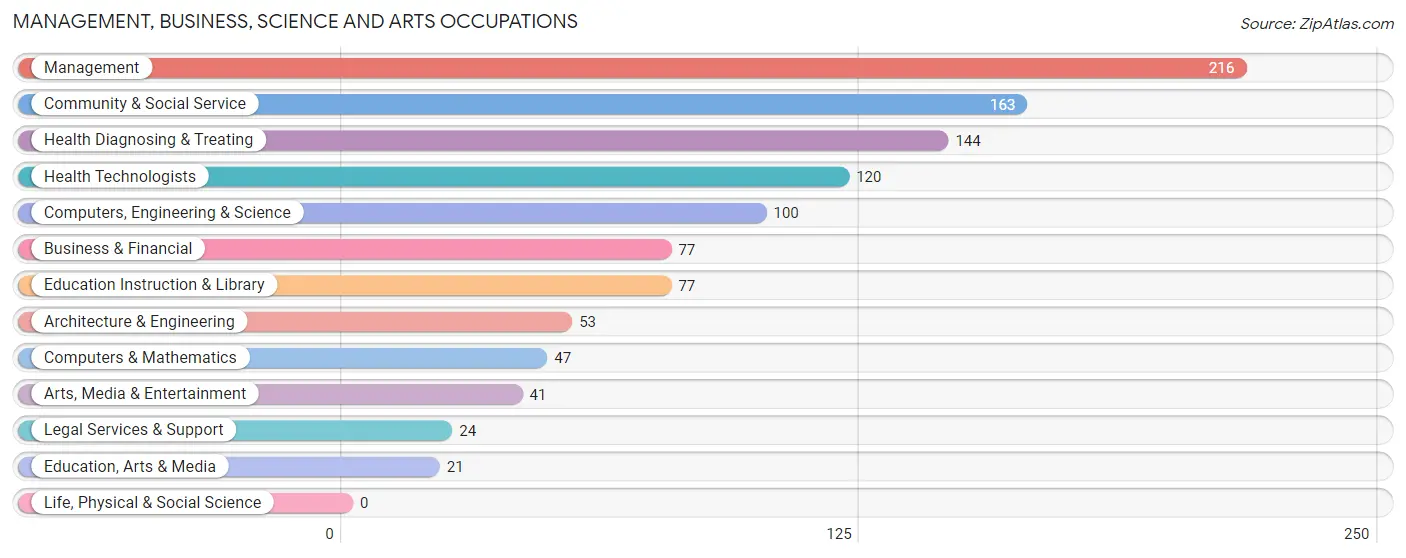
Management, Business, Science and Arts Occupations
The most common Management, Business, Science and Arts occupations in South Haven are Management (216 | 6.1%), Community & Social Service (163 | 4.6%), Health Diagnosing & Treating (144 | 4.0%), Health Technologists (120 | 3.4%), and Computers, Engineering & Science (100 | 2.8%).
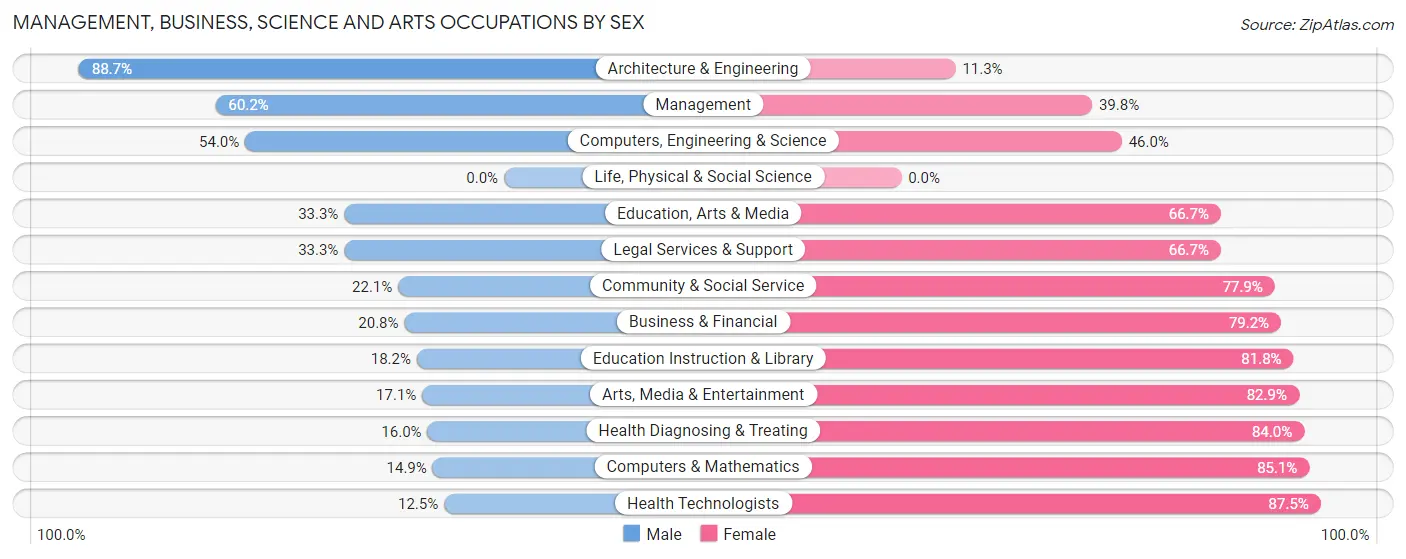
Management, Business, Science and Arts Occupations by Sex
Within the Management, Business, Science and Arts occupations in South Haven, the most male-oriented occupations are Architecture & Engineering (88.7%), Management (60.2%), and Computers, Engineering & Science (54.0%), while the most female-oriented occupations are Health Technologists (87.5%), Computers & Mathematics (85.1%), and Health Diagnosing & Treating (84.0%).
| Occupation | Male | Female |
| Management | 130 (60.2%) | 86 (39.8%) |
| Business & Financial | 16 (20.8%) | 61 (79.2%) |
| Computers, Engineering & Science | 54 (54.0%) | 46 (46.0%) |
| Computers & Mathematics | 7 (14.9%) | 40 (85.1%) |
| Architecture & Engineering | 47 (88.7%) | 6 (11.3%) |
| Life, Physical & Social Science | 0 (0.0%) | 0 (0.0%) |
| Community & Social Service | 36 (22.1%) | 127 (77.9%) |
| Education, Arts & Media | 7 (33.3%) | 14 (66.7%) |
| Legal Services & Support | 8 (33.3%) | 16 (66.7%) |
| Education Instruction & Library | 14 (18.2%) | 63 (81.8%) |
| Arts, Media & Entertainment | 7 (17.1%) | 34 (82.9%) |
| Health Diagnosing & Treating | 23 (16.0%) | 121 (84.0%) |
| Health Technologists | 15 (12.5%) | 105 (87.5%) |
| Total (Category) | 259 (37.0%) | 441 (63.0%) |
| Total (Overall) | 1,920 (53.9%) | 1,641 (46.1%) |
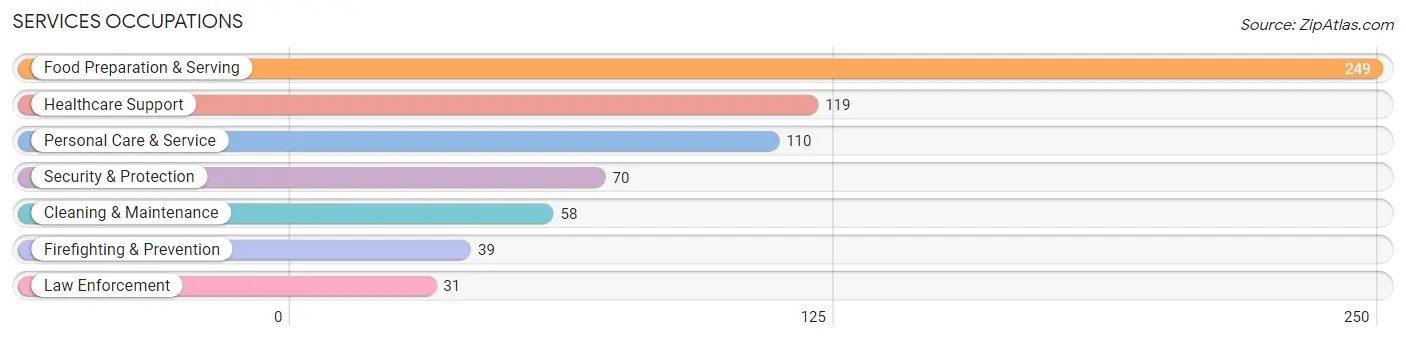
Services Occupations
The most common Services occupations in South Haven are Food Preparation & Serving (249 | 7.0%), Healthcare Support (119 | 3.3%), Personal Care & Service (110 | 3.1%), Security & Protection (70 | 2.0%), and Cleaning & Maintenance (58 | 1.6%).
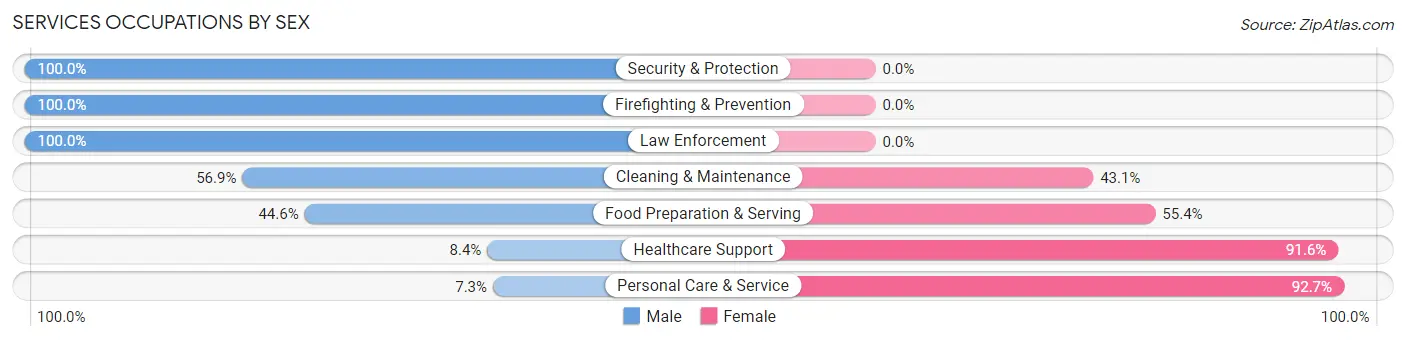
Services Occupations by Sex
Within the Services occupations in South Haven, the most male-oriented occupations are Security & Protection (100.0%), Firefighting & Prevention (100.0%), and Law Enforcement (100.0%), while the most female-oriented occupations are Personal Care & Service (92.7%), Healthcare Support (91.6%), and Food Preparation & Serving (55.4%).
| Occupation | Male | Female |
| Healthcare Support | 10 (8.4%) | 109 (91.6%) |
| Security & Protection | 70 (100.0%) | 0 (0.0%) |
| Firefighting & Prevention | 39 (100.0%) | 0 (0.0%) |
| Law Enforcement | 31 (100.0%) | 0 (0.0%) |
| Food Preparation & Serving | 111 (44.6%) | 138 (55.4%) |
| Cleaning & Maintenance | 33 (56.9%) | 25 (43.1%) |
| Personal Care & Service | 8 (7.3%) | 102 (92.7%) |
| Total (Category) | 232 (38.3%) | 374 (61.7%) |
| Total (Overall) | 1,920 (53.9%) | 1,641 (46.1%) |
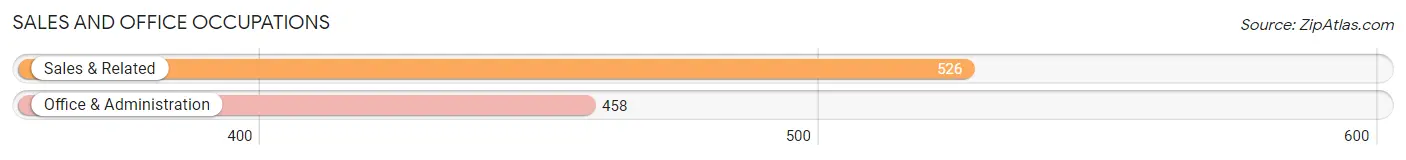
Sales and Office Occupations
The most common Sales and Office occupations in South Haven are Sales & Related (526 | 14.8%), and Office & Administration (458 | 12.9%).
Sales and Office Occupations by Sex
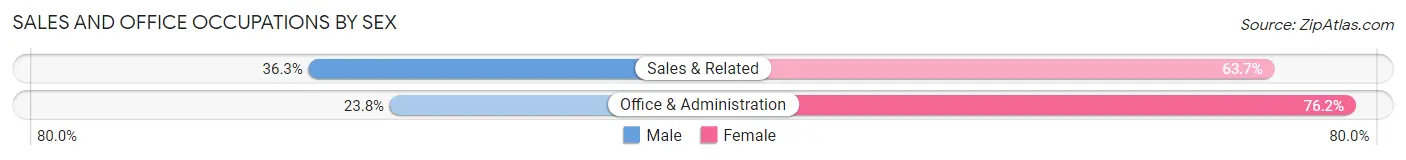
| Occupation | Male | Female |
| Sales & Related | 191 (36.3%) | 335 (63.7%) |
| Office & Administration | 109 (23.8%) | 349 (76.2%) |
| Total (Category) | 300 (30.5%) | 684 (69.5%) |
| Total (Overall) | 1,920 (53.9%) | 1,641 (46.1%) |
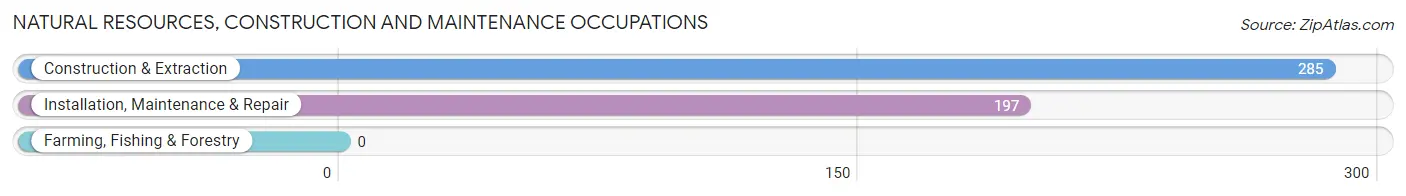
Natural Resources, Construction and Maintenance Occupations
The most common Natural Resources, Construction and Maintenance occupations in South Haven are Construction & Extraction (285 | 8.0%), and Installation, Maintenance & Repair (197 | 5.5%).
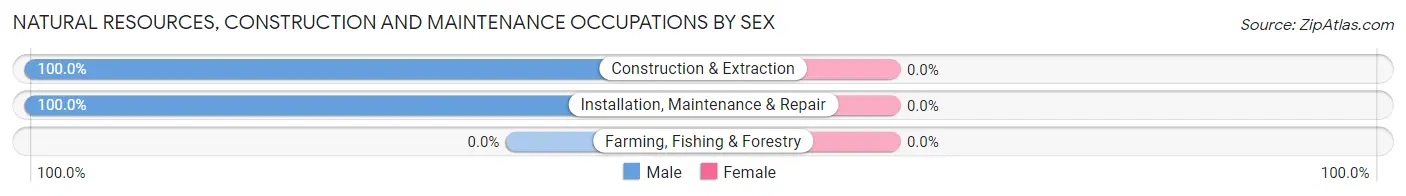
Natural Resources, Construction and Maintenance Occupations by Sex
| Occupation | Male | Female |
| Farming, Fishing & Forestry | 0 (0.0%) | 0 (0.0%) |
| Construction & Extraction | 285 (100.0%) | 0 (0.0%) |
| Installation, Maintenance & Repair | 197 (100.0%) | 0 (0.0%) |
| Total (Category) | 482 (100.0%) | 0 (0.0%) |
| Total (Overall) | 1,920 (53.9%) | 1,641 (46.1%) |
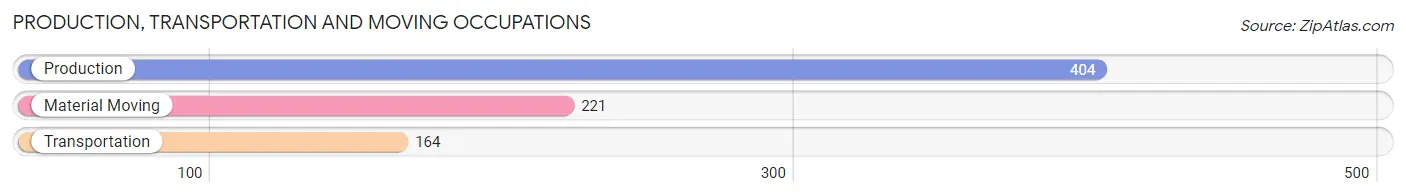
Production, Transportation and Moving Occupations
The most common Production, Transportation and Moving occupations in South Haven are Production (404 | 11.4%), Material Moving (221 | 6.2%), and Transportation (164 | 4.6%).
Production, Transportation and Moving Occupations by Sex
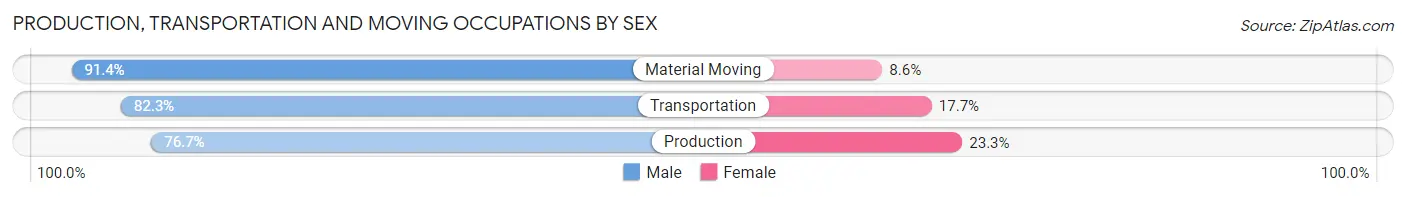
| Occupation | Male | Female |
| Production | 310 (76.7%) | 94 (23.3%) |
| Transportation | 135 (82.3%) | 29 (17.7%) |
| Material Moving | 202 (91.4%) | 19 (8.6%) |
| Total (Category) | 647 (82.0%) | 142 (18.0%) |
| Total (Overall) | 1,920 (53.9%) | 1,641 (46.1%) |
Employment Industries by Sex in South Haven
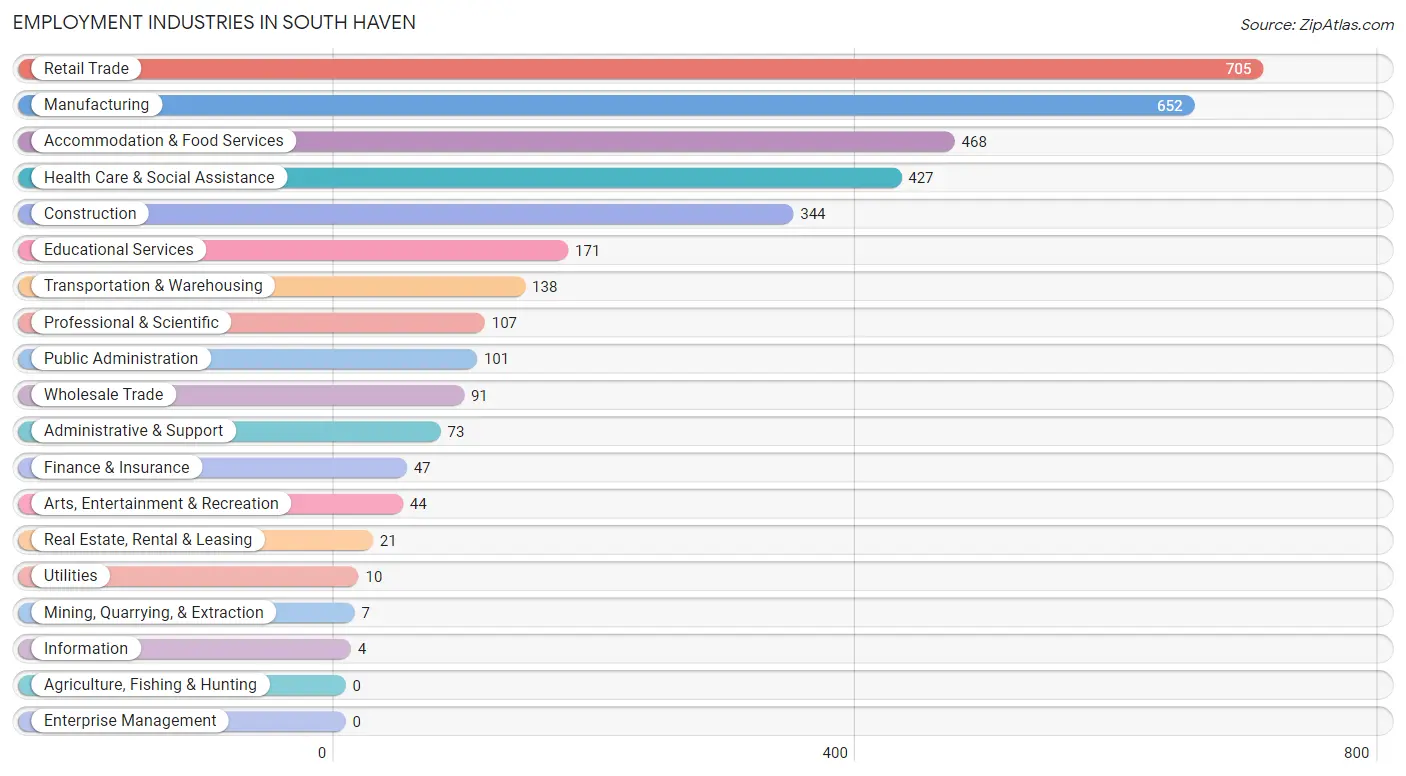
Employment Industries in South Haven
The major employment industries in South Haven include Retail Trade (705 | 19.8%), Manufacturing (652 | 18.3%), Accommodation & Food Services (468 | 13.1%), Health Care & Social Assistance (427 | 12.0%), and Construction (344 | 9.7%).
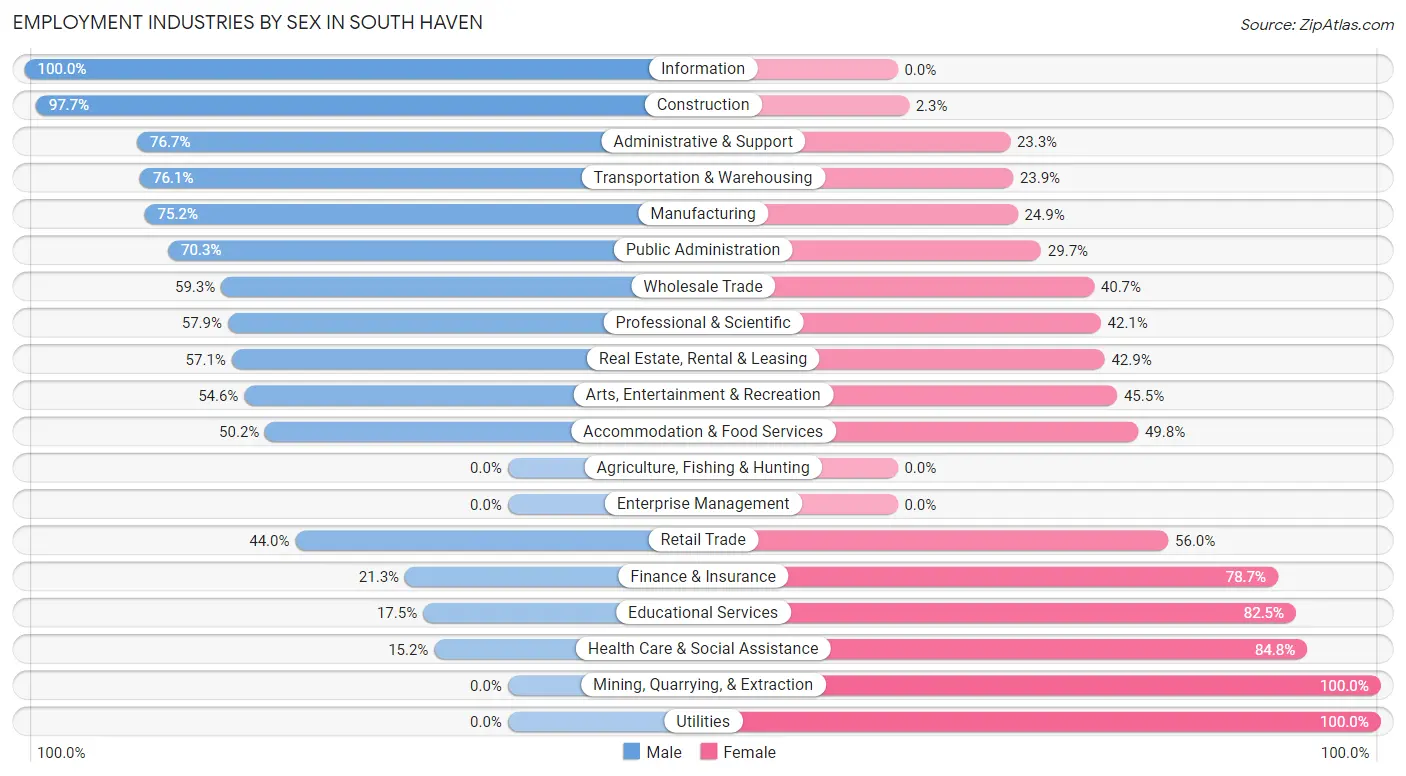
Employment Industries by Sex in South Haven
The South Haven industries that see more men than women are Information (100.0%), Construction (97.7%), and Administrative & Support (76.7%), whereas the industries that tend to have a higher number of women are Mining, Quarrying, & Extraction (100.0%), Utilities (100.0%), and Health Care & Social Assistance (84.8%).
| Industry | Male | Female |
| Agriculture, Fishing & Hunting | 0 (0.0%) | 0 (0.0%) |
| Mining, Quarrying, & Extraction | 0 (0.0%) | 7 (100.0%) |
| Construction | 336 (97.7%) | 8 (2.3%) |
| Manufacturing | 490 (75.1%) | 162 (24.8%) |
| Wholesale Trade | 54 (59.3%) | 37 (40.7%) |
| Retail Trade | 310 (44.0%) | 395 (56.0%) |
| Transportation & Warehousing | 105 (76.1%) | 33 (23.9%) |
| Utilities | 0 (0.0%) | 10 (100.0%) |
| Information | 4 (100.0%) | 0 (0.0%) |
| Finance & Insurance | 10 (21.3%) | 37 (78.7%) |
| Real Estate, Rental & Leasing | 12 (57.1%) | 9 (42.9%) |
| Professional & Scientific | 62 (57.9%) | 45 (42.1%) |
| Enterprise Management | 0 (0.0%) | 0 (0.0%) |
| Administrative & Support | 56 (76.7%) | 17 (23.3%) |
| Educational Services | 30 (17.5%) | 141 (82.5%) |
| Health Care & Social Assistance | 65 (15.2%) | 362 (84.8%) |
| Arts, Entertainment & Recreation | 24 (54.5%) | 20 (45.5%) |
| Accommodation & Food Services | 235 (50.2%) | 233 (49.8%) |
| Public Administration | 71 (70.3%) | 30 (29.7%) |
| Total | 1,920 (53.9%) | 1,641 (46.1%) |
Education in South Haven
School Enrollment in South Haven
The most common levels of schooling among the 1,663 students in South Haven are high school (534 | 32.1%), middle school (379 | 22.8%), and elementary school (302 | 18.2%).
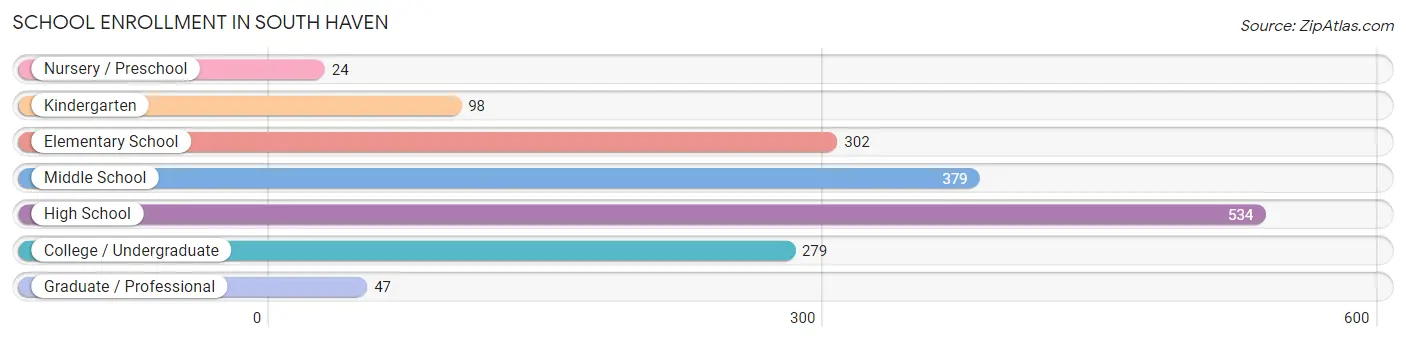
| School Level | # Students | % Students |
| Nursery / Preschool | 24 | 1.4% |
| Kindergarten | 98 | 5.9% |
| Elementary School | 302 | 18.2% |
| Middle School | 379 | 22.8% |
| High School | 534 | 32.1% |
| College / Undergraduate | 279 | 16.8% |
| Graduate / Professional | 47 | 2.8% |
| Total | 1,663 | 100.0% |
School Enrollment by Age by Funding Source in South Haven
Out of a total of 1,663 students who are enrolled in schools in South Haven, 213 (12.8%) attend a private institution, while the remaining 1,450 (87.2%) are enrolled in public schools. The age group of 35 years and over has the highest likelihood of being enrolled in private schools, with 33 (71.7% in the age bracket) enrolled. Conversely, the age group of 18 to 19 year olds has the lowest likelihood of being enrolled in a private school, with 91 (100.0% in the age bracket) attending a public institution.
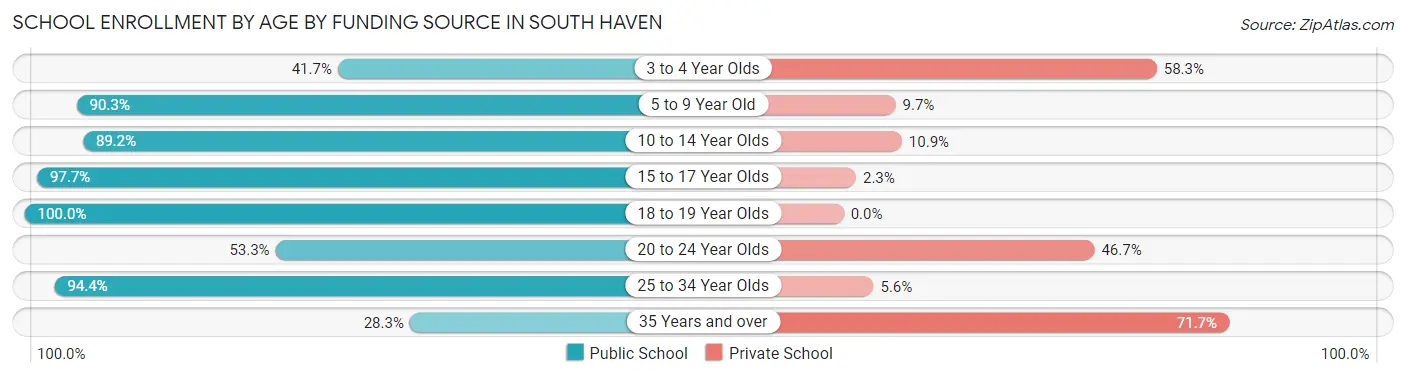
| Age Bracket | Public School | Private School |
| 3 to 4 Year Olds | 10 (41.7%) | 14 (58.3%) |
| 5 to 9 Year Old | 327 (90.3%) | 35 (9.7%) |
| 10 to 14 Year Olds | 485 (89.1%) | 59 (10.8%) |
| 15 to 17 Year Olds | 340 (97.7%) | 8 (2.3%) |
| 18 to 19 Year Olds | 91 (100.0%) | 0 (0.0%) |
| 20 to 24 Year Olds | 65 (53.3%) | 57 (46.7%) |
| 25 to 34 Year Olds | 119 (94.4%) | 7 (5.6%) |
| 35 Years and over | 13 (28.3%) | 33 (71.7%) |
| Total | 1,450 (87.2%) | 213 (12.8%) |
Educational Attainment by Field of Study in South Haven
Business (108 | 18.1%), science & technology (98 | 16.4%), liberal arts & history (81 | 13.6%), education (52 | 8.7%), and social sciences (44 | 7.4%) are the most common fields of study among 598 individuals in South Haven who have obtained a bachelor's degree or higher.
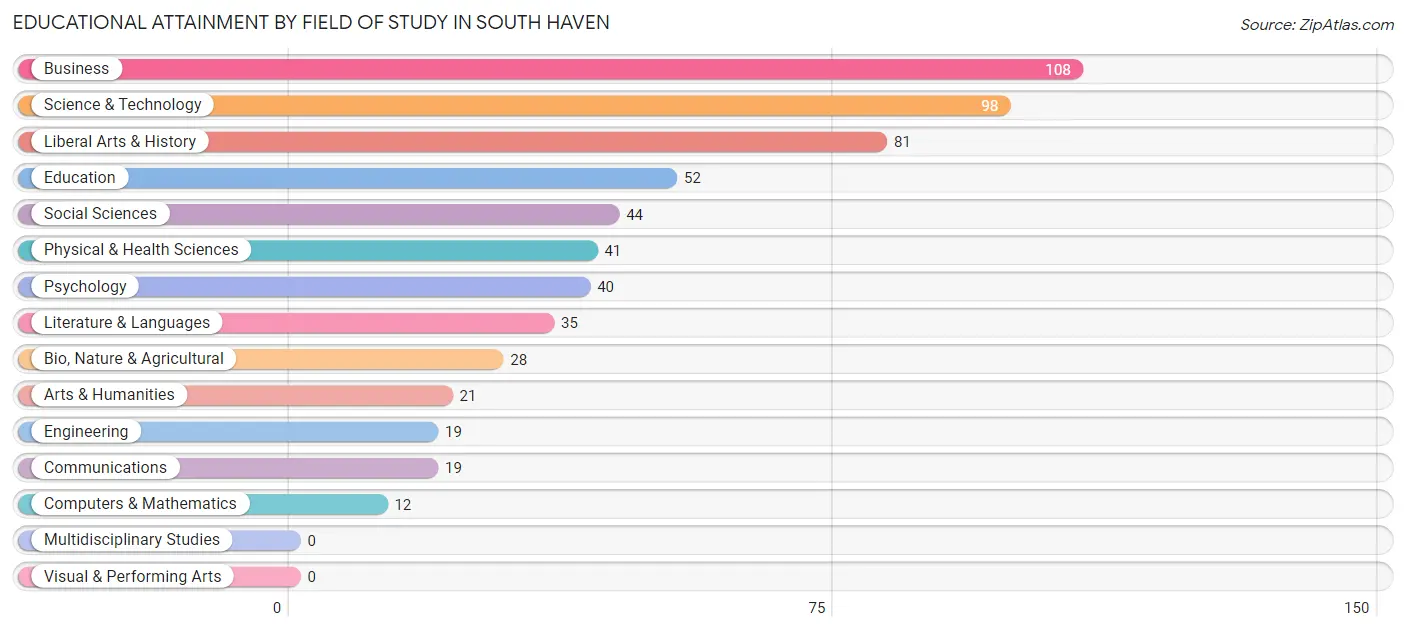
| Field of Study | # Graduates | % Graduates |
| Computers & Mathematics | 12 | 2.0% |
| Bio, Nature & Agricultural | 28 | 4.7% |
| Physical & Health Sciences | 41 | 6.9% |
| Psychology | 40 | 6.7% |
| Social Sciences | 44 | 7.4% |
| Engineering | 19 | 3.2% |
| Multidisciplinary Studies | 0 | 0.0% |
| Science & Technology | 98 | 16.4% |
| Business | 108 | 18.1% |
| Education | 52 | 8.7% |
| Literature & Languages | 35 | 5.9% |
| Liberal Arts & History | 81 | 13.6% |
| Visual & Performing Arts | 0 | 0.0% |
| Communications | 19 | 3.2% |
| Arts & Humanities | 21 | 3.5% |
| Total | 598 | 100.0% |
Transportation & Commute in South Haven
Vehicle Availability by Sex in South Haven
The most prevalent vehicle ownership categories in South Haven are males with 2 vehicles (855, accounting for 46.0%) and females with 2 vehicles (804, making up 53.7%).
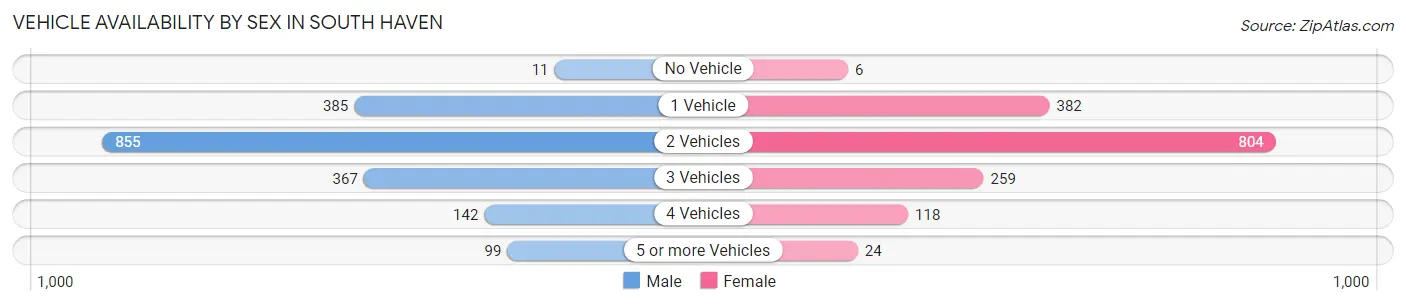
| Vehicles Available | Male | Female |
| No Vehicle | 11 (0.6%) | 6 (0.4%) |
| 1 Vehicle | 385 (20.7%) | 382 (24.0%) |
| 2 Vehicles | 855 (46.0%) | 804 (50.5%) |
| 3 Vehicles | 367 (19.7%) | 259 (16.3%) |
| 4 Vehicles | 142 (7.6%) | 118 (7.4%) |
| 5 or more Vehicles | 99 (5.3%) | 24 (1.5%) |
| Total | 1,859 (100.0%) | 1,593 (100.0%) |
Commute Time in South Haven
The most frequently occuring commute durations in South Haven are 30 to 34 minutes (875 commuters, 26.1%), 15 to 19 minutes (552 commuters, 16.5%), and 20 to 24 minutes (537 commuters, 16.0%).
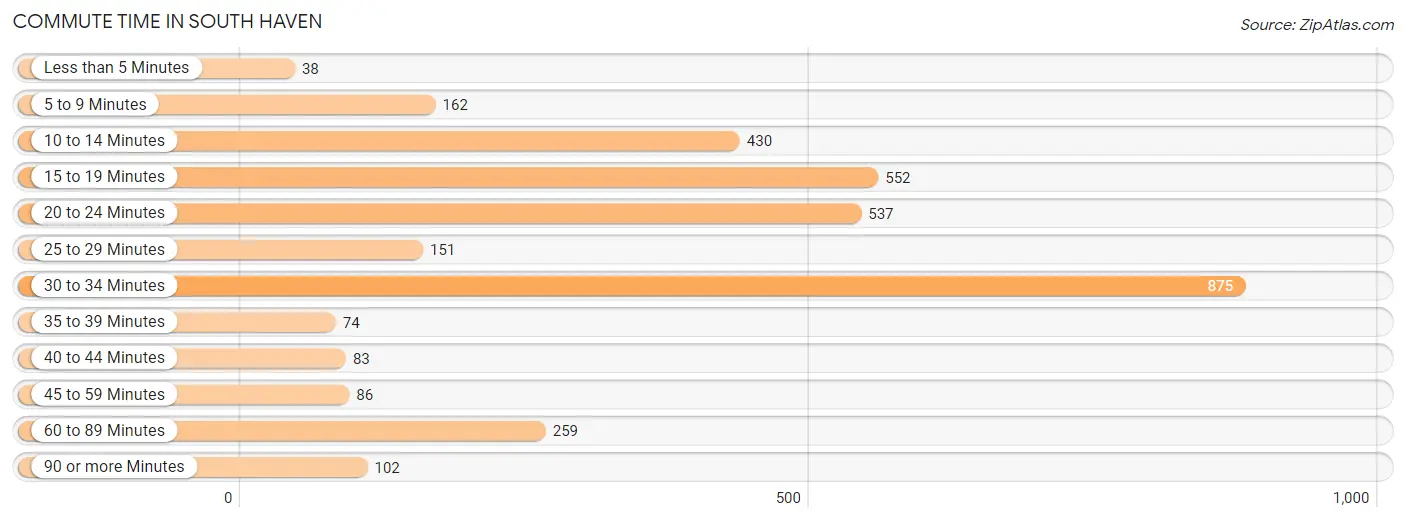
| Commute Time | # Commuters | % Commuters |
| Less than 5 Minutes | 38 | 1.1% |
| 5 to 9 Minutes | 162 | 4.8% |
| 10 to 14 Minutes | 430 | 12.8% |
| 15 to 19 Minutes | 552 | 16.5% |
| 20 to 24 Minutes | 537 | 16.0% |
| 25 to 29 Minutes | 151 | 4.5% |
| 30 to 34 Minutes | 875 | 26.1% |
| 35 to 39 Minutes | 74 | 2.2% |
| 40 to 44 Minutes | 83 | 2.5% |
| 45 to 59 Minutes | 86 | 2.6% |
| 60 to 89 Minutes | 259 | 7.7% |
| 90 or more Minutes | 102 | 3.0% |
Commute Time by Sex in South Haven
The most common commute times in South Haven are 20 to 24 minutes (360 commuters, 19.8%) for males and 30 to 34 minutes (570 commuters, 37.2%) for females.
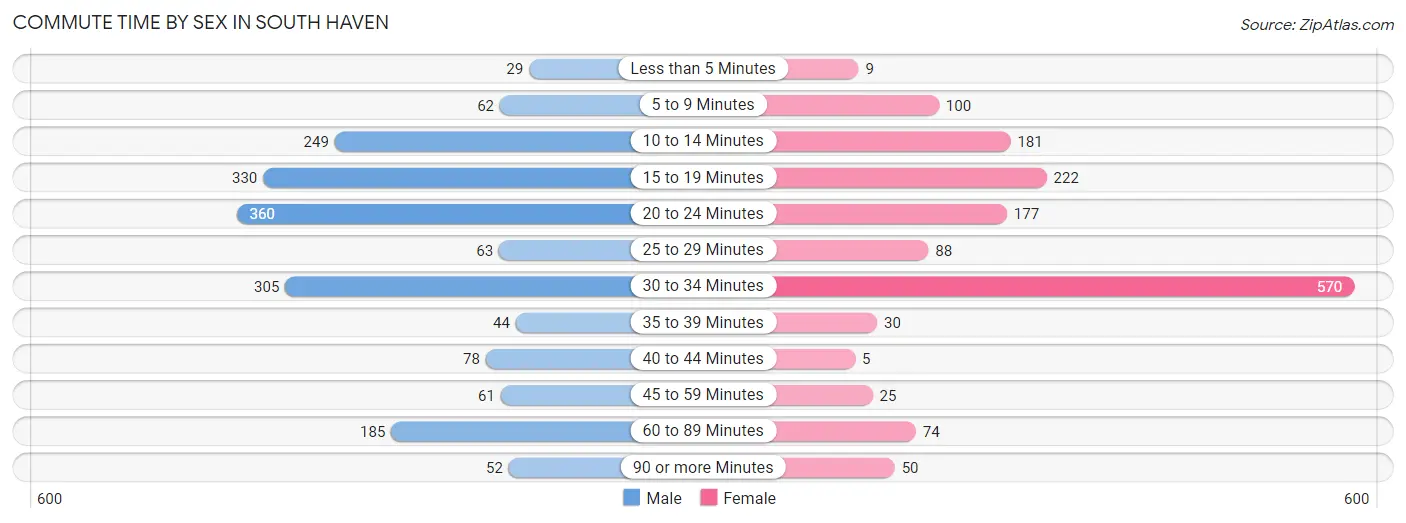
| Commute Time | Male | Female |
| Less than 5 Minutes | 29 (1.6%) | 9 (0.6%) |
| 5 to 9 Minutes | 62 (3.4%) | 100 (6.5%) |
| 10 to 14 Minutes | 249 (13.7%) | 181 (11.8%) |
| 15 to 19 Minutes | 330 (18.1%) | 222 (14.5%) |
| 20 to 24 Minutes | 360 (19.8%) | 177 (11.6%) |
| 25 to 29 Minutes | 63 (3.5%) | 88 (5.8%) |
| 30 to 34 Minutes | 305 (16.8%) | 570 (37.2%) |
| 35 to 39 Minutes | 44 (2.4%) | 30 (2.0%) |
| 40 to 44 Minutes | 78 (4.3%) | 5 (0.3%) |
| 45 to 59 Minutes | 61 (3.4%) | 25 (1.6%) |
| 60 to 89 Minutes | 185 (10.2%) | 74 (4.8%) |
| 90 or more Minutes | 52 (2.9%) | 50 (3.3%) |
Time of Departure to Work by Sex in South Haven
The most frequent times of departure to work in South Haven are 12:00 PM to 3:59 PM (238, 13.1%) for males and 8:00 AM to 8:29 AM (236, 15.4%) for females.
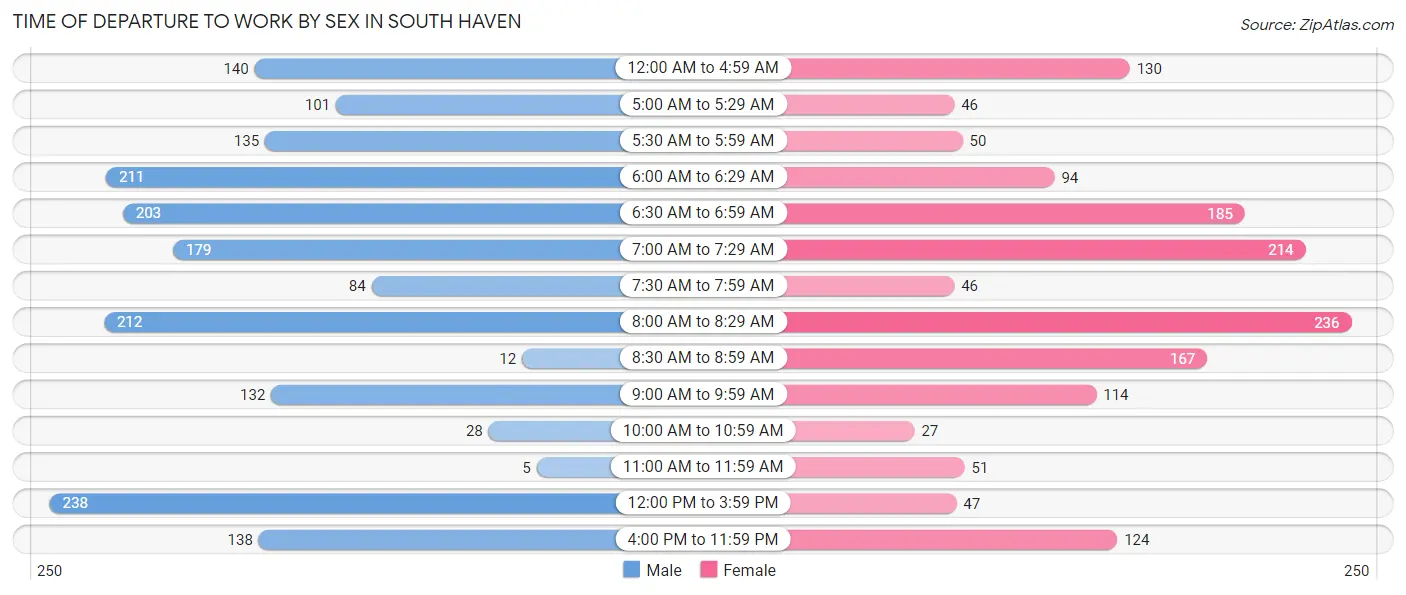
| Time of Departure | Male | Female |
| 12:00 AM to 4:59 AM | 140 (7.7%) | 130 (8.5%) |
| 5:00 AM to 5:29 AM | 101 (5.6%) | 46 (3.0%) |
| 5:30 AM to 5:59 AM | 135 (7.4%) | 50 (3.3%) |
| 6:00 AM to 6:29 AM | 211 (11.6%) | 94 (6.1%) |
| 6:30 AM to 6:59 AM | 203 (11.2%) | 185 (12.1%) |
| 7:00 AM to 7:29 AM | 179 (9.9%) | 214 (14.0%) |
| 7:30 AM to 7:59 AM | 84 (4.6%) | 46 (3.0%) |
| 8:00 AM to 8:29 AM | 212 (11.7%) | 236 (15.4%) |
| 8:30 AM to 8:59 AM | 12 (0.7%) | 167 (10.9%) |
| 9:00 AM to 9:59 AM | 132 (7.3%) | 114 (7.4%) |
| 10:00 AM to 10:59 AM | 28 (1.5%) | 27 (1.8%) |
| 11:00 AM to 11:59 AM | 5 (0.3%) | 51 (3.3%) |
| 12:00 PM to 3:59 PM | 238 (13.1%) | 47 (3.1%) |
| 4:00 PM to 11:59 PM | 138 (7.6%) | 124 (8.1%) |
| Total | 1,818 (100.0%) | 1,531 (100.0%) |
Housing Occupancy in South Haven
Occupancy by Ownership in South Haven
Of the total 2,751 dwellings in South Haven, owner-occupied units account for 1,968 (71.5%), while renter-occupied units make up 783 (28.5%).
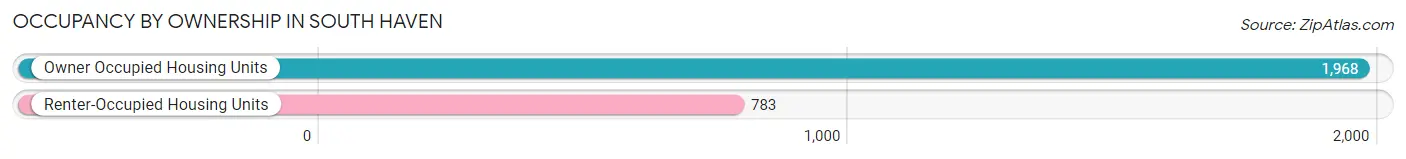
| Occupancy | # Housing Units | % Housing Units |
| Owner Occupied Housing Units | 1,968 | 71.5% |
| Renter-Occupied Housing Units | 783 | 28.5% |
| Total Occupied Housing Units | 2,751 | 100.0% |
Occupancy by Household Size in South Haven
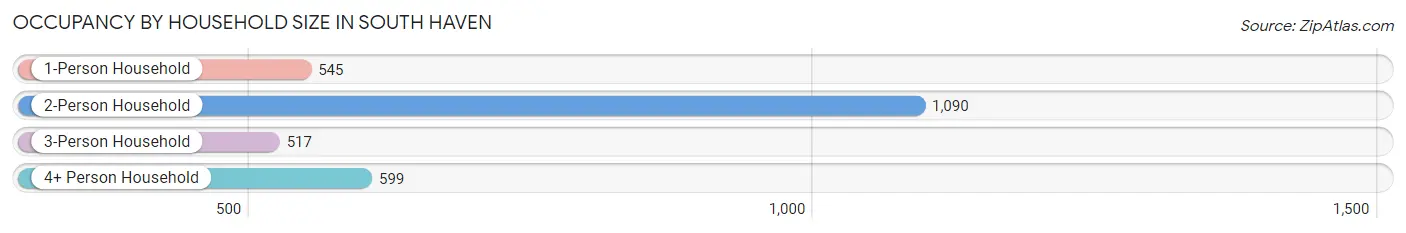
| Household Size | # Housing Units | % Housing Units |
| 1-Person Household | 545 | 19.8% |
| 2-Person Household | 1,090 | 39.6% |
| 3-Person Household | 517 | 18.8% |
| 4+ Person Household | 599 | 21.8% |
| Total Housing Units | 2,751 | 100.0% |
Occupancy by Ownership by Household Size in South Haven
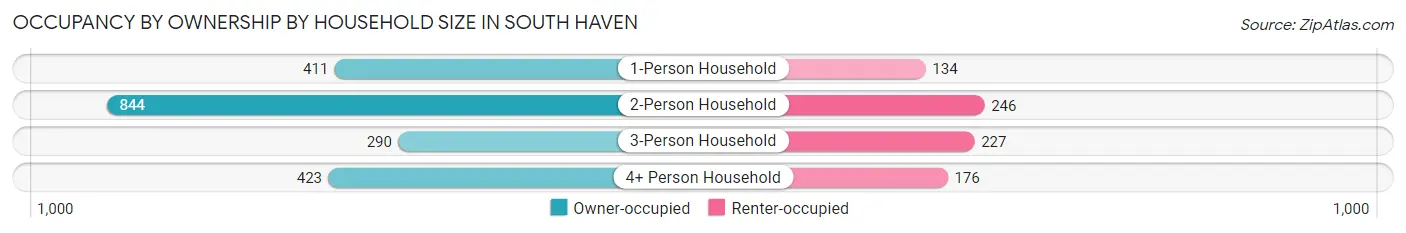
| Household Size | Owner-occupied | Renter-occupied |
| 1-Person Household | 411 (75.4%) | 134 (24.6%) |
| 2-Person Household | 844 (77.4%) | 246 (22.6%) |
| 3-Person Household | 290 (56.1%) | 227 (43.9%) |
| 4+ Person Household | 423 (70.6%) | 176 (29.4%) |
| Total Housing Units | 1,968 (71.5%) | 783 (28.5%) |
Occupancy by Educational Attainment in South Haven
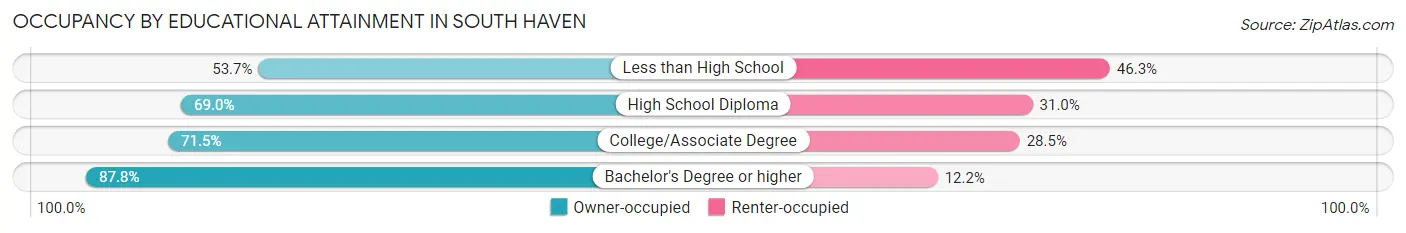
| Household Size | Owner-occupied | Renter-occupied |
| Less than High School | 66 (53.7%) | 57 (46.3%) |
| High School Diploma | 883 (69.0%) | 397 (31.0%) |
| College/Associate Degree | 724 (71.5%) | 288 (28.5%) |
| Bachelor's Degree or higher | 295 (87.8%) | 41 (12.2%) |
Occupancy by Age of Householder in South Haven
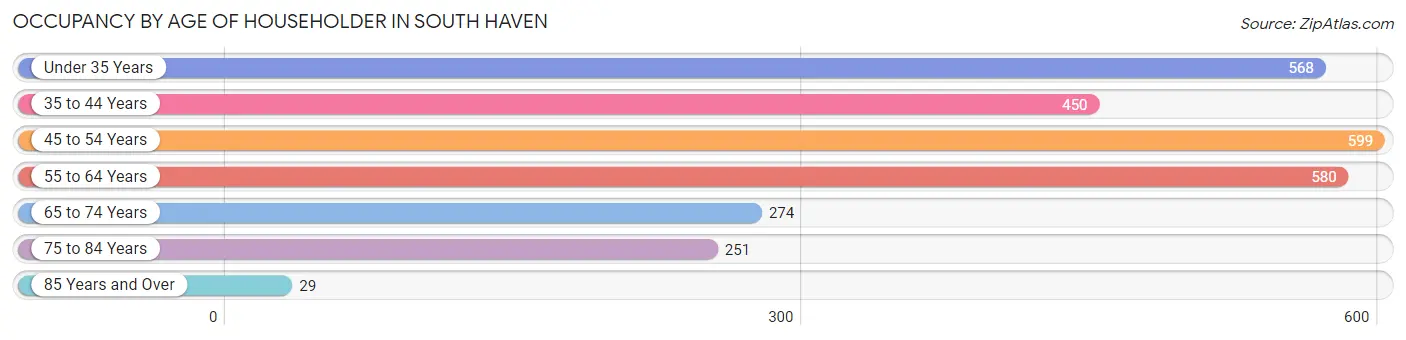
| Age Bracket | # Households | % Households |
| Under 35 Years | 568 | 20.6% |
| 35 to 44 Years | 450 | 16.4% |
| 45 to 54 Years | 599 | 21.8% |
| 55 to 64 Years | 580 | 21.1% |
| 65 to 74 Years | 274 | 10.0% |
| 75 to 84 Years | 251 | 9.1% |
| 85 Years and Over | 29 | 1.1% |
| Total | 2,751 | 100.0% |
Housing Finances in South Haven
Median Income by Occupancy in South Haven
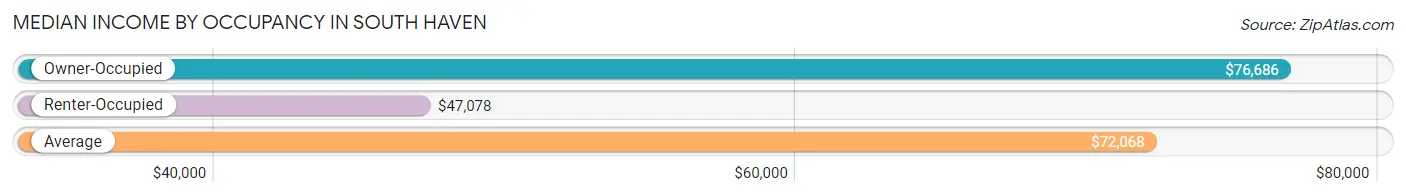
| Occupancy Type | # Households | Median Income |
| Owner-Occupied | 1,968 (71.5%) | $76,686 |
| Renter-Occupied | 783 (28.5%) | $47,078 |
| Average | 2,751 (100.0%) | $72,068 |
Occupancy by Householder Income Bracket in South Haven
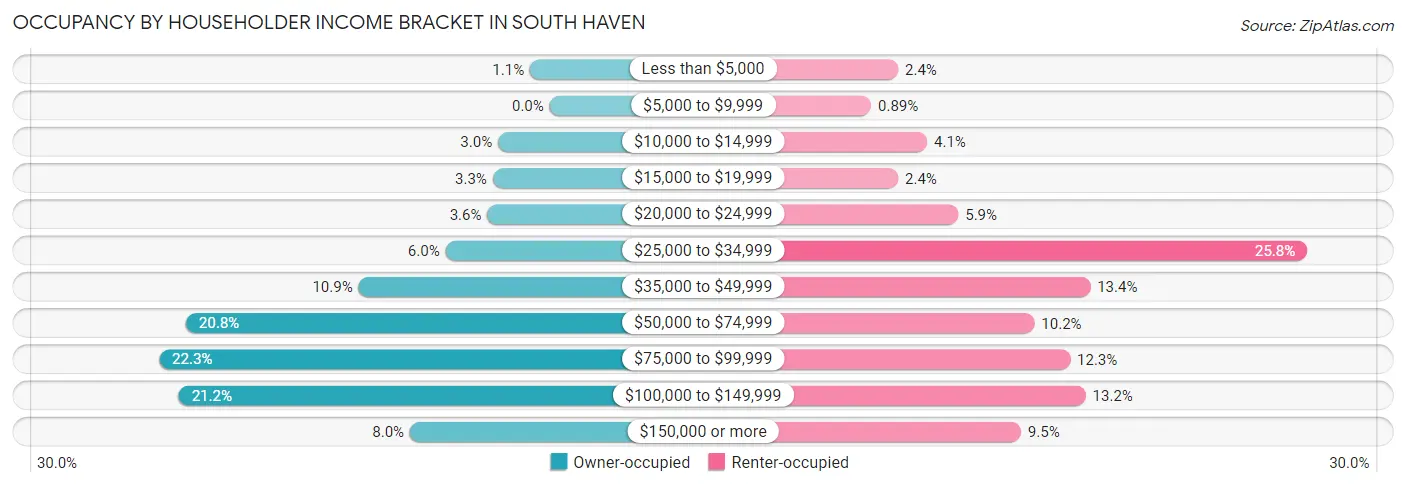
| Income Bracket | Owner-occupied | Renter-occupied |
| Less than $5,000 | 22 (1.1%) | 19 (2.4%) |
| $5,000 to $9,999 | 0 (0.0%) | 7 (0.9%) |
| $10,000 to $14,999 | 58 (2.9%) | 32 (4.1%) |
| $15,000 to $19,999 | 64 (3.3%) | 19 (2.4%) |
| $20,000 to $24,999 | 70 (3.6%) | 46 (5.9%) |
| $25,000 to $34,999 | 117 (5.9%) | 202 (25.8%) |
| $35,000 to $49,999 | 215 (10.9%) | 105 (13.4%) |
| $50,000 to $74,999 | 409 (20.8%) | 80 (10.2%) |
| $75,000 to $99,999 | 439 (22.3%) | 96 (12.3%) |
| $100,000 to $149,999 | 417 (21.2%) | 103 (13.2%) |
| $150,000 or more | 157 (8.0%) | 74 (9.5%) |
| Total | 1,968 (100.0%) | 783 (100.0%) |
Monthly Housing Cost Tiers in South Haven
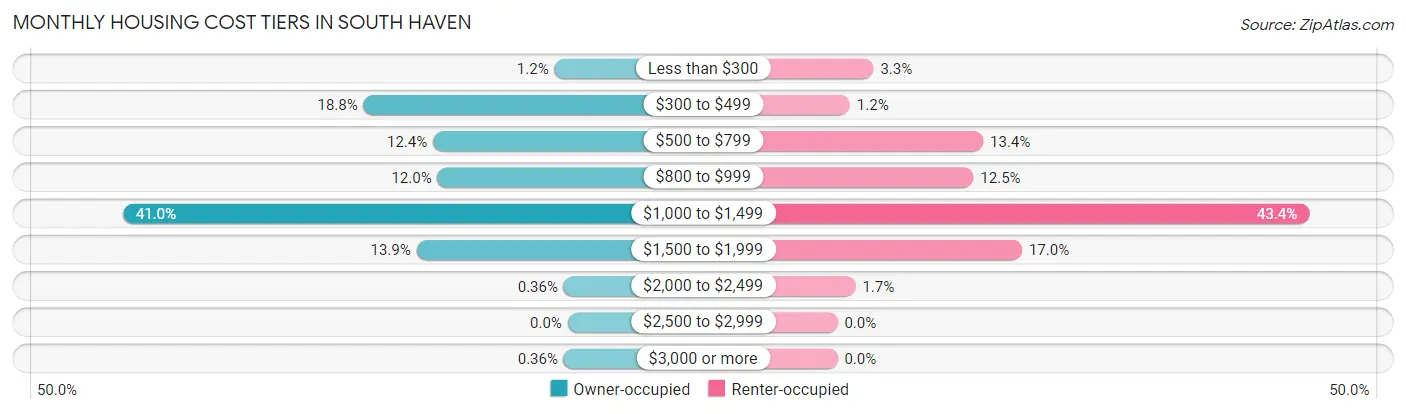
| Monthly Cost | Owner-occupied | Renter-occupied |
| Less than $300 | 24 (1.2%) | 26 (3.3%) |
| $300 to $499 | 370 (18.8%) | 9 (1.1%) |
| $500 to $799 | 244 (12.4%) | 105 (13.4%) |
| $800 to $999 | 236 (12.0%) | 98 (12.5%) |
| $1,000 to $1,499 | 806 (41.0%) | 340 (43.4%) |
| $1,500 to $1,999 | 274 (13.9%) | 133 (17.0%) |
| $2,000 to $2,499 | 7 (0.4%) | 13 (1.7%) |
| $2,500 to $2,999 | 0 (0.0%) | 0 (0.0%) |
| $3,000 or more | 7 (0.4%) | 0 (0.0%) |
| Total | 1,968 (100.0%) | 783 (100.0%) |
Physical Housing Characteristics in South Haven
Housing Structures in South Haven
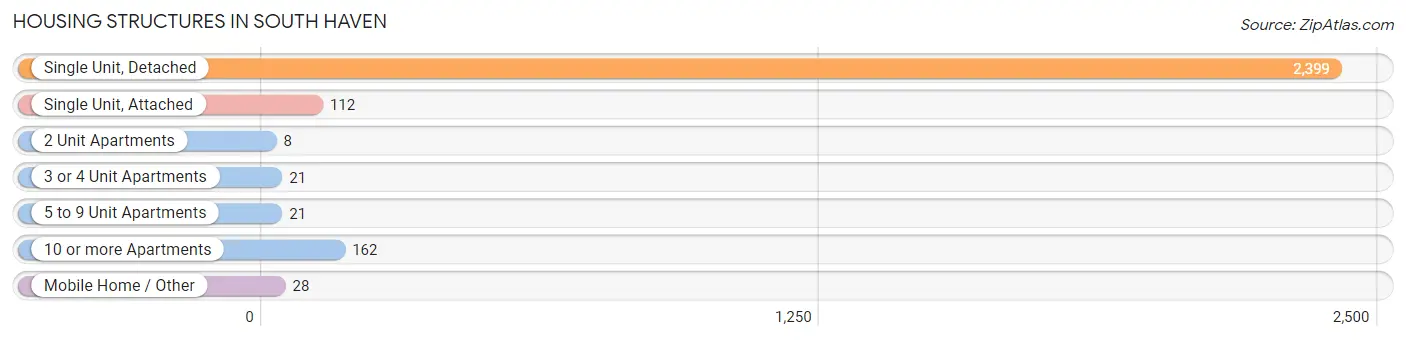
| Structure Type | # Housing Units | % Housing Units |
| Single Unit, Detached | 2,399 | 87.2% |
| Single Unit, Attached | 112 | 4.1% |
| 2 Unit Apartments | 8 | 0.3% |
| 3 or 4 Unit Apartments | 21 | 0.8% |
| 5 to 9 Unit Apartments | 21 | 0.8% |
| 10 or more Apartments | 162 | 5.9% |
| Mobile Home / Other | 28 | 1.0% |
| Total | 2,751 | 100.0% |
Housing Structures by Occupancy in South Haven
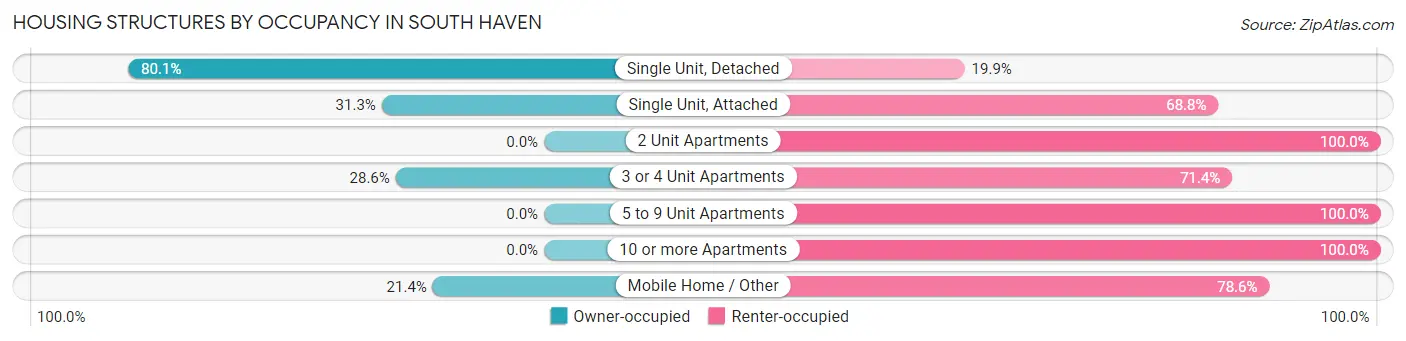
| Structure Type | Owner-occupied | Renter-occupied |
| Single Unit, Detached | 1,921 (80.1%) | 478 (19.9%) |
| Single Unit, Attached | 35 (31.2%) | 77 (68.8%) |
| 2 Unit Apartments | 0 (0.0%) | 8 (100.0%) |
| 3 or 4 Unit Apartments | 6 (28.6%) | 15 (71.4%) |
| 5 to 9 Unit Apartments | 0 (0.0%) | 21 (100.0%) |
| 10 or more Apartments | 0 (0.0%) | 162 (100.0%) |
| Mobile Home / Other | 6 (21.4%) | 22 (78.6%) |
| Total | 1,968 (71.5%) | 783 (28.5%) |
Housing Structures by Number of Rooms in South Haven
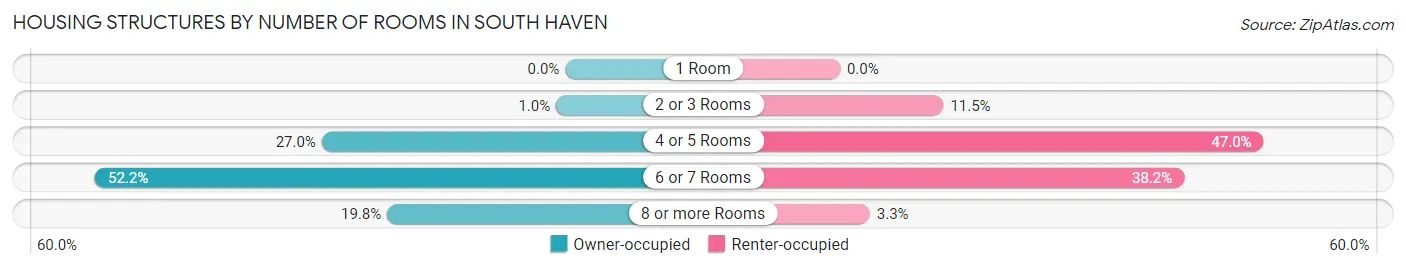
| Number of Rooms | Owner-occupied | Renter-occupied |
| 1 Room | 0 (0.0%) | 0 (0.0%) |
| 2 or 3 Rooms | 20 (1.0%) | 90 (11.5%) |
| 4 or 5 Rooms | 532 (27.0%) | 368 (47.0%) |
| 6 or 7 Rooms | 1,027 (52.2%) | 299 (38.2%) |
| 8 or more Rooms | 389 (19.8%) | 26 (3.3%) |
| Total | 1,968 (100.0%) | 783 (100.0%) |
Housing Structure by Heating Type in South Haven
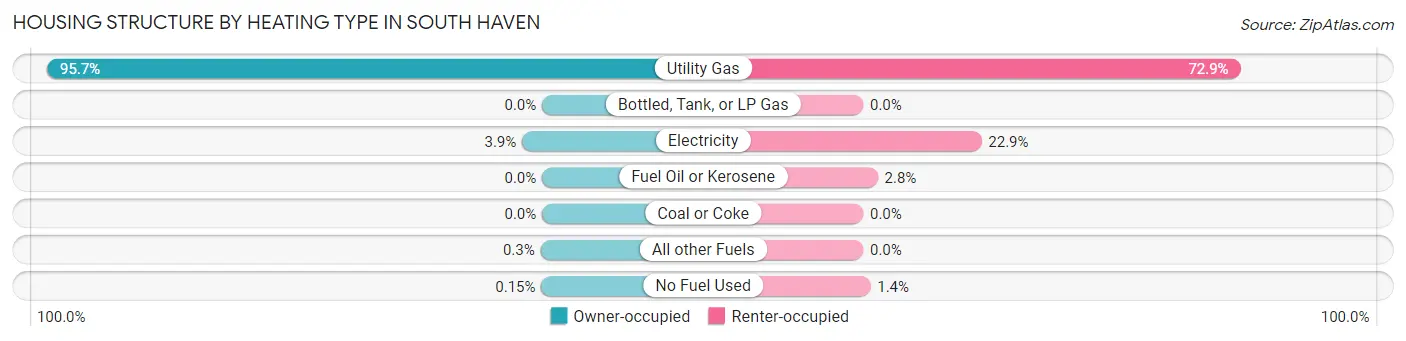
| Heating Type | Owner-occupied | Renter-occupied |
| Utility Gas | 1,883 (95.7%) | 571 (72.9%) |
| Bottled, Tank, or LP Gas | 0 (0.0%) | 0 (0.0%) |
| Electricity | 76 (3.9%) | 179 (22.9%) |
| Fuel Oil or Kerosene | 0 (0.0%) | 22 (2.8%) |
| Coal or Coke | 0 (0.0%) | 0 (0.0%) |
| All other Fuels | 6 (0.3%) | 0 (0.0%) |
| No Fuel Used | 3 (0.2%) | 11 (1.4%) |
| Total | 1,968 (100.0%) | 783 (100.0%) |
Household Vehicle Usage in South Haven
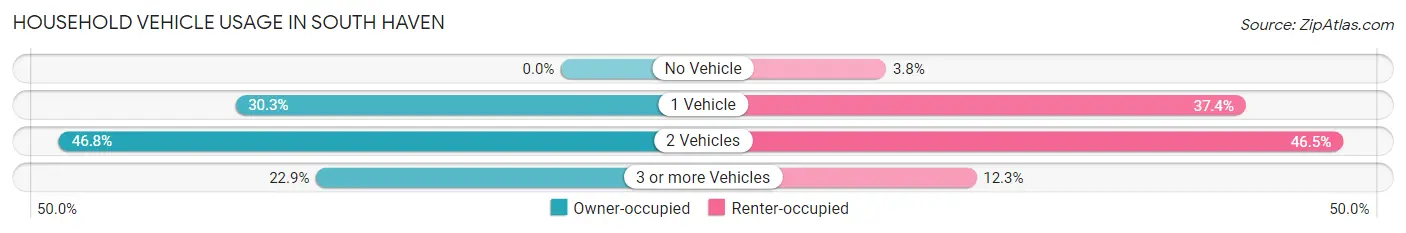
| Vehicles per Household | Owner-occupied | Renter-occupied |
| No Vehicle | 0 (0.0%) | 30 (3.8%) |
| 1 Vehicle | 597 (30.3%) | 293 (37.4%) |
| 2 Vehicles | 921 (46.8%) | 364 (46.5%) |
| 3 or more Vehicles | 450 (22.9%) | 96 (12.3%) |
| Total | 1,968 (100.0%) | 783 (100.0%) |
Real Estate & Mortgages in South Haven
Real Estate and Mortgage Overview in South Haven
| Characteristic | Without Mortgage | With Mortgage |
| Housing Units | 594 | 1,374 |
| Median Property Value | $142,200 | $159,600 |
| Median Household Income | $63,625 | $123 |
| Monthly Housing Costs | $460 | $0 |
| Real Estate Taxes | $927 | $30 |
Property Value by Mortgage Status in South Haven
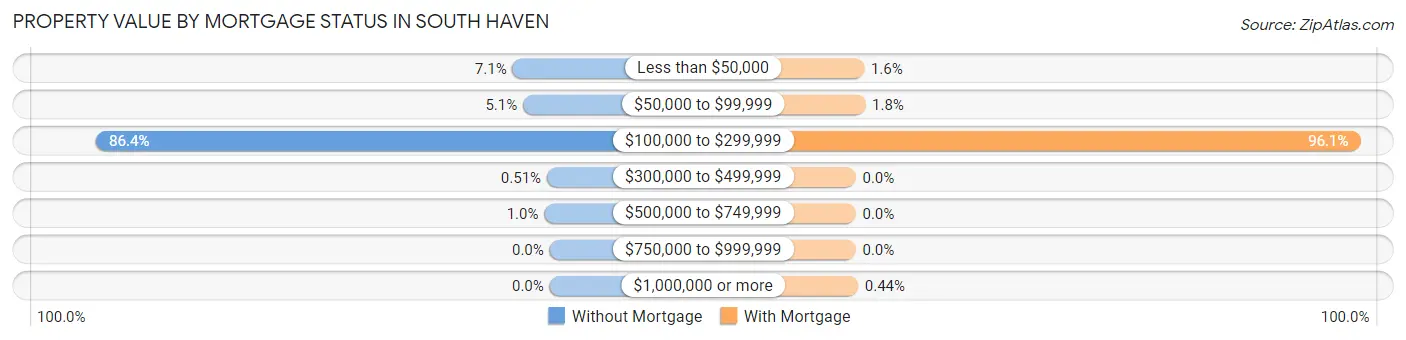
| Property Value | Without Mortgage | With Mortgage |
| Less than $50,000 | 42 (7.1%) | 22 (1.6%) |
| $50,000 to $99,999 | 30 (5.1%) | 25 (1.8%) |
| $100,000 to $299,999 | 513 (86.4%) | 1,321 (96.1%) |
| $300,000 to $499,999 | 3 (0.5%) | 0 (0.0%) |
| $500,000 to $749,999 | 6 (1.0%) | 0 (0.0%) |
| $750,000 to $999,999 | 0 (0.0%) | 0 (0.0%) |
| $1,000,000 or more | 0 (0.0%) | 6 (0.4%) |
| Total | 594 (100.0%) | 1,374 (100.0%) |
Household Income by Mortgage Status in South Haven
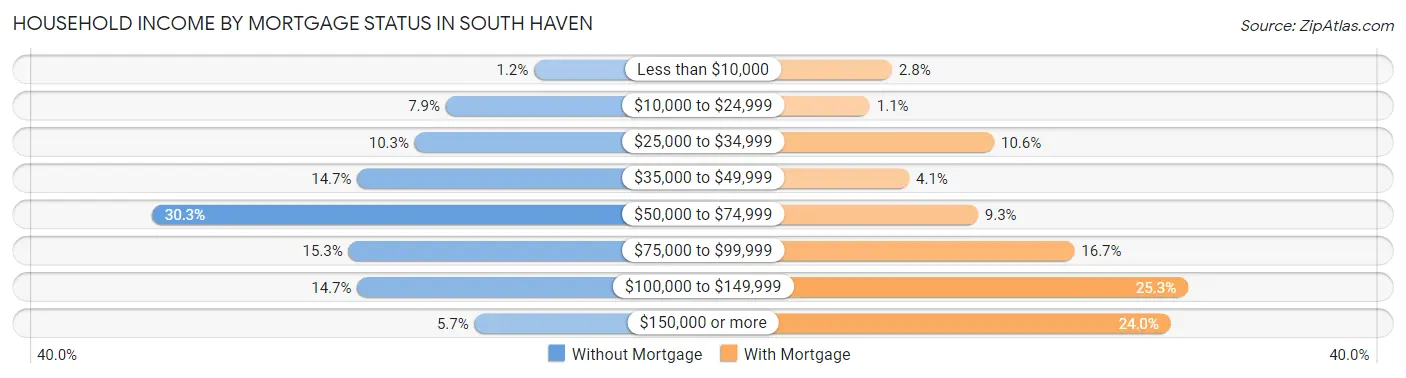
| Household Income | Without Mortgage | With Mortgage |
| Less than $10,000 | 7 (1.2%) | 38 (2.8%) |
| $10,000 to $24,999 | 47 (7.9%) | 15 (1.1%) |
| $25,000 to $34,999 | 61 (10.3%) | 145 (10.5%) |
| $35,000 to $49,999 | 87 (14.6%) | 56 (4.1%) |
| $50,000 to $74,999 | 180 (30.3%) | 128 (9.3%) |
| $75,000 to $99,999 | 91 (15.3%) | 229 (16.7%) |
| $100,000 to $149,999 | 87 (14.6%) | 348 (25.3%) |
| $150,000 or more | 34 (5.7%) | 330 (24.0%) |
| Total | 594 (100.0%) | 1,374 (100.0%) |
Property Value to Household Income Ratio in South Haven
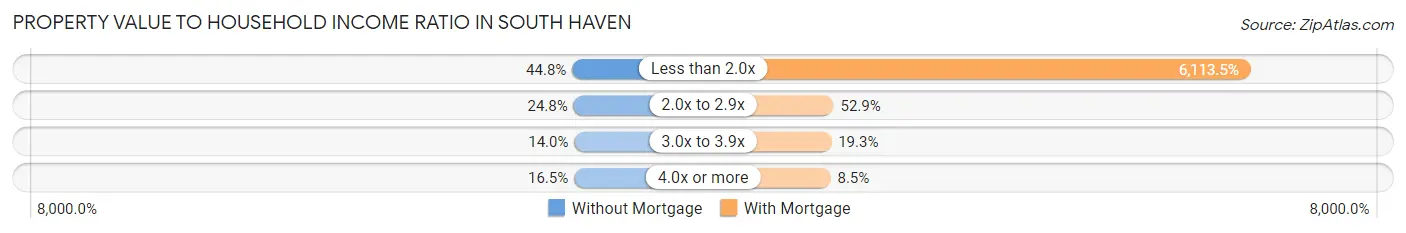
| Value-to-Income Ratio | Without Mortgage | With Mortgage |
| Less than 2.0x | 266 (44.8%) | 84,000 (6,113.5%) |
| 2.0x to 2.9x | 147 (24.7%) | 727 (52.9%) |
| 3.0x to 3.9x | 83 (14.0%) | 265 (19.3%) |
| 4.0x or more | 98 (16.5%) | 117 (8.5%) |
| Total | 594 (100.0%) | 1,374 (100.0%) |
Real Estate Taxes by Mortgage Status in South Haven
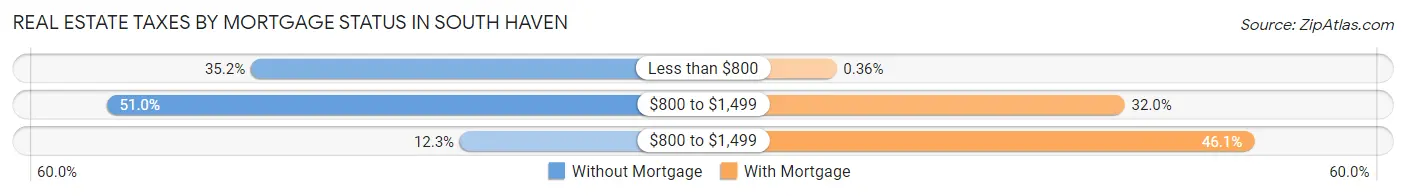
| Property Taxes | Without Mortgage | With Mortgage |
| Less than $800 | 209 (35.2%) | 5 (0.4%) |
| $800 to $1,499 | 303 (51.0%) | 439 (32.0%) |
| $800 to $1,499 | 73 (12.3%) | 634 (46.1%) |
| Total | 594 (100.0%) | 1,374 (100.0%) |
Health & Disability in South Haven
Health Insurance Coverage by Age in South Haven
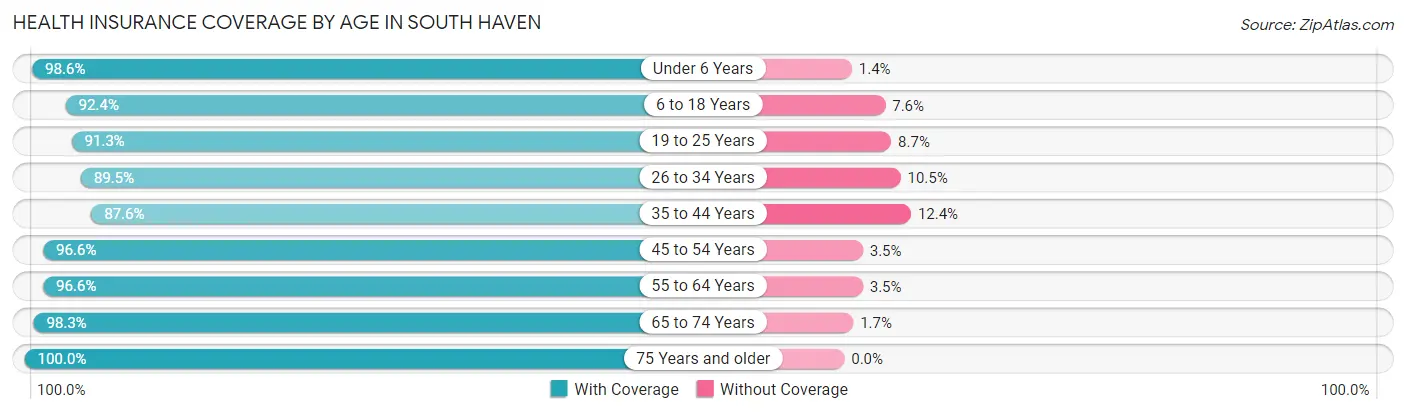
| Age Bracket | With Coverage | Without Coverage |
| Under 6 Years | 350 (98.6%) | 5 (1.4%) |
| 6 to 18 Years | 1,233 (92.4%) | 102 (7.6%) |
| 19 to 25 Years | 637 (91.3%) | 61 (8.7%) |
| 26 to 34 Years | 870 (89.5%) | 102 (10.5%) |
| 35 to 44 Years | 782 (87.6%) | 111 (12.4%) |
| 45 to 54 Years | 980 (96.6%) | 35 (3.5%) |
| 55 to 64 Years | 980 (96.6%) | 35 (3.5%) |
| 65 to 74 Years | 473 (98.3%) | 8 (1.7%) |
| 75 Years and older | 473 (100.0%) | 0 (0.0%) |
| Total | 6,778 (93.7%) | 459 (6.3%) |
Health Insurance Coverage by Citizenship Status in South Haven
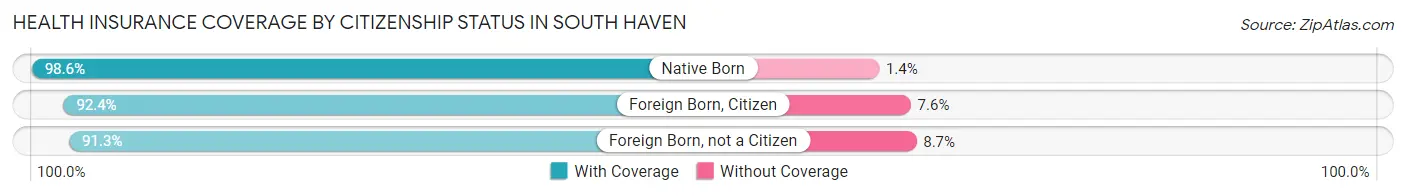
| Citizenship Status | With Coverage | Without Coverage |
| Native Born | 350 (98.6%) | 5 (1.4%) |
| Foreign Born, Citizen | 1,233 (92.4%) | 102 (7.6%) |
| Foreign Born, not a Citizen | 637 (91.3%) | 61 (8.7%) |
Health Insurance Coverage by Household Income in South Haven
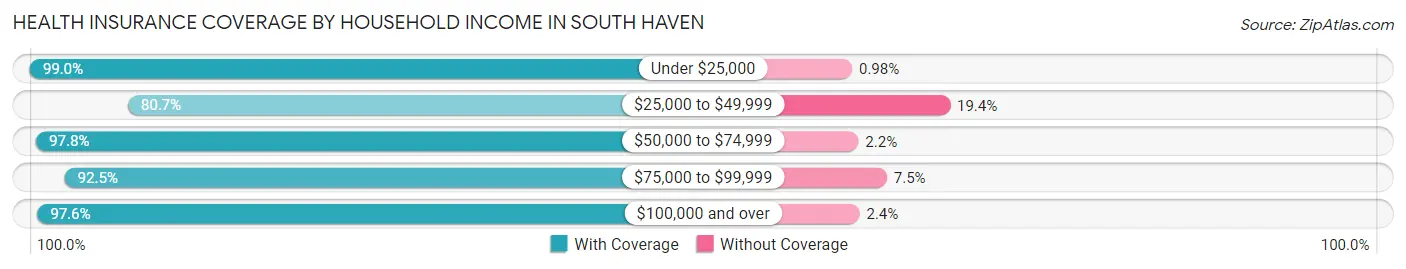
| Household Income | With Coverage | Without Coverage |
| Under $25,000 | 708 (99.0%) | 7 (1.0%) |
| $25,000 to $49,999 | 1,100 (80.6%) | 264 (19.4%) |
| $50,000 to $74,999 | 1,395 (97.8%) | 31 (2.2%) |
| $75,000 to $99,999 | 1,194 (92.5%) | 97 (7.5%) |
| $100,000 and over | 2,368 (97.6%) | 58 (2.4%) |
Public vs Private Health Insurance Coverage by Age in South Haven
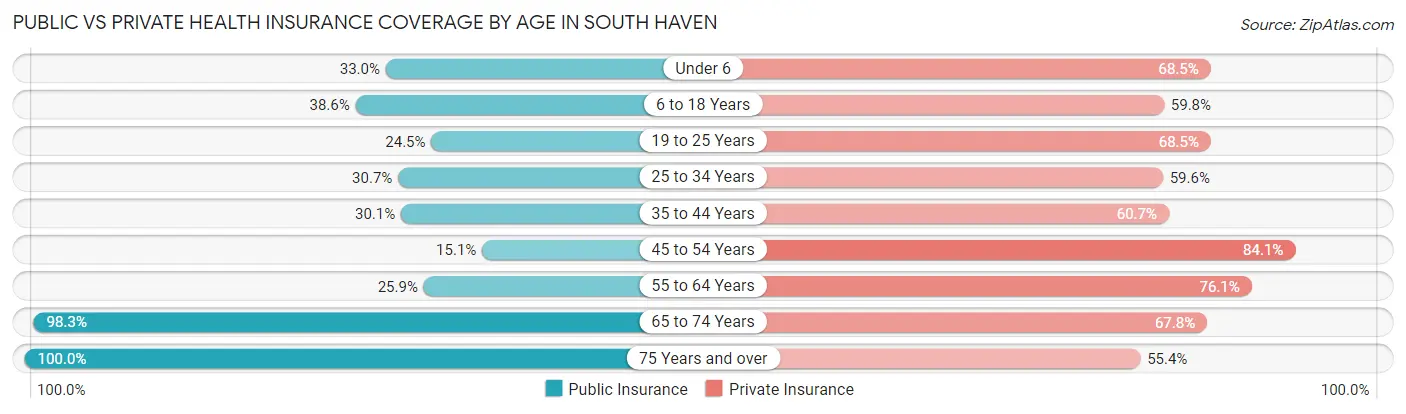
| Age Bracket | Public Insurance | Private Insurance |
| Under 6 | 117 (33.0%) | 243 (68.4%) |
| 6 to 18 Years | 515 (38.6%) | 798 (59.8%) |
| 19 to 25 Years | 171 (24.5%) | 478 (68.5%) |
| 25 to 34 Years | 298 (30.7%) | 579 (59.6%) |
| 35 to 44 Years | 269 (30.1%) | 542 (60.7%) |
| 45 to 54 Years | 153 (15.1%) | 854 (84.1%) |
| 55 to 64 Years | 263 (25.9%) | 772 (76.1%) |
| 65 to 74 Years | 473 (98.3%) | 326 (67.8%) |
| 75 Years and over | 473 (100.0%) | 262 (55.4%) |
| Total | 2,732 (37.8%) | 4,854 (67.1%) |
Disability Status by Sex by Age in South Haven
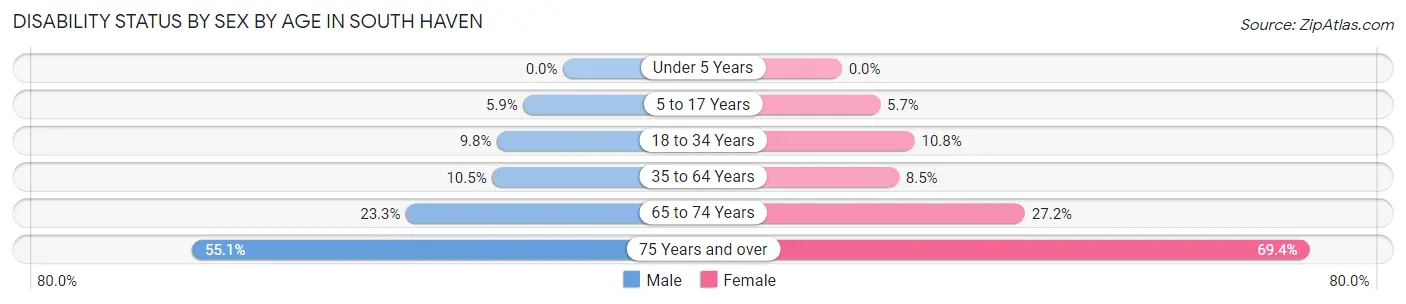
| Age Bracket | Male | Female |
| Under 5 Years | 0 (0.0%) | 0 (0.0%) |
| 5 to 17 Years | 42 (5.9%) | 37 (5.7%) |
| 18 to 34 Years | 93 (9.8%) | 84 (10.8%) |
| 35 to 64 Years | 151 (10.5%) | 126 (8.5%) |
| 65 to 74 Years | 59 (23.3%) | 62 (27.2%) |
| 75 Years and over | 102 (55.1%) | 200 (69.4%) |
Disability Class by Sex by Age in South Haven
Disability Class: Hearing Difficulty
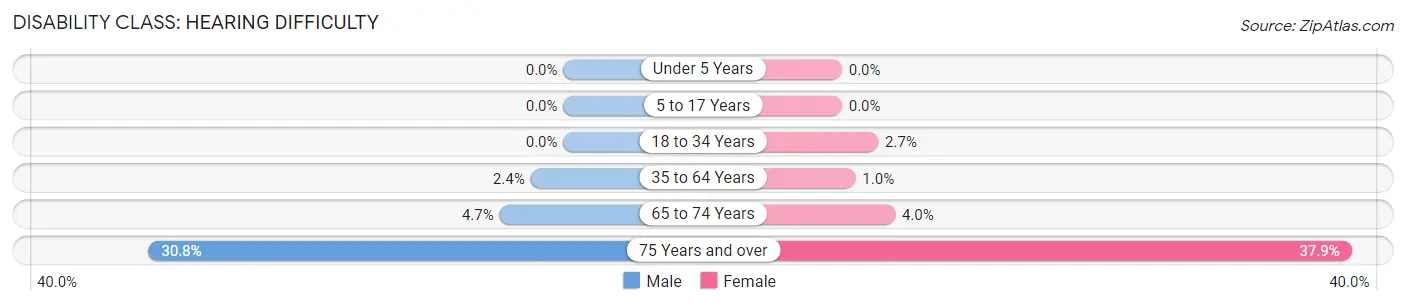
| Age Bracket | Male | Female |
| Under 5 Years | 0 (0.0%) | 0 (0.0%) |
| 5 to 17 Years | 0 (0.0%) | 0 (0.0%) |
| 18 to 34 Years | 0 (0.0%) | 21 (2.7%) |
| 35 to 64 Years | 35 (2.4%) | 15 (1.0%) |
| 65 to 74 Years | 12 (4.7%) | 9 (4.0%) |
| 75 Years and over | 57 (30.8%) | 109 (37.9%) |
Disability Class: Vision Difficulty
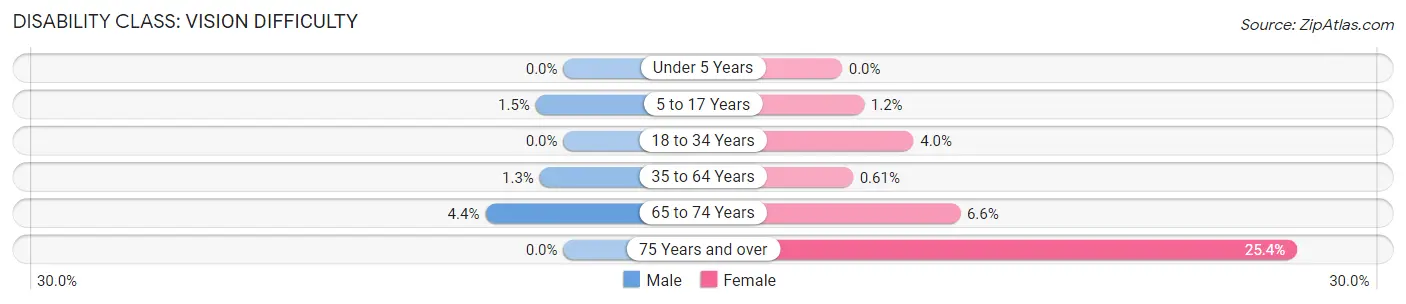
| Age Bracket | Male | Female |
| Under 5 Years | 0 (0.0%) | 0 (0.0%) |
| 5 to 17 Years | 11 (1.5%) | 8 (1.2%) |
| 18 to 34 Years | 0 (0.0%) | 31 (4.0%) |
| 35 to 64 Years | 19 (1.3%) | 9 (0.6%) |
| 65 to 74 Years | 11 (4.3%) | 15 (6.6%) |
| 75 Years and over | 0 (0.0%) | 73 (25.4%) |
Disability Class: Cognitive Difficulty
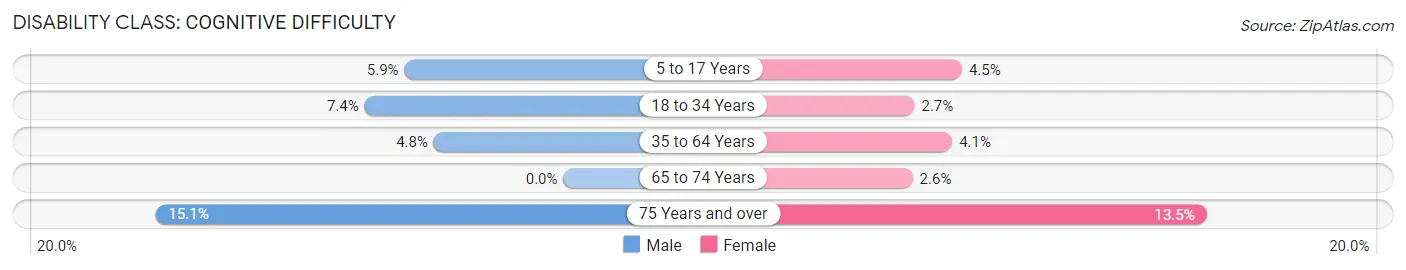
| Age Bracket | Male | Female |
| 5 to 17 Years | 42 (5.9%) | 29 (4.5%) |
| 18 to 34 Years | 70 (7.4%) | 21 (2.7%) |
| 35 to 64 Years | 69 (4.8%) | 61 (4.1%) |
| 65 to 74 Years | 0 (0.0%) | 6 (2.6%) |
| 75 Years and over | 28 (15.1%) | 39 (13.5%) |
Disability Class: Ambulatory Difficulty
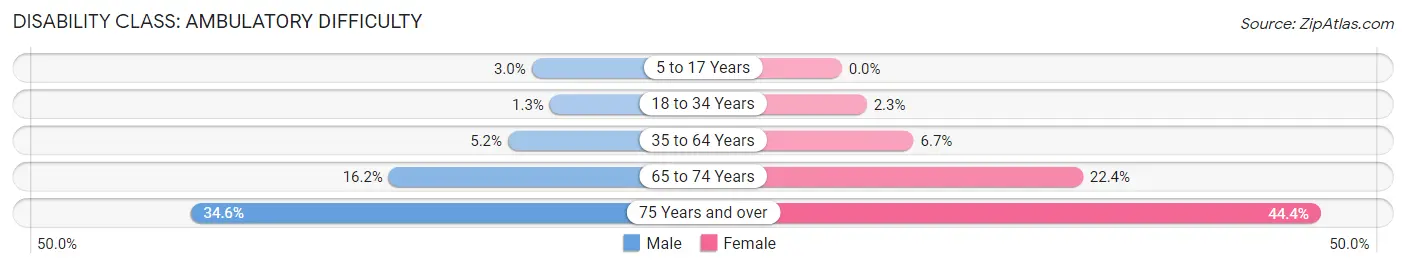
| Age Bracket | Male | Female |
| 5 to 17 Years | 21 (2.9%) | 0 (0.0%) |
| 18 to 34 Years | 12 (1.3%) | 18 (2.3%) |
| 35 to 64 Years | 74 (5.1%) | 99 (6.7%) |
| 65 to 74 Years | 41 (16.2%) | 51 (22.4%) |
| 75 Years and over | 64 (34.6%) | 128 (44.4%) |
Disability Class: Self-Care Difficulty
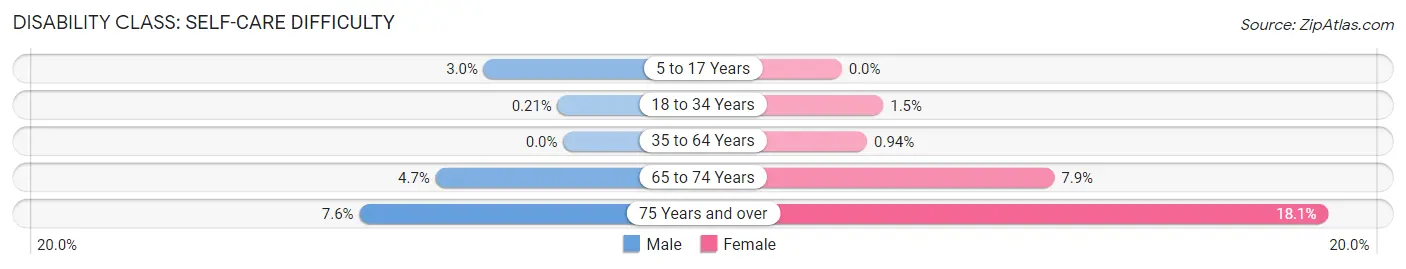
| Age Bracket | Male | Female |
| 5 to 17 Years | 21 (2.9%) | 0 (0.0%) |
| 18 to 34 Years | 2 (0.2%) | 12 (1.5%) |
| 35 to 64 Years | 0 (0.0%) | 14 (0.9%) |
| 65 to 74 Years | 12 (4.7%) | 18 (7.9%) |
| 75 Years and over | 14 (7.6%) | 52 (18.1%) |
Technology Access in South Haven
Computing Device Access in South Haven
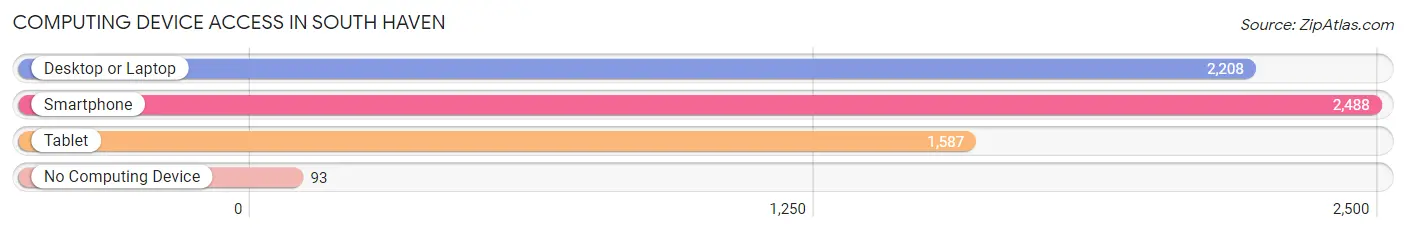
| Device Type | # Households | % Households |
| Desktop or Laptop | 2,208 | 80.3% |
| Smartphone | 2,488 | 90.4% |
| Tablet | 1,587 | 57.7% |
| No Computing Device | 93 | 3.4% |
| Total | 2,751 | 100.0% |
Internet Access in South Haven
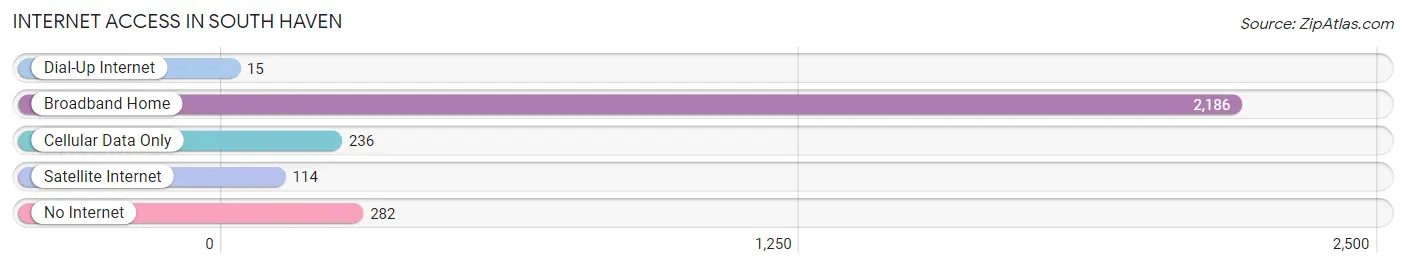
| Internet Type | # Households | % Households |
| Dial-Up Internet | 15 | 0.5% |
| Broadband Home | 2,186 | 79.5% |
| Cellular Data Only | 236 | 8.6% |
| Satellite Internet | 114 | 4.1% |
| No Internet | 282 | 10.2% |
| Total | 2,751 | 100.0% |
South Haven Summary
History
South Haven, Indiana is a small town located in Porter County, Indiana. It is situated on the southern shore of Lake Michigan, approximately 40 miles east of Chicago. The town was founded in 1835 by a group of settlers from New York and Ohio. The town was originally named “New Haven”, but was later changed to South Haven in 1837.
The town was initially a farming community, but soon developed into a resort town due to its proximity to Lake Michigan. The town was a popular destination for vacationers from Chicago and other nearby cities. In the late 19th century, the town was home to several large hotels, including the Grand Hotel, which was built in 1891.
In the early 20th century, South Haven experienced a period of rapid growth. The town was home to several factories, including a canning factory, a furniture factory, and a brickyard. The town also had a thriving commercial fishing industry.
Geography
South Haven is located in Porter County, Indiana, on the southern shore of Lake Michigan. The town is situated on the banks of the Little Calumet River, which flows into Lake Michigan. The town is approximately 40 miles east of Chicago and is bordered by the towns of Porter, Chesterton, and Burns Harbor.
The town has a total area of 4.2 square miles, of which 0.2 square miles is water. The town is located at an elevation of 645 feet above sea level. The climate in South Haven is classified as humid continental, with hot summers and cold winters.
Economy
South Haven’s economy is largely based on tourism and recreation. The town is home to several popular attractions, including the South Haven Lighthouse, the South Haven Pier, and the South Haven Beach. The town also has several restaurants, bars, and shops.
The town is also home to several manufacturing companies, including a furniture factory, a canning factory, and a brickyard. The town also has a thriving commercial fishing industry.
Demographics
As of the 2010 census, South Haven had a population of 2,845. The racial makeup of the town was 94.3% White, 1.2% African American, 0.3% Native American, 0.7% Asian, 0.1% Pacific Islander, 1.2% from other races, and 2.3% from two or more races. Hispanic or Latino of any race were 4.2% of the population.
The median household income in South Haven was $45,938, and the median family income was $51,938. The per capita income for the town was $21,938. About 8.3% of families and 10.2% of the population were below the poverty line, including 14.2% of those under age 18 and 5.2% of those age 65 or over.
Common Questions
What is the Total Population of South Haven?
Total Population of South Haven is 7,237.
What is the Total Male Population of South Haven?
Total Male Population of South Haven is 3,601.
What is the Total Female Population of South Haven?
Total Female Population of South Haven is 3,636.
What is the Ratio of Males per 100 Females in South Haven?
There are 99.04 Males per 100 Females in South Haven.
What is the Ratio of Females per 100 Males in South Haven?
There are 100.97 Females per 100 Males in South Haven.
What is the Median Population Age in South Haven?
Median Population Age in South Haven is 38.3 Years.
What is the Average Family Size in South Haven
Average Family Size in South Haven is 3.0 People.
What is the Average Household Size in South Haven
Average Household Size in South Haven is 2.6 People.
What is Per Capita Income in South Haven?
Per Capita income in South Haven is $33,293.
What is the Median Family Income in South Haven?
Median Family Income in South Haven is $78,426.
What is the Median Household income in South Haven?
Median Household Income in South Haven is $72,068.
What is Income or Wage Gap in South Haven?
Income or Wage Gap in South Haven is 28.2%.
Women in South Haven earn 71.8 cents for every dollar earned by a man.
What is Inequality or Gini Index in South Haven?
Inequality or Gini Index in South Haven is 0.42.
How Large is the Labor Force in South Haven?
There are 3,705 People in the Labor Forcein in South Haven.
What is the Percentage of People in the Labor Force in South Haven?
63.9% of People are in the Labor Force in South Haven.
What is the Unemployment Rate in South Haven?
Unemployment Rate in South Haven is 3.9%.