Cities with the Highest Percentage of Population with a Degree in Physical and Health Sciences in Indiana
RELATED REPORTS & OPTIONS
Physical and Health Sciences
Indiana
Compare Cities
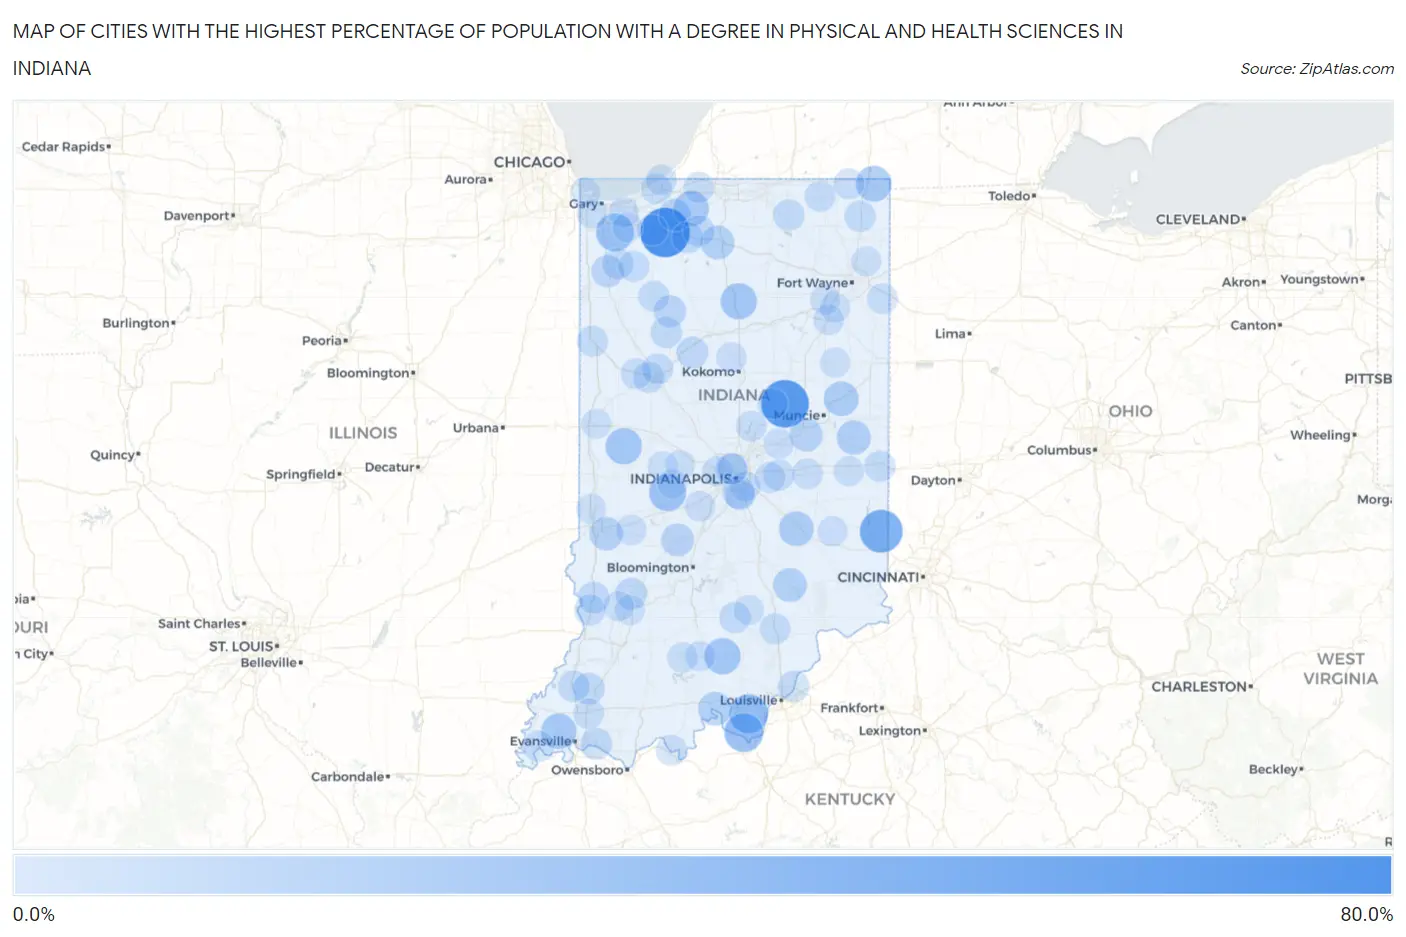
Map of Cities with the Highest Percentage of Population with a Degree in Physical and Health Sciences in Indiana
0.0%
80.0%
Cities with the Highest Percentage of Population with a Degree in Physical and Health Sciences in Indiana
| City | % Graduates | vs State | vs National | |
| 1. | Hanna | 68.3% | 3.1%(+65.2)#1 | 3.1%(+65.2)#38 |
| 2. | Orestes | 61.9% | 3.1%(+58.8)#2 | 3.1%(+58.8)#47 |
| 3. | Mariah Hill | 57.9% | 3.1%(+54.8)#3 | 3.1%(+54.8)#55 |
| 4. | Mount Carmel | 46.2% | 3.1%(+43.0)#4 | 3.1%(+43.1)#113 |
| 5. | New Middletown | 33.3% | 3.1%(+30.2)#5 | 3.1%(+30.2)#215 |
| 6. | Laconia | 33.3% | 3.1%(+30.2)#6 | 3.1%(+30.2)#216 |
| 7. | Belleville | 30.6% | 3.1%(+27.5)#7 | 3.1%(+27.5)#247 |
| 8. | Lakes Of The Four Seasons | 29.9% | 3.1%(+26.8)#8 | 3.1%(+26.8)#263 |
| 9. | Elizaville | 28.0% | 3.1%(+24.9)#9 | 3.1%(+24.9)#302 |
| 10. | Fillmore | 27.6% | 3.1%(+24.5)#10 | 3.1%(+24.5)#306 |
| 11. | Westwood | 25.2% | 3.1%(+22.1)#11 | 3.1%(+22.1)#359 |
| 12. | Macy | 25.0% | 3.1%(+21.9)#12 | 3.1%(+21.9)#376 |
| 13. | Wallace | 25.0% | 3.1%(+21.9)#13 | 3.1%(+21.9)#379 |
| 14. | Livonia | 25.0% | 3.1%(+21.9)#14 | 3.1%(+21.9)#388 |
| 15. | Fremont | 23.2% | 3.1%(+20.1)#15 | 3.1%(+20.1)#437 |
| 16. | Fish Lake | 22.2% | 3.1%(+19.1)#16 | 3.1%(+19.1)#457 |
| 17. | Parkers Settlement | 22.1% | 3.1%(+19.0)#17 | 3.1%(+19.0)#467 |
| 18. | Albany | 20.2% | 3.1%(+17.0)#18 | 3.1%(+17.1)#527 |
| 19. | St Paul | 20.0% | 3.1%(+16.9)#19 | 3.1%(+16.9)#535 |
| 20. | Modoc | 18.2% | 3.1%(+15.0)#20 | 3.1%(+15.1)#633 |
| 21. | Leavenworth | 17.2% | 3.1%(+14.1)#21 | 3.1%(+14.1)#688 |
| 22. | Country Squire Lakes | 17.0% | 3.1%(+13.9)#22 | 3.1%(+13.9)#694 |
| 23. | Plymouth | 16.9% | 3.1%(+13.7)#23 | 3.1%(+13.8)#704 |
| 24. | Charlottesville | 16.8% | 3.1%(+13.7)#24 | 3.1%(+13.7)#705 |
| 25. | Riley | 15.9% | 3.1%(+12.8)#25 | 3.1%(+12.8)#799 |
| 26. | Middletown | 14.7% | 3.1%(+11.5)#26 | 3.1%(+11.6)#907 |
| 27. | Gosport | 14.3% | 3.1%(+11.2)#27 | 3.1%(+11.2)#945 |
| 28. | Kingsbury | 13.3% | 3.1%(+10.2)#28 | 3.1%(+10.2)#1,055 |
| 29. | Homecroft | 12.6% | 3.1%(+9.49)#29 | 3.1%(+9.53)#1,141 |
| 30. | Roselawn | 12.5% | 3.1%(+9.36)#30 | 3.1%(+9.40)#1,151 |
| 31. | Buffalo | 11.8% | 3.1%(+8.71)#31 | 3.1%(+8.74)#1,239 |
| 32. | Newburgh | 11.4% | 3.1%(+8.24)#32 | 3.1%(+8.27)#1,317 |
| 33. | Camden | 11.3% | 3.1%(+8.19)#33 | 3.1%(+8.22)#1,325 |
| 34. | Francisco | 11.3% | 3.1%(+8.11)#34 | 3.1%(+8.15)#1,333 |
| 35. | Lyons | 10.7% | 3.1%(+7.58)#35 | 3.1%(+7.61)#1,422 |
| 36. | Wynnedale | 10.6% | 3.1%(+7.50)#36 | 3.1%(+7.54)#1,441 |
| 37. | Carlisle | 10.5% | 3.1%(+7.39)#37 | 3.1%(+7.43)#1,466 |
| 38. | Koontz Lake | 10.5% | 3.1%(+7.35)#38 | 3.1%(+7.39)#1,481 |
| 39. | Monticello | 10.4% | 3.1%(+7.22)#39 | 3.1%(+7.25)#1,505 |
| 40. | Millersburg | 9.8% | 3.1%(+6.67)#40 | 3.1%(+6.70)#1,650 |
| 41. | Medora | 9.8% | 3.1%(+6.62)#41 | 3.1%(+6.66)#1,659 |
| 42. | Hamlet | 9.8% | 3.1%(+6.62)#42 | 3.1%(+6.66)#1,661 |
| 43. | Princeton | 9.6% | 3.1%(+6.51)#43 | 3.1%(+6.55)#1,691 |
| 44. | Ashley | 9.5% | 3.1%(+6.39)#44 | 3.1%(+6.42)#1,718 |
| 45. | Utica | 9.4% | 3.1%(+6.25)#45 | 3.1%(+6.29)#1,755 |
| 46. | De Motte | 9.4% | 3.1%(+6.24)#46 | 3.1%(+6.28)#1,759 |
| 47. | Spring Grove | 9.3% | 3.1%(+6.14)#47 | 3.1%(+6.18)#1,794 |
| 48. | Oaktown | 9.1% | 3.1%(+5.96)#48 | 3.1%(+5.99)#1,838 |
| 49. | Greenfield | 8.9% | 3.1%(+5.74)#49 | 3.1%(+5.77)#1,932 |
| 50. | Lagrange | 8.8% | 3.1%(+5.69)#50 | 3.1%(+5.72)#1,941 |
| 51. | Earl Park | 8.8% | 3.1%(+5.69)#51 | 3.1%(+5.72)#1,948 |
| 52. | Francesville | 8.8% | 3.1%(+5.66)#52 | 3.1%(+5.70)#1,957 |
| 53. | Wheatfield | 8.6% | 3.1%(+5.48)#53 | 3.1%(+5.52)#2,013 |
| 54. | West Lafayette | 8.6% | 3.1%(+5.47)#54 | 3.1%(+5.51)#2,017 |
| 55. | Austin | 8.6% | 3.1%(+5.47)#55 | 3.1%(+5.51)#2,018 |
| 56. | Mount Vernon | 8.6% | 3.1%(+5.47)#56 | 3.1%(+5.50)#2,019 |
| 57. | Romney | 8.5% | 3.1%(+5.35)#57 | 3.1%(+5.39)#2,056 |
| 58. | Battle Ground | 8.5% | 3.1%(+5.35)#58 | 3.1%(+5.38)#2,057 |
| 59. | Orland | 8.3% | 3.1%(+5.20)#59 | 3.1%(+5.23)#2,108 |
| 60. | Spring Lake | 8.3% | 3.1%(+5.20)#60 | 3.1%(+5.23)#2,118 |
| 61. | Knightstown | 8.1% | 3.1%(+4.96)#61 | 3.1%(+4.99)#2,194 |
| 62. | Trail Creek | 7.9% | 3.1%(+4.73)#62 | 3.1%(+4.76)#2,293 |
| 63. | New Carlisle | 7.8% | 3.1%(+4.70)#63 | 3.1%(+4.73)#2,301 |
| 64. | Montmorenci | 7.8% | 3.1%(+4.70)#64 | 3.1%(+4.73)#2,303 |
| 65. | Cicero | 7.6% | 3.1%(+4.51)#65 | 3.1%(+4.55)#2,404 |
| 66. | Wanatah | 7.6% | 3.1%(+4.50)#66 | 3.1%(+4.53)#2,412 |
| 67. | Monroeville | 7.6% | 3.1%(+4.47)#67 | 3.1%(+4.51)#2,420 |
| 68. | Cannelton | 7.5% | 3.1%(+4.41)#68 | 3.1%(+4.45)#2,451 |
| 69. | Clermont | 7.5% | 3.1%(+4.32)#69 | 3.1%(+4.35)#2,498 |
| 70. | Elwood | 7.4% | 3.1%(+4.31)#70 | 3.1%(+4.34)#2,503 |
| 71. | Elberfeld | 7.4% | 3.1%(+4.22)#71 | 3.1%(+4.25)#2,552 |
| 72. | Michiana Shores | 7.4% | 3.1%(+4.22)#72 | 3.1%(+4.25)#2,554 |
| 73. | Beech Grove | 7.2% | 3.1%(+4.11)#73 | 3.1%(+4.15)#2,619 |
| 74. | Monrovia | 7.2% | 3.1%(+4.11)#74 | 3.1%(+4.15)#2,622 |
| 75. | Spring Hill | 7.0% | 3.1%(+3.88)#75 | 3.1%(+3.92)#2,778 |
| 76. | French Lick | 6.9% | 3.1%(+3.81)#76 | 3.1%(+3.84)#2,808 |
| 77. | South Haven | 6.9% | 3.1%(+3.72)#77 | 3.1%(+3.76)#2,880 |
| 78. | Galveston | 6.8% | 3.1%(+3.65)#78 | 3.1%(+3.69)#2,912 |
| 79. | Lake Santee | 6.8% | 3.1%(+3.65)#79 | 3.1%(+3.69)#2,914 |
| 80. | Markle | 6.7% | 3.1%(+3.53)#80 | 3.1%(+3.57)#2,981 |
| 81. | Pendleton | 6.6% | 3.1%(+3.50)#81 | 3.1%(+3.54)#3,016 |
| 82. | Center Point | 6.6% | 3.1%(+3.42)#82 | 3.1%(+3.46)#3,054 |
| 83. | Paoli | 6.6% | 3.1%(+3.41)#83 | 3.1%(+3.45)#3,056 |
| 84. | Griffith | 6.5% | 3.1%(+3.34)#84 | 3.1%(+3.37)#3,100 |
| 85. | Cambridge City | 6.4% | 3.1%(+3.29)#85 | 3.1%(+3.33)#3,136 |
| 86. | Southport | 6.4% | 3.1%(+3.29)#86 | 3.1%(+3.32)#3,143 |
| 87. | Montpelier | 6.3% | 3.1%(+3.17)#87 | 3.1%(+3.21)#3,216 |
| 88. | Leo Cedarville | 6.3% | 3.1%(+3.16)#88 | 3.1%(+3.20)#3,223 |
| 89. | Covington | 6.3% | 3.1%(+3.13)#89 | 3.1%(+3.16)#3,236 |
| 90. | Elnora | 6.2% | 3.1%(+3.11)#90 | 3.1%(+3.15)#3,253 |
| 91. | Sandborn | 6.2% | 3.1%(+3.11)#91 | 3.1%(+3.15)#3,264 |
| 92. | Brownstown | 6.2% | 3.1%(+3.10)#92 | 3.1%(+3.13)#3,282 |
| 93. | Roachdale | 6.2% | 3.1%(+3.05)#93 | 3.1%(+3.09)#3,318 |
| 94. | Zanesville | 6.2% | 3.1%(+3.04)#94 | 3.1%(+3.07)#3,332 |
| 95. | Roanoke | 6.0% | 3.1%(+2.89)#95 | 3.1%(+2.93)#3,439 |
| 96. | Heritage Lake | 5.9% | 3.1%(+2.80)#96 | 3.1%(+2.84)#3,512 |
| 97. | Tecumseh | 5.9% | 3.1%(+2.77)#97 | 3.1%(+2.80)#3,542 |
| 98. | Aberdeen | 5.9% | 3.1%(+2.76)#98 | 3.1%(+2.80)#3,544 |
| 99. | Whiting | 5.8% | 3.1%(+2.65)#99 | 3.1%(+2.69)#3,639 |
| 100. | North Salem | 5.8% | 3.1%(+2.65)#100 | 3.1%(+2.69)#3,644 |
Common Questions
What are the Top 10 Cities with the Highest Percentage of Population with a Degree in Physical and Health Sciences in Indiana?
Top 10 Cities with the Highest Percentage of Population with a Degree in Physical and Health Sciences in Indiana are:
#1
68.3%
#2
61.9%
#3
46.2%
#4
33.3%
#5
33.3%
#6
29.9%
#7
27.6%
#8
25.0%
#9
25.0%
#10
25.0%
What city has the Highest Percentage of Population with a Degree in Physical and Health Sciences in Indiana?
Hanna has the Highest Percentage of Population with a Degree in Physical and Health Sciences in Indiana with 68.3%.
What is the Percentage of Population with a Degree in Physical and Health Sciences in the State of Indiana?
Percentage of Population with a Degree in Physical and Health Sciences in Indiana is 3.1%.
What is the Percentage of Population with a Degree in Physical and Health Sciences in the United States?
Percentage of Population with a Degree in Physical and Health Sciences in the United States is 3.1%.