Cities with the Most Immigrants from Europe in Indiana
RELATED REPORTS & OPTIONS
Europe
Indiana
Compare Cities
Map of Cities with the Most Immigrants from Europe in Indiana
0
5,000
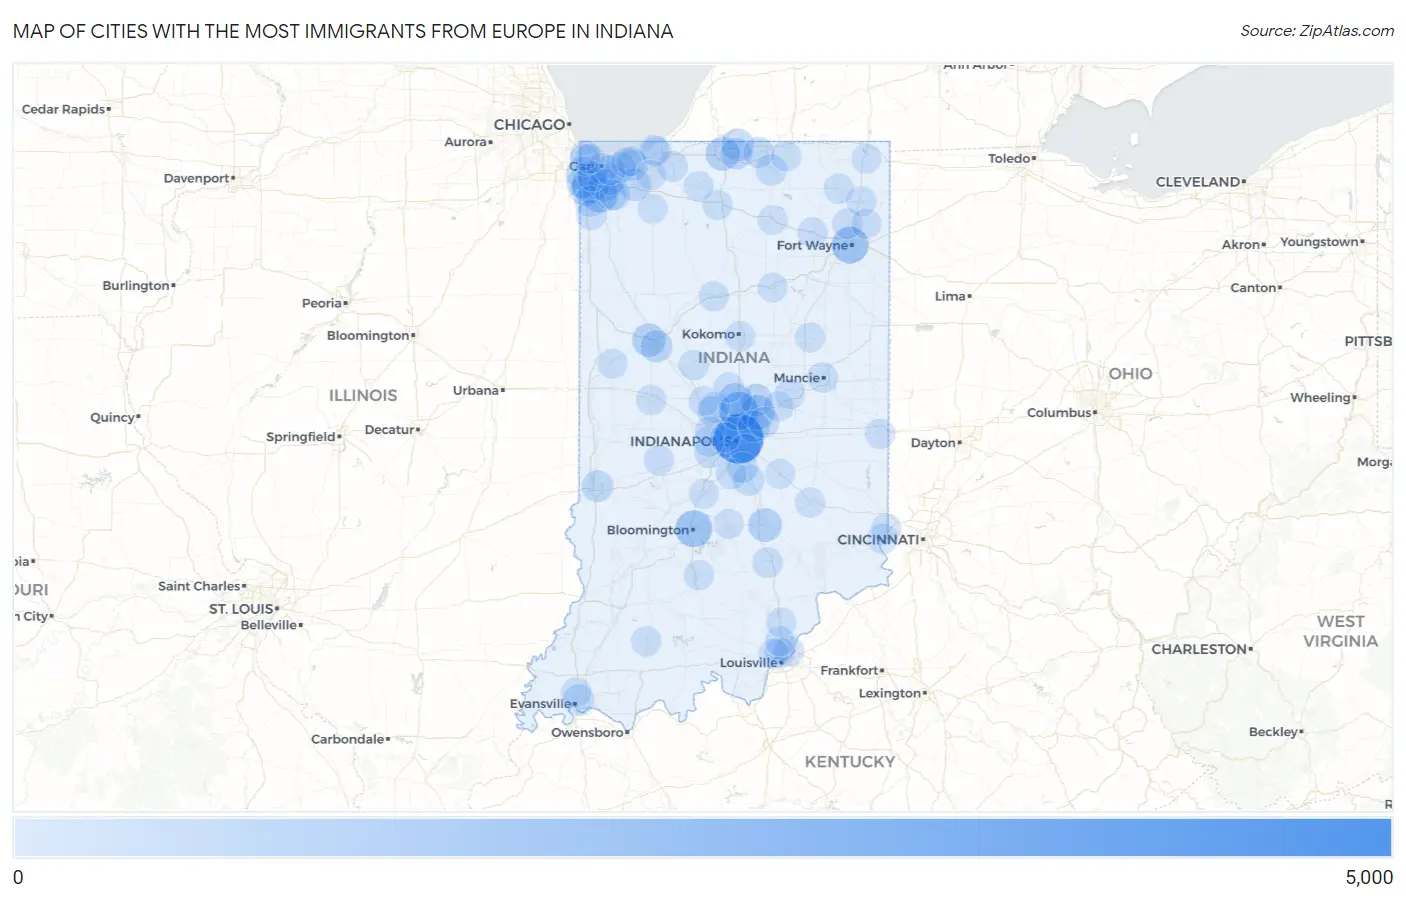
Cities with the Most Immigrants from Europe in Indiana
| City | Europe | vs State | vs National | |
| 1. | Indianapolis | 4,455 | 39,350(11.32%)#1 | 4,820,287(0.09%)#101 |
| 2. | Carmel | 1,904 | 39,350(4.84%)#2 | 4,820,287(0.04%)#322 |
| 3. | Bloomington | 1,516 | 39,350(3.85%)#3 | 4,820,287(0.03%)#431 |
| 4. | Fort Wayne | 1,449 | 39,350(3.68%)#4 | 4,820,287(0.03%)#468 |
| 5. | Schererville | 1,287 | 39,350(3.27%)#5 | 4,820,287(0.03%)#542 |
| 6. | Crown Point | 1,107 | 39,350(2.81%)#6 | 4,820,287(0.02%)#632 |
| 7. | Fishers | 1,023 | 39,350(2.60%)#7 | 4,820,287(0.02%)#681 |
| 8. | South Bend | 843 | 39,350(2.14%)#8 | 4,820,287(0.02%)#811 |
| 9. | Westfield | 790 | 39,350(2.01%)#9 | 4,820,287(0.02%)#864 |
| 10. | Columbus | 784 | 39,350(1.99%)#10 | 4,820,287(0.02%)#871 |
| 11. | West Lafayette | 718 | 39,350(1.82%)#11 | 4,820,287(0.01%)#950 |
| 12. | Munster | 572 | 39,350(1.45%)#12 | 4,820,287(0.01%)#1,222 |
| 13. | Noblesville | 555 | 39,350(1.41%)#13 | 4,820,287(0.01%)#1,262 |
| 14. | Granger | 535 | 39,350(1.36%)#14 | 4,820,287(0.01%)#1,298 |
| 15. | Lafayette | 532 | 39,350(1.35%)#15 | 4,820,287(0.01%)#1,307 |
| 16. | St John | 506 | 39,350(1.29%)#16 | 4,820,287(0.01%)#1,361 |
| 17. | Merrillville | 490 | 39,350(1.25%)#17 | 4,820,287(0.01%)#1,402 |
| 18. | Valparaiso | 490 | 39,350(1.25%)#18 | 4,820,287(0.01%)#1,403 |
| 19. | Hobart | 474 | 39,350(1.20%)#19 | 4,820,287(0.01%)#1,443 |
| 20. | Lawrence | 394 | 39,350(1.00%)#20 | 4,820,287(0.01%)#1,704 |
| 21. | Dyer | 378 | 39,350(0.96%)#21 | 4,820,287(0.01%)#1,761 |
| 22. | Terre Haute | 367 | 39,350(0.93%)#22 | 4,820,287(0.01%)#1,795 |
| 23. | Mishawaka | 337 | 39,350(0.86%)#23 | 4,820,287(0.01%)#1,920 |
| 24. | Franklin | 299 | 39,350(0.76%)#24 | 4,820,287(0.01%)#2,105 |
| 25. | Evansville | 271 | 39,350(0.69%)#25 | 4,820,287(0.01%)#2,232 |
| 26. | Chesterton | 271 | 39,350(0.69%)#26 | 4,820,287(0.01%)#2,235 |
| 27. | Hammond | 262 | 39,350(0.67%)#27 | 4,820,287(0.01%)#2,283 |
| 28. | Portage | 262 | 39,350(0.67%)#28 | 4,820,287(0.01%)#2,285 |
| 29. | Goshen | 260 | 39,350(0.66%)#29 | 4,820,287(0.01%)#2,298 |
| 30. | Cedar Lake | 251 | 39,350(0.64%)#30 | 4,820,287(0.01%)#2,363 |
| 31. | Elkhart | 243 | 39,350(0.62%)#31 | 4,820,287(0.01%)#2,417 |
| 32. | Greenwood | 230 | 39,350(0.58%)#32 | 4,820,287(0.00%)#2,527 |
| 33. | Plainfield | 200 | 39,350(0.51%)#33 | 4,820,287(0.00%)#2,751 |
| 34. | Zionsville | 195 | 39,350(0.50%)#34 | 4,820,287(0.00%)#2,798 |
| 35. | Avon | 192 | 39,350(0.49%)#35 | 4,820,287(0.00%)#2,816 |
| 36. | Winfield | 184 | 39,350(0.47%)#36 | 4,820,287(0.00%)#2,898 |
| 37. | La Porte | 180 | 39,350(0.46%)#37 | 4,820,287(0.00%)#2,932 |
| 38. | Floyds Knobs | 160 | 39,350(0.41%)#38 | 4,820,287(0.00%)#3,198 |
| 39. | Mccordsville | 157 | 39,350(0.40%)#39 | 4,820,287(0.00%)#3,237 |
| 40. | Whitestown | 147 | 39,350(0.37%)#40 | 4,820,287(0.00%)#3,366 |
| 41. | Lakes Of The Four Seasons | 147 | 39,350(0.37%)#41 | 4,820,287(0.00%)#3,368 |
| 42. | Jeffersonville | 145 | 39,350(0.37%)#42 | 4,820,287(0.00%)#3,387 |
| 43. | Gary | 136 | 39,350(0.35%)#43 | 4,820,287(0.00%)#3,512 |
| 44. | Muncie | 135 | 39,350(0.34%)#44 | 4,820,287(0.00%)#3,526 |
| 45. | Bargersville | 127 | 39,350(0.32%)#45 | 4,820,287(0.00%)#3,663 |
| 46. | Griffith | 125 | 39,350(0.32%)#46 | 4,820,287(0.00%)#3,694 |
| 47. | Seymour | 122 | 39,350(0.31%)#47 | 4,820,287(0.00%)#3,746 |
| 48. | Lebanon | 111 | 39,350(0.28%)#48 | 4,820,287(0.00%)#3,946 |
| 49. | Lowell | 110 | 39,350(0.28%)#49 | 4,820,287(0.00%)#3,963 |
| 50. | Crawfordsville | 107 | 39,350(0.27%)#50 | 4,820,287(0.00%)#4,009 |
| 51. | Michigan City | 105 | 39,350(0.27%)#51 | 4,820,287(0.00%)#4,053 |
| 52. | Brownsburg | 104 | 39,350(0.26%)#52 | 4,820,287(0.00%)#4,075 |
| 53. | Greencastle | 100 | 39,350(0.25%)#53 | 4,820,287(0.00%)#4,183 |
| 54. | Huntertown | 95 | 39,350(0.24%)#54 | 4,820,287(0.00%)#4,297 |
| 55. | Kokomo | 90 | 39,350(0.23%)#55 | 4,820,287(0.00%)#4,426 |
| 56. | Lake Station | 87 | 39,350(0.22%)#56 | 4,820,287(0.00%)#4,507 |
| 57. | Clarksville | 84 | 39,350(0.21%)#57 | 4,820,287(0.00%)#4,589 |
| 58. | Lawrenceburg | 84 | 39,350(0.21%)#58 | 4,820,287(0.00%)#4,604 |
| 59. | Anderson | 79 | 39,350(0.20%)#59 | 4,820,287(0.00%)#4,729 |
| 60. | Columbia City | 76 | 39,350(0.19%)#60 | 4,820,287(0.00%)#4,828 |
| 61. | Frankfort | 70 | 39,350(0.18%)#61 | 4,820,287(0.00%)#5,003 |
| 62. | Auburn | 68 | 39,350(0.17%)#62 | 4,820,287(0.00%)#5,071 |
| 63. | Attica | 67 | 39,350(0.17%)#63 | 4,820,287(0.00%)#5,120 |
| 64. | Plymouth | 63 | 39,350(0.16%)#64 | 4,820,287(0.00%)#5,232 |
| 65. | Jasper | 62 | 39,350(0.16%)#65 | 4,820,287(0.00%)#5,267 |
| 66. | Hidden Valley | 61 | 39,350(0.16%)#66 | 4,820,287(0.00%)#5,318 |
| 67. | Beech Grove | 57 | 39,350(0.14%)#67 | 4,820,287(0.00%)#5,469 |
| 68. | Pendleton | 56 | 39,350(0.14%)#68 | 4,820,287(0.00%)#5,523 |
| 69. | Ardmore | 55 | 39,350(0.14%)#69 | 4,820,287(0.00%)#5,589 |
| 70. | Middlebury | 53 | 39,350(0.13%)#70 | 4,820,287(0.00%)#5,685 |
| 71. | Leo Cedarville | 53 | 39,350(0.13%)#71 | 4,820,287(0.00%)#5,686 |
| 72. | Philadelphia | 52 | 39,350(0.13%)#72 | 4,820,287(0.00%)#5,758 |
| 73. | New Albany | 49 | 39,350(0.12%)#73 | 4,820,287(0.00%)#5,863 |
| 74. | Highland | 49 | 39,350(0.12%)#74 | 4,820,287(0.00%)#5,878 |
| 75. | Sheridan | 49 | 39,350(0.12%)#75 | 4,820,287(0.00%)#5,892 |
| 76. | Logansport | 47 | 39,350(0.12%)#76 | 4,820,287(0.00%)#5,967 |
| 77. | Kendallville | 47 | 39,350(0.12%)#77 | 4,820,287(0.00%)#5,975 |
| 78. | Burns Harbor | 47 | 39,350(0.12%)#78 | 4,820,287(0.00%)#6,005 |
| 79. | Walkerton | 44 | 39,350(0.11%)#79 | 4,820,287(0.00%)#6,187 |
| 80. | Sellersburg | 42 | 39,350(0.11%)#80 | 4,820,287(0.00%)#6,271 |
| 81. | Bedford | 41 | 39,350(0.10%)#81 | 4,820,287(0.00%)#6,328 |
| 82. | Richmond | 40 | 39,350(0.10%)#82 | 4,820,287(0.00%)#6,383 |
| 83. | Whiting | 39 | 39,350(0.10%)#83 | 4,820,287(0.00%)#6,489 |
| 84. | Martinsville | 37 | 39,350(0.09%)#84 | 4,820,287(0.00%)#6,602 |
| 85. | Greensburg | 36 | 39,350(0.09%)#85 | 4,820,287(0.00%)#6,700 |
| 86. | Shelbyville | 35 | 39,350(0.09%)#86 | 4,820,287(0.00%)#6,765 |
| 87. | Upland | 35 | 39,350(0.09%)#87 | 4,820,287(0.00%)#6,799 |
| 88. | La Crosse | 35 | 39,350(0.09%)#88 | 4,820,287(0.00%)#6,845 |
| 89. | Speedway | 33 | 39,350(0.08%)#89 | 4,820,287(0.00%)#6,924 |
| 90. | Henryville | 33 | 39,350(0.08%)#90 | 4,820,287(0.00%)#6,973 |
| 91. | Nashville | 33 | 39,350(0.08%)#91 | 4,820,287(0.00%)#6,979 |
| 92. | Lyford | 33 | 39,350(0.08%)#92 | 4,820,287(0.00%)#6,994 |
| 93. | Warsaw | 32 | 39,350(0.08%)#93 | 4,820,287(0.00%)#7,000 |
| 94. | Wabash | 32 | 39,350(0.08%)#94 | 4,820,287(0.00%)#7,007 |
| 95. | Trail Creek | 31 | 39,350(0.08%)#95 | 4,820,287(0.00%)#7,129 |
| 96. | Porter | 30 | 39,350(0.08%)#96 | 4,820,287(0.00%)#7,175 |
| 97. | Angola | 29 | 39,350(0.07%)#97 | 4,820,287(0.00%)#7,241 |
| 98. | Westville | 29 | 39,350(0.07%)#98 | 4,820,287(0.00%)#7,252 |
| 99. | East Chicago | 28 | 39,350(0.07%)#99 | 4,820,287(0.00%)#7,322 |
| 100. | Ontario | 28 | 39,350(0.07%)#100 | 4,820,287(0.00%)#7,404 |
Common Questions
What are the Top 10 Cities with the Most Immigrants from Europe in Indiana?
Top 10 Cities with the Most Immigrants from Europe in Indiana are:
#1
4,455
#2
1,904
#3
1,516
#4
1,449
#5
1,287
#6
1,107
#7
1,023
#8
843
#9
790
#10
784
What city has the Most Immigrants from Europe in Indiana?
Indianapolis has the Most Immigrants from Europe in Indiana with 4,455.
What is the Total Immigrants from Europe in the State of Indiana?
Total Immigrants from Europe in Indiana is 39,350.
What is the Total Immigrants from Europe in the United States?
Total Immigrants from Europe in the United States is 4,820,287.