Cities with the Most Immigrants from Western Africa in Indiana
RELATED REPORTS & OPTIONS
Western Africa
Indiana
Compare Cities
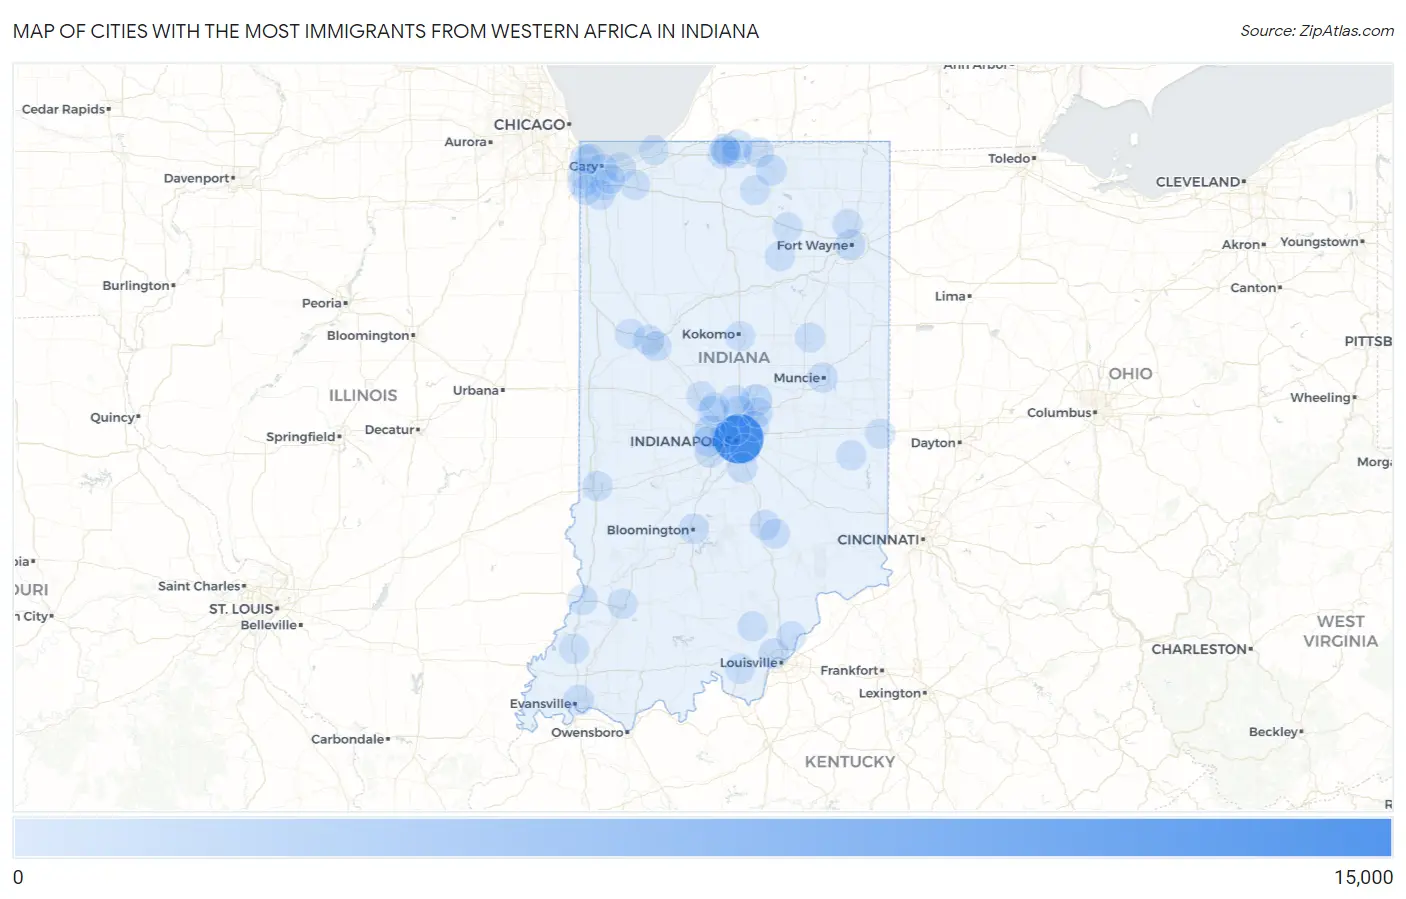
Map of Cities with the Most Immigrants from Western Africa in Indiana
0
15,000
Cities with the Most Immigrants from Western Africa in Indiana
| City | Western Africa | vs State | vs National | |
| 1. | Indianapolis | 11,151 | 19,988(55.79%)#1 | 985,560(1.13%)#9 |
| 2. | Noblesville | 973 | 19,988(4.87%)#2 | 985,560(0.10%)#139 |
| 3. | Brownsburg | 898 | 19,988(4.49%)#3 | 985,560(0.09%)#153 |
| 4. | Speedway | 713 | 19,988(3.57%)#4 | 985,560(0.07%)#188 |
| 5. | Goshen | 440 | 19,988(2.20%)#5 | 985,560(0.04%)#326 |
| 6. | Carmel | 424 | 19,988(2.12%)#6 | 985,560(0.04%)#331 |
| 7. | Avon | 418 | 19,988(2.09%)#7 | 985,560(0.04%)#336 |
| 8. | West Lafayette | 350 | 19,988(1.75%)#8 | 985,560(0.04%)#399 |
| 9. | Fort Wayne | 311 | 19,988(1.56%)#9 | 985,560(0.03%)#442 |
| 10. | New Albany | 297 | 19,988(1.49%)#10 | 985,560(0.03%)#464 |
| 11. | Hammond | 296 | 19,988(1.48%)#11 | 985,560(0.03%)#467 |
| 12. | Granger | 199 | 19,988(1.00%)#12 | 985,560(0.02%)#655 |
| 13. | Columbus | 193 | 19,988(0.97%)#13 | 985,560(0.02%)#668 |
| 14. | Greenwood | 173 | 19,988(0.87%)#14 | 985,560(0.02%)#727 |
| 15. | Muncie | 166 | 19,988(0.83%)#15 | 985,560(0.02%)#753 |
| 16. | Bloomington | 159 | 19,988(0.80%)#16 | 985,560(0.02%)#782 |
| 17. | Lawrence | 151 | 19,988(0.76%)#17 | 985,560(0.02%)#830 |
| 18. | South Bend | 138 | 19,988(0.69%)#18 | 985,560(0.01%)#883 |
| 19. | Evansville | 129 | 19,988(0.65%)#19 | 985,560(0.01%)#927 |
| 20. | Fishers | 121 | 19,988(0.61%)#20 | 985,560(0.01%)#962 |
| 21. | Lafayette | 100 | 19,988(0.50%)#21 | 985,560(0.01%)#1,080 |
| 22. | Plainfield | 99 | 19,988(0.50%)#22 | 985,560(0.01%)#1,091 |
| 23. | Munster | 81 | 19,988(0.41%)#23 | 985,560(0.01%)#1,248 |
| 24. | Vincennes | 74 | 19,988(0.37%)#24 | 985,560(0.01%)#1,317 |
| 25. | Valparaiso | 70 | 19,988(0.35%)#25 | 985,560(0.01%)#1,355 |
| 26. | Terre Haute | 67 | 19,988(0.34%)#26 | 985,560(0.01%)#1,398 |
| 27. | Charlestown | 62 | 19,988(0.31%)#27 | 985,560(0.01%)#1,477 |
| 28. | Westfield | 55 | 19,988(0.28%)#28 | 985,560(0.01%)#1,562 |
| 29. | Huntertown | 52 | 19,988(0.26%)#29 | 985,560(0.01%)#1,613 |
| 30. | Nappanee | 46 | 19,988(0.23%)#30 | 985,560(0.00%)#1,715 |
| 31. | East Chicago | 43 | 19,988(0.22%)#31 | 985,560(0.00%)#1,768 |
| 32. | Washington | 42 | 19,988(0.21%)#32 | 985,560(0.00%)#1,794 |
| 33. | Whitestown | 42 | 19,988(0.21%)#33 | 985,560(0.00%)#1,796 |
| 34. | Connersville | 37 | 19,988(0.19%)#34 | 985,560(0.00%)#1,911 |
| 35. | Michigan City | 34 | 19,988(0.17%)#35 | 985,560(0.00%)#1,965 |
| 36. | Mishawaka | 32 | 19,988(0.16%)#36 | 985,560(0.00%)#2,010 |
| 37. | Kokomo | 31 | 19,988(0.16%)#37 | 985,560(0.00%)#2,035 |
| 38. | Gary | 29 | 19,988(0.15%)#38 | 985,560(0.00%)#2,092 |
| 39. | Merrillville | 24 | 19,988(0.12%)#39 | 985,560(0.00%)#2,232 |
| 40. | Dyer | 24 | 19,988(0.12%)#40 | 985,560(0.00%)#2,237 |
| 41. | Elkhart | 23 | 19,988(0.12%)#41 | 985,560(0.00%)#2,260 |
| 42. | Elizabethtown | 22 | 19,988(0.11%)#42 | 985,560(0.00%)#2,316 |
| 43. | Corydon | 21 | 19,988(0.11%)#43 | 985,560(0.00%)#2,350 |
| 44. | Roseland | 20 | 19,988(0.10%)#44 | 985,560(0.00%)#2,392 |
| 45. | Princeton | 17 | 19,988(0.09%)#45 | 985,560(0.00%)#2,515 |
| 46. | Crown Point | 16 | 19,988(0.08%)#46 | 985,560(0.00%)#2,542 |
| 47. | North Manchester | 16 | 19,988(0.08%)#47 | 985,560(0.00%)#2,576 |
| 48. | Zionsville | 15 | 19,988(0.08%)#48 | 985,560(0.00%)#2,597 |
| 49. | Portage | 14 | 19,988(0.07%)#49 | 985,560(0.00%)#2,645 |
| 50. | St John | 14 | 19,988(0.07%)#50 | 985,560(0.00%)#2,661 |
| 51. | Hobart | 13 | 19,988(0.07%)#51 | 985,560(0.00%)#2,707 |
| 52. | Richmond | 11 | 19,988(0.06%)#52 | 985,560(0.00%)#2,814 |
| 53. | Beech Grove | 9 | 19,988(0.05%)#53 | 985,560(0.00%)#2,936 |
| 54. | Pierceton | 9 | 19,988(0.05%)#54 | 985,560(0.00%)#2,973 |
| 55. | Notre Dame | 7 | 19,988(0.04%)#55 | 985,560(0.00%)#3,079 |
| 56. | Upland | 7 | 19,988(0.04%)#56 | 985,560(0.00%)#3,087 |
| 57. | Otterbein | 4 | 19,988(0.02%)#57 | 985,560(0.00%)#3,283 |
| 58. | Ulen | 4 | 19,988(0.02%)#58 | 985,560(0.00%)#3,299 |
| 59. | Rocky Ripple | 2 | 19,988(0.01%)#59 | 985,560(0.00%)#3,430 |
| 60. | New Pekin | 1 | 19,988(0.01%)#60 | 985,560(0.00%)#3,492 |
Common Questions
What are the Top 10 Cities with the Most Immigrants from Western Africa in Indiana?
Top 10 Cities with the Most Immigrants from Western Africa in Indiana are:
#1
11,151
#2
973
#3
898
#4
713
#5
440
#6
424
#7
418
#8
350
#9
311
#10
297
What city has the Most Immigrants from Western Africa in Indiana?
Indianapolis has the Most Immigrants from Western Africa in Indiana with 11,151.
What is the Total Immigrants from Western Africa in the State of Indiana?
Total Immigrants from Western Africa in Indiana is 19,988.
What is the Total Immigrants from Western Africa in the United States?
Total Immigrants from Western Africa in the United States is 985,560.