Cities with the Most Immigrants from El Salvador in Indiana
RELATED REPORTS & OPTIONS
El Salvador
Indiana
Compare Cities
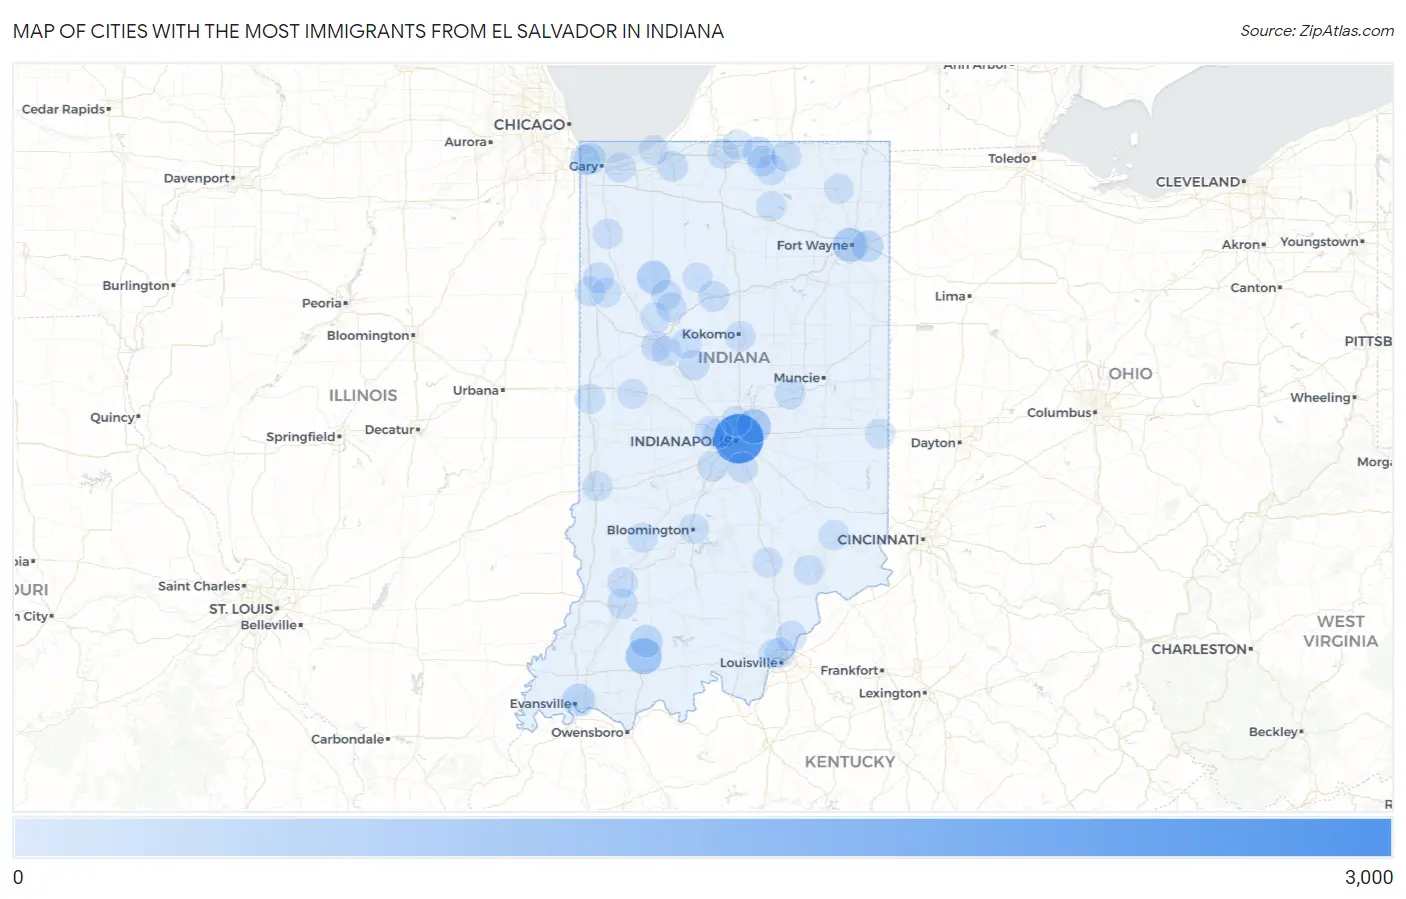
Map of Cities with the Most Immigrants from El Salvador in Indiana
0
3,000
Cities with the Most Immigrants from El Salvador in Indiana
| City | El Salvador | vs State | vs National | |
| 1. | Indianapolis | 2,660 | 8,253(32.23%)#1 | 1,408,349(0.19%)#79 |
| 2. | Huntingburg | 790 | 8,253(9.57%)#2 | 1,408,349(0.06%)#275 |
| 3. | Lawrence | 566 | 8,253(6.86%)#3 | 1,408,349(0.04%)#362 |
| 4. | Fort Wayne | 552 | 8,253(6.69%)#4 | 1,408,349(0.04%)#367 |
| 5. | Monon | 457 | 8,253(5.54%)#5 | 1,408,349(0.03%)#437 |
| 6. | Evansville | 323 | 8,253(3.91%)#6 | 1,408,349(0.02%)#611 |
| 7. | Jasper | 302 | 8,253(3.66%)#7 | 1,408,349(0.02%)#644 |
| 8. | New Haven | 217 | 8,253(2.63%)#8 | 1,408,349(0.02%)#811 |
| 9. | East Chicago | 188 | 8,253(2.28%)#9 | 1,408,349(0.01%)#880 |
| 10. | Elkhart | 181 | 8,253(2.19%)#10 | 1,408,349(0.01%)#898 |
| 11. | Anderson | 103 | 8,253(1.25%)#11 | 1,408,349(0.01%)#1,274 |
| 12. | Philadelphia | 102 | 8,253(1.24%)#12 | 1,408,349(0.01%)#1,291 |
| 13. | Logansport | 88 | 8,253(1.07%)#13 | 1,408,349(0.01%)#1,401 |
| 14. | La Porte | 87 | 8,253(1.05%)#14 | 1,408,349(0.01%)#1,411 |
| 15. | Brook | 84 | 8,253(1.02%)#15 | 1,408,349(0.01%)#1,444 |
| 16. | Frankfort | 69 | 8,253(0.84%)#16 | 1,408,349(0.00%)#1,592 |
| 17. | Hammond | 68 | 8,253(0.82%)#17 | 1,408,349(0.00%)#1,597 |
| 18. | Greenwood | 66 | 8,253(0.80%)#18 | 1,408,349(0.00%)#1,630 |
| 19. | Charlestown | 55 | 8,253(0.67%)#19 | 1,408,349(0.00%)#1,810 |
| 20. | Goshen | 51 | 8,253(0.62%)#20 | 1,408,349(0.00%)#1,868 |
| 21. | Dunlap | 49 | 8,253(0.59%)#21 | 1,408,349(0.00%)#1,905 |
| 22. | Lafayette | 47 | 8,253(0.57%)#22 | 1,408,349(0.00%)#1,925 |
| 23. | Monticello | 43 | 8,253(0.52%)#23 | 1,408,349(0.00%)#2,012 |
| 24. | Kokomo | 41 | 8,253(0.50%)#24 | 1,408,349(0.00%)#2,037 |
| 25. | Washington | 40 | 8,253(0.48%)#25 | 1,408,349(0.00%)#2,073 |
| 26. | Fair Oaks | 40 | 8,253(0.48%)#26 | 1,408,349(0.00%)#2,084 |
| 27. | Plainville | 28 | 8,253(0.34%)#27 | 1,408,349(0.00%)#2,376 |
| 28. | Middlebury | 25 | 8,253(0.30%)#28 | 1,408,349(0.00%)#2,459 |
| 29. | Mooresville | 24 | 8,253(0.29%)#29 | 1,408,349(0.00%)#2,489 |
| 30. | South Bend | 23 | 8,253(0.28%)#30 | 1,408,349(0.00%)#2,509 |
| 31. | Richmond | 22 | 8,253(0.27%)#31 | 1,408,349(0.00%)#2,559 |
| 32. | Roselawn | 22 | 8,253(0.27%)#32 | 1,408,349(0.00%)#2,582 |
| 33. | Osgood | 22 | 8,253(0.27%)#33 | 1,408,349(0.00%)#2,589 |
| 34. | Terre Haute | 21 | 8,253(0.25%)#34 | 1,408,349(0.00%)#2,599 |
| 35. | Kentland | 20 | 8,253(0.24%)#35 | 1,408,349(0.00%)#2,681 |
| 36. | New Albany | 18 | 8,253(0.22%)#36 | 1,408,349(0.00%)#2,737 |
| 37. | Clermont | 16 | 8,253(0.19%)#37 | 1,408,349(0.00%)#2,846 |
| 38. | Seymour | 13 | 8,253(0.16%)#38 | 1,408,349(0.00%)#2,991 |
| 39. | Michigan City | 12 | 8,253(0.15%)#39 | 1,408,349(0.00%)#3,054 |
| 40. | Granger | 11 | 8,253(0.13%)#40 | 1,408,349(0.00%)#3,113 |
| 41. | Putnamville | 10 | 8,253(0.12%)#41 | 1,408,349(0.00%)#3,216 |
| 42. | Brookston | 10 | 8,253(0.12%)#42 | 1,408,349(0.00%)#3,219 |
| 43. | Goodland | 10 | 8,253(0.12%)#43 | 1,408,349(0.00%)#3,224 |
| 44. | Bloomington | 9 | 8,253(0.11%)#44 | 1,408,349(0.00%)#3,234 |
| 45. | Portage | 9 | 8,253(0.11%)#45 | 1,408,349(0.00%)#3,239 |
| 46. | Perrysville | 9 | 8,253(0.11%)#46 | 1,408,349(0.00%)#3,310 |
| 47. | Kendallville | 7 | 8,253(0.08%)#47 | 1,408,349(0.00%)#3,432 |
| 48. | Royal Center | 6 | 8,253(0.07%)#48 | 1,408,349(0.00%)#3,557 |
| 49. | Brownsburg | 5 | 8,253(0.06%)#49 | 1,408,349(0.00%)#3,569 |
| 50. | Clarksville | 4 | 8,253(0.05%)#50 | 1,408,349(0.00%)#3,646 |
| 51. | Dayton | 3 | 8,253(0.04%)#51 | 1,408,349(0.00%)#3,759 |
| 52. | Williams Creek | 3 | 8,253(0.04%)#52 | 1,408,349(0.00%)#3,774 |
| 53. | Lincoln | 3 | 8,253(0.04%)#53 | 1,408,349(0.00%)#3,781 |
| 54. | Rossville | 2 | 8,253(0.02%)#54 | 1,408,349(0.00%)#3,814 |
| 55. | Worthington | 2 | 8,253(0.02%)#55 | 1,408,349(0.00%)#3,815 |
| 56. | Dupont | 2 | 8,253(0.02%)#56 | 1,408,349(0.00%)#3,853 |
| 57. | Yeoman | 2 | 8,253(0.02%)#57 | 1,408,349(0.00%)#3,856 |
| 58. | Leesburg | 1 | 8,253(0.01%)#58 | 1,408,349(0.00%)#3,904 |
| 59. | Waynetown | 1 | 8,253(0.01%)#59 | 1,408,349(0.00%)#3,908 |
Common Questions
What are the Top 10 Cities with the Most Immigrants from El Salvador in Indiana?
Top 10 Cities with the Most Immigrants from El Salvador in Indiana are:
#1
2,660
#2
790
#3
566
#4
552
#5
457
#6
323
#7
302
#8
217
#9
188
#10
181
What city has the Most Immigrants from El Salvador in Indiana?
Indianapolis has the Most Immigrants from El Salvador in Indiana with 2,660.
What is the Total Immigrants from El Salvador in the State of Indiana?
Total Immigrants from El Salvador in Indiana is 8,253.
What is the Total Immigrants from El Salvador in the United States?
Total Immigrants from El Salvador in the United States is 1,408,349.