Cities with the Highest Percentage of Households with Income Above $100,000 in Indiana
RELATED REPORTS & OPTIONS
Household Income | $100k+
Indiana
Compare Cities
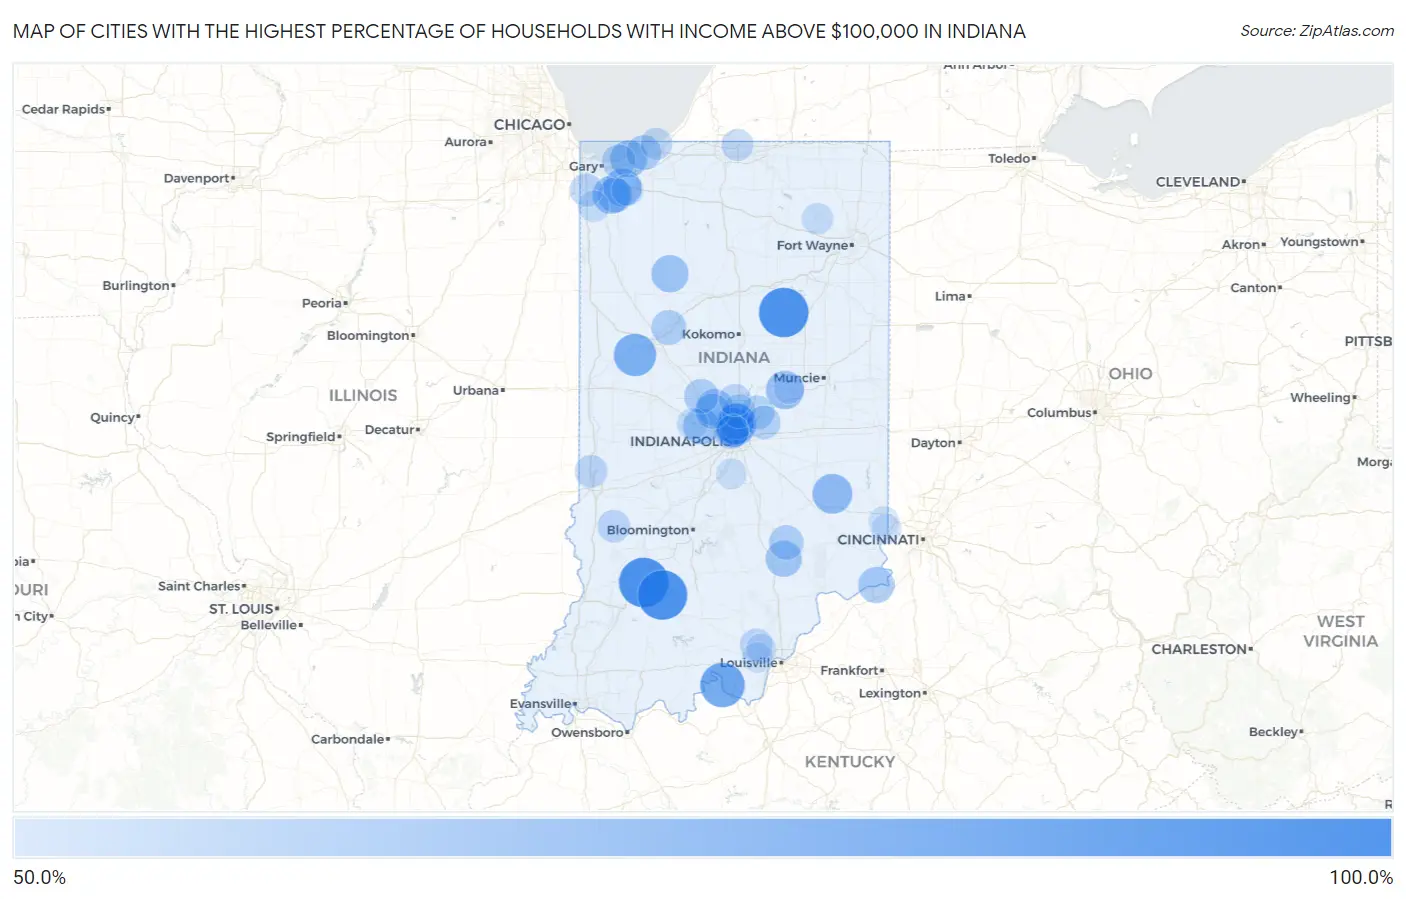
Map of Cities with the Highest Percentage of Households with Income Above $100,000 in Indiana
0.0%
100.0%
Cities with the Highest Percentage of Households with Income Above $100,000 in Indiana
| City | Households with Income > $100k | vs State | vs National | |
| 1. | Harrison Lake | 100.0% | 30.7%(+69.3)#1 | 37.3%(+62.7)#13 |
| 2. | Goldsmith | 100.0% | 30.7%(+69.3)#2 | 37.3%(+62.7)#18 |
| 3. | Schaefer Lake | 100.0% | 30.7%(+69.3)#3 | 37.3%(+62.7)#21 |
| 4. | Stone Bluff | 100.0% | 30.7%(+69.3)#4 | 37.3%(+62.7)#34 |
| 5. | Martinsburg | 100.0% | 30.7%(+69.3)#5 | 37.3%(+62.7)#43 |
| 6. | Raglesville | 100.0% | 30.7%(+69.3)#6 | 37.3%(+62.7)#67 |
| 7. | Buckskin | 100.0% | 30.7%(+69.3)#7 | 37.3%(+62.7)#97 |
| 8. | Dover Hill | 100.0% | 30.7%(+69.3)#8 | 37.3%(+62.7)#105 |
| 9. | Peppertown | 100.0% | 30.7%(+69.3)#9 | 37.3%(+62.7)#116 |
| 10. | Jalapa | 100.0% | 30.7%(+69.3)#10 | 37.3%(+62.7)#119 |
| 11. | Elizaville | 100.0% | 30.7%(+69.3)#11 | 37.3%(+62.7)#129 |
| 12. | Hamburg | 100.0% | 30.7%(+69.3)#12 | 37.3%(+62.7)#153 |
| 13. | Roll | 100.0% | 30.7%(+69.3)#13 | 37.3%(+62.7)#154 |
| 14. | Sandusky | 100.0% | 30.7%(+69.3)#14 | 37.3%(+62.7)#159 |
| 15. | Graysville | 100.0% | 30.7%(+69.3)#15 | 37.3%(+62.7)#162 |
| 16. | Stanford | 90.2% | 30.7%(+59.5)#16 | 37.3%(+52.9)#249 |
| 17. | Wellsboro | 90.0% | 30.7%(+59.3)#17 | 37.3%(+52.7)#252 |
| 18. | Blooming Grove | 88.3% | 30.7%(+57.6)#18 | 37.3%(+51.0)#284 |
| 19. | Grandview Lake | 87.2% | 30.7%(+56.5)#19 | 37.3%(+49.9)#300 |
| 20. | New Amsterdam | 87.1% | 30.7%(+56.4)#20 | 37.3%(+49.8)#302 |
| 21. | Judyville | 85.5% | 30.7%(+54.8)#21 | 37.3%(+48.2)#333 |
| 22. | Wooster | 84.3% | 30.7%(+53.6)#22 | 37.3%(+47.0)#362 |
| 23. | West Point | 81.9% | 30.7%(+51.2)#23 | 37.3%(+44.6)#463 |
| 24. | Judah | 81.2% | 30.7%(+50.5)#24 | 37.3%(+43.9)#494 |
| 25. | Carrollton | 79.7% | 30.7%(+49.0)#25 | 37.3%(+42.4)#567 |
| 26. | New Lisbon | 79.3% | 30.7%(+48.6)#26 | 37.3%(+42.0)#597 |
| 27. | New Lebanon | 78.9% | 30.7%(+48.2)#27 | 37.3%(+41.6)#623 |
| 28. | Meridian Hills | 77.4% | 30.7%(+46.7)#28 | 37.3%(+40.1)#737 |
| 29. | Scott | 75.7% | 30.7%(+45.0)#29 | 37.3%(+38.4)#839 |
| 30. | Lake Santee | 75.6% | 30.7%(+44.9)#30 | 37.3%(+38.3)#845 |
| 31. | Cassville | 74.6% | 30.7%(+43.9)#31 | 37.3%(+37.3)#933 |
| 32. | Spartanburg | 74.4% | 30.7%(+43.7)#32 | 37.3%(+37.1)#950 |
| 33. | Ireland | 74.3% | 30.7%(+43.6)#33 | 37.3%(+37.0)#959 |
| 34. | Foxcliff Estates | 73.1% | 30.7%(+42.4)#34 | 37.3%(+35.8)#1,062 |
| 35. | Gwynneville | 72.0% | 30.7%(+41.3)#35 | 37.3%(+34.7)#1,163 |
| 36. | Crows Nest | 72.0% | 30.7%(+41.3)#36 | 37.3%(+34.7)#1,166 |
| 37. | Rockford | 71.6% | 30.7%(+40.9)#37 | 37.3%(+34.3)#1,199 |
| 38. | River Forest | 71.5% | 30.7%(+40.8)#38 | 37.3%(+34.2)#1,209 |
| 39. | Shorewood Forest | 71.2% | 30.7%(+40.5)#39 | 37.3%(+33.9)#1,231 |
| 40. | Homer | 71.0% | 30.7%(+40.3)#40 | 37.3%(+33.7)#1,253 |
| 41. | Winfield | 70.8% | 30.7%(+40.1)#41 | 37.3%(+33.5)#1,266 |
| 42. | Hessen Cassel | 70.0% | 30.7%(+39.3)#42 | 37.3%(+32.7)#1,336 |
| 43. | Buffalo | 69.4% | 30.7%(+38.7)#43 | 37.3%(+32.1)#1,394 |
| 44. | Dune Acres | 69.2% | 30.7%(+38.5)#44 | 37.3%(+31.9)#1,421 |
| 45. | North Crows Nest | 68.9% | 30.7%(+38.2)#45 | 37.3%(+31.6)#1,461 |
| 46. | Pleasant Mills | 68.3% | 30.7%(+37.6)#46 | 37.3%(+31.0)#1,544 |
| 47. | Zionsville | 68.1% | 30.7%(+37.4)#47 | 37.3%(+30.8)#1,556 |
| 48. | Pittsboro | 67.3% | 30.7%(+36.6)#48 | 37.3%(+30.0)#1,646 |
| 49. | Hayden | 67.0% | 30.7%(+36.3)#49 | 37.3%(+29.7)#1,673 |
| 50. | Williams Creek | 66.9% | 30.7%(+36.2)#50 | 37.3%(+29.6)#1,681 |
| 51. | Florence | 66.7% | 30.7%(+36.0)#51 | 37.3%(+29.4)#1,721 |
| 52. | Floyds Knobs | 65.8% | 30.7%(+35.1)#52 | 37.3%(+28.5)#1,841 |
| 53. | Wynnedale | 64.9% | 30.7%(+34.2)#53 | 37.3%(+27.6)#1,955 |
| 54. | Lakes Of The Four Seasons | 64.5% | 30.7%(+33.8)#54 | 37.3%(+27.2)#1,994 |
| 55. | Whitestown | 64.0% | 30.7%(+33.3)#55 | 37.3%(+26.7)#2,068 |
| 56. | Beverly Shores | 64.0% | 30.7%(+33.3)#56 | 37.3%(+26.7)#2,073 |
| 57. | Browns Crossing | 63.9% | 30.7%(+33.2)#57 | 37.3%(+26.6)#2,089 |
| 58. | Haysville | 63.9% | 30.7%(+33.2)#58 | 37.3%(+26.6)#2,091 |
| 59. | Americus | 63.6% | 30.7%(+32.9)#59 | 37.3%(+26.3)#2,127 |
| 60. | Scipio | 63.0% | 30.7%(+32.3)#60 | 37.3%(+25.7)#2,228 |
| 61. | Ulen | 62.9% | 30.7%(+32.2)#61 | 37.3%(+25.6)#2,246 |
| 62. | Bretzville | 61.7% | 30.7%(+31.0)#62 | 37.3%(+24.4)#2,447 |
| 63. | Fishers | 61.0% | 30.7%(+30.3)#63 | 37.3%(+23.7)#2,559 |
| 64. | Carmel | 60.9% | 30.7%(+30.2)#64 | 37.3%(+23.6)#2,581 |
| 65. | Ogden Dunes | 60.8% | 30.7%(+30.1)#65 | 37.3%(+23.5)#2,603 |
| 66. | Mccordsville | 60.5% | 30.7%(+29.8)#66 | 37.3%(+23.2)#2,648 |
| 67. | Celestine | 60.3% | 30.7%(+29.6)#67 | 37.3%(+23.0)#2,687 |
| 68. | South Milford | 60.2% | 30.7%(+29.5)#68 | 37.3%(+22.9)#2,708 |
| 69. | West Middleton | 59.7% | 30.7%(+29.0)#69 | 37.3%(+22.4)#2,802 |
| 70. | St John | 58.9% | 30.7%(+28.2)#70 | 37.3%(+21.6)#2,923 |
| 71. | Marietta | 58.7% | 30.7%(+28.0)#71 | 37.3%(+21.4)#2,968 |
| 72. | Greenville | 58.6% | 30.7%(+27.9)#72 | 37.3%(+21.3)#2,979 |
| 73. | Spring Hill | 58.3% | 30.7%(+27.6)#73 | 37.3%(+21.0)#3,034 |
| 74. | Tecumseh | 58.1% | 30.7%(+27.4)#74 | 37.3%(+20.8)#3,059 |
| 75. | Coalmont | 58.1% | 30.7%(+27.4)#75 | 37.3%(+20.8)#3,066 |
| 76. | Westfield | 57.4% | 30.7%(+26.7)#76 | 37.3%(+20.1)#3,164 |
| 77. | Newbern | 57.4% | 30.7%(+26.7)#77 | 37.3%(+20.1)#3,178 |
| 78. | Wall Lake | 56.6% | 30.7%(+25.9)#78 | 37.3%(+19.3)#3,318 |
| 79. | Granger | 56.5% | 30.7%(+25.8)#79 | 37.3%(+19.2)#3,321 |
| 80. | Long Beach | 56.5% | 30.7%(+25.8)#80 | 37.3%(+19.2)#3,335 |
| 81. | Mineral Springs | 56.5% | 30.7%(+25.8)#81 | 37.3%(+19.2)#3,337 |
| 82. | Eden | 56.1% | 30.7%(+25.4)#82 | 37.3%(+18.8)#3,411 |
| 83. | Marshfield | 56.0% | 30.7%(+25.3)#83 | 37.3%(+18.7)#3,426 |
| 84. | Aberdeen | 55.6% | 30.7%(+24.9)#84 | 37.3%(+18.3)#3,492 |
| 85. | Lake Dalecarlia | 55.5% | 30.7%(+24.8)#85 | 37.3%(+18.2)#3,513 |
| 86. | Tri Lakes | 55.5% | 30.7%(+24.8)#86 | 37.3%(+18.2)#3,514 |
| 87. | Lizton | 55.3% | 30.7%(+24.6)#87 | 37.3%(+18.0)#3,554 |
| 88. | Otter Lake | 54.8% | 30.7%(+24.1)#88 | 37.3%(+17.5)#3,659 |
| 89. | Pulaski | 54.5% | 30.7%(+23.8)#89 | 37.3%(+17.2)#3,720 |
| 90. | Poland | 54.0% | 30.7%(+23.3)#90 | 37.3%(+16.7)#3,822 |
| 91. | Solsberry | 53.8% | 30.7%(+23.1)#91 | 37.3%(+16.5)#3,858 |
| 92. | Georgetown | 53.5% | 30.7%(+22.8)#92 | 37.3%(+16.2)#3,907 |
| 93. | Bowling Green | 53.4% | 30.7%(+22.7)#93 | 37.3%(+16.1)#3,941 |
| 94. | Bargersville | 53.3% | 30.7%(+22.6)#94 | 37.3%(+16.0)#3,956 |
| 95. | Bright | 53.0% | 30.7%(+22.3)#95 | 37.3%(+15.7)#4,009 |
| 96. | Galena | 53.0% | 30.7%(+22.3)#96 | 37.3%(+15.7)#4,016 |
| 97. | Woodlawn Heights | 52.6% | 30.7%(+21.9)#97 | 37.3%(+15.3)#4,106 |
| 98. | Hidden Valley | 52.4% | 30.7%(+21.7)#98 | 37.3%(+15.1)#4,143 |
| 99. | Bridgeton | 52.2% | 30.7%(+21.5)#99 | 37.3%(+14.9)#4,217 |
| 100. | Laud | 52.1% | 30.7%(+21.4)#100 | 37.3%(+14.8)#4,242 |
Common Questions
What are the Top 10 Cities with the Highest Percentage of Households with Income Above $100,000 in Indiana?
Top 10 Cities with the Highest Percentage of Households with Income Above $100,000 in Indiana are:
#1
100.0%
#2
100.0%
#3
100.0%
#4
87.1%
#5
81.9%
#6
77.4%
#7
75.6%
#8
72.0%
#9
71.5%
#10
71.2%
What city has the Highest Percentage of Households with Income Above $100,000 in Indiana?
Raglesville has the Highest Percentage of Households with Income Above $100,000 in Indiana with 100.0%.
What is the Percentage of Households with Income Above $100,000 in the State of Indiana?
Percentage of Households with Income Above $100,000 in Indiana is 30.7%.
What is the Percentage of Households with Income Above $100,000 in the United States?
Percentage of Households with Income Above $100,000 in the United States is 37.3%.