Wabash, IN
Wabash Map
Wabash Overview
10,417
TOTAL POPULATION
5,189
MALE POPULATION
5,228
FEMALE POPULATION
99.25
MALES / 100 FEMALES
100.75
FEMALES / 100 MALES
41.0
MEDIAN AGE
2.7
AVG FAMILY SIZE
2.2
AVG HOUSEHOLD SIZE
$30,366
PER CAPITA INCOME
$68,333
AVG FAMILY INCOME
$51,127
AVG HOUSEHOLD INCOME
29.1%
WAGE / INCOME GAP [ % ]
70.9¢/ $1
WAGE / INCOME GAP [ $ ]
$9,400
FAMILY INCOME DEFICIT
0.44
INEQUALITY / GINI INDEX
4,893
LABOR FORCE [ PEOPLE ]
58.9%
PERCENT IN LABOR FORCE
4.2%
UNEMPLOYMENT RATE
Wabash Zip Codes
Wabash Area Codes
Race in Wabash
The most populous races in Wabash are White / Caucasian (9,932 | 95.3%), Hispanic or Latino (424 | 4.1%), and Some other Race (241 | 2.3%).
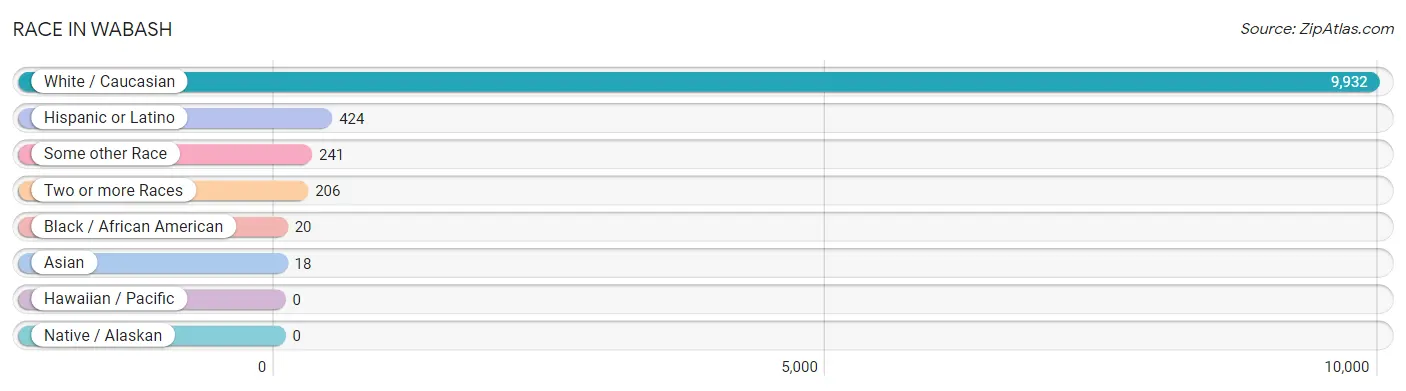
| Race | # Population | % Population |
| Asian | 18 | 0.2% |
| Black / African American | 20 | 0.2% |
| Hawaiian / Pacific | 0 | 0.0% |
| Hispanic or Latino | 424 | 4.1% |
| Native / Alaskan | 0 | 0.0% |
| White / Caucasian | 9,932 | 95.3% |
| Two or more Races | 206 | 2.0% |
| Some other Race | 241 | 2.3% |
| Total | 10,417 | 100.0% |
Ancestry in Wabash
The most populous ancestries reported in Wabash are German (2,478 | 23.8%), English (1,443 | 13.9%), Irish (1,308 | 12.6%), American (801 | 7.7%), and Mexican (266 | 2.5%), together accounting for 60.4% of all Wabash residents.
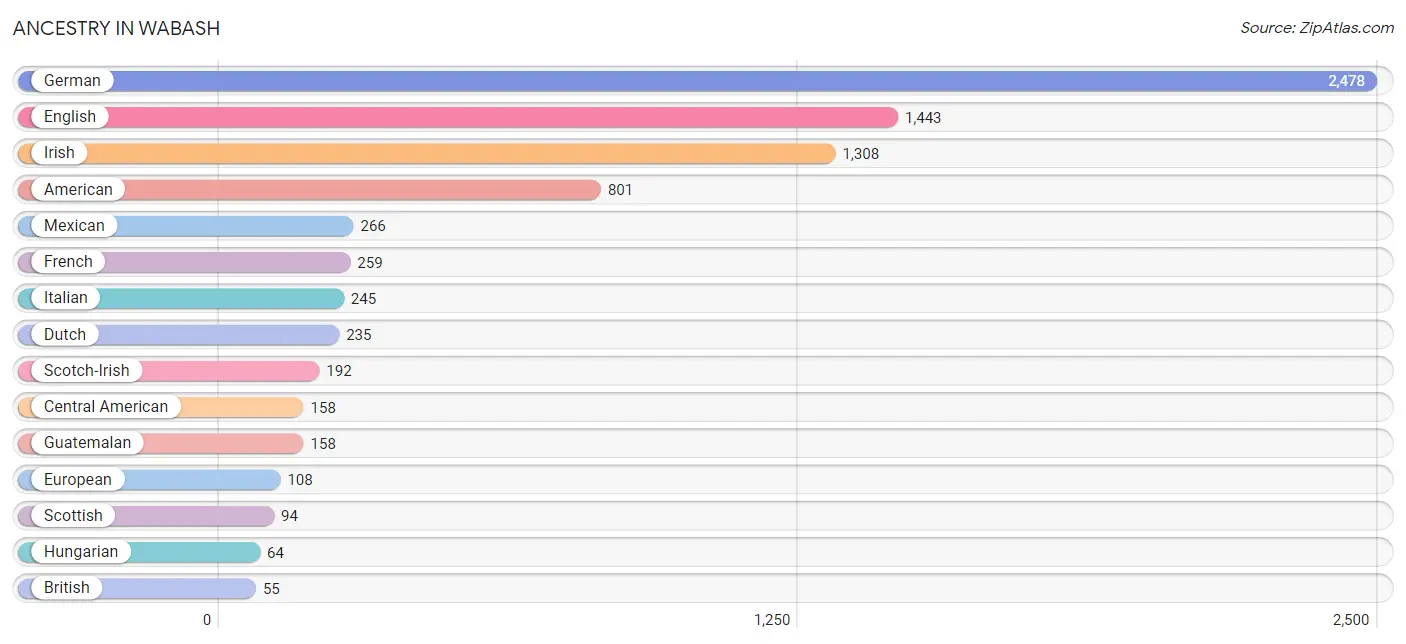
| Ancestry | # Population | % Population |
| African | 9 | 0.1% |
| American | 801 | 7.7% |
| Belgian | 27 | 0.3% |
| Bhutanese | 14 | 0.1% |
| British | 55 | 0.5% |
| Central American | 158 | 1.5% |
| Cherokee | 12 | 0.1% |
| Czechoslovakian | 11 | 0.1% |
| Danish | 9 | 0.1% |
| Dutch | 235 | 2.3% |
| Eastern European | 9 | 0.1% |
| English | 1,443 | 13.9% |
| European | 108 | 1.0% |
| French | 259 | 2.5% |
| German | 2,478 | 23.8% |
| Greek | 35 | 0.3% |
| Guatemalan | 158 | 1.5% |
| Hungarian | 64 | 0.6% |
| Indian (Asian) | 18 | 0.2% |
| Irish | 1,308 | 12.6% |
| Italian | 245 | 2.4% |
| Lithuanian | 12 | 0.1% |
| Mexican | 266 | 2.5% |
| Northern European | 9 | 0.1% |
| Norwegian | 41 | 0.4% |
| Polish | 53 | 0.5% |
| Portuguese | 29 | 0.3% |
| Romanian | 23 | 0.2% |
| Scotch-Irish | 192 | 1.8% |
| Scottish | 94 | 0.9% |
| Slavic | 13 | 0.1% |
| Subsaharan African | 9 | 0.1% |
| Swedish | 37 | 0.4% |
| Swiss | 13 | 0.1% |
| Welsh | 47 | 0.4% | View All 35 Rows |
Immigrants in Wabash
The most numerous immigrant groups reported in Wabash came from Central America (82 | 0.8%), Latin America (82 | 0.8%), Guatemala (63 | 0.6%), Europe (32 | 0.3%), and Germany (22 | 0.2%), together accounting for 2.7% of all Wabash residents.
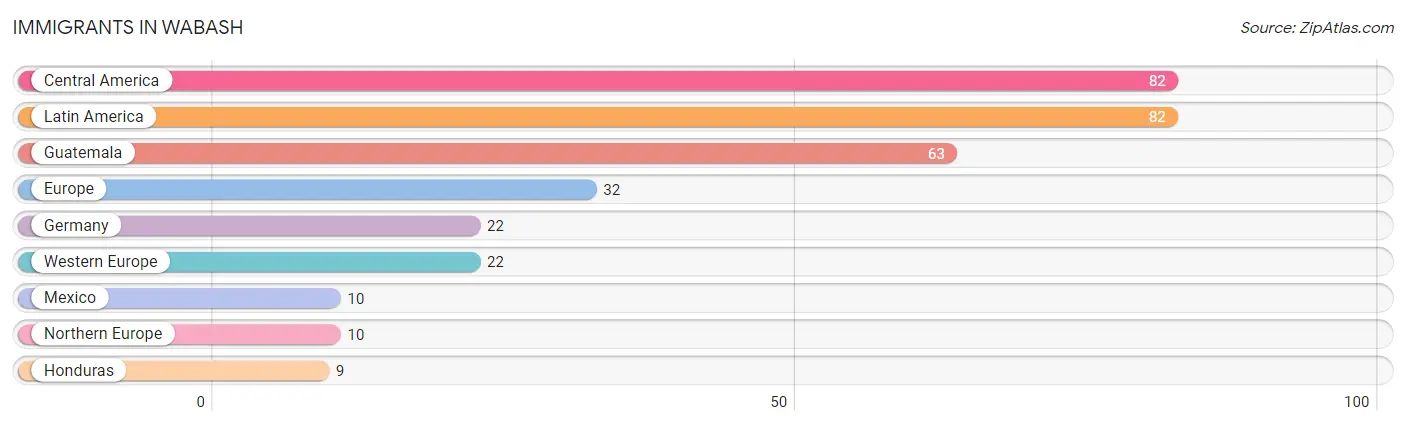
| Immigration Origin | # Population | % Population |
| Central America | 82 | 0.8% |
| Europe | 32 | 0.3% |
| Germany | 22 | 0.2% |
| Guatemala | 63 | 0.6% |
| Honduras | 9 | 0.1% |
| Latin America | 82 | 0.8% |
| Mexico | 10 | 0.1% |
| Northern Europe | 10 | 0.1% |
| Western Europe | 22 | 0.2% | View All 9 Rows |
Sex and Age in Wabash
Sex and Age in Wabash
The most populous age groups in Wabash are 60 to 64 Years (427 | 8.2%) for men and 10 to 14 Years (517 | 9.9%) for women.
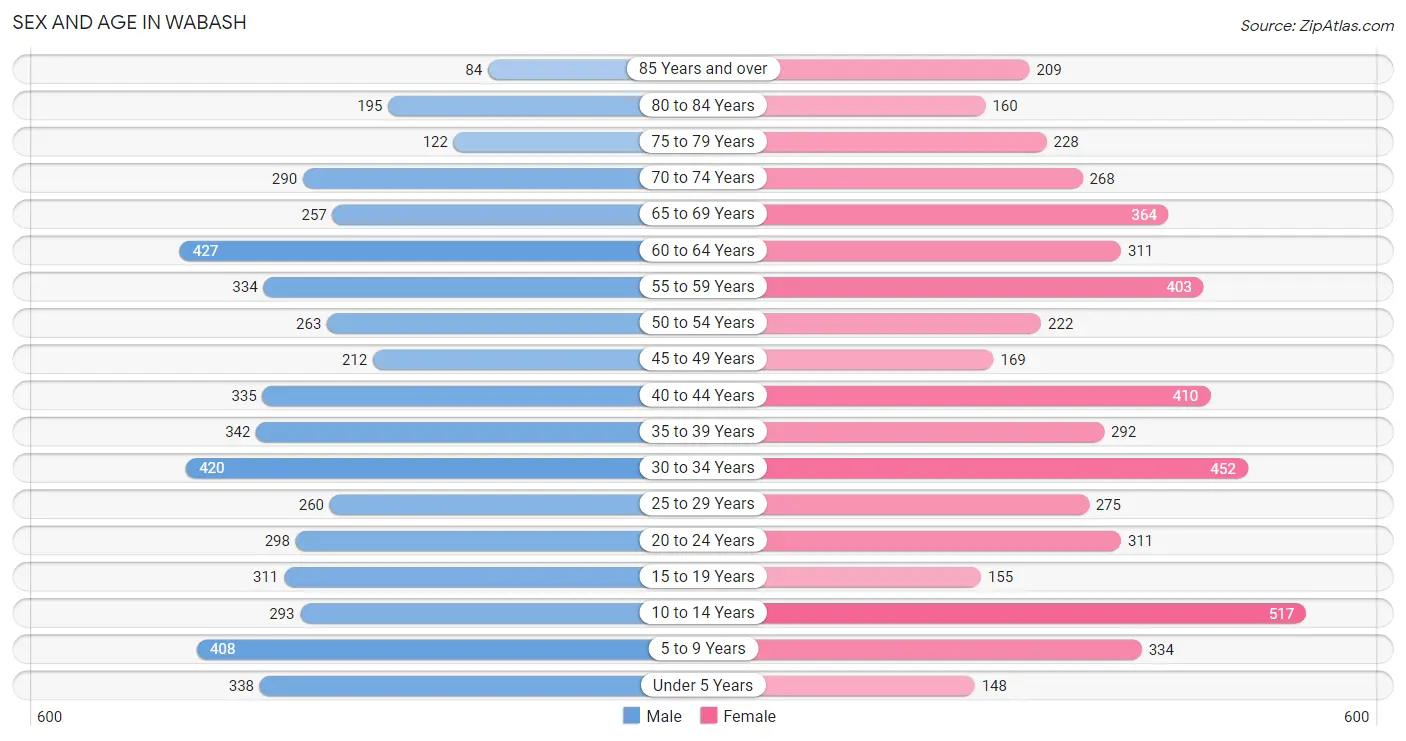
| Age Bracket | Male | Female |
| Under 5 Years | 338 (6.5%) | 148 (2.8%) |
| 5 to 9 Years | 408 (7.9%) | 334 (6.4%) |
| 10 to 14 Years | 293 (5.7%) | 517 (9.9%) |
| 15 to 19 Years | 311 (6.0%) | 155 (3.0%) |
| 20 to 24 Years | 298 (5.7%) | 311 (5.9%) |
| 25 to 29 Years | 260 (5.0%) | 275 (5.3%) |
| 30 to 34 Years | 420 (8.1%) | 452 (8.6%) |
| 35 to 39 Years | 342 (6.6%) | 292 (5.6%) |
| 40 to 44 Years | 335 (6.5%) | 410 (7.8%) |
| 45 to 49 Years | 212 (4.1%) | 169 (3.2%) |
| 50 to 54 Years | 263 (5.1%) | 222 (4.3%) |
| 55 to 59 Years | 334 (6.4%) | 403 (7.7%) |
| 60 to 64 Years | 427 (8.2%) | 311 (5.9%) |
| 65 to 69 Years | 257 (5.0%) | 364 (7.0%) |
| 70 to 74 Years | 290 (5.6%) | 268 (5.1%) |
| 75 to 79 Years | 122 (2.4%) | 228 (4.4%) |
| 80 to 84 Years | 195 (3.8%) | 160 (3.1%) |
| 85 Years and over | 84 (1.6%) | 209 (4.0%) |
| Total | 5,189 (100.0%) | 5,228 (100.0%) |
Families and Households in Wabash
Median Family Size in Wabash
The median family size in Wabash is 2.74 persons per family, with single female/mother families (493 | 17.8%) accounting for the largest median family size of 2.79 persons per family. On the other hand, married-couple families (2,010 | 72.7%) represent the smallest median family size with 2.72 persons per family.
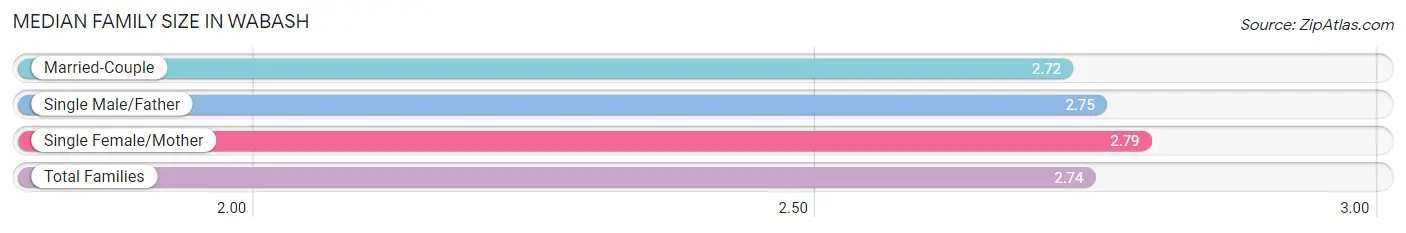
| Family Type | # Families | Family Size |
| Married-Couple | 2,010 (72.7%) | 2.72 |
| Single Male/Father | 261 (9.4%) | 2.75 |
| Single Female/Mother | 493 (17.8%) | 2.79 |
| Total Families | 2,764 (100.0%) | 2.74 |
Median Household Size in Wabash
The median household size in Wabash is 2.22 persons per household, with single male/father households (261 | 5.8%) accounting for the largest median household size of 2.97 persons per household. non-family households (1,747 | 38.7%) represent the smallest median household size with 1.32 persons per household.
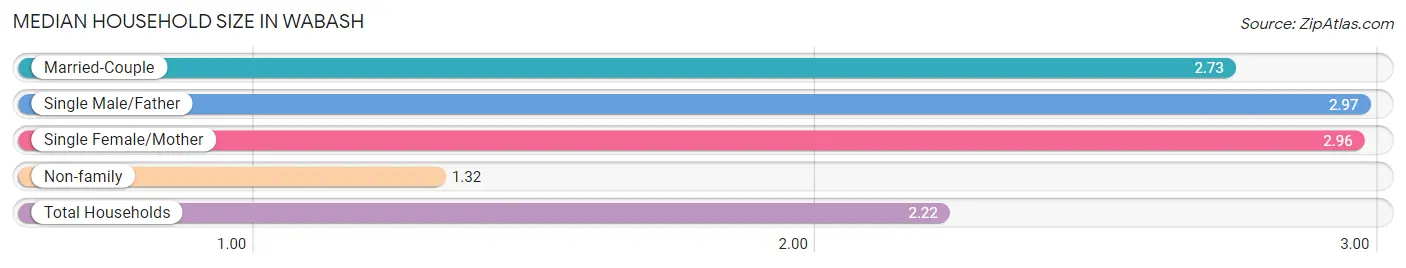
| Household Type | # Households | Household Size |
| Married-Couple | 2,010 (44.6%) | 2.73 |
| Single Male/Father | 261 (5.8%) | 2.97 |
| Single Female/Mother | 493 (10.9%) | 2.96 |
| Non-family | 1,747 (38.7%) | 1.32 |
| Total Households | 4,511 (100.0%) | 2.22 |
Household Size by Marriage Status in Wabash
Out of a total of 4,511 households in Wabash, 2,764 (61.3%) are family households, while 1,747 (38.7%) are nonfamily households. The most numerous type of family households are 2-person households, comprising 1,455, and the most common type of nonfamily households are 1-person households, comprising 1,434.
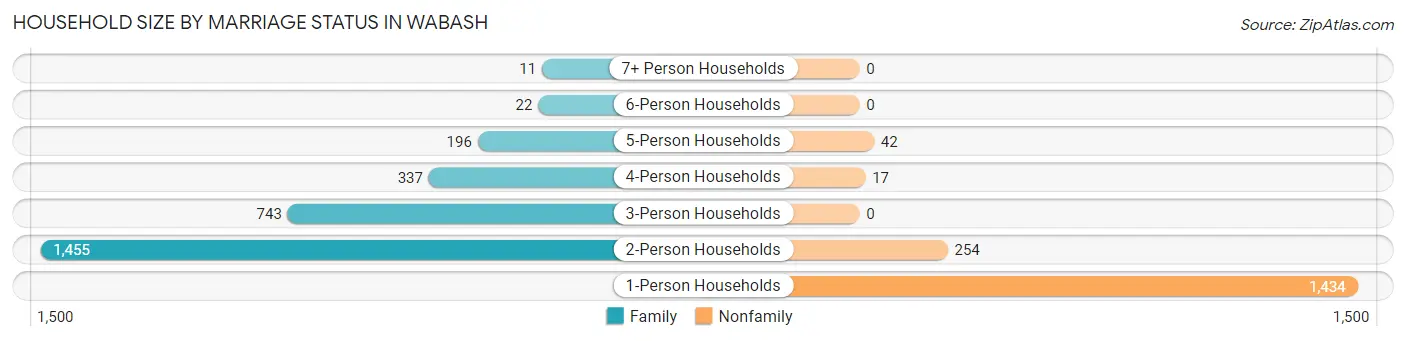
| Household Size | Family Households | Nonfamily Households |
| 1-Person Households | - | 1,434 (31.8%) |
| 2-Person Households | 1,455 (32.3%) | 254 (5.6%) |
| 3-Person Households | 743 (16.5%) | 0 (0.0%) |
| 4-Person Households | 337 (7.5%) | 17 (0.4%) |
| 5-Person Households | 196 (4.3%) | 42 (0.9%) |
| 6-Person Households | 22 (0.5%) | 0 (0.0%) |
| 7+ Person Households | 11 (0.2%) | 0 (0.0%) |
| Total | 2,764 (61.3%) | 1,747 (38.7%) |
Female Fertility in Wabash
Fertility by Age in Wabash
Average fertility rate in Wabash is 34.0 births per 1,000 women. Women in the age bracket of 20 to 34 years have the highest fertility rate with 65.0 births per 1,000 women. Women in the age bracket of 20 to 34 years acount for 94.4% of all women with births.
| Age Bracket | Women with Births | Births / 1,000 Women |
| 15 to 19 years | 0 (0.0%) | 0.0 |
| 20 to 34 years | 67 (94.4%) | 65.0 |
| 35 to 50 years | 4 (5.6%) | 5.0 |
| Total | 71 (100.0%) | 34.0 |
Fertility by Age by Marriage Status in Wabash
14.1% of women with births (71) in Wabash are married. The highest percentage of unmarried women with births falls into 35 to 50 years age bracket with 100.0% of them unmarried at the time of birth, while the lowest percentage of unmarried women with births belong to 20 to 34 years age bracket with 85.1% of them unmarried.

| Age Bracket | Married | Unmarried |
| 15 to 19 years | 0 (0.0%) | 0 (0.0%) |
| 20 to 34 years | 10 (14.9%) | 57 (85.1%) |
| 35 to 50 years | 0 (0.0%) | 4 (100.0%) |
| Total | 10 (14.1%) | 61 (85.9%) |
Fertility by Education in Wabash
| Educational Attainment | Women with Births | Births / 1,000 Women |
| Less than High School | 0 (0.0%) | 0.0 |
| High School Diploma | 48 (67.6%) | 60.0 |
| College or Associate's Degree | 10 (14.1%) | 24.0 |
| Bachelor's Degree | 13 (18.3%) | 37.0 |
| Graduate Degree | 0 (0.0%) | 0.0 |
| Total | 71 (100.0%) | 34.0 |
Fertility by Education by Marriage Status in Wabash
85.9% of women with births in Wabash are unmarried. Women with the educational attainment of college or associate's degree are most likely to be married with 100.0% of them married at childbirth, while women with the educational attainment of high school diploma are least likely to be married with 100.0% of them unmarried at childbirth.
| Educational Attainment | Married | Unmarried |
| Less than High School | 0 (0.0%) | 0 (0.0%) |
| High School Diploma | 0 (0.0%) | 48 (100.0%) |
| College or Associate's Degree | 10 (100.0%) | 0 (0.0%) |
| Bachelor's Degree | 0 (0.0%) | 13 (100.0%) |
| Graduate Degree | 0 (0.0%) | 0 (0.0%) |
| Total | 10 (14.1%) | 61 (85.9%) |
Income in Wabash
Income Overview in Wabash
Per Capita Income in Wabash is $30,366, while median incomes of families and households are $68,333 and $51,127 respectively.
| Characteristic | Number | Measure |
| Per Capita Income | 10,417 | $30,366 |
| Median Family Income | 2,764 | $68,333 |
| Mean Family Income | 2,764 | $79,258 |
| Median Household Income | 4,511 | $51,127 |
| Mean Household Income | 4,511 | $69,844 |
| Income Deficit | 2,764 | $9,400 |
| Wage / Income Gap (%) | 10,417 | 29.11% |
| Wage / Income Gap ($) | 10,417 | 70.89¢ per $1 |
| Gini / Inequality Index | 10,417 | 0.44 |
Earnings by Sex in Wabash
Average Earnings in Wabash are $36,535, $41,975 for men and $29,757 for women, a difference of 29.1%.
| Sex | Number | Average Earnings |
| Male | 2,747 (53.5%) | $41,975 |
| Female | 2,388 (46.5%) | $29,757 |
| Total | 5,135 (100.0%) | $36,535 |
Earnings by Sex by Income Bracket in Wabash
The most common earnings brackets in Wabash are $55,000 to $64,999 for men (356 | 13.0%) and $35,000 to $39,999 for women (298 | 12.5%).
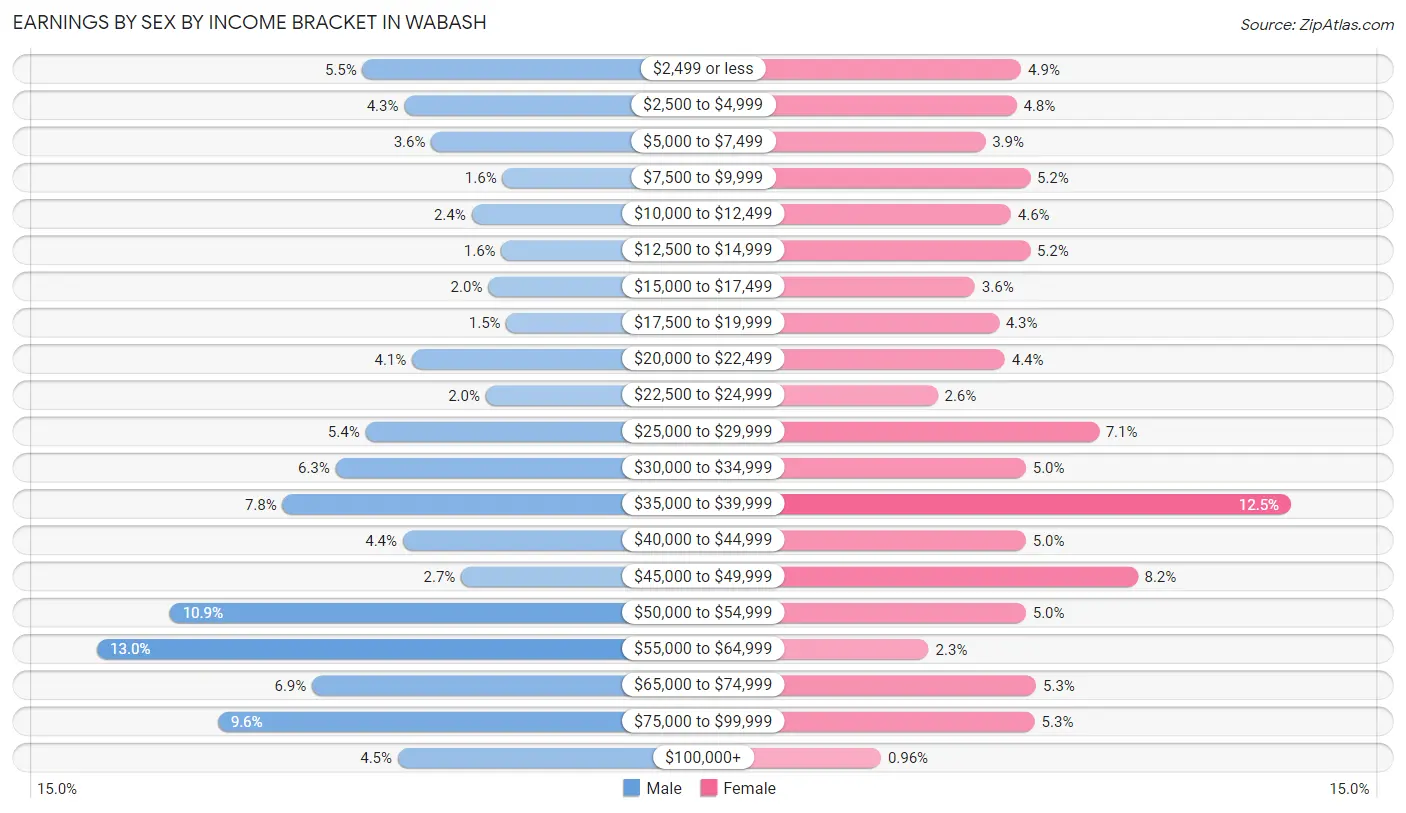
| Income | Male | Female |
| $2,499 or less | 151 (5.5%) | 117 (4.9%) |
| $2,500 to $4,999 | 119 (4.3%) | 114 (4.8%) |
| $5,000 to $7,499 | 98 (3.6%) | 93 (3.9%) |
| $7,500 to $9,999 | 43 (1.6%) | 123 (5.1%) |
| $10,000 to $12,499 | 67 (2.4%) | 110 (4.6%) |
| $12,500 to $14,999 | 44 (1.6%) | 123 (5.1%) |
| $15,000 to $17,499 | 54 (2.0%) | 86 (3.6%) |
| $17,500 to $19,999 | 40 (1.5%) | 102 (4.3%) |
| $20,000 to $22,499 | 113 (4.1%) | 106 (4.4%) |
| $22,500 to $24,999 | 56 (2.0%) | 61 (2.5%) |
| $25,000 to $29,999 | 149 (5.4%) | 169 (7.1%) |
| $30,000 to $34,999 | 172 (6.3%) | 120 (5.0%) |
| $35,000 to $39,999 | 213 (7.7%) | 298 (12.5%) |
| $40,000 to $44,999 | 120 (4.4%) | 120 (5.0%) |
| $45,000 to $49,999 | 75 (2.7%) | 195 (8.2%) |
| $50,000 to $54,999 | 300 (10.9%) | 120 (5.0%) |
| $55,000 to $64,999 | 356 (13.0%) | 55 (2.3%) |
| $65,000 to $74,999 | 190 (6.9%) | 127 (5.3%) |
| $75,000 to $99,999 | 263 (9.6%) | 126 (5.3%) |
| $100,000+ | 124 (4.5%) | 23 (1.0%) |
| Total | 2,747 (100.0%) | 2,388 (100.0%) |
Earnings by Sex by Educational Attainment in Wabash
Average earnings in Wabash are $50,458 for men and $35,495 for women, a difference of 29.6%. Men with an educational attainment of college or associate's degree enjoy the highest average annual earnings of $62,798, while those with less than high school education earn the least with $30,300. Women with an educational attainment of bachelor's degree earn the most with the average annual earnings of $43,837, while those with college or associate's degree education have the smallest earnings of $27,353.
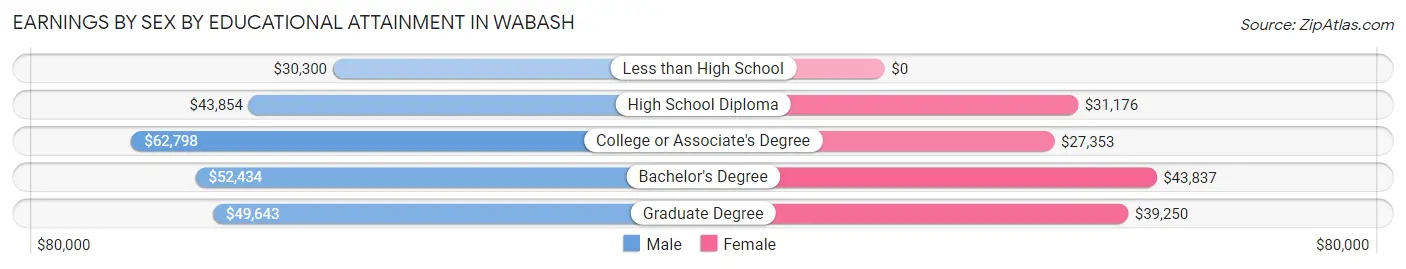
| Educational Attainment | Male Income | Female Income |
| Less than High School | $30,300 | $0 |
| High School Diploma | $43,854 | $31,176 |
| College or Associate's Degree | $62,798 | $27,353 |
| Bachelor's Degree | $52,434 | $43,837 |
| Graduate Degree | $49,643 | $39,250 |
| Total | $50,458 | $35,495 |
Family Income in Wabash
Family Income Brackets in Wabash
According to the Wabash family income data, there are 517 families falling into the $100,000 to $149,999 income range, which is the most common income bracket and makes up 18.7% of all families. Conversely, the $10,000 to $14,999 income bracket is the least frequent group with only 36 families (1.3%) belonging to this category.
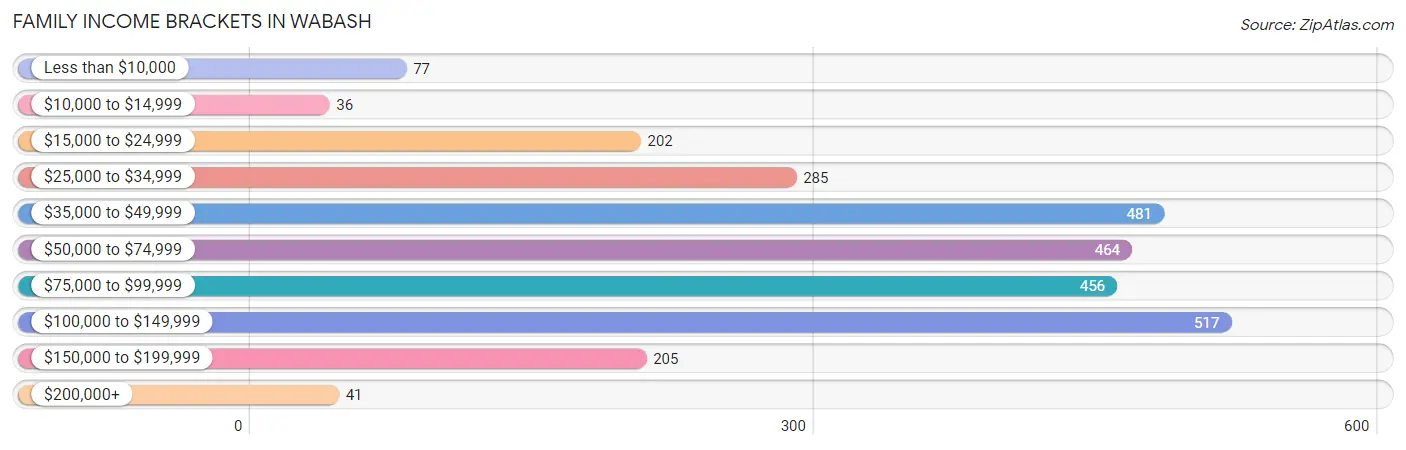
| Income Bracket | # Families | % Families |
| Less than $10,000 | 77 | 2.8% |
| $10,000 to $14,999 | 36 | 1.3% |
| $15,000 to $24,999 | 202 | 7.3% |
| $25,000 to $34,999 | 285 | 10.3% |
| $35,000 to $49,999 | 481 | 17.4% |
| $50,000 to $74,999 | 464 | 16.8% |
| $75,000 to $99,999 | 456 | 16.5% |
| $100,000 to $149,999 | 517 | 18.7% |
| $150,000 to $199,999 | 205 | 7.4% |
| $200,000+ | 41 | 1.5% |
Family Income by Famaliy Size in Wabash
4-person families (326 | 11.8%) account for the highest median family income in Wabash with $101,250 per family, while 2-person families (1,506 | 54.5%) have the highest median income of $29,304 per family member.

| Income Bracket | # Families | Median Income |
| 2-Person Families | 1,506 (54.5%) | $58,607 |
| 3-Person Families | 749 (27.1%) | $53,229 |
| 4-Person Families | 326 (11.8%) | $101,250 |
| 5-Person Families | 150 (5.4%) | $95,278 |
| 6-Person Families | 27 (1.0%) | $81,181 |
| 7+ Person Families | 6 (0.2%) | $0 |
| Total | 2,764 (100.0%) | $68,333 |
Family Income by Number of Earners in Wabash
The median family income in Wabash is $68,333, with families comprising 3+ earners (124) having the highest median family income of $95,833, while families with 1 earner (862) have the lowest median family income of $38,908, accounting for 4.5% and 31.2% of families, respectively.
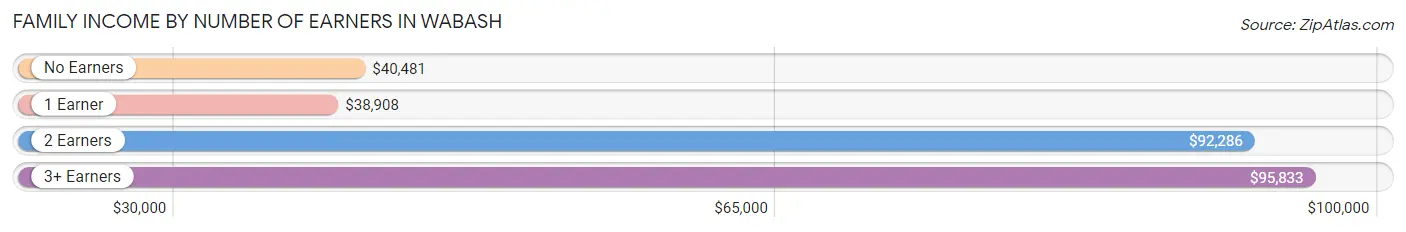
| Number of Earners | # Families | Median Income |
| No Earners | 610 (22.1%) | $40,481 |
| 1 Earner | 862 (31.2%) | $38,908 |
| 2 Earners | 1,168 (42.3%) | $92,286 |
| 3+ Earners | 124 (4.5%) | $95,833 |
| Total | 2,764 (100.0%) | $68,333 |
Household Income in Wabash
Household Income Brackets in Wabash
With 862 households falling in the category, the $35,000 to $49,999 income range is the most frequent in Wabash, accounting for 19.1% of all households. In contrast, only 68 households (1.5%) fall into the $200,000+ income bracket, making it the least populous group.
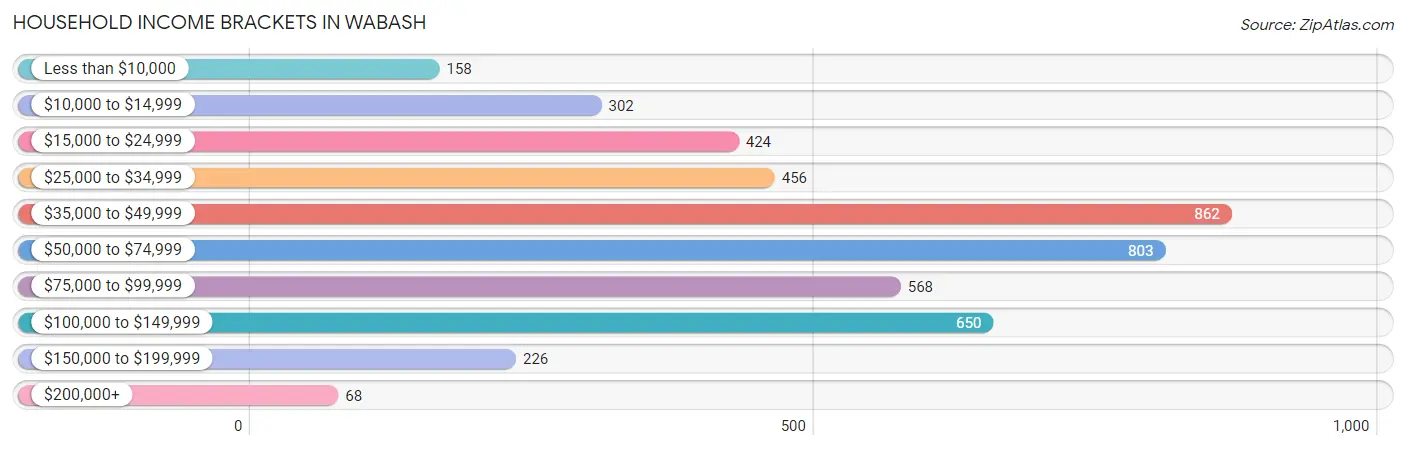
| Income Bracket | # Households | % Households |
| Less than $10,000 | 158 | 3.5% |
| $10,000 to $14,999 | 302 | 6.7% |
| $15,000 to $24,999 | 424 | 9.4% |
| $25,000 to $34,999 | 456 | 10.1% |
| $35,000 to $49,999 | 862 | 19.1% |
| $50,000 to $74,999 | 803 | 17.8% |
| $75,000 to $99,999 | 568 | 12.6% |
| $100,000 to $149,999 | 650 | 14.4% |
| $150,000 to $199,999 | 226 | 5.0% |
| $200,000+ | 68 | 1.5% |
Household Income by Householder Age in Wabash
The median household income in Wabash is $51,127, with the highest median household income of $57,917 found in the 45 to 64 years age bracket for the primary householder. A total of 1,357 households (30.1%) fall into this category. Meanwhile, the 65+ years age bracket for the primary householder has the lowest median household income of $45,696, with 1,259 households (27.9%) in this group.
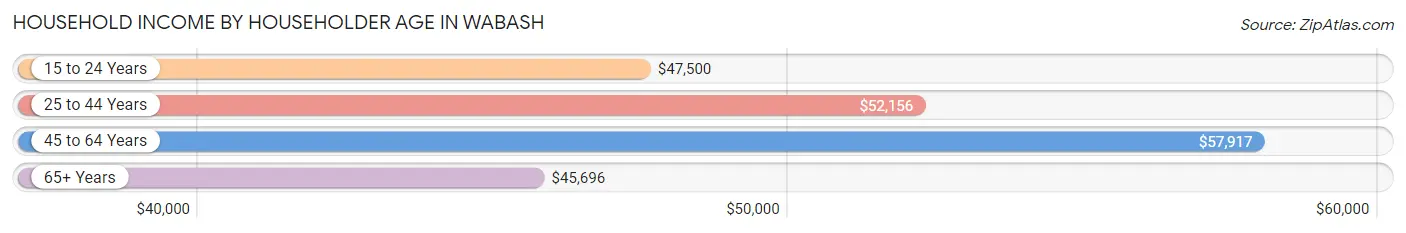
| Income Bracket | # Households | Median Income |
| 15 to 24 Years | 242 (5.4%) | $47,500 |
| 25 to 44 Years | 1,653 (36.6%) | $52,156 |
| 45 to 64 Years | 1,357 (30.1%) | $57,917 |
| 65+ Years | 1,259 (27.9%) | $45,696 |
| Total | 4,511 (100.0%) | $51,127 |
Poverty in Wabash
Income Below Poverty by Sex and Age in Wabash
With 10.1% poverty level for males and 13.5% for females among the residents of Wabash, 5 year old males and under 5 year old females are the most vulnerable to poverty, with 18 males (42.9%) and 35 females (33.7%) in their respective age groups living below the poverty level.
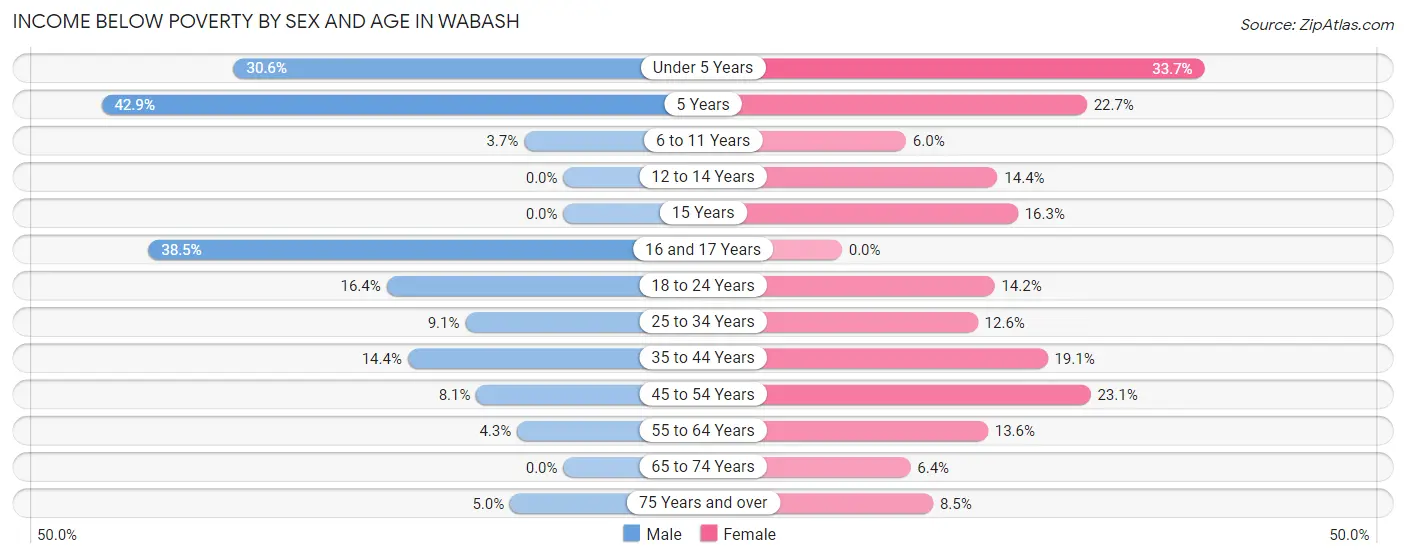
| Age Bracket | Male | Female |
| Under 5 Years | 97 (30.6%) | 35 (33.7%) |
| 5 Years | 18 (42.9%) | 25 (22.7%) |
| 6 to 11 Years | 16 (3.6%) | 25 (5.9%) |
| 12 to 14 Years | 0 (0.0%) | 41 (14.4%) |
| 15 Years | 0 (0.0%) | 8 (16.3%) |
| 16 and 17 Years | 62 (38.5%) | 0 (0.0%) |
| 18 to 24 Years | 63 (16.4%) | 54 (14.2%) |
| 25 to 34 Years | 59 (9.1%) | 89 (12.6%) |
| 35 to 44 Years | 95 (14.4%) | 134 (19.1%) |
| 45 to 54 Years | 37 (8.1%) | 84 (23.1%) |
| 55 to 64 Years | 32 (4.3%) | 92 (13.6%) |
| 65 to 74 Years | 0 (0.0%) | 40 (6.4%) |
| 75 Years and over | 16 (5.0%) | 44 (8.5%) |
| Total | 495 (10.1%) | 671 (13.5%) |
Income Above Poverty by Sex and Age in Wabash
According to the poverty statistics in Wabash, males aged 12 to 14 years and females aged 16 and 17 years are the age groups that are most secure financially, with 100.0% of males and 100.0% of females in these age groups living above the poverty line.
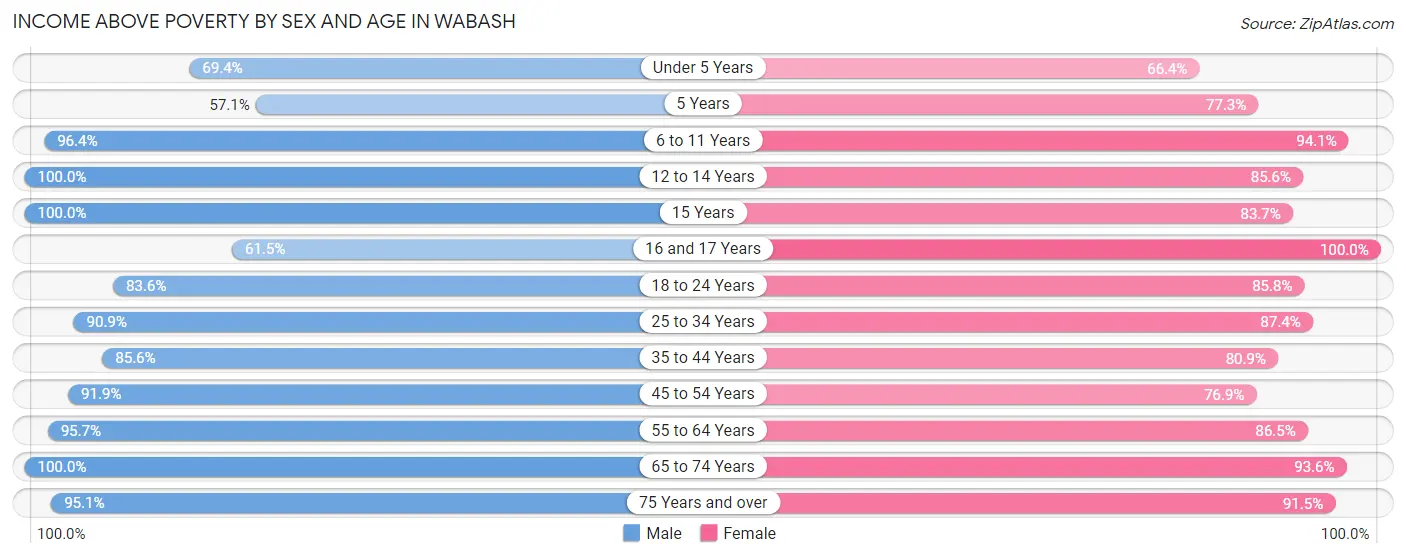
| Age Bracket | Male | Female |
| Under 5 Years | 220 (69.4%) | 69 (66.3%) |
| 5 Years | 24 (57.1%) | 85 (77.3%) |
| 6 to 11 Years | 422 (96.4%) | 395 (94.1%) |
| 12 to 14 Years | 168 (100.0%) | 243 (85.6%) |
| 15 Years | 22 (100.0%) | 41 (83.7%) |
| 16 and 17 Years | 99 (61.5%) | 36 (100.0%) |
| 18 to 24 Years | 321 (83.6%) | 327 (85.8%) |
| 25 to 34 Years | 589 (90.9%) | 617 (87.4%) |
| 35 to 44 Years | 563 (85.6%) | 568 (80.9%) |
| 45 to 54 Years | 421 (91.9%) | 280 (76.9%) |
| 55 to 64 Years | 712 (95.7%) | 587 (86.5%) |
| 65 to 74 Years | 547 (100.0%) | 589 (93.6%) |
| 75 Years and over | 307 (95.1%) | 476 (91.5%) |
| Total | 4,415 (89.9%) | 4,313 (86.5%) |
Income Below Poverty Among Married-Couple Families in Wabash
The poverty statistics for married-couple families in Wabash show that 2.9% or 58 of the total 2,010 families live below the poverty line. Families with 1 or 2 children have the highest poverty rate of 6.9%, comprising of 41 families. On the other hand, families with 3 or 4 children have the lowest poverty rate of 0.0%, which includes 0 families.
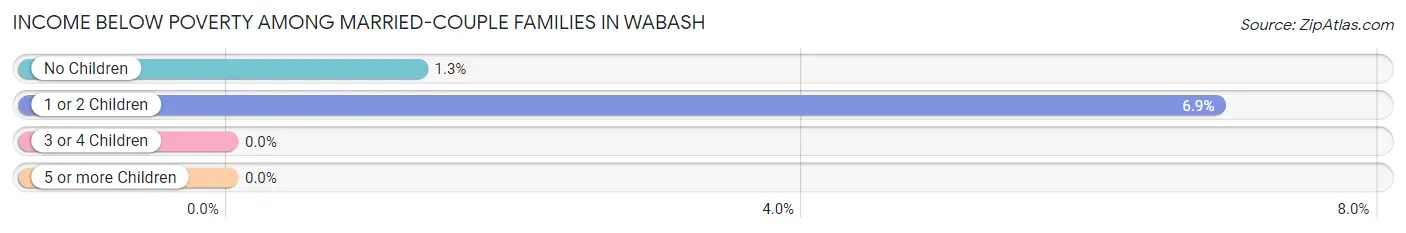
| Children | Above Poverty | Below Poverty |
| No Children | 1,272 (98.7%) | 17 (1.3%) |
| 1 or 2 Children | 555 (93.1%) | 41 (6.9%) |
| 3 or 4 Children | 119 (100.0%) | 0 (0.0%) |
| 5 or more Children | 6 (100.0%) | 0 (0.0%) |
| Total | 1,952 (97.1%) | 58 (2.9%) |
Income Below Poverty Among Single-Parent Households in Wabash
According to the poverty data in Wabash, 24.9% or 65 single-father households and 22.3% or 110 single-mother households are living below the poverty line. Among single-father households, those with 3 or 4 children have the highest poverty rate, with 24 households (100.0%) experiencing poverty. Likewise, among single-mother households, those with 5 or more children have the highest poverty rate, with 5 households (100.0%) falling below the poverty line.
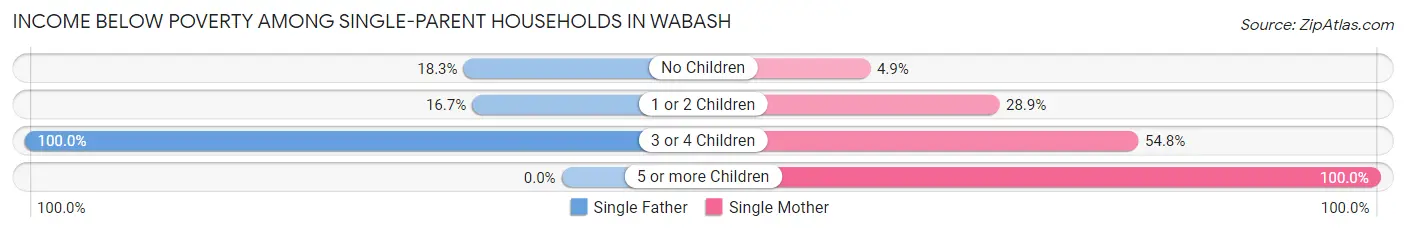
| Children | Single Father | Single Mother |
| No Children | 17 (18.3%) | 9 (4.9%) |
| 1 or 2 Children | 24 (16.7%) | 79 (28.9%) |
| 3 or 4 Children | 24 (100.0%) | 17 (54.8%) |
| 5 or more Children | 0 (0.0%) | 5 (100.0%) |
| Total | 65 (24.9%) | 110 (22.3%) |
Income Below Poverty Among Married-Couple vs Single-Parent Households in Wabash
The poverty data for Wabash shows that 58 of the married-couple family households (2.9%) and 175 of the single-parent households (23.2%) are living below the poverty level. Within the married-couple family households, those with 1 or 2 children have the highest poverty rate, with 41 households (6.9%) falling below the poverty line. Among the single-parent households, those with 5 or more children have the highest poverty rate, with 5 household (100.0%) living below poverty.
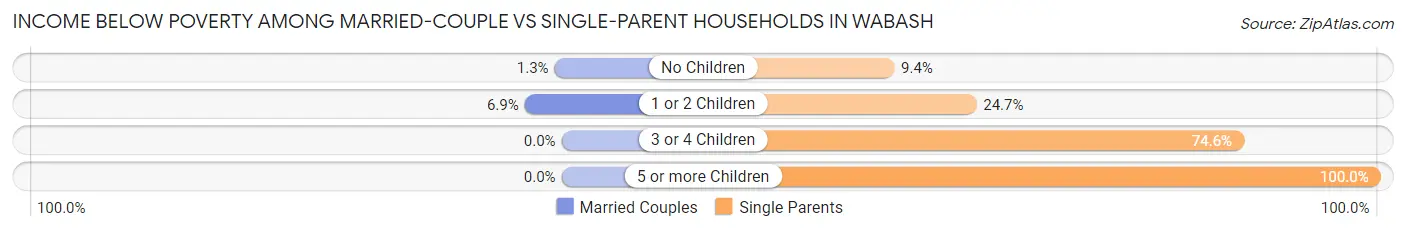
| Children | Married-Couple Families | Single-Parent Households |
| No Children | 17 (1.3%) | 26 (9.4%) |
| 1 or 2 Children | 41 (6.9%) | 103 (24.7%) |
| 3 or 4 Children | 0 (0.0%) | 41 (74.6%) |
| 5 or more Children | 0 (0.0%) | 5 (100.0%) |
| Total | 58 (2.9%) | 175 (23.2%) |
Employment Characteristics in Wabash
Employment by Class of Employer in Wabash
Among the 4,574 employed individuals in Wabash, private company employees (3,260 | 71.3%), not-for-profit organizations (484 | 10.6%), and local government employees (315 | 6.9%) make up the most common classes of employment.
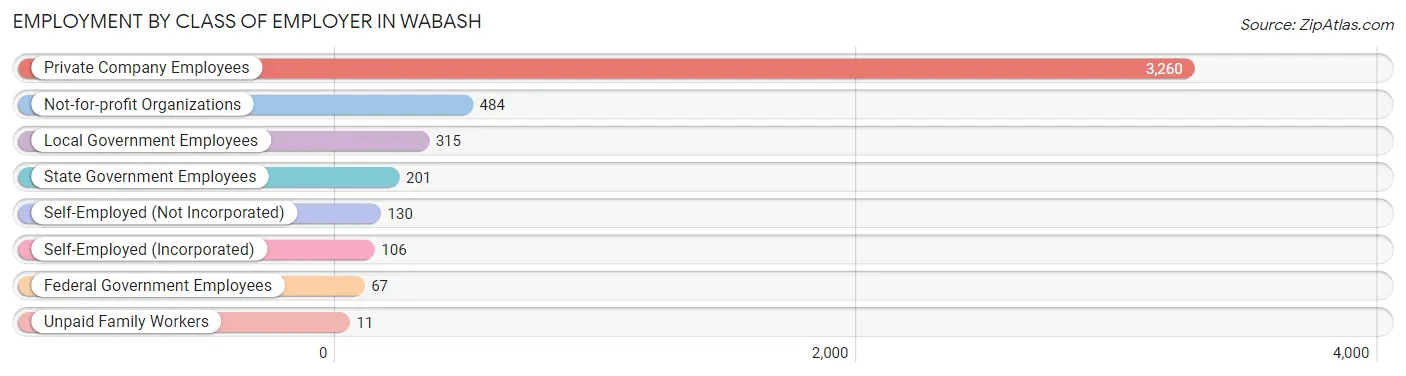
| Employer Class | # Employees | % Employees |
| Private Company Employees | 3,260 | 71.3% |
| Self-Employed (Incorporated) | 106 | 2.3% |
| Self-Employed (Not Incorporated) | 130 | 2.8% |
| Not-for-profit Organizations | 484 | 10.6% |
| Local Government Employees | 315 | 6.9% |
| State Government Employees | 201 | 4.4% |
| Federal Government Employees | 67 | 1.5% |
| Unpaid Family Workers | 11 | 0.2% |
| Total | 4,574 | 100.0% |
Employment Status by Age in Wabash
According to the labor force statistics for Wabash, out of the total population over 16 years of age (8,308), 58.9% or 4,893 individuals are in the labor force, with 4.2% or 206 of them unemployed. The age group with the highest labor force participation rate is 25 to 29 years, with 90.3% or 483 individuals in the labor force. Within the labor force, the 35 to 44 years age range has the highest percentage of unemployed individuals, with 6.9% or 77 of them being unemployed.
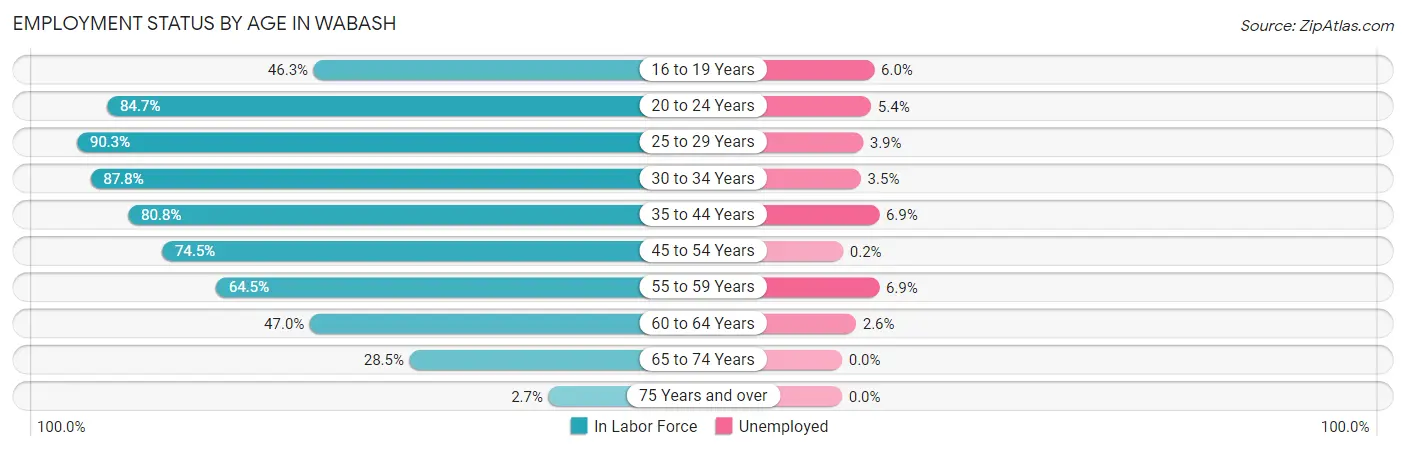
| Age Bracket | In Labor Force | Unemployed |
| 16 to 19 Years | 183 (46.3%) | 11 (6.0%) |
| 20 to 24 Years | 516 (84.7%) | 28 (5.4%) |
| 25 to 29 Years | 483 (90.3%) | 19 (3.9%) |
| 30 to 34 Years | 766 (87.8%) | 27 (3.5%) |
| 35 to 44 Years | 1,114 (80.8%) | 77 (6.9%) |
| 45 to 54 Years | 645 (74.5%) | 1 (0.2%) |
| 55 to 59 Years | 475 (64.5%) | 33 (6.9%) |
| 60 to 64 Years | 347 (47.0%) | 9 (2.6%) |
| 65 to 74 Years | 336 (28.5%) | 0 (0.0%) |
| 75 Years and over | 27 (2.7%) | 0 (0.0%) |
| Total | 4,893 (58.9%) | 206 (4.2%) |
Employment Status by Educational Attainment in Wabash
According to labor force statistics for Wabash, 74.7% of individuals (3,830) out of the total population between 25 and 64 years of age (5,127) are in the labor force, with 4.3% or 165 of them being unemployed. The group with the highest labor force participation rate are those with the educational attainment of bachelor's degree or higher, with 84.5% or 1,008 individuals in the labor force. Within the labor force, individuals with less than high school education have the highest percentage of unemployment, with 10.3% or 31 of them being unemployed.
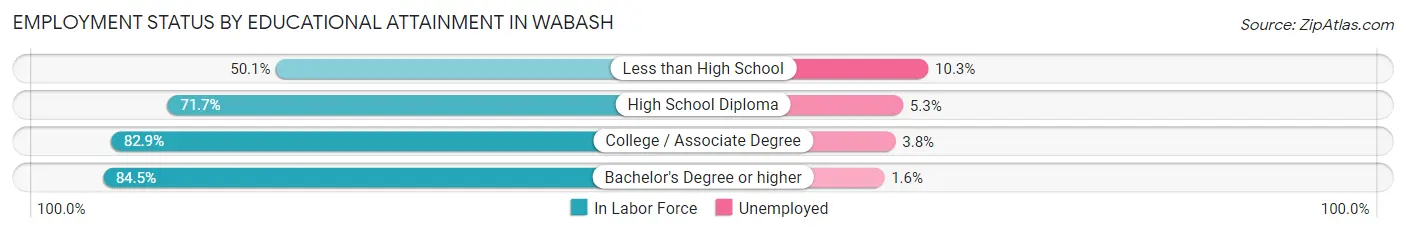
| Educational Attainment | In Labor Force | Unemployed |
| Less than High School | 301 (50.1%) | 62 (10.3%) |
| High School Diploma | 1,552 (71.7%) | 115 (5.3%) |
| College / Associate Degree | 968 (82.9%) | 44 (3.8%) |
| Bachelor's Degree or higher | 1,008 (84.5%) | 19 (1.6%) |
| Total | 3,830 (74.7%) | 220 (4.3%) |
Employment Occupations by Sex in Wabash
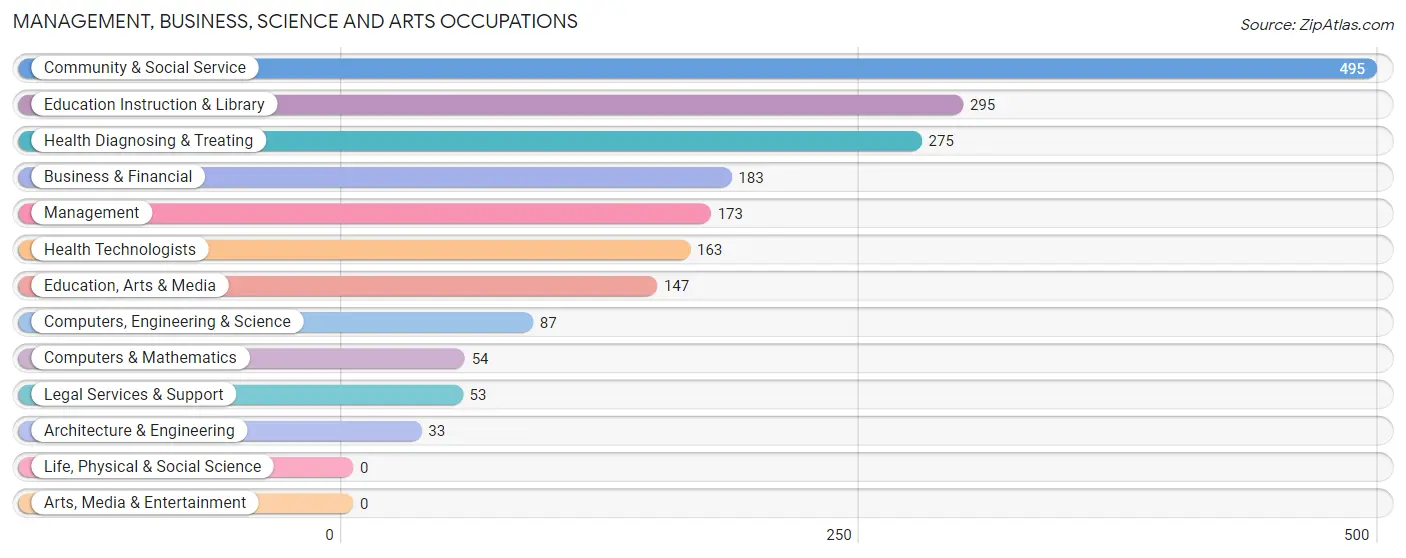
Management, Business, Science and Arts Occupations
The most common Management, Business, Science and Arts occupations in Wabash are Community & Social Service (495 | 10.6%), Education Instruction & Library (295 | 6.3%), Health Diagnosing & Treating (275 | 5.9%), Business & Financial (183 | 3.9%), and Management (173 | 3.7%).
Management, Business, Science and Arts Occupations by Sex
Within the Management, Business, Science and Arts occupations in Wabash, the most male-oriented occupations are Computers, Engineering & Science (100.0%), Computers & Mathematics (100.0%), and Architecture & Engineering (100.0%), while the most female-oriented occupations are Legal Services & Support (100.0%), Health Technologists (95.1%), and Education Instruction & Library (89.5%).
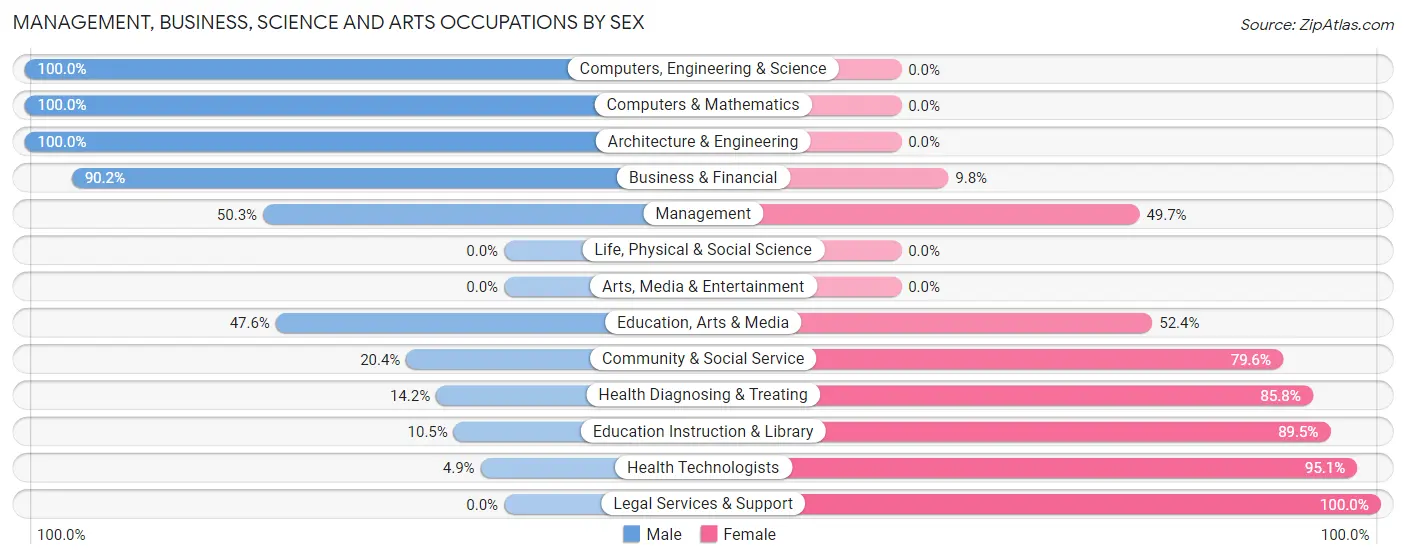
| Occupation | Male | Female |
| Management | 87 (50.3%) | 86 (49.7%) |
| Business & Financial | 165 (90.2%) | 18 (9.8%) |
| Computers, Engineering & Science | 87 (100.0%) | 0 (0.0%) |
| Computers & Mathematics | 54 (100.0%) | 0 (0.0%) |
| Architecture & Engineering | 33 (100.0%) | 0 (0.0%) |
| Life, Physical & Social Science | 0 (0.0%) | 0 (0.0%) |
| Community & Social Service | 101 (20.4%) | 394 (79.6%) |
| Education, Arts & Media | 70 (47.6%) | 77 (52.4%) |
| Legal Services & Support | 0 (0.0%) | 53 (100.0%) |
| Education Instruction & Library | 31 (10.5%) | 264 (89.5%) |
| Arts, Media & Entertainment | 0 (0.0%) | 0 (0.0%) |
| Health Diagnosing & Treating | 39 (14.2%) | 236 (85.8%) |
| Health Technologists | 8 (4.9%) | 155 (95.1%) |
| Total (Category) | 479 (39.5%) | 734 (60.5%) |
| Total (Overall) | 2,508 (53.5%) | 2,179 (46.5%) |
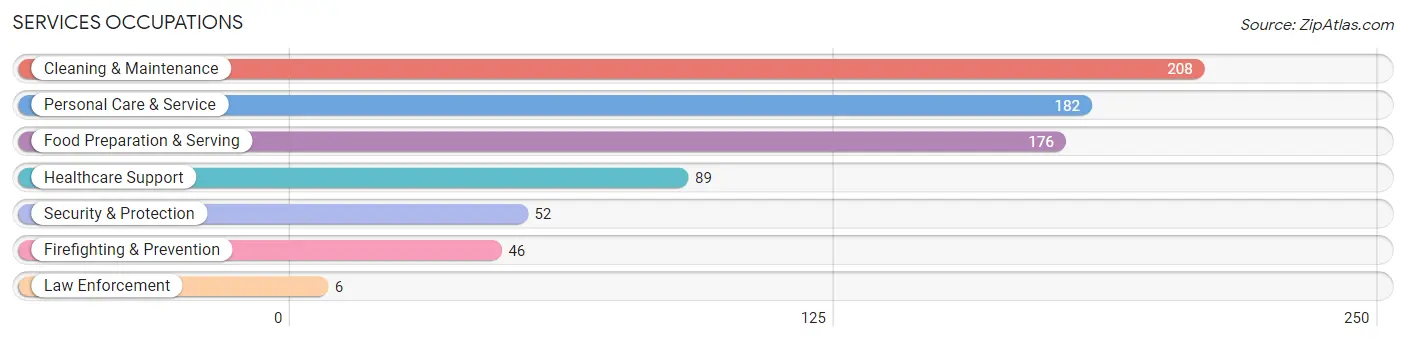
Services Occupations
The most common Services occupations in Wabash are Cleaning & Maintenance (208 | 4.4%), Personal Care & Service (182 | 3.9%), Food Preparation & Serving (176 | 3.8%), Healthcare Support (89 | 1.9%), and Security & Protection (52 | 1.1%).
Services Occupations by Sex
Within the Services occupations in Wabash, the most male-oriented occupations are Security & Protection (100.0%), Firefighting & Prevention (100.0%), and Law Enforcement (100.0%), while the most female-oriented occupations are Personal Care & Service (85.7%), Healthcare Support (78.6%), and Food Preparation & Serving (47.7%).
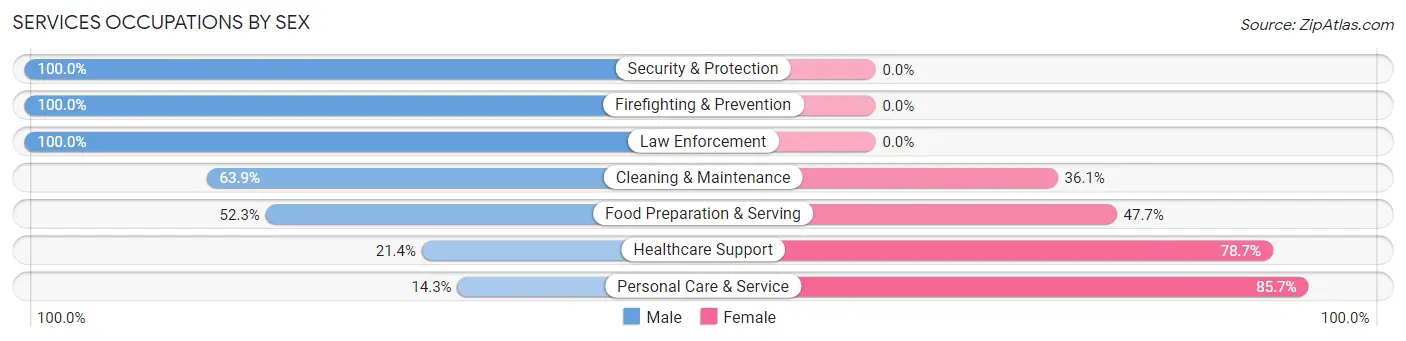
| Occupation | Male | Female |
| Healthcare Support | 19 (21.3%) | 70 (78.6%) |
| Security & Protection | 52 (100.0%) | 0 (0.0%) |
| Firefighting & Prevention | 46 (100.0%) | 0 (0.0%) |
| Law Enforcement | 6 (100.0%) | 0 (0.0%) |
| Food Preparation & Serving | 92 (52.3%) | 84 (47.7%) |
| Cleaning & Maintenance | 133 (63.9%) | 75 (36.1%) |
| Personal Care & Service | 26 (14.3%) | 156 (85.7%) |
| Total (Category) | 322 (45.5%) | 385 (54.5%) |
| Total (Overall) | 2,508 (53.5%) | 2,179 (46.5%) |
Sales and Office Occupations
The most common Sales and Office occupations in Wabash are Office & Administration (528 | 11.3%), and Sales & Related (459 | 9.8%).

Sales and Office Occupations by Sex
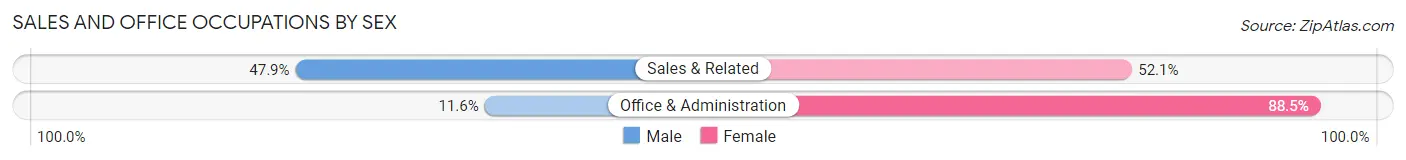
| Occupation | Male | Female |
| Sales & Related | 220 (47.9%) | 239 (52.1%) |
| Office & Administration | 61 (11.6%) | 467 (88.4%) |
| Total (Category) | 281 (28.5%) | 706 (71.5%) |
| Total (Overall) | 2,508 (53.5%) | 2,179 (46.5%) |
Natural Resources, Construction and Maintenance Occupations
The most common Natural Resources, Construction and Maintenance occupations in Wabash are Installation, Maintenance & Repair (245 | 5.2%), and Construction & Extraction (171 | 3.6%).
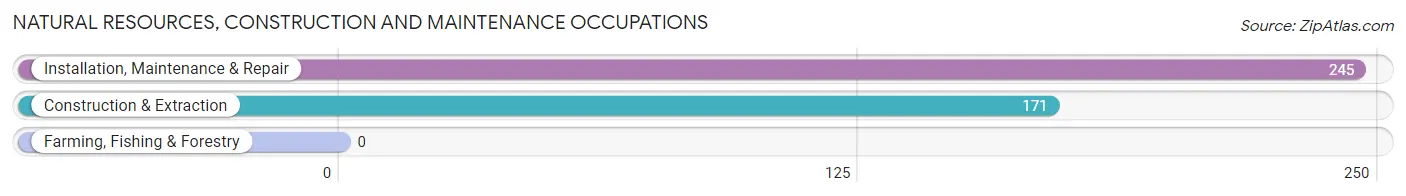
Natural Resources, Construction and Maintenance Occupations by Sex
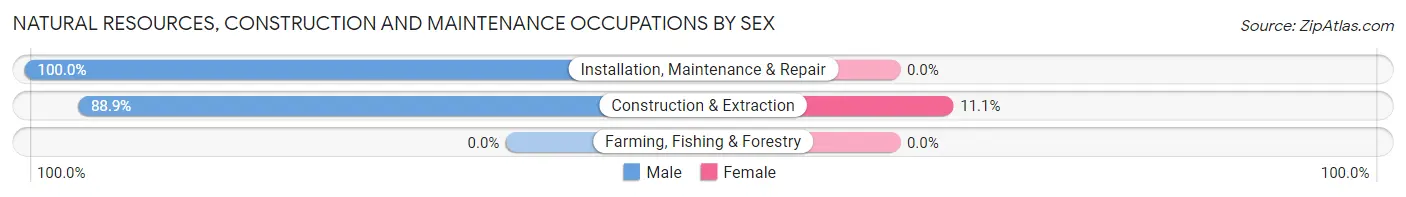
| Occupation | Male | Female |
| Farming, Fishing & Forestry | 0 (0.0%) | 0 (0.0%) |
| Construction & Extraction | 152 (88.9%) | 19 (11.1%) |
| Installation, Maintenance & Repair | 245 (100.0%) | 0 (0.0%) |
| Total (Category) | 397 (95.4%) | 19 (4.6%) |
| Total (Overall) | 2,508 (53.5%) | 2,179 (46.5%) |
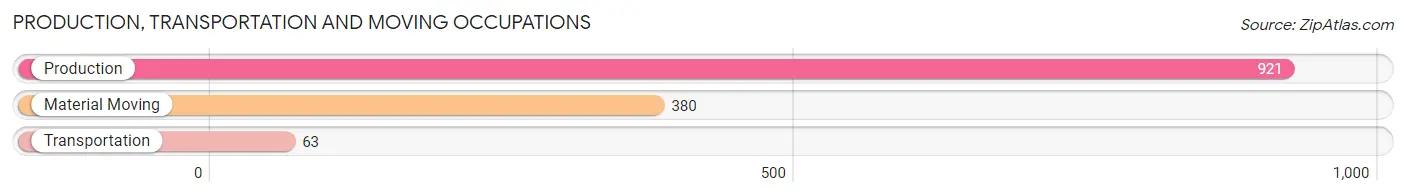
Production, Transportation and Moving Occupations
The most common Production, Transportation and Moving occupations in Wabash are Production (921 | 19.7%), Material Moving (380 | 8.1%), and Transportation (63 | 1.3%).
Production, Transportation and Moving Occupations by Sex

| Occupation | Male | Female |
| Production | 668 (72.5%) | 253 (27.5%) |
| Transportation | 63 (100.0%) | 0 (0.0%) |
| Material Moving | 298 (78.4%) | 82 (21.6%) |
| Total (Category) | 1,029 (75.4%) | 335 (24.6%) |
| Total (Overall) | 2,508 (53.5%) | 2,179 (46.5%) |
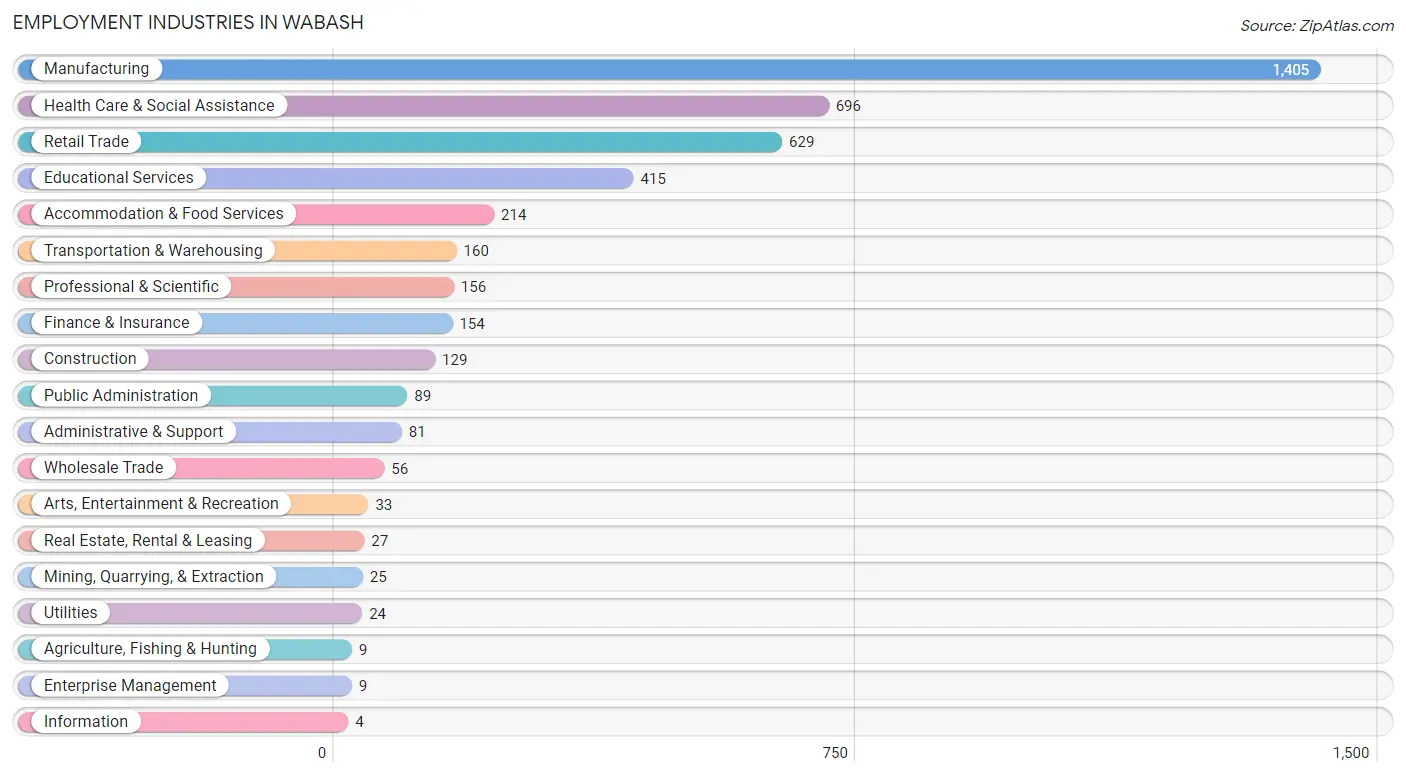
Employment Industries by Sex in Wabash
Employment Industries in Wabash
The major employment industries in Wabash include Manufacturing (1,405 | 30.0%), Health Care & Social Assistance (696 | 14.8%), Retail Trade (629 | 13.4%), Educational Services (415 | 8.8%), and Accommodation & Food Services (214 | 4.6%).
Employment Industries by Sex in Wabash
The Wabash industries that see more men than women are Agriculture, Fishing & Hunting (100.0%), Construction (100.0%), and Public Administration (77.5%), whereas the industries that tend to have a higher number of women are Information (100.0%), Real Estate, Rental & Leasing (100.0%), and Enterprise Management (100.0%).
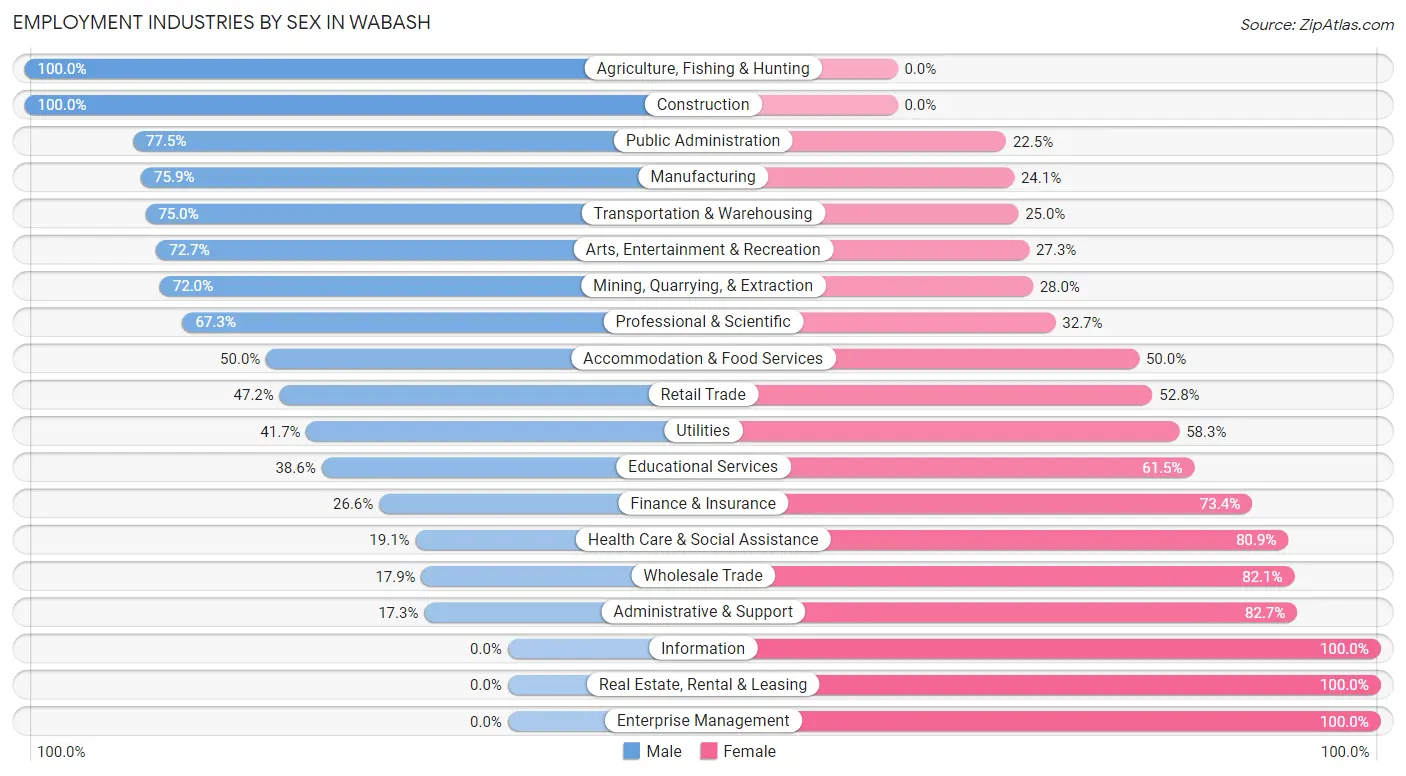
| Industry | Male | Female |
| Agriculture, Fishing & Hunting | 9 (100.0%) | 0 (0.0%) |
| Mining, Quarrying, & Extraction | 18 (72.0%) | 7 (28.0%) |
| Construction | 129 (100.0%) | 0 (0.0%) |
| Manufacturing | 1,066 (75.9%) | 339 (24.1%) |
| Wholesale Trade | 10 (17.9%) | 46 (82.1%) |
| Retail Trade | 297 (47.2%) | 332 (52.8%) |
| Transportation & Warehousing | 120 (75.0%) | 40 (25.0%) |
| Utilities | 10 (41.7%) | 14 (58.3%) |
| Information | 0 (0.0%) | 4 (100.0%) |
| Finance & Insurance | 41 (26.6%) | 113 (73.4%) |
| Real Estate, Rental & Leasing | 0 (0.0%) | 27 (100.0%) |
| Professional & Scientific | 105 (67.3%) | 51 (32.7%) |
| Enterprise Management | 0 (0.0%) | 9 (100.0%) |
| Administrative & Support | 14 (17.3%) | 67 (82.7%) |
| Educational Services | 160 (38.6%) | 255 (61.5%) |
| Health Care & Social Assistance | 133 (19.1%) | 563 (80.9%) |
| Arts, Entertainment & Recreation | 24 (72.7%) | 9 (27.3%) |
| Accommodation & Food Services | 107 (50.0%) | 107 (50.0%) |
| Public Administration | 69 (77.5%) | 20 (22.5%) |
| Total | 2,508 (53.5%) | 2,179 (46.5%) |
Education in Wabash
School Enrollment in Wabash
The most common levels of schooling among the 2,417 students in Wabash are middle school (684 | 28.3%), elementary school (672 | 27.8%), and high school (415 | 17.2%).
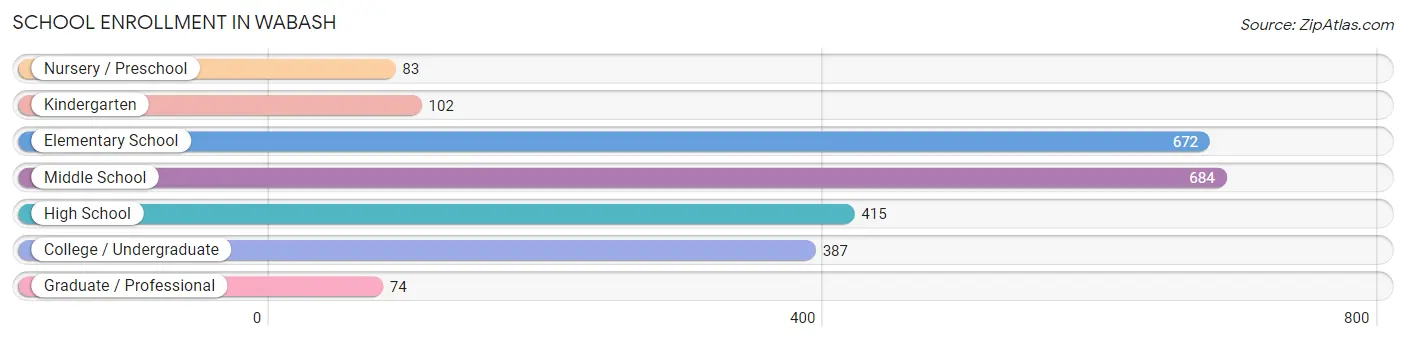
| School Level | # Students | % Students |
| Nursery / Preschool | 83 | 3.4% |
| Kindergarten | 102 | 4.2% |
| Elementary School | 672 | 27.8% |
| Middle School | 684 | 28.3% |
| High School | 415 | 17.2% |
| College / Undergraduate | 387 | 16.0% |
| Graduate / Professional | 74 | 3.1% |
| Total | 2,417 | 100.0% |
School Enrollment by Age by Funding Source in Wabash
Out of a total of 2,417 students who are enrolled in schools in Wabash, 256 (10.6%) attend a private institution, while the remaining 2,161 (89.4%) are enrolled in public schools. The age group of 3 to 4 year olds has the highest likelihood of being enrolled in private schools, with 11 (57.9% in the age bracket) enrolled. Conversely, the age group of 5 to 9 year old has the lowest likelihood of being enrolled in a private school, with 692 (98.0% in the age bracket) attending a public institution.
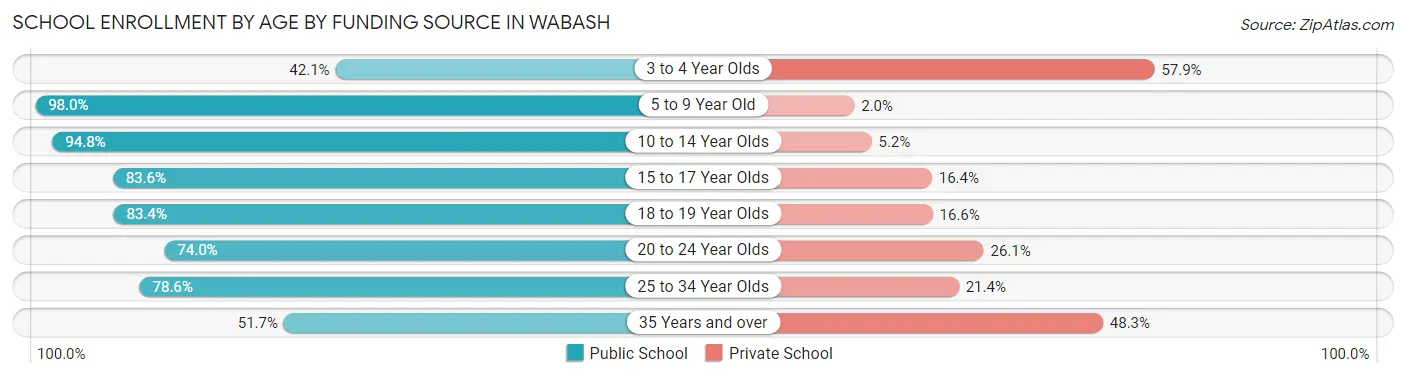
| Age Bracket | Public School | Private School |
| 3 to 4 Year Olds | 8 (42.1%) | 11 (57.9%) |
| 5 to 9 Year Old | 692 (98.0%) | 14 (2.0%) |
| 10 to 14 Year Olds | 768 (94.8%) | 42 (5.2%) |
| 15 to 17 Year Olds | 224 (83.6%) | 44 (16.4%) |
| 18 to 19 Year Olds | 131 (83.4%) | 26 (16.6%) |
| 20 to 24 Year Olds | 88 (74.0%) | 31 (26.1%) |
| 25 to 34 Year Olds | 220 (78.6%) | 60 (21.4%) |
| 35 Years and over | 30 (51.7%) | 28 (48.3%) |
| Total | 2,161 (89.4%) | 256 (10.6%) |
Educational Attainment by Field of Study in Wabash
Education (535 | 28.7%), business (323 | 17.4%), science & technology (307 | 16.5%), liberal arts & history (145 | 7.8%), and social sciences (100 | 5.4%) are the most common fields of study among 1,861 individuals in Wabash who have obtained a bachelor's degree or higher.
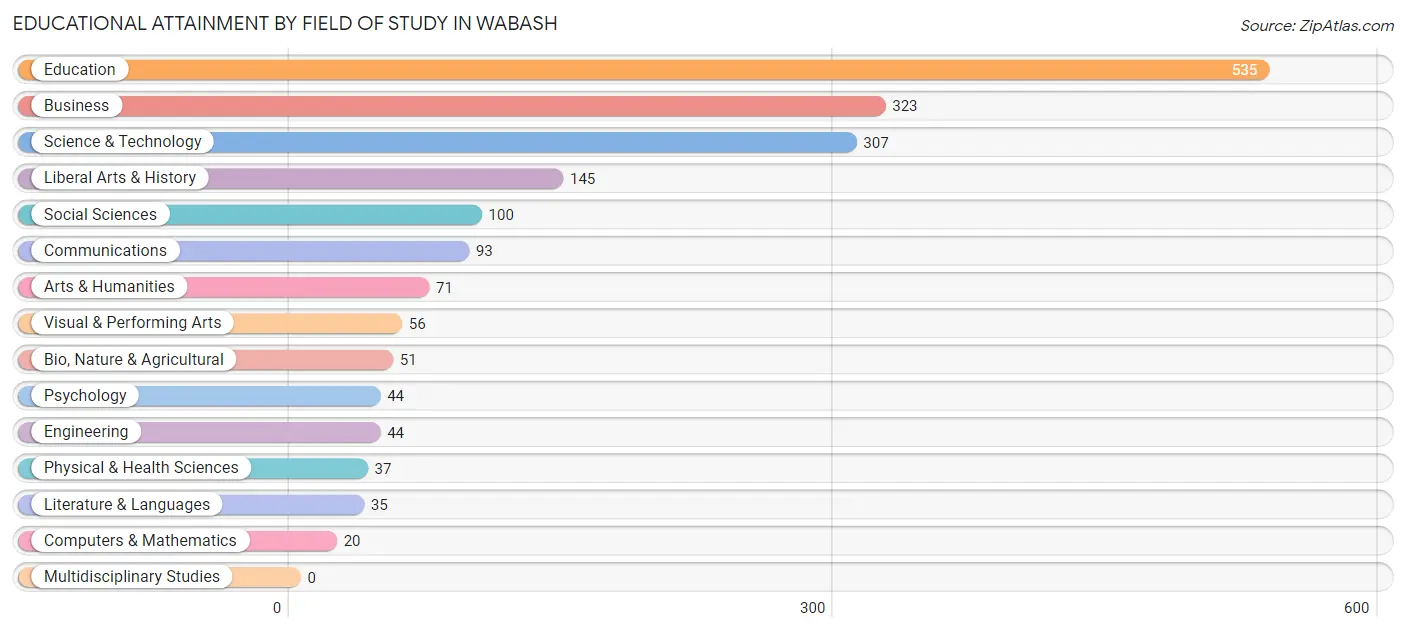
| Field of Study | # Graduates | % Graduates |
| Computers & Mathematics | 20 | 1.1% |
| Bio, Nature & Agricultural | 51 | 2.7% |
| Physical & Health Sciences | 37 | 2.0% |
| Psychology | 44 | 2.4% |
| Social Sciences | 100 | 5.4% |
| Engineering | 44 | 2.4% |
| Multidisciplinary Studies | 0 | 0.0% |
| Science & Technology | 307 | 16.5% |
| Business | 323 | 17.4% |
| Education | 535 | 28.7% |
| Literature & Languages | 35 | 1.9% |
| Liberal Arts & History | 145 | 7.8% |
| Visual & Performing Arts | 56 | 3.0% |
| Communications | 93 | 5.0% |
| Arts & Humanities | 71 | 3.8% |
| Total | 1,861 | 100.0% |
Transportation & Commute in Wabash
Vehicle Availability by Sex in Wabash
The most prevalent vehicle ownership categories in Wabash are males with 2 vehicles (1,121, accounting for 46.2%) and females with 2 vehicles (956, making up 52.4%).

| Vehicles Available | Male | Female |
| No Vehicle | 91 (3.7%) | 57 (2.7%) |
| 1 Vehicle | 552 (22.8%) | 576 (26.9%) |
| 2 Vehicles | 1,121 (46.2%) | 956 (44.7%) |
| 3 Vehicles | 412 (17.0%) | 291 (13.6%) |
| 4 Vehicles | 174 (7.2%) | 228 (10.6%) |
| 5 or more Vehicles | 75 (3.1%) | 33 (1.5%) |
| Total | 2,425 (100.0%) | 2,141 (100.0%) |
Commute Time in Wabash
The most frequently occuring commute durations in Wabash are 5 to 9 minutes (1,579 commuters, 35.0%), 10 to 14 minutes (653 commuters, 14.5%), and 15 to 19 minutes (448 commuters, 9.9%).
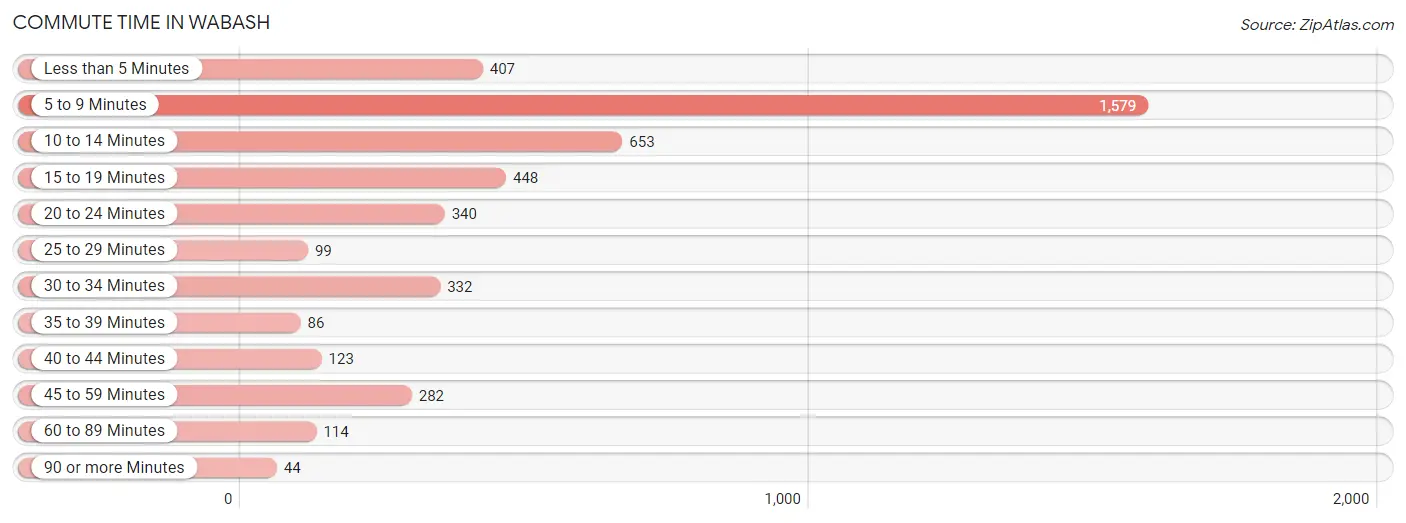
| Commute Time | # Commuters | % Commuters |
| Less than 5 Minutes | 407 | 9.0% |
| 5 to 9 Minutes | 1,579 | 35.0% |
| 10 to 14 Minutes | 653 | 14.5% |
| 15 to 19 Minutes | 448 | 9.9% |
| 20 to 24 Minutes | 340 | 7.5% |
| 25 to 29 Minutes | 99 | 2.2% |
| 30 to 34 Minutes | 332 | 7.4% |
| 35 to 39 Minutes | 86 | 1.9% |
| 40 to 44 Minutes | 123 | 2.7% |
| 45 to 59 Minutes | 282 | 6.3% |
| 60 to 89 Minutes | 114 | 2.5% |
| 90 or more Minutes | 44 | 1.0% |
Commute Time by Sex in Wabash
The most common commute times in Wabash are 5 to 9 minutes (629 commuters, 26.3%) for males and 5 to 9 minutes (950 commuters, 44.9%) for females.
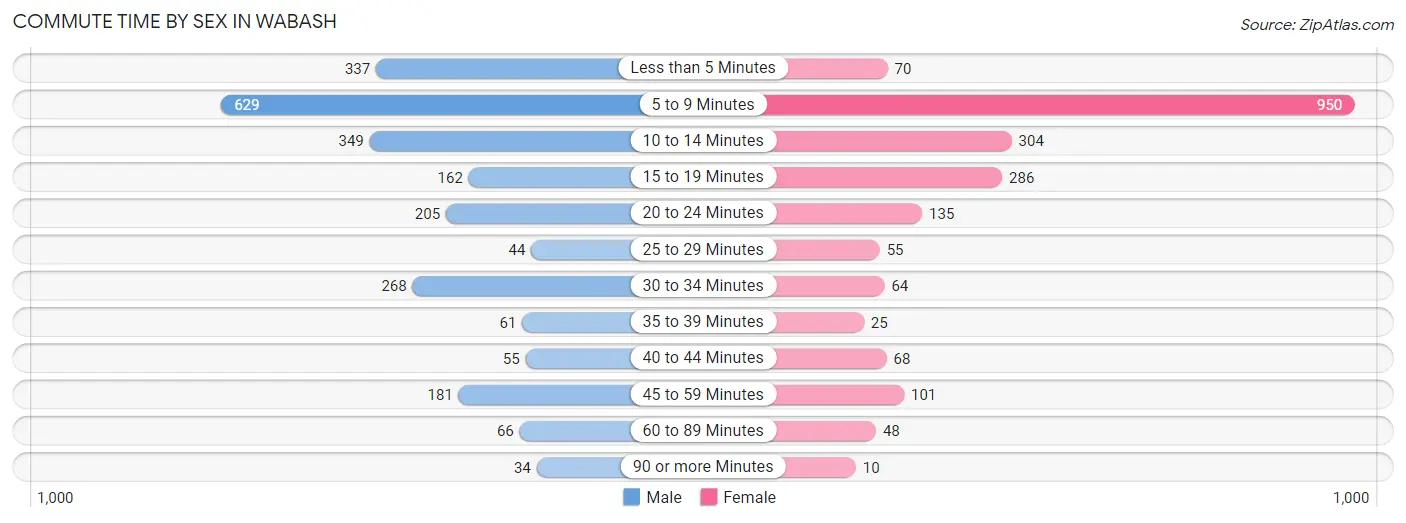
| Commute Time | Male | Female |
| Less than 5 Minutes | 337 (14.1%) | 70 (3.3%) |
| 5 to 9 Minutes | 629 (26.3%) | 950 (44.9%) |
| 10 to 14 Minutes | 349 (14.6%) | 304 (14.4%) |
| 15 to 19 Minutes | 162 (6.8%) | 286 (13.5%) |
| 20 to 24 Minutes | 205 (8.6%) | 135 (6.4%) |
| 25 to 29 Minutes | 44 (1.8%) | 55 (2.6%) |
| 30 to 34 Minutes | 268 (11.2%) | 64 (3.0%) |
| 35 to 39 Minutes | 61 (2.5%) | 25 (1.2%) |
| 40 to 44 Minutes | 55 (2.3%) | 68 (3.2%) |
| 45 to 59 Minutes | 181 (7.6%) | 101 (4.8%) |
| 60 to 89 Minutes | 66 (2.8%) | 48 (2.3%) |
| 90 or more Minutes | 34 (1.4%) | 10 (0.5%) |
Time of Departure to Work by Sex in Wabash
The most frequent times of departure to work in Wabash are 6:30 AM to 6:59 AM (399, 16.7%) for males and 7:30 AM to 7:59 AM (463, 21.9%) for females.
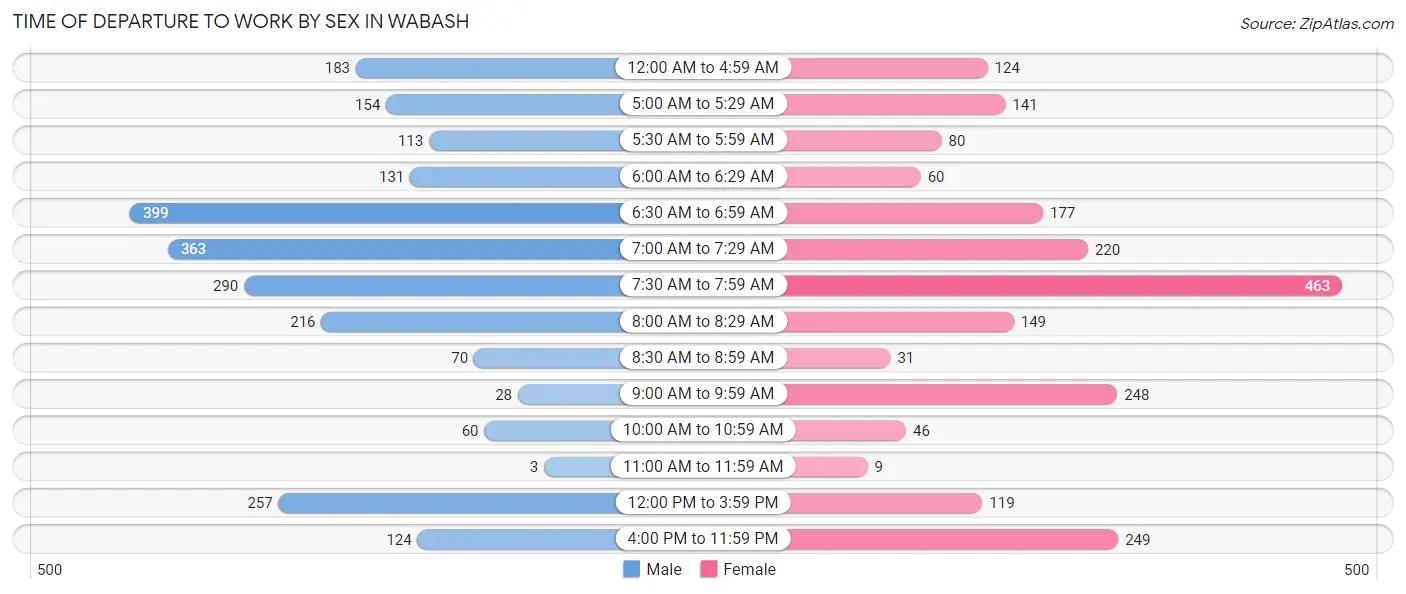
| Time of Departure | Male | Female |
| 12:00 AM to 4:59 AM | 183 (7.6%) | 124 (5.9%) |
| 5:00 AM to 5:29 AM | 154 (6.4%) | 141 (6.7%) |
| 5:30 AM to 5:59 AM | 113 (4.7%) | 80 (3.8%) |
| 6:00 AM to 6:29 AM | 131 (5.5%) | 60 (2.8%) |
| 6:30 AM to 6:59 AM | 399 (16.7%) | 177 (8.4%) |
| 7:00 AM to 7:29 AM | 363 (15.2%) | 220 (10.4%) |
| 7:30 AM to 7:59 AM | 290 (12.1%) | 463 (21.9%) |
| 8:00 AM to 8:29 AM | 216 (9.0%) | 149 (7.0%) |
| 8:30 AM to 8:59 AM | 70 (2.9%) | 31 (1.5%) |
| 9:00 AM to 9:59 AM | 28 (1.2%) | 248 (11.7%) |
| 10:00 AM to 10:59 AM | 60 (2.5%) | 46 (2.2%) |
| 11:00 AM to 11:59 AM | 3 (0.1%) | 9 (0.4%) |
| 12:00 PM to 3:59 PM | 257 (10.7%) | 119 (5.6%) |
| 4:00 PM to 11:59 PM | 124 (5.2%) | 249 (11.8%) |
| Total | 2,391 (100.0%) | 2,116 (100.0%) |
Housing Occupancy in Wabash
Occupancy by Ownership in Wabash
Of the total 4,511 dwellings in Wabash, owner-occupied units account for 3,245 (71.9%), while renter-occupied units make up 1,266 (28.1%).
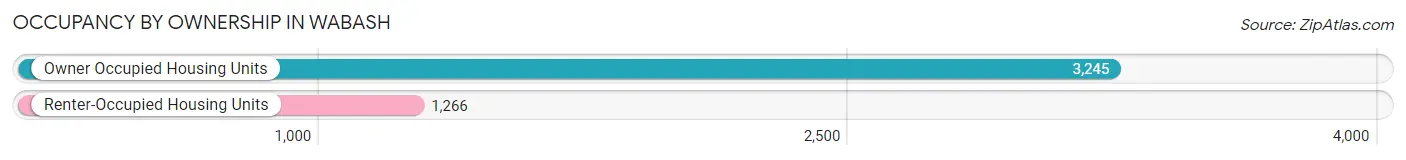
| Occupancy | # Housing Units | % Housing Units |
| Owner Occupied Housing Units | 3,245 | 71.9% |
| Renter-Occupied Housing Units | 1,266 | 28.1% |
| Total Occupied Housing Units | 4,511 | 100.0% |
Occupancy by Household Size in Wabash
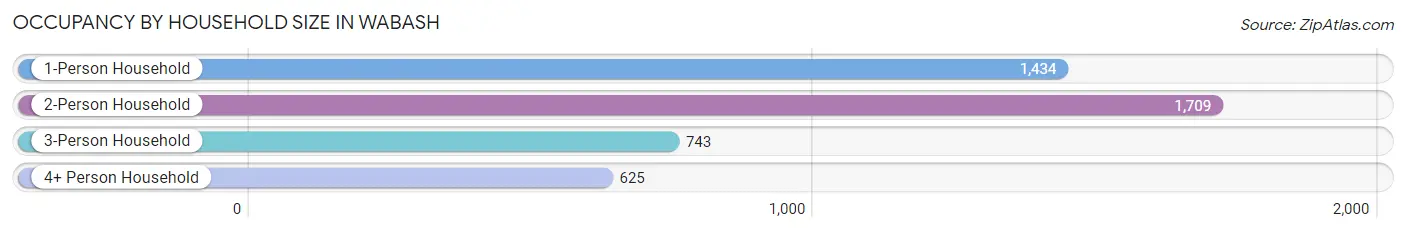
| Household Size | # Housing Units | % Housing Units |
| 1-Person Household | 1,434 | 31.8% |
| 2-Person Household | 1,709 | 37.9% |
| 3-Person Household | 743 | 16.5% |
| 4+ Person Household | 625 | 13.9% |
| Total Housing Units | 4,511 | 100.0% |
Occupancy by Ownership by Household Size in Wabash

| Household Size | Owner-occupied | Renter-occupied |
| 1-Person Household | 819 (57.1%) | 615 (42.9%) |
| 2-Person Household | 1,394 (81.6%) | 315 (18.4%) |
| 3-Person Household | 539 (72.5%) | 204 (27.5%) |
| 4+ Person Household | 493 (78.9%) | 132 (21.1%) |
| Total Housing Units | 3,245 (71.9%) | 1,266 (28.1%) |
Occupancy by Educational Attainment in Wabash
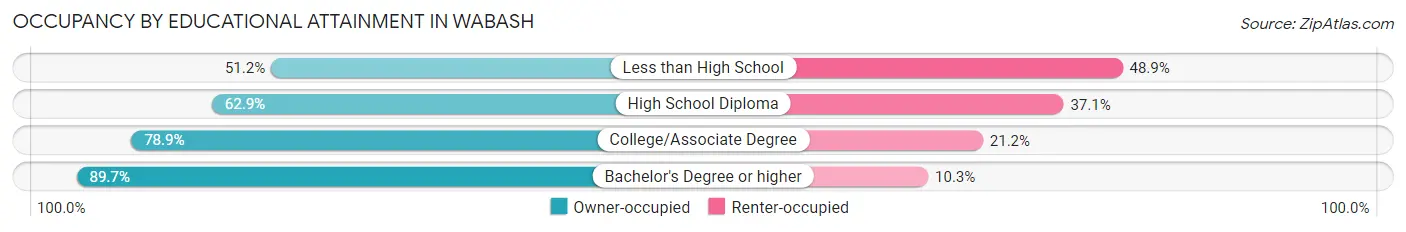
| Household Size | Owner-occupied | Renter-occupied |
| Less than High School | 222 (51.1%) | 212 (48.8%) |
| High School Diploma | 1,185 (62.9%) | 700 (37.1%) |
| College/Associate Degree | 932 (78.8%) | 250 (21.1%) |
| Bachelor's Degree or higher | 906 (89.7%) | 104 (10.3%) |
Occupancy by Age of Householder in Wabash
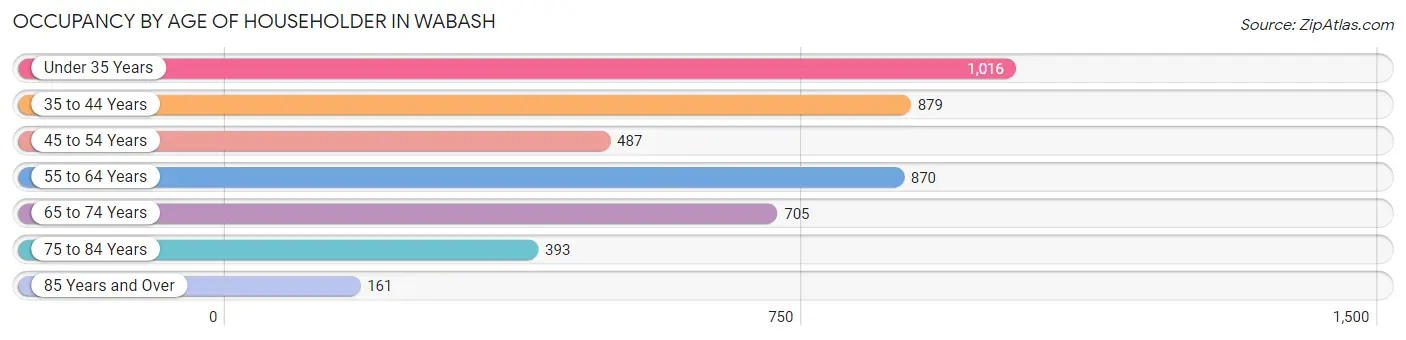
| Age Bracket | # Households | % Households |
| Under 35 Years | 1,016 | 22.5% |
| 35 to 44 Years | 879 | 19.5% |
| 45 to 54 Years | 487 | 10.8% |
| 55 to 64 Years | 870 | 19.3% |
| 65 to 74 Years | 705 | 15.6% |
| 75 to 84 Years | 393 | 8.7% |
| 85 Years and Over | 161 | 3.6% |
| Total | 4,511 | 100.0% |
Housing Finances in Wabash
Median Income by Occupancy in Wabash
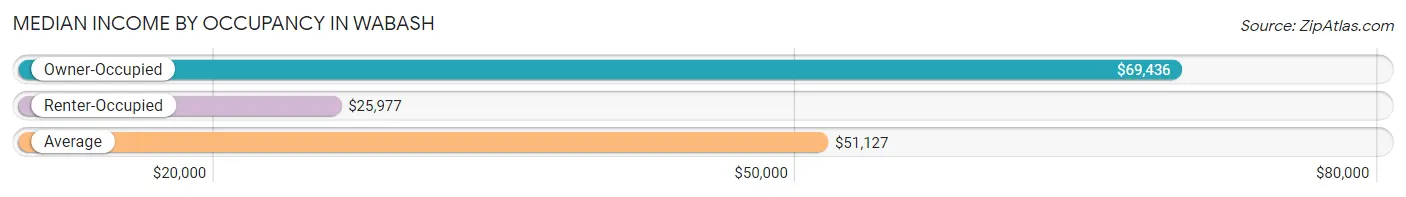
| Occupancy Type | # Households | Median Income |
| Owner-Occupied | 3,245 (71.9%) | $69,436 |
| Renter-Occupied | 1,266 (28.1%) | $25,977 |
| Average | 4,511 (100.0%) | $51,127 |
Occupancy by Householder Income Bracket in Wabash
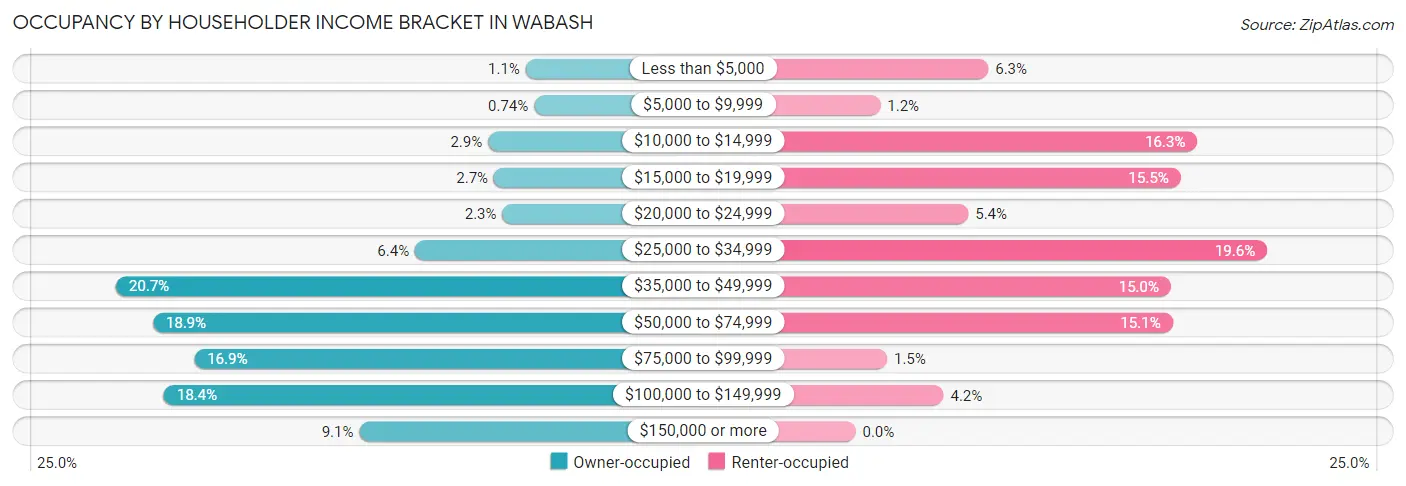
| Income Bracket | Owner-occupied | Renter-occupied |
| Less than $5,000 | 37 (1.1%) | 80 (6.3%) |
| $5,000 to $9,999 | 24 (0.7%) | 15 (1.2%) |
| $10,000 to $14,999 | 95 (2.9%) | 206 (16.3%) |
| $15,000 to $19,999 | 86 (2.6%) | 196 (15.5%) |
| $20,000 to $24,999 | 73 (2.2%) | 68 (5.4%) |
| $25,000 to $34,999 | 208 (6.4%) | 248 (19.6%) |
| $35,000 to $49,999 | 670 (20.6%) | 190 (15.0%) |
| $50,000 to $74,999 | 613 (18.9%) | 191 (15.1%) |
| $75,000 to $99,999 | 549 (16.9%) | 19 (1.5%) |
| $100,000 to $149,999 | 596 (18.4%) | 53 (4.2%) |
| $150,000 or more | 294 (9.1%) | 0 (0.0%) |
| Total | 3,245 (100.0%) | 1,266 (100.0%) |
Monthly Housing Cost Tiers in Wabash
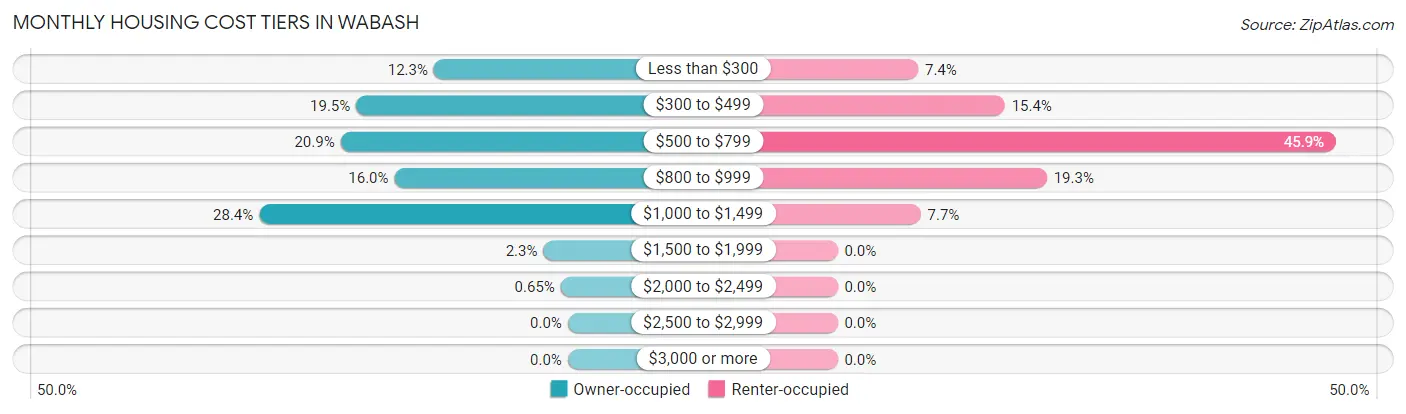
| Monthly Cost | Owner-occupied | Renter-occupied |
| Less than $300 | 400 (12.3%) | 94 (7.4%) |
| $300 to $499 | 632 (19.5%) | 195 (15.4%) |
| $500 to $799 | 679 (20.9%) | 581 (45.9%) |
| $800 to $999 | 518 (16.0%) | 244 (19.3%) |
| $1,000 to $1,499 | 922 (28.4%) | 97 (7.7%) |
| $1,500 to $1,999 | 73 (2.2%) | 0 (0.0%) |
| $2,000 to $2,499 | 21 (0.6%) | 0 (0.0%) |
| $2,500 to $2,999 | 0 (0.0%) | 0 (0.0%) |
| $3,000 or more | 0 (0.0%) | 0 (0.0%) |
| Total | 3,245 (100.0%) | 1,266 (100.0%) |
Physical Housing Characteristics in Wabash
Housing Structures in Wabash
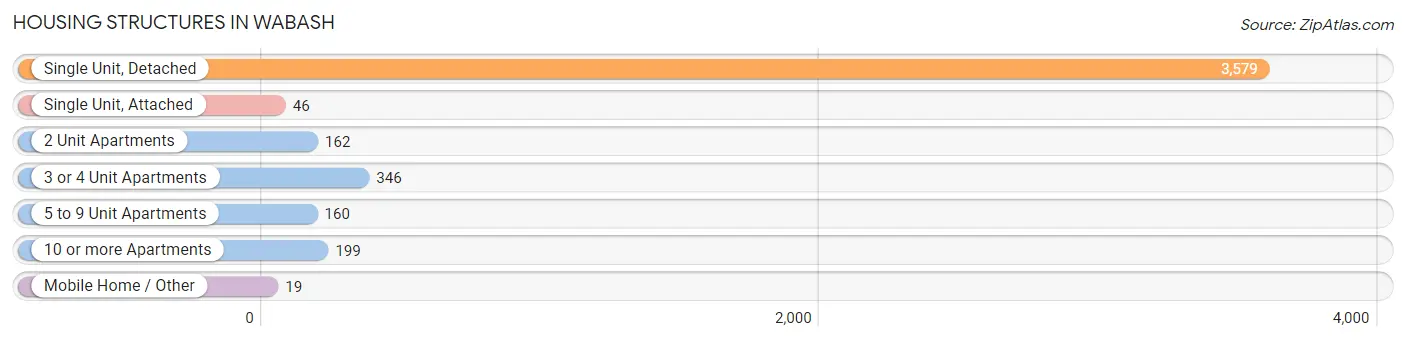
| Structure Type | # Housing Units | % Housing Units |
| Single Unit, Detached | 3,579 | 79.3% |
| Single Unit, Attached | 46 | 1.0% |
| 2 Unit Apartments | 162 | 3.6% |
| 3 or 4 Unit Apartments | 346 | 7.7% |
| 5 to 9 Unit Apartments | 160 | 3.5% |
| 10 or more Apartments | 199 | 4.4% |
| Mobile Home / Other | 19 | 0.4% |
| Total | 4,511 | 100.0% |
Housing Structures by Occupancy in Wabash
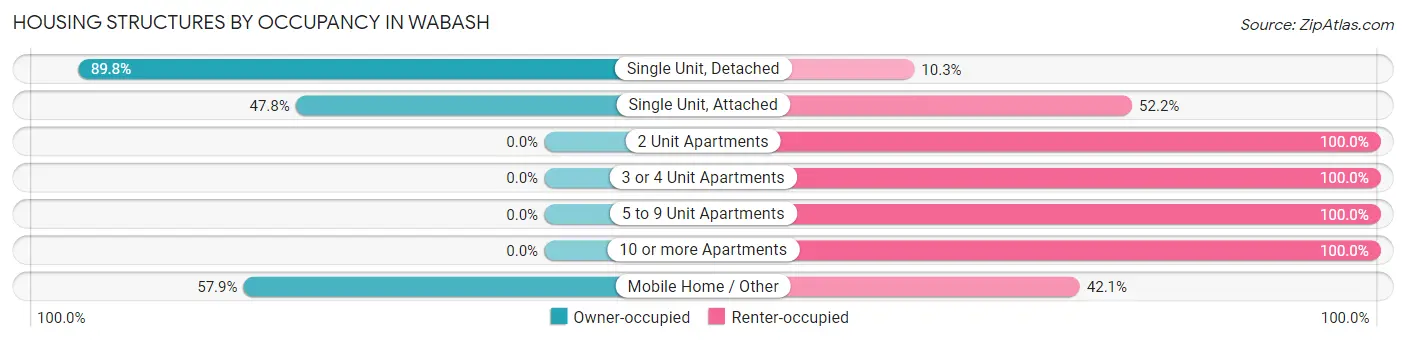
| Structure Type | Owner-occupied | Renter-occupied |
| Single Unit, Detached | 3,212 (89.7%) | 367 (10.2%) |
| Single Unit, Attached | 22 (47.8%) | 24 (52.2%) |
| 2 Unit Apartments | 0 (0.0%) | 162 (100.0%) |
| 3 or 4 Unit Apartments | 0 (0.0%) | 346 (100.0%) |
| 5 to 9 Unit Apartments | 0 (0.0%) | 160 (100.0%) |
| 10 or more Apartments | 0 (0.0%) | 199 (100.0%) |
| Mobile Home / Other | 11 (57.9%) | 8 (42.1%) |
| Total | 3,245 (71.9%) | 1,266 (28.1%) |
Housing Structures by Number of Rooms in Wabash
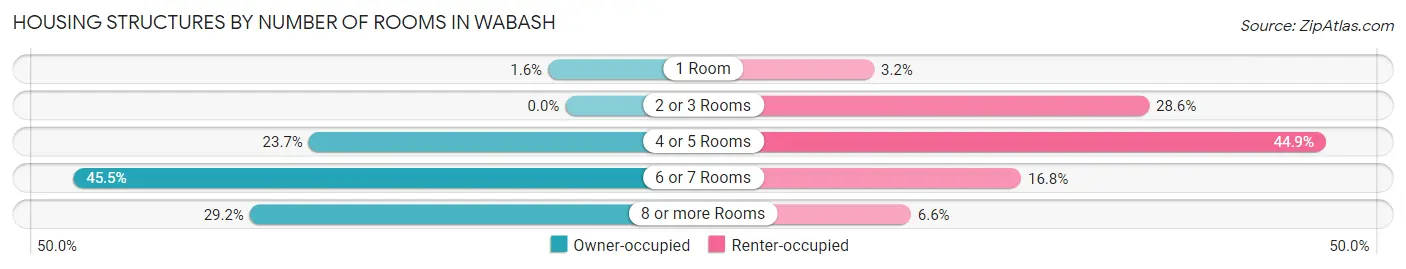
| Number of Rooms | Owner-occupied | Renter-occupied |
| 1 Room | 52 (1.6%) | 40 (3.2%) |
| 2 or 3 Rooms | 0 (0.0%) | 362 (28.6%) |
| 4 or 5 Rooms | 770 (23.7%) | 569 (44.9%) |
| 6 or 7 Rooms | 1,476 (45.5%) | 212 (16.8%) |
| 8 or more Rooms | 947 (29.2%) | 83 (6.6%) |
| Total | 3,245 (100.0%) | 1,266 (100.0%) |
Housing Structure by Heating Type in Wabash
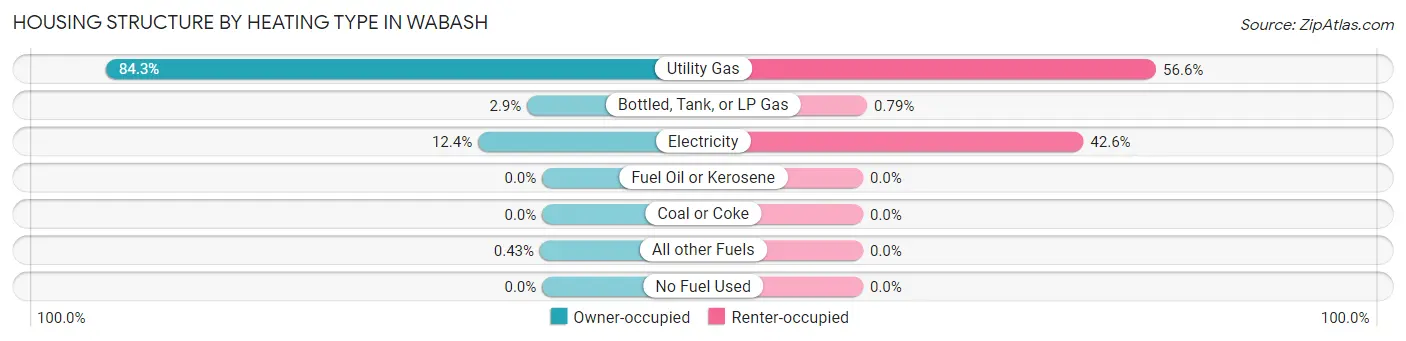
| Heating Type | Owner-occupied | Renter-occupied |
| Utility Gas | 2,735 (84.3%) | 717 (56.6%) |
| Bottled, Tank, or LP Gas | 94 (2.9%) | 10 (0.8%) |
| Electricity | 402 (12.4%) | 539 (42.6%) |
| Fuel Oil or Kerosene | 0 (0.0%) | 0 (0.0%) |
| Coal or Coke | 0 (0.0%) | 0 (0.0%) |
| All other Fuels | 14 (0.4%) | 0 (0.0%) |
| No Fuel Used | 0 (0.0%) | 0 (0.0%) |
| Total | 3,245 (100.0%) | 1,266 (100.0%) |
Household Vehicle Usage in Wabash
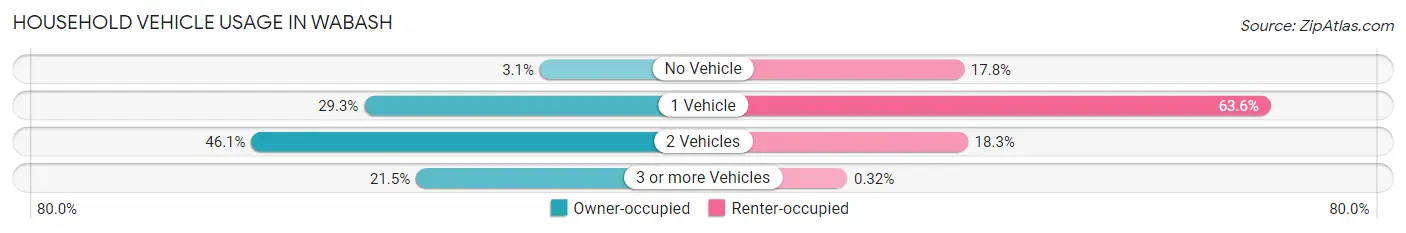
| Vehicles per Household | Owner-occupied | Renter-occupied |
| No Vehicle | 99 (3.0%) | 225 (17.8%) |
| 1 Vehicle | 950 (29.3%) | 805 (63.6%) |
| 2 Vehicles | 1,497 (46.1%) | 232 (18.3%) |
| 3 or more Vehicles | 699 (21.5%) | 4 (0.3%) |
| Total | 3,245 (100.0%) | 1,266 (100.0%) |
Real Estate & Mortgages in Wabash
Real Estate and Mortgage Overview in Wabash
| Characteristic | Without Mortgage | With Mortgage |
| Housing Units | 1,194 | 2,051 |
| Median Property Value | $89,700 | $119,500 |
| Median Household Income | $42,193 | $247 |
| Monthly Housing Costs | $361 | $0 |
| Real Estate Taxes | $540 | $66 |
Property Value by Mortgage Status in Wabash
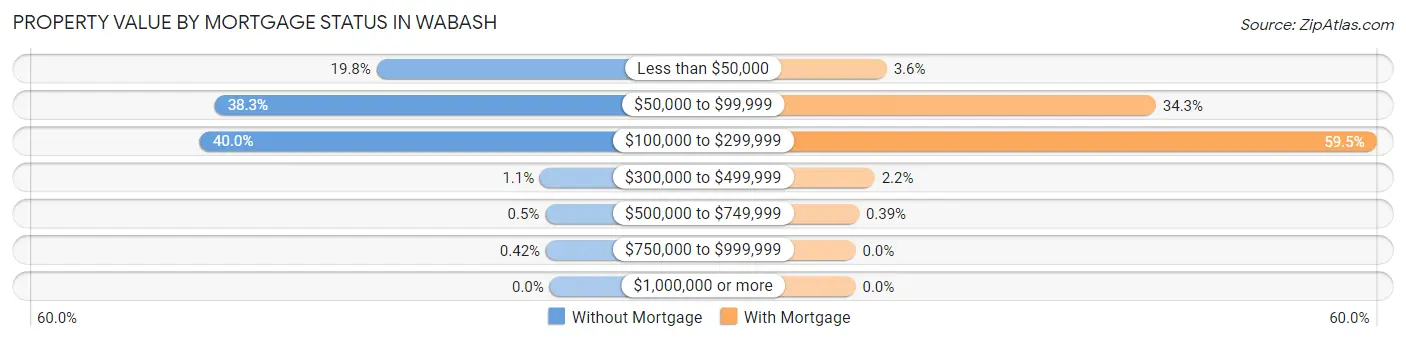
| Property Value | Without Mortgage | With Mortgage |
| Less than $50,000 | 236 (19.8%) | 73 (3.6%) |
| $50,000 to $99,999 | 457 (38.3%) | 704 (34.3%) |
| $100,000 to $299,999 | 477 (40.0%) | 1,221 (59.5%) |
| $300,000 to $499,999 | 13 (1.1%) | 45 (2.2%) |
| $500,000 to $749,999 | 6 (0.5%) | 8 (0.4%) |
| $750,000 to $999,999 | 5 (0.4%) | 0 (0.0%) |
| $1,000,000 or more | 0 (0.0%) | 0 (0.0%) |
| Total | 1,194 (100.0%) | 2,051 (100.0%) |
Household Income by Mortgage Status in Wabash
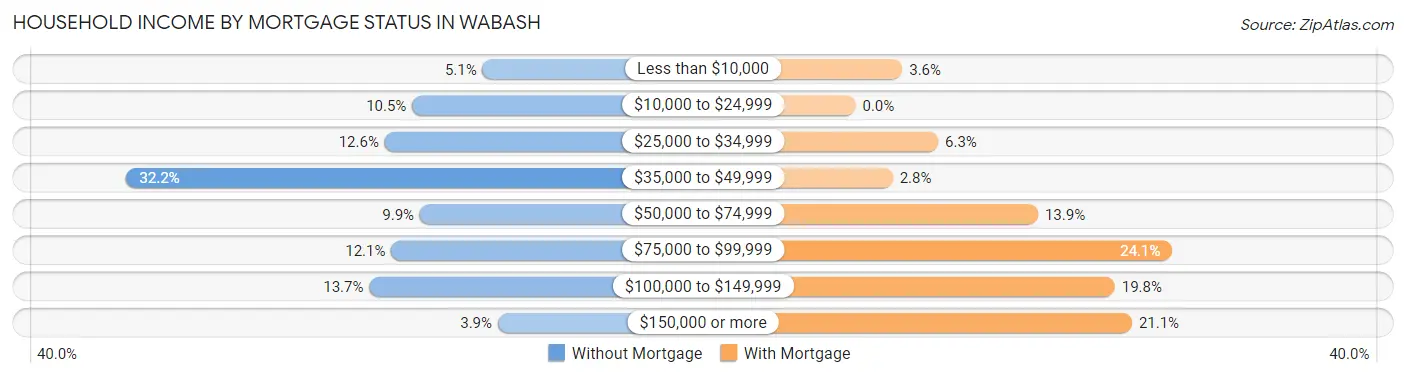
| Household Income | Without Mortgage | With Mortgage |
| Less than $10,000 | 61 (5.1%) | 73 (3.6%) |
| $10,000 to $24,999 | 125 (10.5%) | 0 (0.0%) |
| $25,000 to $34,999 | 150 (12.6%) | 129 (6.3%) |
| $35,000 to $49,999 | 385 (32.2%) | 58 (2.8%) |
| $50,000 to $74,999 | 118 (9.9%) | 285 (13.9%) |
| $75,000 to $99,999 | 144 (12.1%) | 495 (24.1%) |
| $100,000 to $149,999 | 164 (13.7%) | 405 (19.8%) |
| $150,000 or more | 47 (3.9%) | 432 (21.1%) |
| Total | 1,194 (100.0%) | 2,051 (100.0%) |
Property Value to Household Income Ratio in Wabash
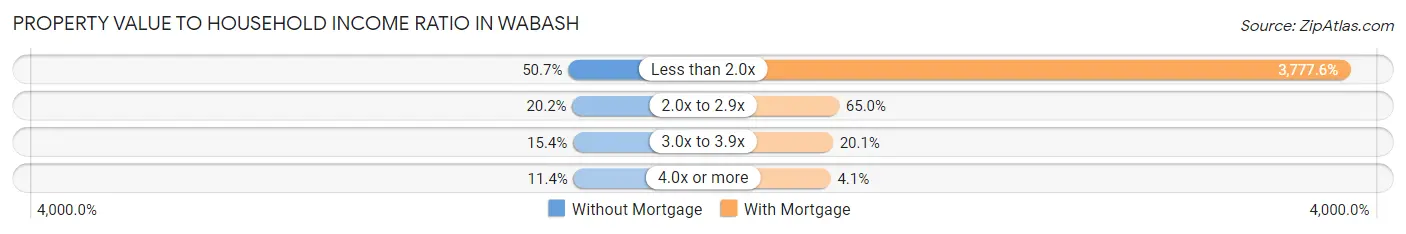
| Value-to-Income Ratio | Without Mortgage | With Mortgage |
| Less than 2.0x | 605 (50.7%) | 77,479 (3,777.6%) |
| 2.0x to 2.9x | 241 (20.2%) | 1,333 (65.0%) |
| 3.0x to 3.9x | 184 (15.4%) | 413 (20.1%) |
| 4.0x or more | 136 (11.4%) | 84 (4.1%) |
| Total | 1,194 (100.0%) | 2,051 (100.0%) |
Real Estate Taxes by Mortgage Status in Wabash
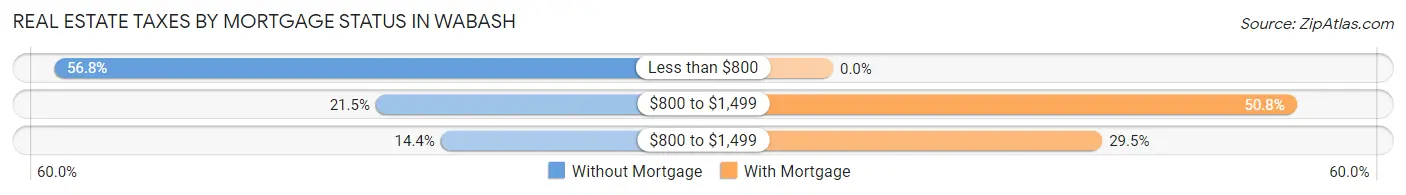
| Property Taxes | Without Mortgage | With Mortgage |
| Less than $800 | 678 (56.8%) | 0 (0.0%) |
| $800 to $1,499 | 257 (21.5%) | 1,042 (50.8%) |
| $800 to $1,499 | 172 (14.4%) | 605 (29.5%) |
| Total | 1,194 (100.0%) | 2,051 (100.0%) |
Health & Disability in Wabash
Health Insurance Coverage by Age in Wabash
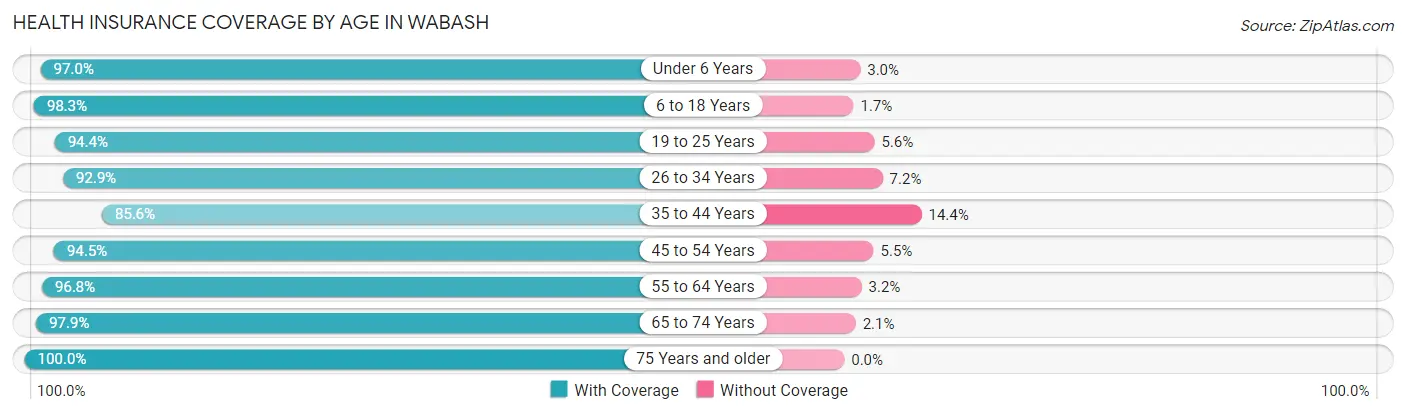
| Age Bracket | With Coverage | Without Coverage |
| Under 6 Years | 619 (97.0%) | 19 (3.0%) |
| 6 to 18 Years | 1,770 (98.3%) | 31 (1.7%) |
| 19 to 25 Years | 739 (94.4%) | 44 (5.6%) |
| 26 to 34 Years | 1,117 (92.8%) | 86 (7.1%) |
| 35 to 44 Years | 1,164 (85.6%) | 196 (14.4%) |
| 45 to 54 Years | 777 (94.5%) | 45 (5.5%) |
| 55 to 64 Years | 1,377 (96.8%) | 46 (3.2%) |
| 65 to 74 Years | 1,151 (97.9%) | 25 (2.1%) |
| 75 Years and older | 843 (100.0%) | 0 (0.0%) |
| Total | 9,557 (95.1%) | 492 (4.9%) |
Health Insurance Coverage by Citizenship Status in Wabash
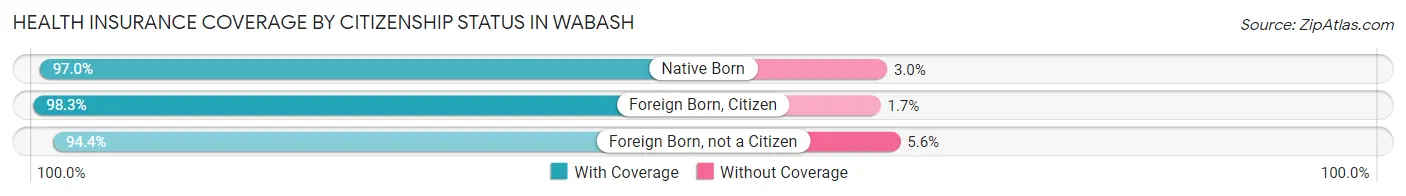
| Citizenship Status | With Coverage | Without Coverage |
| Native Born | 619 (97.0%) | 19 (3.0%) |
| Foreign Born, Citizen | 1,770 (98.3%) | 31 (1.7%) |
| Foreign Born, not a Citizen | 739 (94.4%) | 44 (5.6%) |
Health Insurance Coverage by Household Income in Wabash
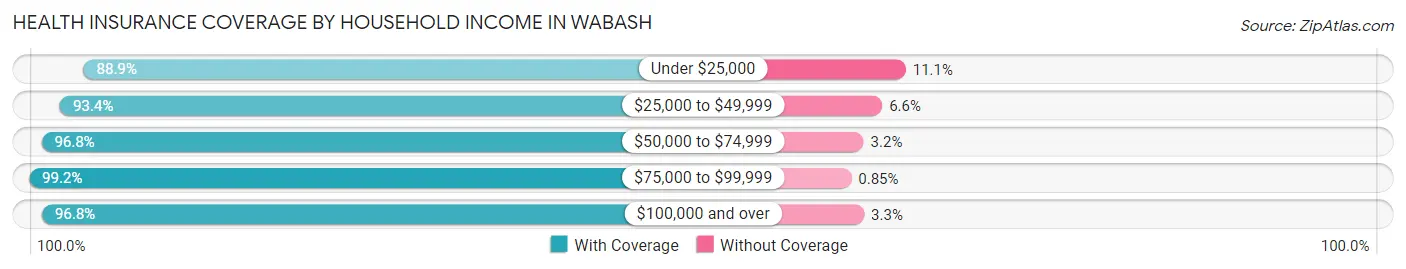
| Household Income | With Coverage | Without Coverage |
| Under $25,000 | 1,230 (88.9%) | 153 (11.1%) |
| $25,000 to $49,999 | 2,589 (93.4%) | 184 (6.6%) |
| $50,000 to $74,999 | 1,809 (96.8%) | 59 (3.2%) |
| $75,000 to $99,999 | 1,406 (99.2%) | 12 (0.9%) |
| $100,000 and over | 2,504 (96.8%) | 84 (3.3%) |
Public vs Private Health Insurance Coverage by Age in Wabash
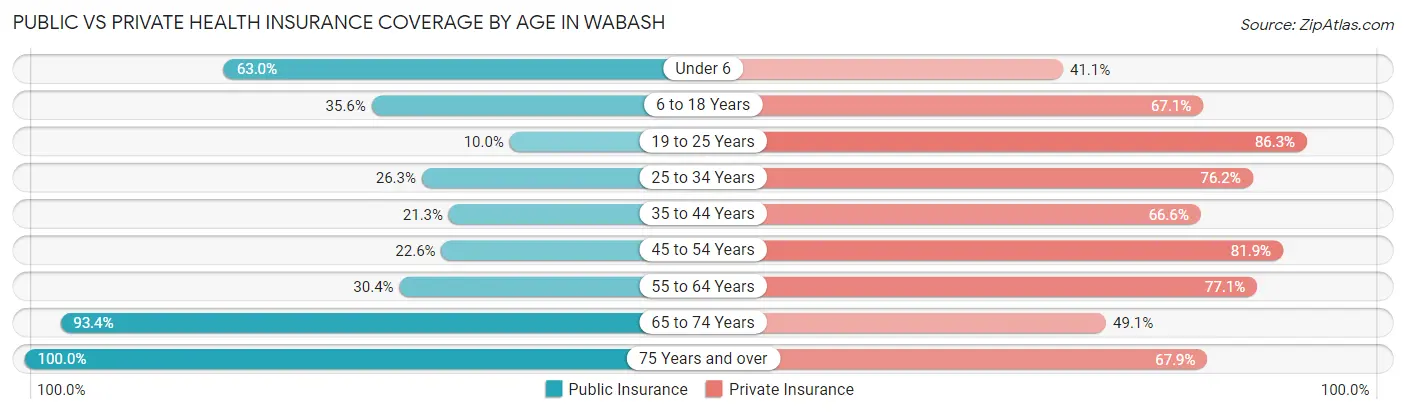
| Age Bracket | Public Insurance | Private Insurance |
| Under 6 | 402 (63.0%) | 262 (41.1%) |
| 6 to 18 Years | 641 (35.6%) | 1,208 (67.1%) |
| 19 to 25 Years | 78 (10.0%) | 676 (86.3%) |
| 25 to 34 Years | 316 (26.3%) | 917 (76.2%) |
| 35 to 44 Years | 289 (21.2%) | 906 (66.6%) |
| 45 to 54 Years | 186 (22.6%) | 673 (81.9%) |
| 55 to 64 Years | 433 (30.4%) | 1,097 (77.1%) |
| 65 to 74 Years | 1,098 (93.4%) | 577 (49.1%) |
| 75 Years and over | 843 (100.0%) | 572 (67.8%) |
| Total | 4,286 (42.6%) | 6,888 (68.5%) |
Disability Status by Sex by Age in Wabash
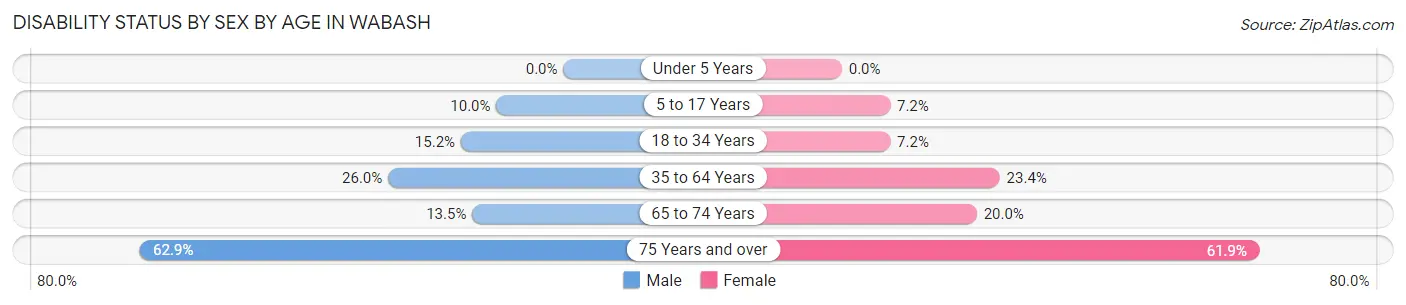
| Age Bracket | Male | Female |
| Under 5 Years | 0 (0.0%) | 0 (0.0%) |
| 5 to 17 Years | 88 (10.0%) | 67 (7.2%) |
| 18 to 34 Years | 157 (15.2%) | 78 (7.2%) |
| 35 to 64 Years | 484 (26.0%) | 409 (23.4%) |
| 65 to 74 Years | 74 (13.5%) | 126 (20.0%) |
| 75 Years and over | 203 (62.8%) | 322 (61.9%) |
Disability Class by Sex by Age in Wabash
Disability Class: Hearing Difficulty
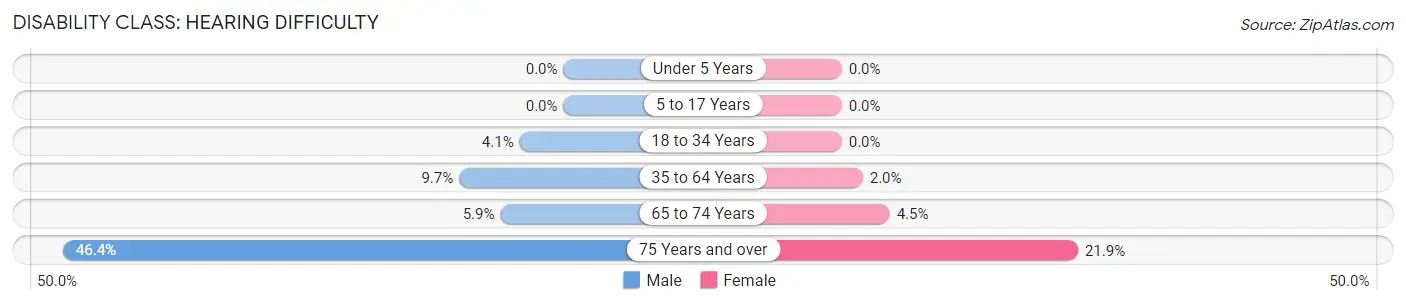
| Age Bracket | Male | Female |
| Under 5 Years | 0 (0.0%) | 0 (0.0%) |
| 5 to 17 Years | 0 (0.0%) | 0 (0.0%) |
| 18 to 34 Years | 42 (4.1%) | 0 (0.0%) |
| 35 to 64 Years | 180 (9.7%) | 34 (1.9%) |
| 65 to 74 Years | 32 (5.9%) | 28 (4.4%) |
| 75 Years and over | 150 (46.4%) | 114 (21.9%) |
Disability Class: Vision Difficulty
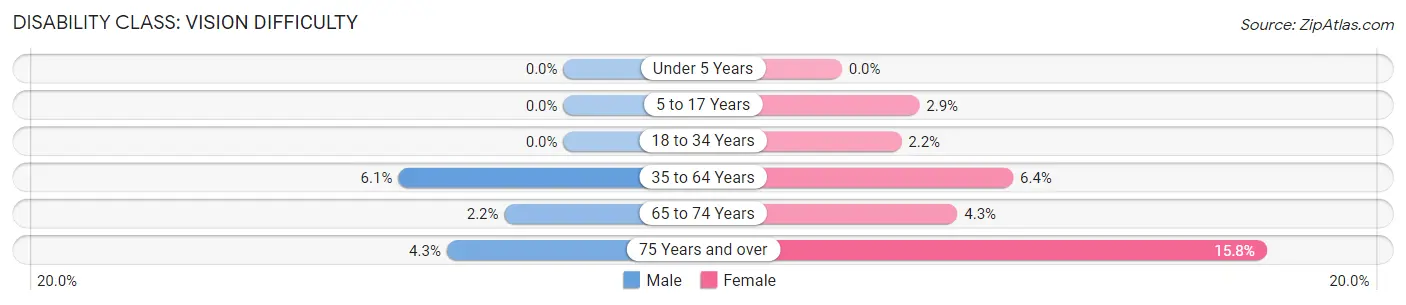
| Age Bracket | Male | Female |
| Under 5 Years | 0 (0.0%) | 0 (0.0%) |
| 5 to 17 Years | 0 (0.0%) | 27 (2.9%) |
| 18 to 34 Years | 0 (0.0%) | 24 (2.2%) |
| 35 to 64 Years | 114 (6.1%) | 111 (6.4%) |
| 65 to 74 Years | 12 (2.2%) | 27 (4.3%) |
| 75 Years and over | 14 (4.3%) | 82 (15.8%) |
Disability Class: Cognitive Difficulty
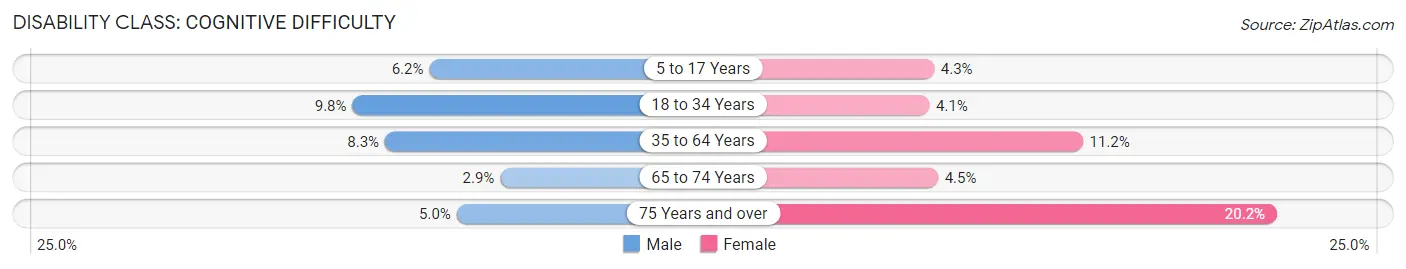
| Age Bracket | Male | Female |
| 5 to 17 Years | 55 (6.2%) | 40 (4.3%) |
| 18 to 34 Years | 101 (9.8%) | 44 (4.1%) |
| 35 to 64 Years | 154 (8.3%) | 195 (11.2%) |
| 65 to 74 Years | 16 (2.9%) | 28 (4.4%) |
| 75 Years and over | 16 (5.0%) | 105 (20.2%) |
Disability Class: Ambulatory Difficulty
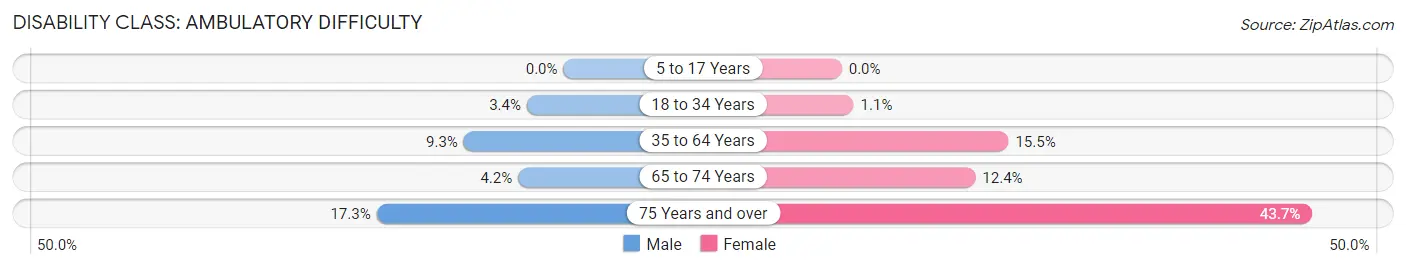
| Age Bracket | Male | Female |
| 5 to 17 Years | 0 (0.0%) | 0 (0.0%) |
| 18 to 34 Years | 35 (3.4%) | 12 (1.1%) |
| 35 to 64 Years | 172 (9.2%) | 270 (15.5%) |
| 65 to 74 Years | 23 (4.2%) | 78 (12.4%) |
| 75 Years and over | 56 (17.3%) | 227 (43.6%) |
Disability Class: Self-Care Difficulty
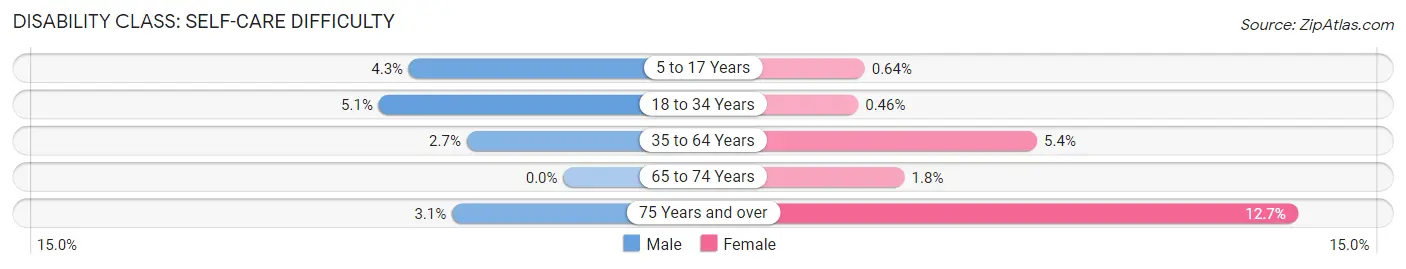
| Age Bracket | Male | Female |
| 5 to 17 Years | 38 (4.3%) | 6 (0.6%) |
| 18 to 34 Years | 53 (5.1%) | 5 (0.5%) |
| 35 to 64 Years | 50 (2.7%) | 95 (5.4%) |
| 65 to 74 Years | 0 (0.0%) | 11 (1.8%) |
| 75 Years and over | 10 (3.1%) | 66 (12.7%) |
Technology Access in Wabash
Computing Device Access in Wabash
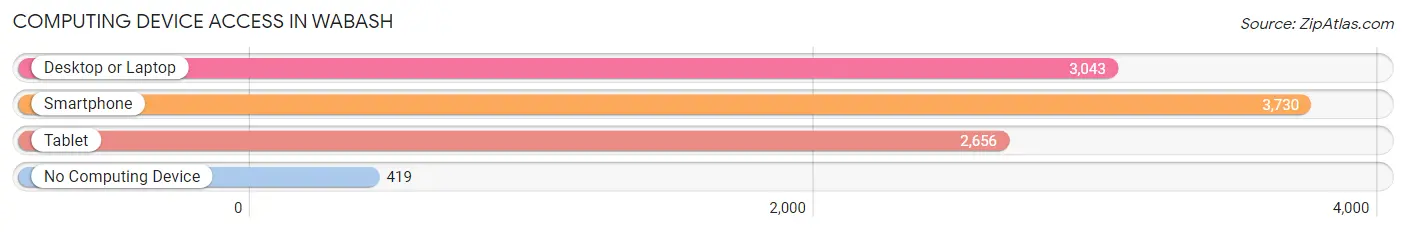
| Device Type | # Households | % Households |
| Desktop or Laptop | 3,043 | 67.5% |
| Smartphone | 3,730 | 82.7% |
| Tablet | 2,656 | 58.9% |
| No Computing Device | 419 | 9.3% |
| Total | 4,511 | 100.0% |
Internet Access in Wabash
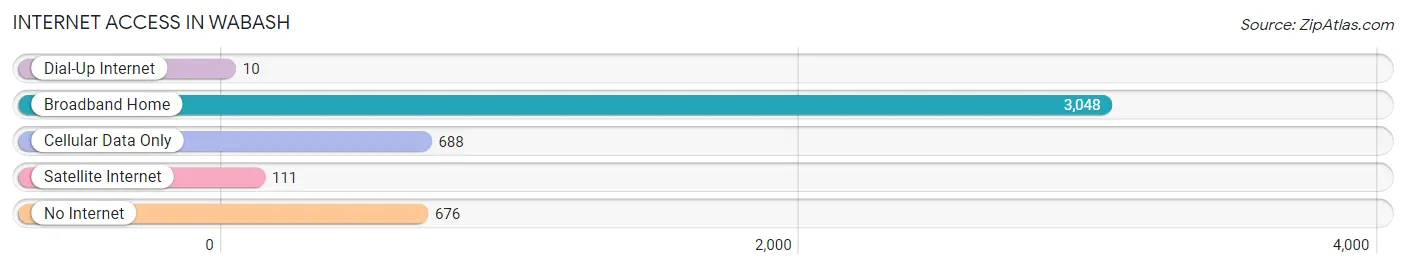
| Internet Type | # Households | % Households |
| Dial-Up Internet | 10 | 0.2% |
| Broadband Home | 3,048 | 67.6% |
| Cellular Data Only | 688 | 15.2% |
| Satellite Internet | 111 | 2.5% |
| No Internet | 676 | 15.0% |
| Total | 4,511 | 100.0% |
Wabash Summary
Wabash is a city located in Wabash County, Indiana, United States. It is the county seat of Wabash County and is located in the Wabash River Valley. The population was 10,666 at the 2010 census. The city is the home of the historic Wabash and Erie Canal and the Wabash County Historical Museum.
History
The area around Wabash was first settled in the early 19th century by settlers from the East Coast. The first permanent settlement was established in 1834 by William Conner and his family. The town was named after the Wabash River, which runs through the city.
In 1844, the Wabash and Erie Canal was completed, connecting the city to the Ohio River. This allowed for the transportation of goods and people to and from the city. The canal was a major factor in the growth of the city and the surrounding area.
In 1851, the Wabash County Courthouse was built, and the city was officially incorporated in 1853. The city continued to grow throughout the 19th century, and by 1900, the population had reached 5,000.
Geography
Wabash is located at 40°48'17" North, 85°49'17" West (40.804, -85.821). According to the 2010 census, the city has a total area of 8.3 square miles (21.5 km2), of which 8.2 square miles (21.3 km2) is land and 0.1 square miles (0.2 km2) is water.
The city is located in the Wabash River Valley, which is part of the Great Lakes region. The city is surrounded by farmland and is located near the Wabash River.
Economy
The economy of Wabash is largely based on manufacturing and agriculture. The city is home to several manufacturing companies, including Wabash National Corporation, which produces semi-trailers and other transportation equipment. Other major employers in the city include Wabash Valley Power, Wabash Valley College, and Wabash County Hospital.
Agriculture is also an important part of the economy, with corn, soybeans, and wheat being the main crops grown in the area.
Demographics
As of the 2010 census, there were 10,666 people, 4,521 households, and 2,717 families residing in the city. The population density was 1,295.3 people per square mile (500.2/km2). There were 4,945 housing units at an average density of 600.3 per square mile (231.7/km2). The racial makeup of the city was 95.2% White, 0.7% African American, 0.3% Native American, 0.7% Asian, 0.1% Pacific Islander, 1.3% from other races, and 1.9% from two or more races. Hispanic or Latino of any race were 3.2% of the population.
There were 4,521 households, out of which 28.2% had children under the age of 18 living with them, 43.2% were married couples living together, 13.7% had a female householder with no husband present, and 38.7% were non-families. 33.2% of all households were made up of individuals, and 14.7% had someone living alone who was 65 years of age or older. The average household size was 2.30 and the average family size was 2.93.
In the city, the population was spread out, with 24.2% under the age of 18, 8.7% from 18 to 24, 27.2% from 25 to 44, 22.3% from 45 to 64, and 17.6% who were 65 years of age or older. The median age was 38 years. For every 100 females, there were 90.2 males. For every 100 females age 18 and over, there were 86.2 males.
The median income for a household in the city was $35,921, and the median income for a family was $45,945. Males had a median income of $35,921 versus $25,921 for females. The per capita income for the city was $19,945. About 8.7% of families and 11.2% of the population were below the poverty line, including 15.2% of those under age 18 and 8.2% of those age 65 or over.
Common Questions
What is the Total Population of Wabash?
Total Population of Wabash is 10,417.
What is the Total Male Population of Wabash?
Total Male Population of Wabash is 5,189.
What is the Total Female Population of Wabash?
Total Female Population of Wabash is 5,228.
What is the Ratio of Males per 100 Females in Wabash?
There are 99.25 Males per 100 Females in Wabash.
What is the Ratio of Females per 100 Males in Wabash?
There are 100.75 Females per 100 Males in Wabash.
What is the Median Population Age in Wabash?
Median Population Age in Wabash is 41.0 Years.
What is the Average Family Size in Wabash
Average Family Size in Wabash is 2.7 People.
What is the Average Household Size in Wabash
Average Household Size in Wabash is 2.2 People.
What is Per Capita Income in Wabash?
Per Capita income in Wabash is $30,366.
What is the Median Family Income in Wabash?
Median Family Income in Wabash is $68,333.
What is the Median Household income in Wabash?
Median Household Income in Wabash is $51,127.
What is Income or Wage Gap in Wabash?
Income or Wage Gap in Wabash is 29.1%.
Women in Wabash earn 70.9 cents for every dollar earned by a man.
What is Family Income Deficit in Wabash?
Family Income Deficit in Wabash is $9,400.
Families that are below poverty line in Wabash earn $9,400 less on average than the poverty threshold level.
What is Inequality or Gini Index in Wabash?
Inequality or Gini Index in Wabash is 0.44.
How Large is the Labor Force in Wabash?
There are 4,893 People in the Labor Forcein in Wabash.
What is the Percentage of People in the Labor Force in Wabash?
58.9% of People are in the Labor Force in Wabash.
What is the Unemployment Rate in Wabash?
Unemployment Rate in Wabash is 4.2%.