Long Beach, IN
Long Beach Map
Long Beach Overview
1,184
TOTAL POPULATION
601
MALE POPULATION
583
FEMALE POPULATION
103.09
MALES / 100 FEMALES
97.00
FEMALES / 100 MALES
62.6
MEDIAN AGE
2.3
AVG FAMILY SIZE
1.9
AVG HOUSEHOLD SIZE
$119,126
PER CAPITA INCOME
$164,063
AVG FAMILY INCOME
$112,813
AVG HOUSEHOLD INCOME
35.5%
WAGE / INCOME GAP [ % ]
64.5¢/ $1
WAGE / INCOME GAP [ $ ]
$16,500
FAMILY INCOME DEFICIT
0.56
INEQUALITY / GINI INDEX
574
LABOR FORCE [ PEOPLE ]
50.5%
PERCENT IN LABOR FORCE
2.6%
UNEMPLOYMENT RATE
Long Beach Area Codes
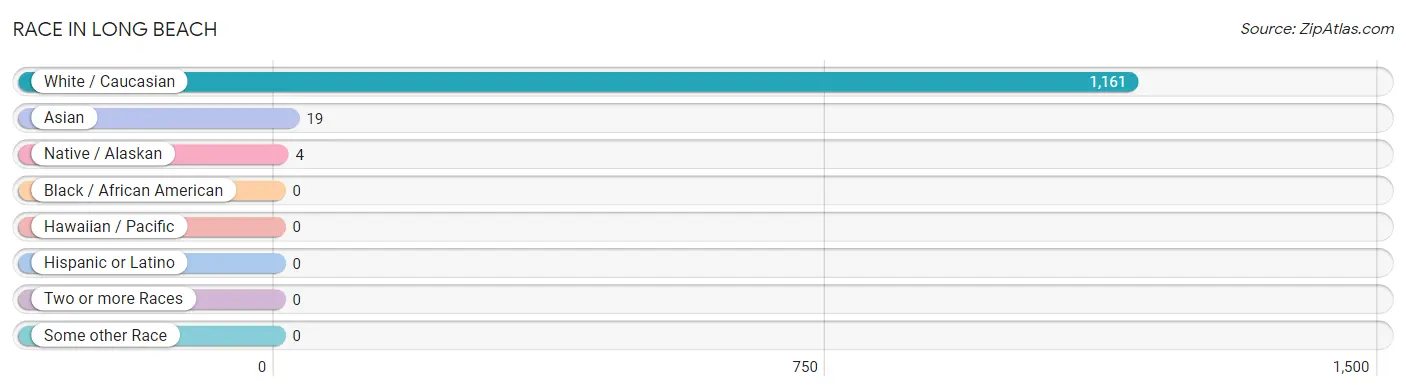
Race in Long Beach
The most populous races in Long Beach are White / Caucasian (1,161 | 98.1%), Asian (19 | 1.6%), and Native / Alaskan (4 | 0.3%).
| Race | # Population | % Population |
| Asian | 19 | 1.6% |
| Black / African American | 0 | 0.0% |
| Hawaiian / Pacific | 0 | 0.0% |
| Hispanic or Latino | 0 | 0.0% |
| Native / Alaskan | 4 | 0.3% |
| White / Caucasian | 1,161 | 98.1% |
| Two or more Races | 0 | 0.0% |
| Some other Race | 0 | 0.0% |
| Total | 1,184 | 100.0% |
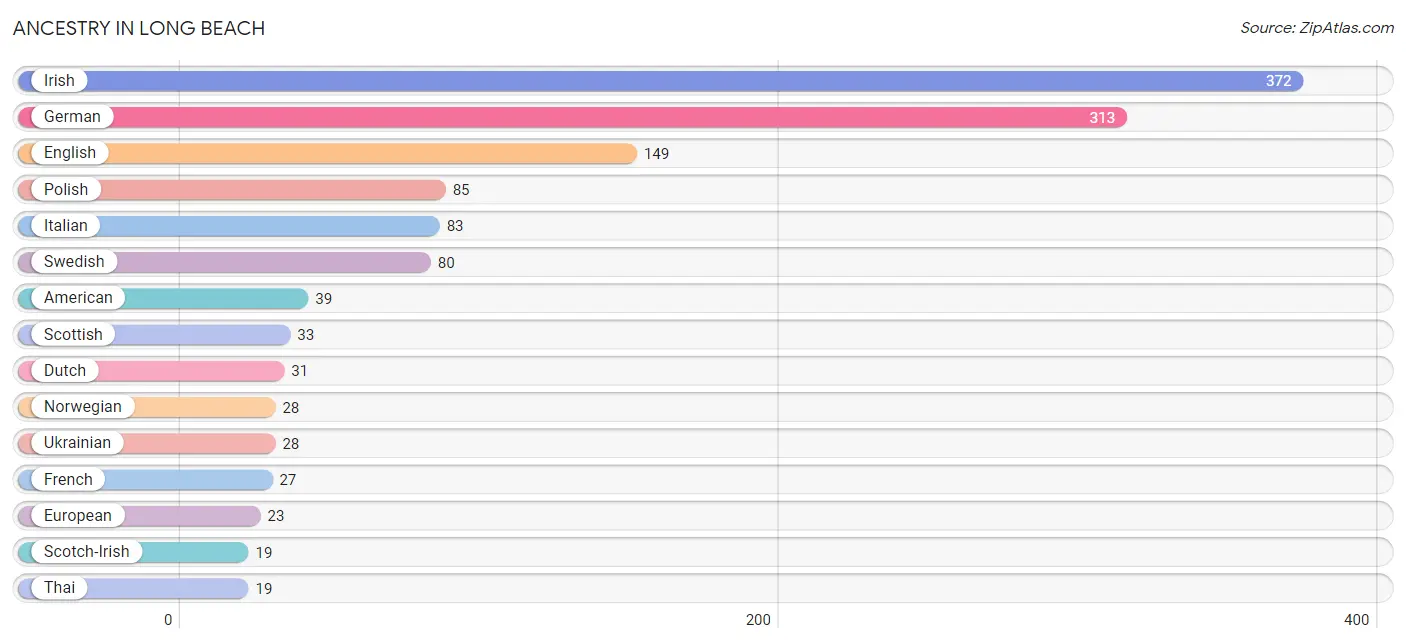
Ancestry in Long Beach
The most populous ancestries reported in Long Beach are Irish (372 | 31.4%), German (313 | 26.4%), English (149 | 12.6%), Polish (85 | 7.2%), and Italian (83 | 7.0%), together accounting for 84.6% of all Long Beach residents.
| Ancestry | # Population | % Population |
| American | 39 | 3.3% |
| Arab | 5 | 0.4% |
| Belgian | 6 | 0.5% |
| British | 2 | 0.2% |
| Croatian | 5 | 0.4% |
| Czech | 9 | 0.8% |
| Czechoslovakian | 10 | 0.8% |
| Danish | 2 | 0.2% |
| Dutch | 31 | 2.6% |
| Eastern European | 7 | 0.6% |
| English | 149 | 12.6% |
| European | 23 | 1.9% |
| French | 27 | 2.3% |
| French Canadian | 6 | 0.5% |
| German | 313 | 26.4% |
| Greek | 17 | 1.4% |
| Hungarian | 4 | 0.3% |
| Irish | 372 | 31.4% |
| Italian | 83 | 7.0% |
| Lebanese | 5 | 0.4% |
| Lithuanian | 12 | 1.0% |
| Macedonian | 2 | 0.2% |
| Norwegian | 28 | 2.4% |
| Pennsylvania German | 4 | 0.3% |
| Polish | 85 | 7.2% |
| Romanian | 7 | 0.6% |
| Russian | 12 | 1.0% |
| Scotch-Irish | 19 | 1.6% |
| Scottish | 33 | 2.8% |
| Serbian | 7 | 0.6% |
| Slavic | 3 | 0.3% |
| Slovak | 6 | 0.5% |
| Slovene | 10 | 0.8% |
| Swedish | 80 | 6.8% |
| Swiss | 5 | 0.4% |
| Thai | 19 | 1.6% |
| Ukrainian | 28 | 2.4% |
| Welsh | 2 | 0.2% | View All 38 Rows |
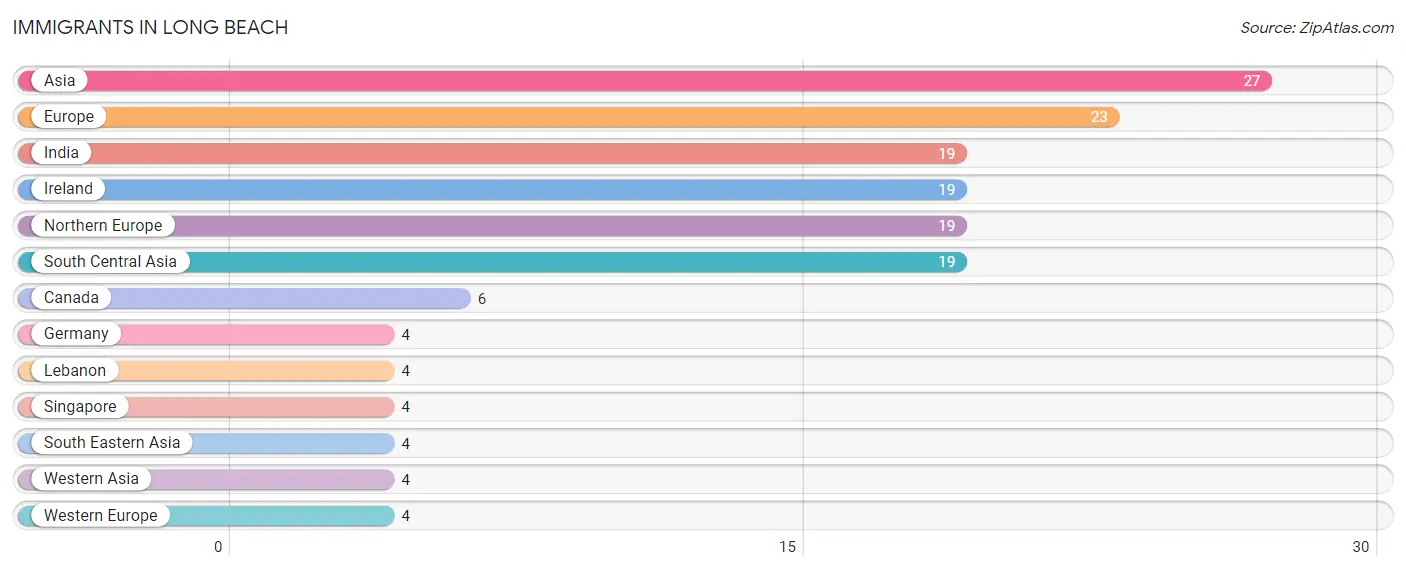
Immigrants in Long Beach
The most numerous immigrant groups reported in Long Beach came from Asia (27 | 2.3%), Europe (23 | 1.9%), India (19 | 1.6%), Ireland (19 | 1.6%), and Northern Europe (19 | 1.6%), together accounting for 9.0% of all Long Beach residents.
| Immigration Origin | # Population | % Population |
| Asia | 27 | 2.3% |
| Canada | 6 | 0.5% |
| Europe | 23 | 1.9% |
| Germany | 4 | 0.3% |
| India | 19 | 1.6% |
| Ireland | 19 | 1.6% |
| Lebanon | 4 | 0.3% |
| Northern Europe | 19 | 1.6% |
| Singapore | 4 | 0.3% |
| South Central Asia | 19 | 1.6% |
| South Eastern Asia | 4 | 0.3% |
| Western Asia | 4 | 0.3% |
| Western Europe | 4 | 0.3% | View All 13 Rows |
Sex and Age in Long Beach
Sex and Age in Long Beach
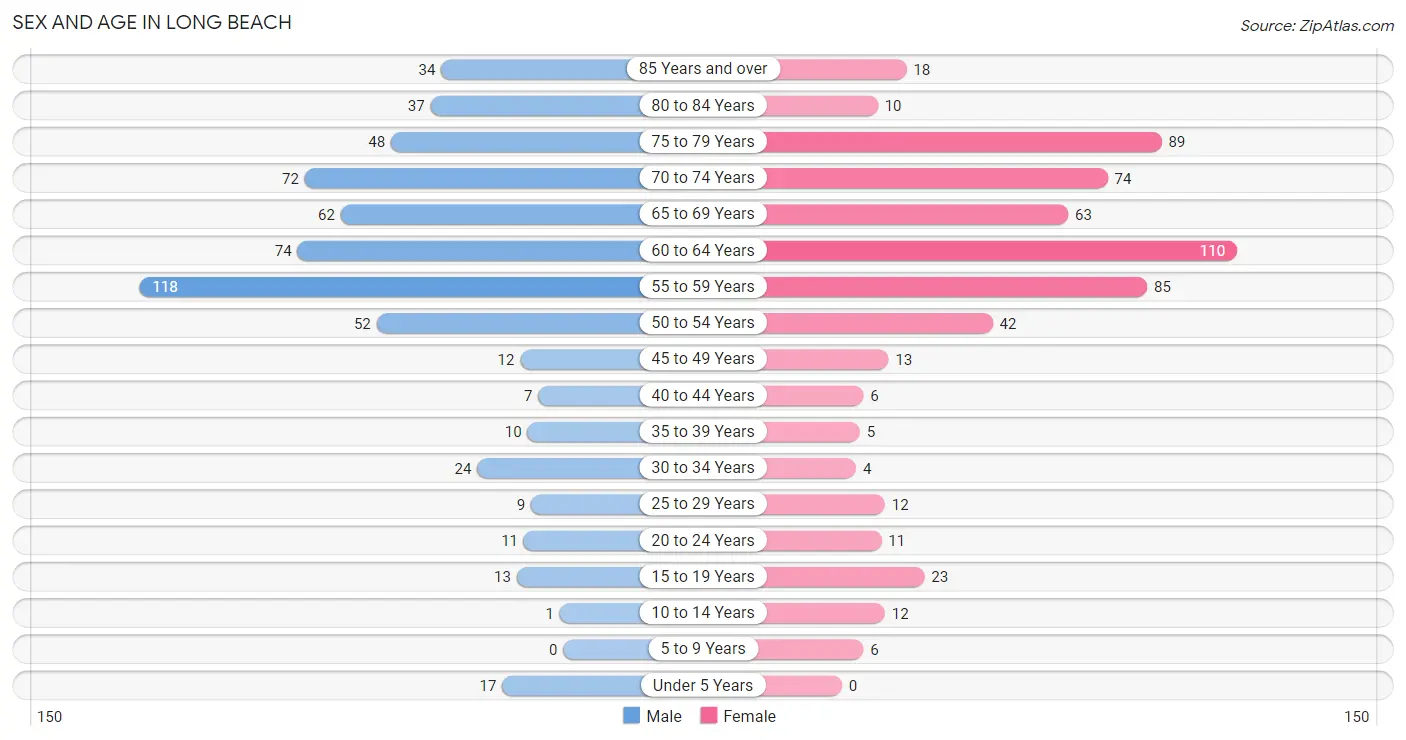
The most populous age groups in Long Beach are 55 to 59 Years (118 | 19.6%) for men and 60 to 64 Years (110 | 18.9%) for women.
| Age Bracket | Male | Female |
| Under 5 Years | 17 (2.8%) | 0 (0.0%) |
| 5 to 9 Years | 0 (0.0%) | 6 (1.0%) |
| 10 to 14 Years | 1 (0.2%) | 12 (2.1%) |
| 15 to 19 Years | 13 (2.2%) | 23 (4.0%) |
| 20 to 24 Years | 11 (1.8%) | 11 (1.9%) |
| 25 to 29 Years | 9 (1.5%) | 12 (2.1%) |
| 30 to 34 Years | 24 (4.0%) | 4 (0.7%) |
| 35 to 39 Years | 10 (1.7%) | 5 (0.9%) |
| 40 to 44 Years | 7 (1.2%) | 6 (1.0%) |
| 45 to 49 Years | 12 (2.0%) | 13 (2.2%) |
| 50 to 54 Years | 52 (8.6%) | 42 (7.2%) |
| 55 to 59 Years | 118 (19.6%) | 85 (14.6%) |
| 60 to 64 Years | 74 (12.3%) | 110 (18.9%) |
| 65 to 69 Years | 62 (10.3%) | 63 (10.8%) |
| 70 to 74 Years | 72 (12.0%) | 74 (12.7%) |
| 75 to 79 Years | 48 (8.0%) | 89 (15.3%) |
| 80 to 84 Years | 37 (6.2%) | 10 (1.7%) |
| 85 Years and over | 34 (5.7%) | 18 (3.1%) |
| Total | 601 (100.0%) | 583 (100.0%) |
Families and Households in Long Beach
Median Family Size in Long Beach
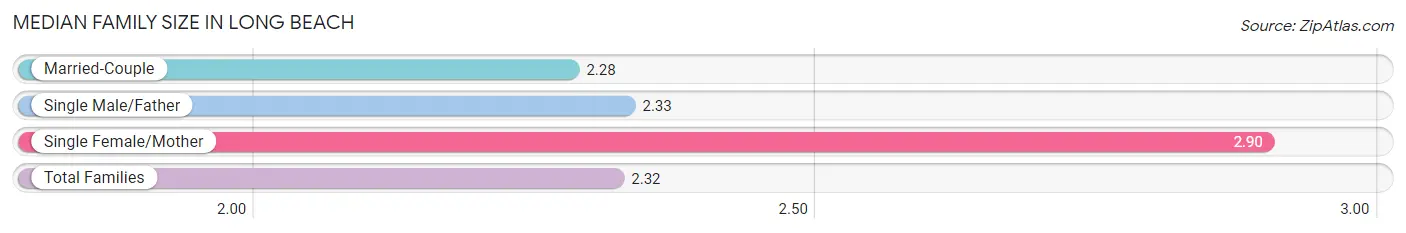
The median family size in Long Beach is 2.32 persons per family, with single female/mother families (21 | 5.2%) accounting for the largest median family size of 2.9 persons per family. On the other hand, married-couple families (383 | 94.1%) represent the smallest median family size with 2.28 persons per family.
| Family Type | # Families | Family Size |
| Married-Couple | 383 (94.1%) | 2.28 |
| Single Male/Father | 3 (0.7%) | 2.33 |
| Single Female/Mother | 21 (5.2%) | 2.90 |
| Total Families | 407 (100.0%) | 2.32 |
Median Household Size in Long Beach
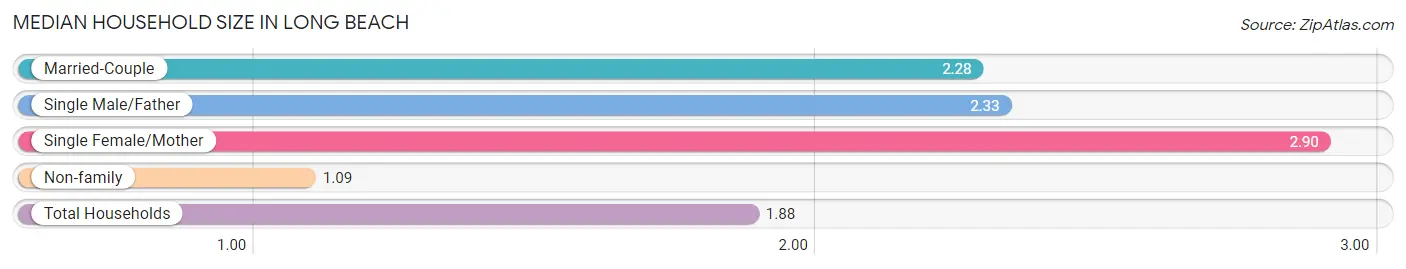
The median household size in Long Beach is 1.88 persons per household, with single female/mother households (21 | 3.3%) accounting for the largest median household size of 2.9 persons per household. non-family households (222 | 35.3%) represent the smallest median household size with 1.09 persons per household.
| Household Type | # Households | Household Size |
| Married-Couple | 383 (60.9%) | 2.28 |
| Single Male/Father | 3 (0.5%) | 2.33 |
| Single Female/Mother | 21 (3.3%) | 2.90 |
| Non-family | 222 (35.3%) | 1.09 |
| Total Households | 629 (100.0%) | 1.88 |
Household Size by Marriage Status in Long Beach
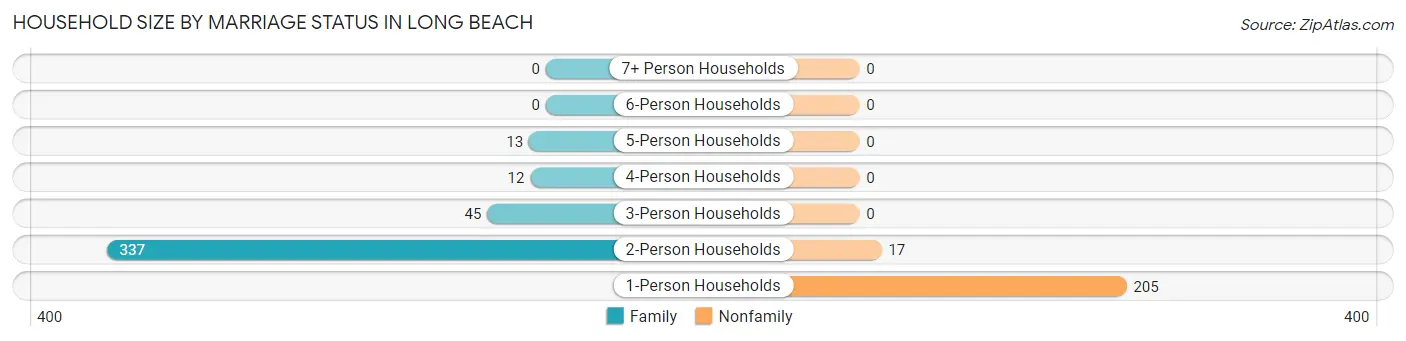
Out of a total of 629 households in Long Beach, 407 (64.7%) are family households, while 222 (35.3%) are nonfamily households. The most numerous type of family households are 2-person households, comprising 337, and the most common type of nonfamily households are 1-person households, comprising 205.
| Household Size | Family Households | Nonfamily Households |
| 1-Person Households | - | 205 (32.6%) |
| 2-Person Households | 337 (53.6%) | 17 (2.7%) |
| 3-Person Households | 45 (7.1%) | 0 (0.0%) |
| 4-Person Households | 12 (1.9%) | 0 (0.0%) |
| 5-Person Households | 13 (2.1%) | 0 (0.0%) |
| 6-Person Households | 0 (0.0%) | 0 (0.0%) |
| 7+ Person Households | 0 (0.0%) | 0 (0.0%) |
| Total | 407 (64.7%) | 222 (35.3%) |
Female Fertility in Long Beach
Fertility by Age in Long Beach
Average fertility rate in Long Beach is 13.0 births per 1,000 women. Women in the age bracket of 20 to 34 years have the highest fertility rate with 37.0 births per 1,000 women. Women in the age bracket of 20 to 34 years acount for 100.0% of all women with births.
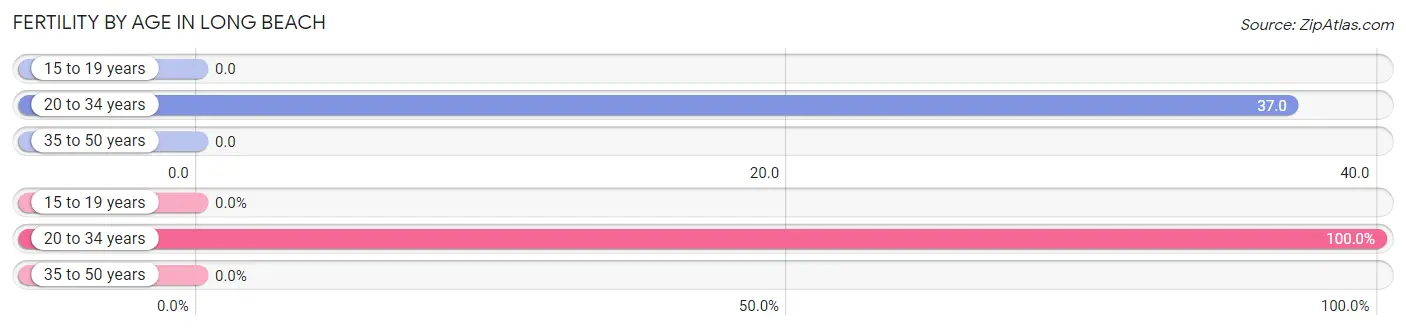
| Age Bracket | Women with Births | Births / 1,000 Women |
| 15 to 19 years | 0 (0.0%) | 0.0 |
| 20 to 34 years | 1 (100.0%) | 37.0 |
| 35 to 50 years | 0 (0.0%) | 0.0 |
| Total | 1 (100.0%) | 13.0 |
Fertility by Age by Marriage Status in Long Beach
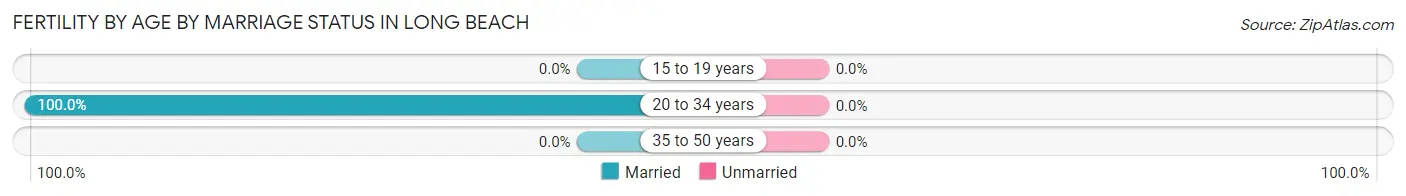
| Age Bracket | Married | Unmarried |
| 15 to 19 years | 0 (0.0%) | 0 (0.0%) |
| 20 to 34 years | 1 (100.0%) | 0 (0.0%) |
| 35 to 50 years | 0 (0.0%) | 0 (0.0%) |
| Total | 1 (100.0%) | 0 (0.0%) |
Fertility by Education in Long Beach
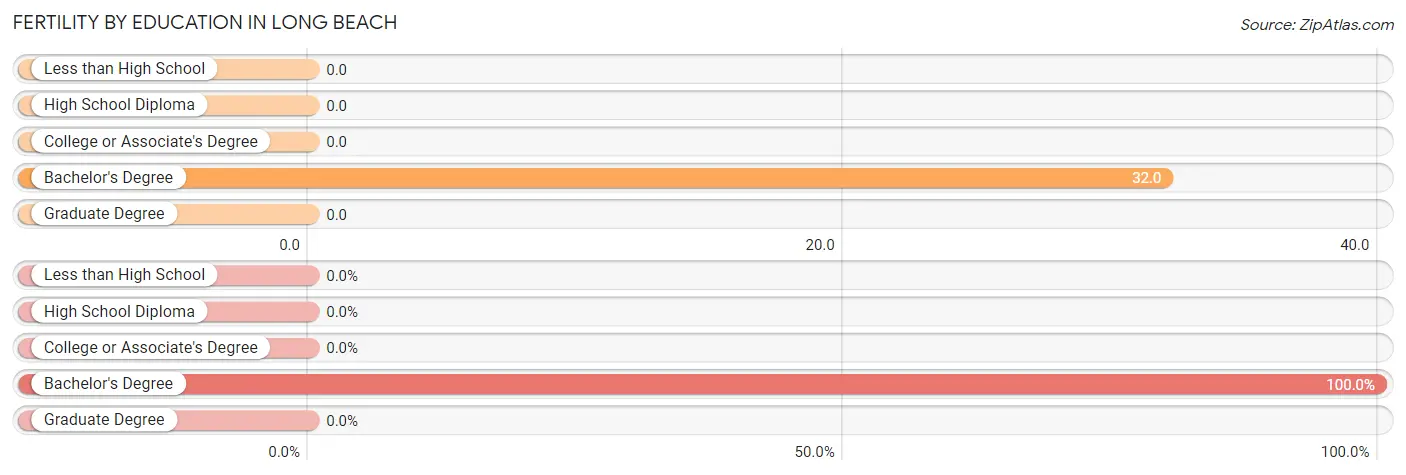
| Educational Attainment | Women with Births | Births / 1,000 Women |
| Less than High School | 0 (0.0%) | 0.0 |
| High School Diploma | 0 (0.0%) | 0.0 |
| College or Associate's Degree | 0 (0.0%) | 0.0 |
| Bachelor's Degree | 1 (100.0%) | 32.0 |
| Graduate Degree | 0 (0.0%) | 0.0 |
| Total | 1 (100.0%) | 13.0 |
Fertility by Education by Marriage Status in Long Beach
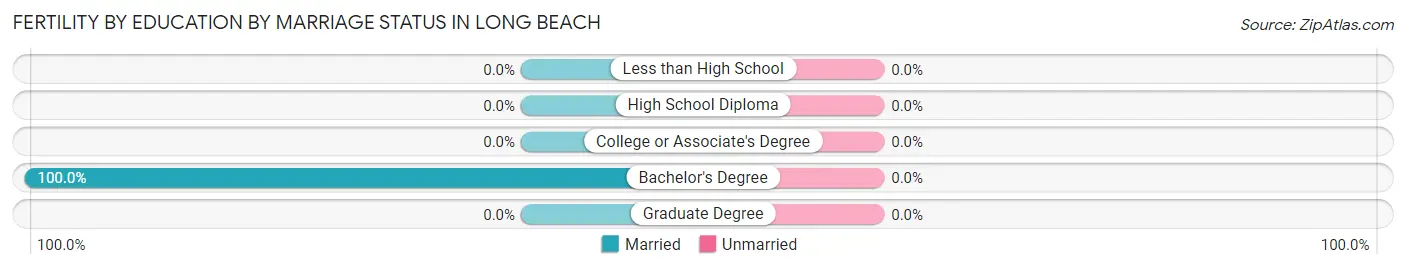
| Educational Attainment | Married | Unmarried |
| Less than High School | 0 (0.0%) | 0 (0.0%) |
| High School Diploma | 0 (0.0%) | 0 (0.0%) |
| College or Associate's Degree | 0 (0.0%) | 0 (0.0%) |
| Bachelor's Degree | 1 (100.0%) | 0 (0.0%) |
| Graduate Degree | 0 (0.0%) | 0 (0.0%) |
| Total | 1 (100.0%) | 0 (0.0%) |
Income in Long Beach
Income Overview in Long Beach
Per Capita Income in Long Beach is $119,126, while median incomes of families and households are $164,063 and $112,813 respectively.
| Characteristic | Number | Measure |
| Per Capita Income | 1,184 | $119,126 |
| Median Family Income | 407 | $164,063 |
| Mean Family Income | 407 | $270,746 |
| Median Household Income | 629 | $112,813 |
| Mean Household Income | 629 | $219,559 |
| Income Deficit | 407 | $16,500 |
| Wage / Income Gap (%) | 1,184 | 35.48% |
| Wage / Income Gap ($) | 1,184 | 64.52¢ per $1 |
| Gini / Inequality Index | 1,184 | 0.56 |
Earnings by Sex in Long Beach
Average Earnings in Long Beach are $84,583, $105,938 for men and $68,355 for women, a difference of 35.5%.
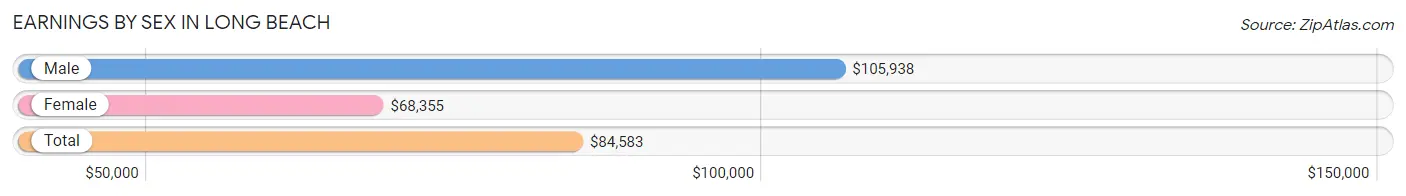
| Sex | Number | Average Earnings |
| Male | 372 (61.5%) | $105,938 |
| Female | 233 (38.5%) | $68,355 |
| Total | 605 (100.0%) | $84,583 |
Earnings by Sex by Income Bracket in Long Beach
The most common earnings brackets in Long Beach are $100,000+ for men (192 | 51.6%) and $100,000+ for women (74 | 31.8%).
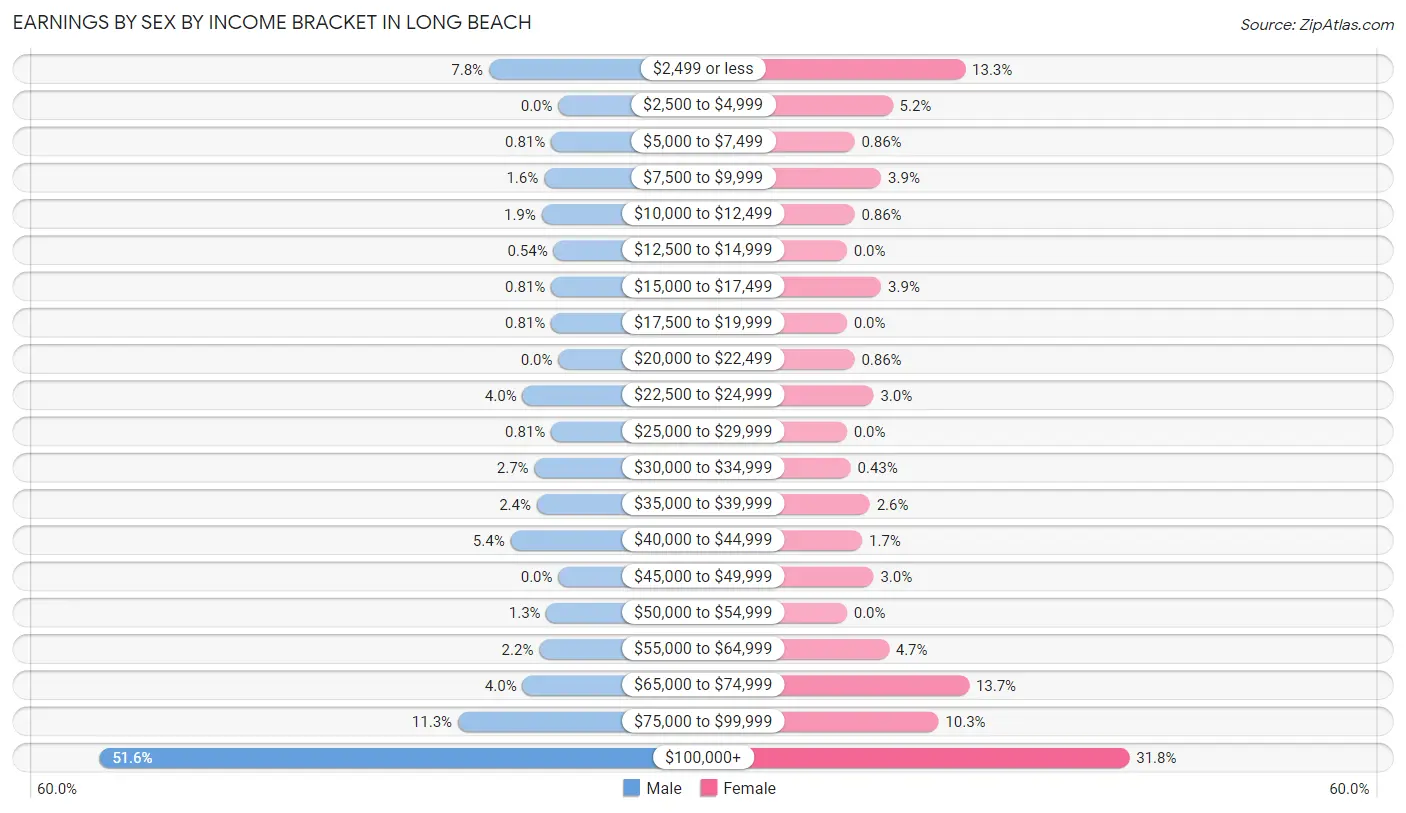
| Income | Male | Female |
| $2,499 or less | 29 (7.8%) | 31 (13.3%) |
| $2,500 to $4,999 | 0 (0.0%) | 12 (5.1%) |
| $5,000 to $7,499 | 3 (0.8%) | 2 (0.9%) |
| $7,500 to $9,999 | 6 (1.6%) | 9 (3.9%) |
| $10,000 to $12,499 | 7 (1.9%) | 2 (0.9%) |
| $12,500 to $14,999 | 2 (0.5%) | 0 (0.0%) |
| $15,000 to $17,499 | 3 (0.8%) | 9 (3.9%) |
| $17,500 to $19,999 | 3 (0.8%) | 0 (0.0%) |
| $20,000 to $22,499 | 0 (0.0%) | 2 (0.9%) |
| $22,500 to $24,999 | 15 (4.0%) | 7 (3.0%) |
| $25,000 to $29,999 | 3 (0.8%) | 0 (0.0%) |
| $30,000 to $34,999 | 10 (2.7%) | 1 (0.4%) |
| $35,000 to $39,999 | 9 (2.4%) | 6 (2.6%) |
| $40,000 to $44,999 | 20 (5.4%) | 4 (1.7%) |
| $45,000 to $49,999 | 0 (0.0%) | 7 (3.0%) |
| $50,000 to $54,999 | 5 (1.3%) | 0 (0.0%) |
| $55,000 to $64,999 | 8 (2.1%) | 11 (4.7%) |
| $65,000 to $74,999 | 15 (4.0%) | 32 (13.7%) |
| $75,000 to $99,999 | 42 (11.3%) | 24 (10.3%) |
| $100,000+ | 192 (51.6%) | 74 (31.8%) |
| Total | 372 (100.0%) | 233 (100.0%) |
Earnings by Sex by Educational Attainment in Long Beach
Average earnings in Long Beach are $107,266 for men and $69,803 for women, a difference of 34.9%. Men with an educational attainment of bachelor's degree enjoy the highest average annual earnings of $236,375, while those with college or associate's degree education earn the least with $40,750. Women with an educational attainment of graduate degree earn the most with the average annual earnings of $88,750, while those with bachelor's degree education have the smallest earnings of $69,803.
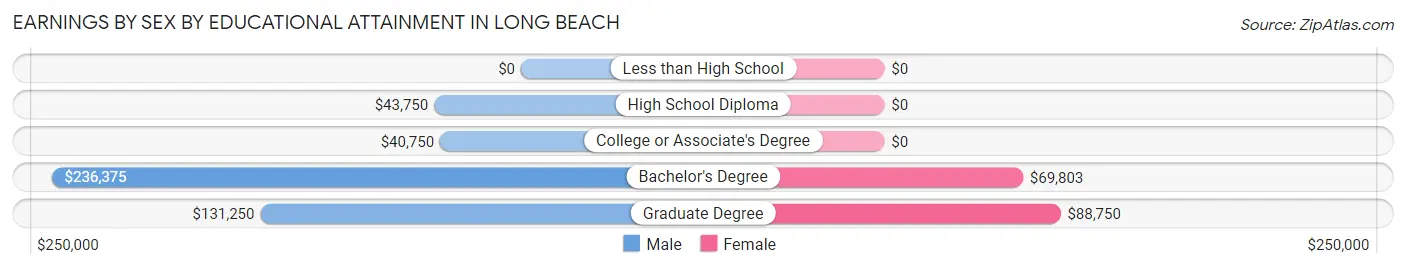
| Educational Attainment | Male Income | Female Income |
| Less than High School | - | - |
| High School Diploma | $43,750 | $0 |
| College or Associate's Degree | $40,750 | $0 |
| Bachelor's Degree | $236,375 | $69,803 |
| Graduate Degree | $131,250 | $88,750 |
| Total | $107,266 | $69,803 |
Family Income in Long Beach
Family Income Brackets in Long Beach
According to the Long Beach family income data, there are 172 families falling into the $200,000+ income range, which is the most common income bracket and makes up 42.3% of all families.
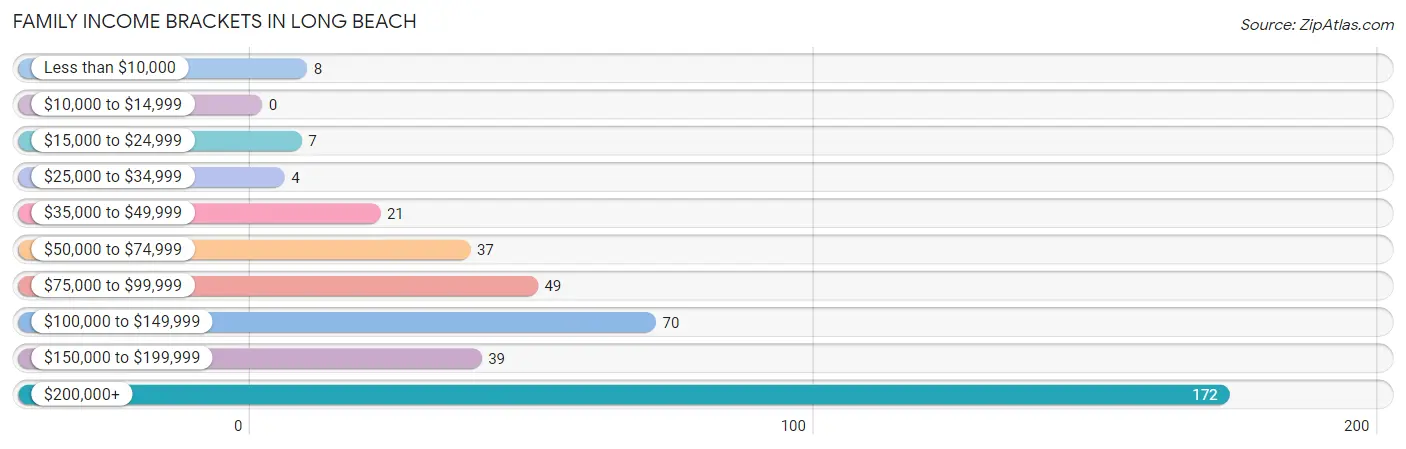
| Income Bracket | # Families | % Families |
| Less than $10,000 | 8 | 2.0% |
| $10,000 to $14,999 | 0 | 0.0% |
| $15,000 to $24,999 | 7 | 1.7% |
| $25,000 to $34,999 | 4 | 1.0% |
| $35,000 to $49,999 | 21 | 5.2% |
| $50,000 to $74,999 | 37 | 9.1% |
| $75,000 to $99,999 | 49 | 12.0% |
| $100,000 to $149,999 | 70 | 17.2% |
| $150,000 to $199,999 | 39 | 9.6% |
| $200,000+ | 172 | 42.3% |
Family Income by Famaliy Size in Long Beach
4-person families (12 | 2.9%) account for the highest median family income in Long Beach with $250,001 per family, while 2-person families (337 | 82.8%) have the highest median income of $71,875 per family member.
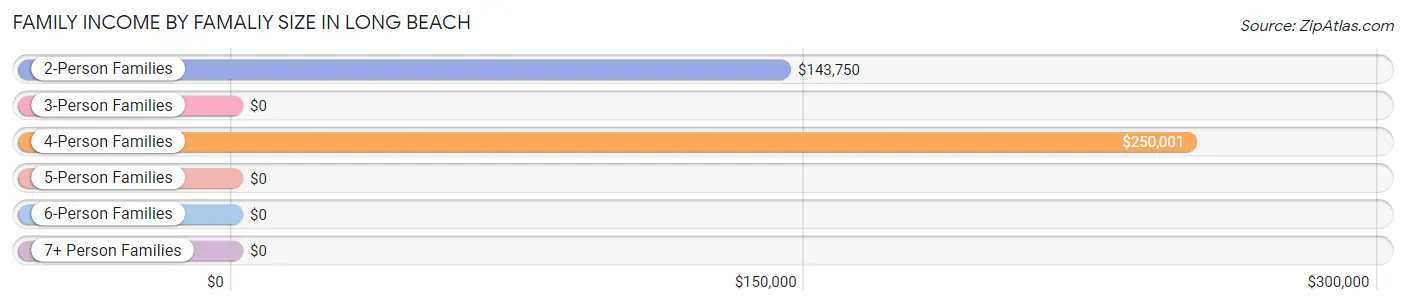
| Income Bracket | # Families | Median Income |
| 2-Person Families | 337 (82.8%) | $143,750 |
| 3-Person Families | 45 (11.1%) | $0 |
| 4-Person Families | 12 (2.9%) | $250,001 |
| 5-Person Families | 13 (3.2%) | $0 |
| 6-Person Families | 0 (0.0%) | $0 |
| 7+ Person Families | 0 (0.0%) | $0 |
| Total | 407 (100.0%) | $164,063 |
Family Income by Number of Earners in Long Beach
The median family income in Long Beach is $164,063, with families comprising 2 earners (126) having the highest median family income of $250,001, while families with no earners (106) have the lowest median family income of $81,250, accounting for 31.0% and 26.0% of families, respectively.
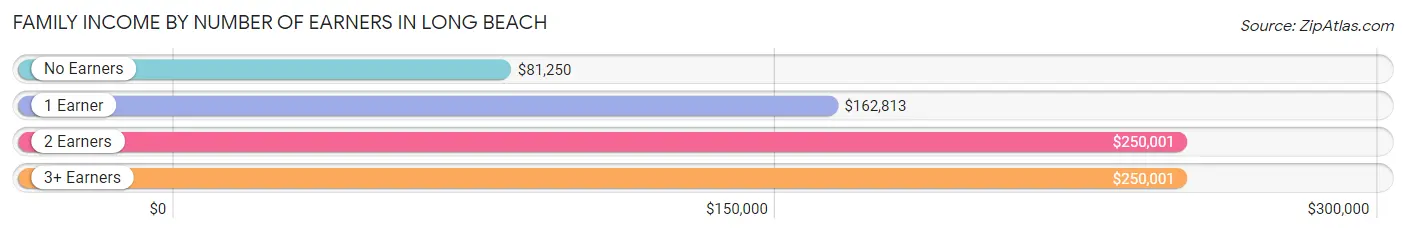
| Number of Earners | # Families | Median Income |
| No Earners | 106 (26.0%) | $81,250 |
| 1 Earner | 161 (39.6%) | $162,813 |
| 2 Earners | 126 (31.0%) | $250,001 |
| 3+ Earners | 14 (3.4%) | $250,001 |
| Total | 407 (100.0%) | $164,063 |
Household Income in Long Beach
Household Income Brackets in Long Beach
With 206 households falling in the category, the $200,000+ income range is the most frequent in Long Beach, accounting for 32.8% of all households. In contrast, only 14 households (2.2%) fall into the $10,000 to $14,999 income bracket, making it the least populous group.
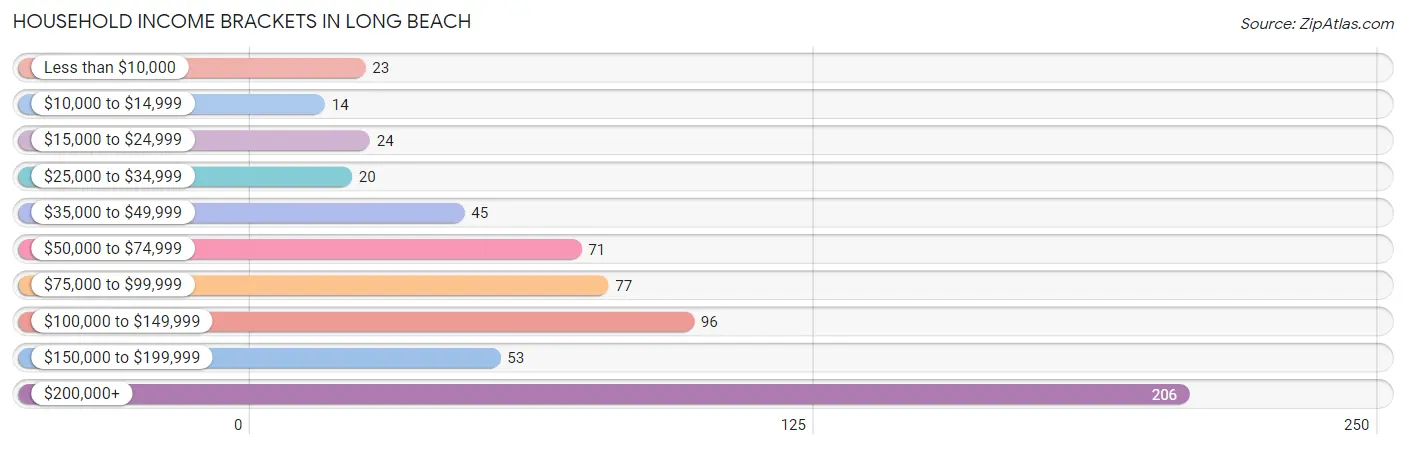
| Income Bracket | # Households | % Households |
| Less than $10,000 | 23 | 3.7% |
| $10,000 to $14,999 | 14 | 2.2% |
| $15,000 to $24,999 | 24 | 3.8% |
| $25,000 to $34,999 | 20 | 3.2% |
| $35,000 to $49,999 | 45 | 7.2% |
| $50,000 to $74,999 | 71 | 11.3% |
| $75,000 to $99,999 | 77 | 12.2% |
| $100,000 to $149,999 | 96 | 15.3% |
| $150,000 to $199,999 | 53 | 8.4% |
| $200,000+ | 206 | 32.8% |
Household Income by Householder Age in Long Beach
The median household income in Long Beach is $112,813, with the highest median household income of $213,750 found in the 25 to 44 years age bracket for the primary householder. A total of 24 households (3.8%) fall into this category.
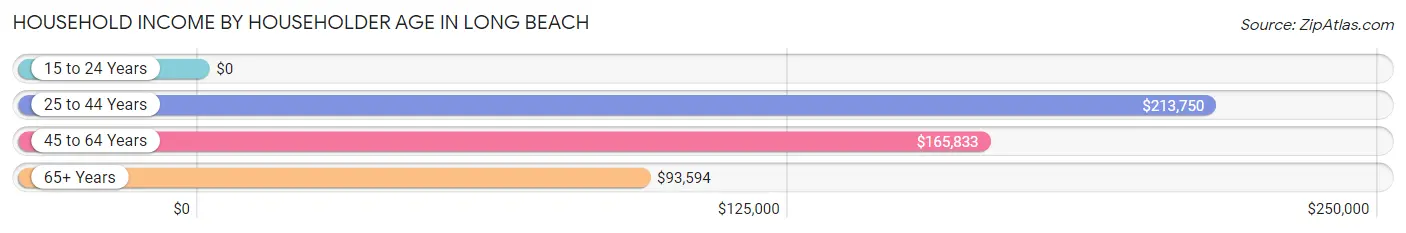
| Income Bracket | # Households | Median Income |
| 15 to 24 Years | 0 (0.0%) | $0 |
| 25 to 44 Years | 24 (3.8%) | $213,750 |
| 45 to 64 Years | 288 (45.8%) | $165,833 |
| 65+ Years | 317 (50.4%) | $93,594 |
| Total | 629 (100.0%) | $112,813 |
Poverty in Long Beach
Income Below Poverty by Sex and Age in Long Beach
With 3.7% poverty level for males and 9.4% for females among the residents of Long Beach, 16 and 17 year old males and 12 to 14 year old females are the most vulnerable to poverty, with 6 males (54.5%) and 7 females (58.3%) in their respective age groups living below the poverty level.
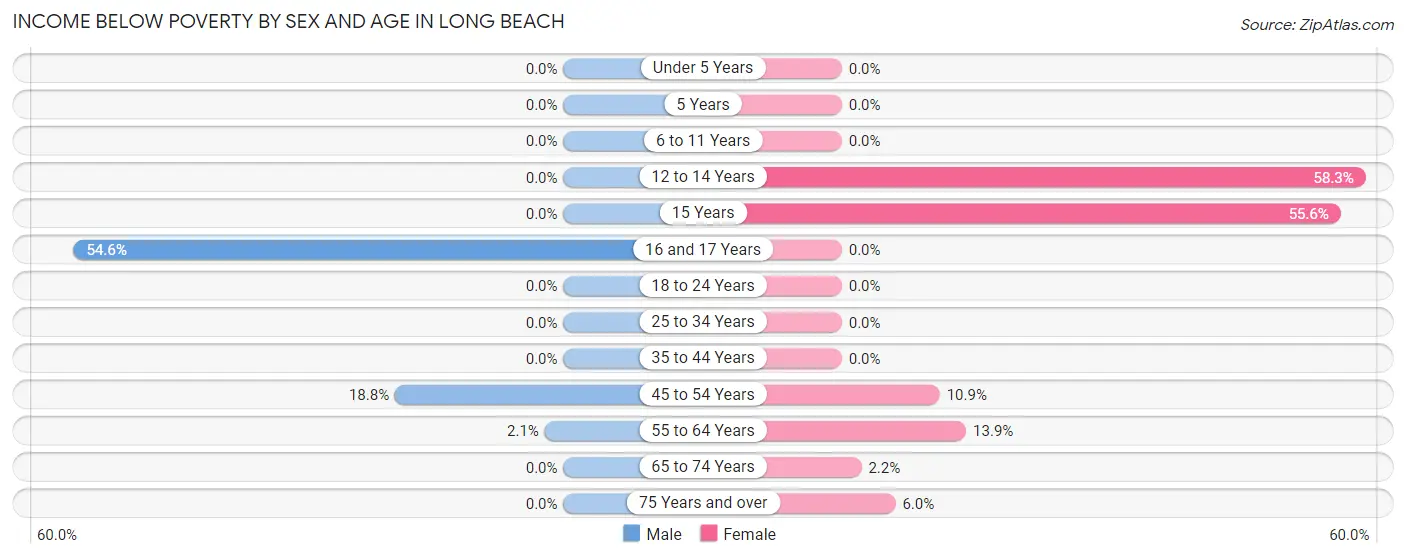
| Age Bracket | Male | Female |
| Under 5 Years | 0 (0.0%) | 0 (0.0%) |
| 5 Years | 0 (0.0%) | 0 (0.0%) |
| 6 to 11 Years | 0 (0.0%) | 0 (0.0%) |
| 12 to 14 Years | 0 (0.0%) | 7 (58.3%) |
| 15 Years | 0 (0.0%) | 5 (55.6%) |
| 16 and 17 Years | 6 (54.5%) | 0 (0.0%) |
| 18 to 24 Years | 0 (0.0%) | 0 (0.0%) |
| 25 to 34 Years | 0 (0.0%) | 0 (0.0%) |
| 35 to 44 Years | 0 (0.0%) | 0 (0.0%) |
| 45 to 54 Years | 12 (18.8%) | 6 (10.9%) |
| 55 to 64 Years | 4 (2.1%) | 27 (13.9%) |
| 65 to 74 Years | 0 (0.0%) | 3 (2.2%) |
| 75 Years and over | 0 (0.0%) | 7 (6.0%) |
| Total | 22 (3.7%) | 55 (9.4%) |
Income Above Poverty by Sex and Age in Long Beach
According to the poverty statistics in Long Beach, males aged under 5 years and females aged 6 to 11 years are the age groups that are most secure financially, with 100.0% of males and 100.0% of females in these age groups living above the poverty line.
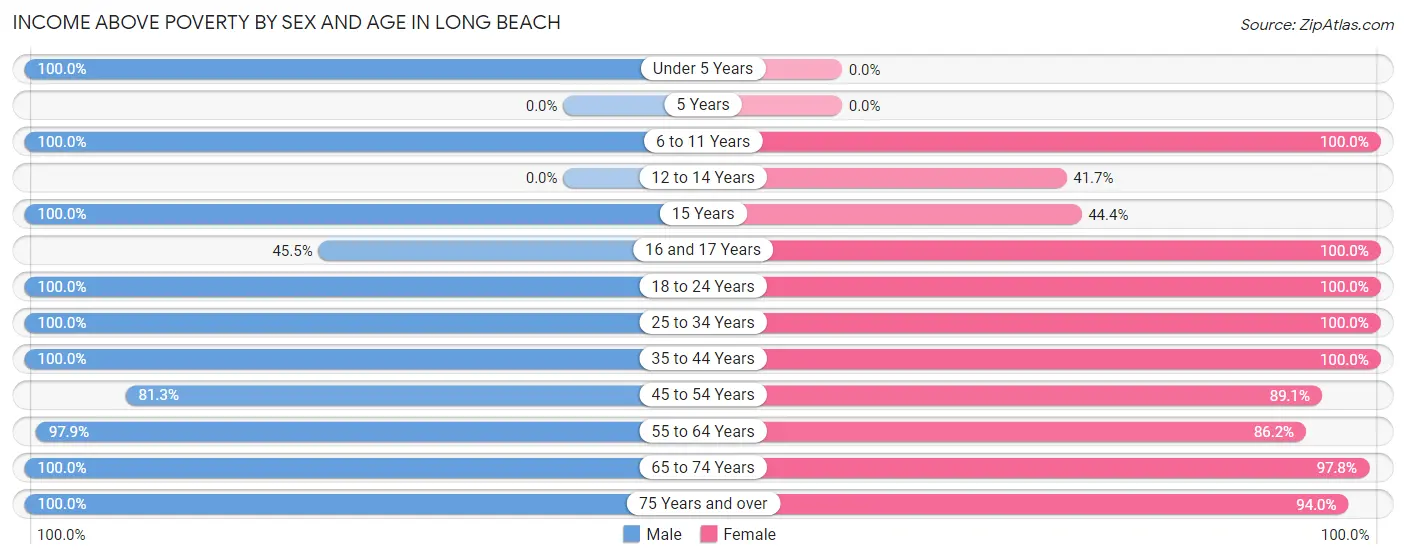
| Age Bracket | Male | Female |
| Under 5 Years | 17 (100.0%) | 0 (0.0%) |
| 5 Years | 0 (0.0%) | 0 (0.0%) |
| 6 to 11 Years | 1 (100.0%) | 6 (100.0%) |
| 12 to 14 Years | 0 (0.0%) | 5 (41.7%) |
| 15 Years | 2 (100.0%) | 4 (44.4%) |
| 16 and 17 Years | 5 (45.5%) | 7 (100.0%) |
| 18 to 24 Years | 11 (100.0%) | 18 (100.0%) |
| 25 to 34 Years | 33 (100.0%) | 16 (100.0%) |
| 35 to 44 Years | 17 (100.0%) | 11 (100.0%) |
| 45 to 54 Years | 52 (81.2%) | 49 (89.1%) |
| 55 to 64 Years | 188 (97.9%) | 168 (86.2%) |
| 65 to 74 Years | 134 (100.0%) | 134 (97.8%) |
| 75 Years and over | 119 (100.0%) | 110 (94.0%) |
| Total | 579 (96.3%) | 528 (90.6%) |
Income Below Poverty Among Married-Couple Families in Long Beach
The poverty statistics for married-couple families in Long Beach show that 3.9% or 15 of the total 383 families live below the poverty line. Families with 3 or 4 children have the highest poverty rate of 77.8%, comprising of 7 families. On the other hand, families with 1 or 2 children have the lowest poverty rate of 0.0%, which includes 0 families.
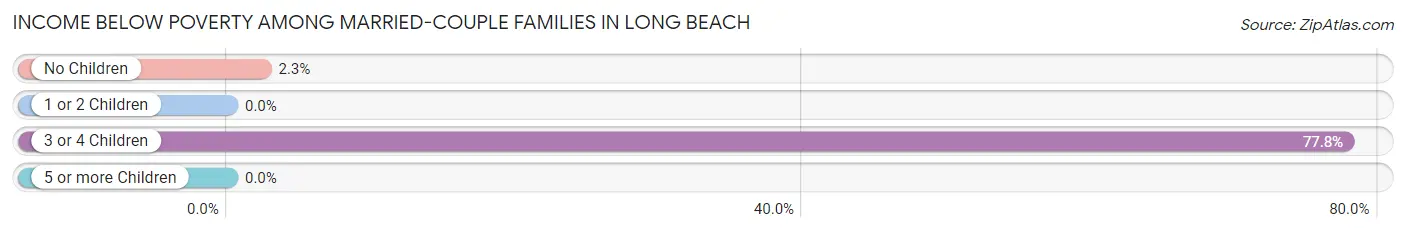
| Children | Above Poverty | Below Poverty |
| No Children | 335 (97.7%) | 8 (2.3%) |
| 1 or 2 Children | 31 (100.0%) | 0 (0.0%) |
| 3 or 4 Children | 2 (22.2%) | 7 (77.8%) |
| 5 or more Children | 0 (0.0%) | 0 (0.0%) |
| Total | 368 (96.1%) | 15 (3.9%) |
Income Below Poverty Among Single-Parent Households in Long Beach
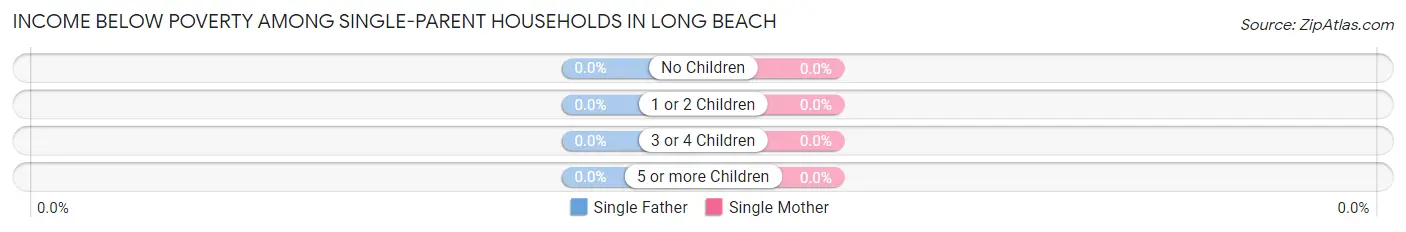
| Children | Single Father | Single Mother |
| No Children | 0 (0.0%) | 0 (0.0%) |
| 1 or 2 Children | 0 (0.0%) | 0 (0.0%) |
| 3 or 4 Children | 0 (0.0%) | 0 (0.0%) |
| 5 or more Children | 0 (0.0%) | 0 (0.0%) |
| Total | 0 (0.0%) | 0 (0.0%) |
Income Below Poverty Among Married-Couple vs Single-Parent Households in Long Beach
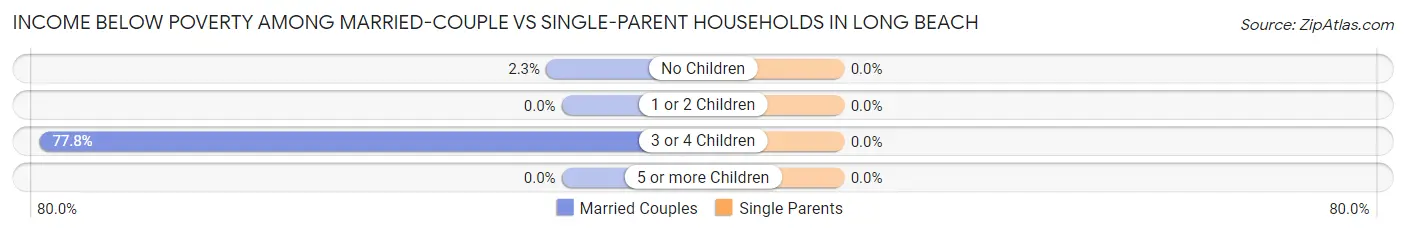
| Children | Married-Couple Families | Single-Parent Households |
| No Children | 8 (2.3%) | 0 (0.0%) |
| 1 or 2 Children | 0 (0.0%) | 0 (0.0%) |
| 3 or 4 Children | 7 (77.8%) | 0 (0.0%) |
| 5 or more Children | 0 (0.0%) | 0 (0.0%) |
| Total | 15 (3.9%) | 0 (0.0%) |
Employment Characteristics in Long Beach
Employment by Class of Employer in Long Beach
Among the 536 employed individuals in Long Beach, private company employees (258 | 48.1%), self-employed (incorporated) (131 | 24.4%), and not-for-profit organizations (66 | 12.3%) make up the most common classes of employment.
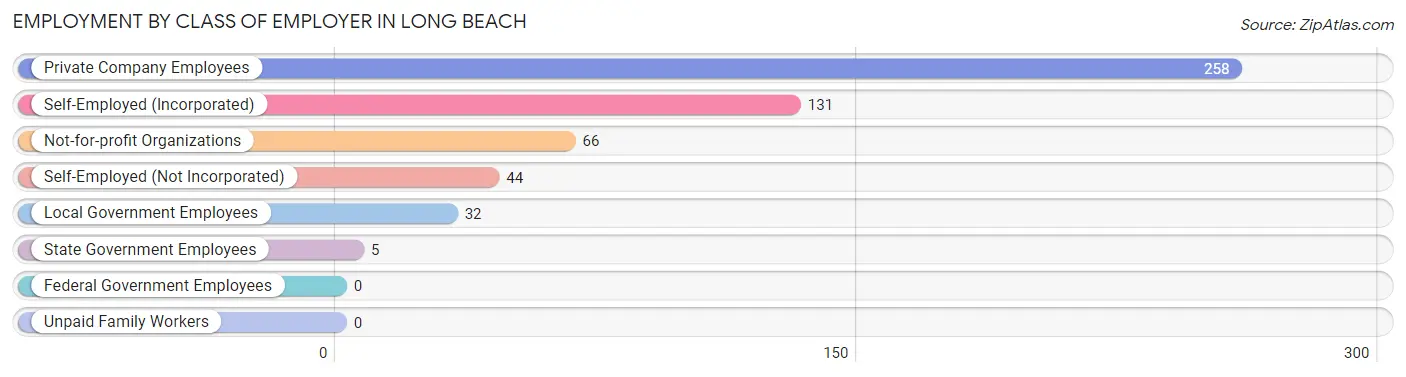
| Employer Class | # Employees | % Employees |
| Private Company Employees | 258 | 48.1% |
| Self-Employed (Incorporated) | 131 | 24.4% |
| Self-Employed (Not Incorporated) | 44 | 8.2% |
| Not-for-profit Organizations | 66 | 12.3% |
| Local Government Employees | 32 | 6.0% |
| State Government Employees | 5 | 0.9% |
| Federal Government Employees | 0 | 0.0% |
| Unpaid Family Workers | 0 | 0.0% |
| Total | 536 | 100.0% |
Employment Status by Age in Long Beach
According to the labor force statistics for Long Beach, out of the total population over 16 years of age (1,137), 50.5% or 574 individuals are in the labor force, with 2.6% or 15 of them unemployed. The age group with the highest labor force participation rate is 25 to 29 years, with 100.0% or 21 individuals in the labor force. Within the labor force, the 45 to 54 years age range has the highest percentage of unemployed individuals, with 9.2% or 7 of them being unemployed.
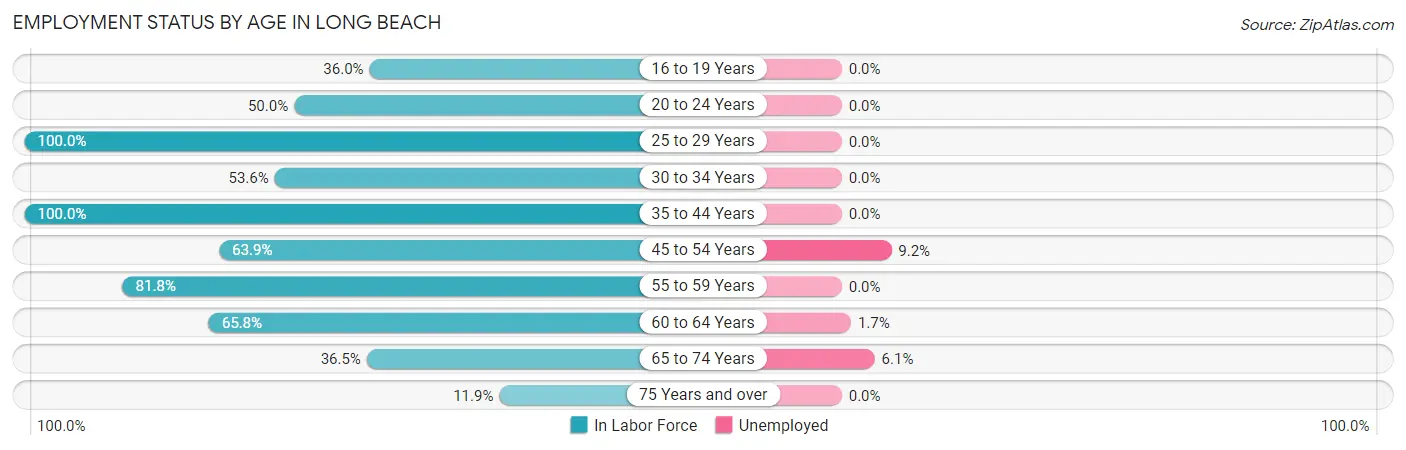
| Age Bracket | In Labor Force | Unemployed |
| 16 to 19 Years | 9 (36.0%) | 0 (0.0%) |
| 20 to 24 Years | 11 (50.0%) | 0 (0.0%) |
| 25 to 29 Years | 21 (100.0%) | 0 (0.0%) |
| 30 to 34 Years | 15 (53.6%) | 0 (0.0%) |
| 35 to 44 Years | 28 (100.0%) | 0 (0.0%) |
| 45 to 54 Years | 76 (63.9%) | 7 (9.2%) |
| 55 to 59 Years | 166 (81.8%) | 0 (0.0%) |
| 60 to 64 Years | 121 (65.8%) | 2 (1.7%) |
| 65 to 74 Years | 99 (36.5%) | 6 (6.1%) |
| 75 Years and over | 28 (11.9%) | 0 (0.0%) |
| Total | 574 (50.5%) | 15 (2.6%) |
Employment Status by Educational Attainment in Long Beach
According to labor force statistics for Long Beach, 73.2% of individuals (427) out of the total population between 25 and 64 years of age (583) are in the labor force, with 2.1% or 9 of them being unemployed. The group with the highest labor force participation rate are those with the educational attainment of college / associate degree, with 90.4% or 75 individuals in the labor force. Within the labor force, individuals with college / associate degree education have the highest percentage of unemployment, with 9.3% or 7 of them being unemployed.
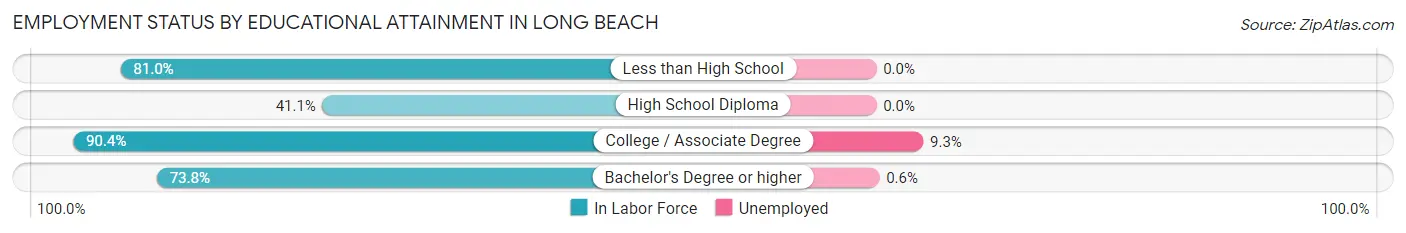
| Educational Attainment | In Labor Force | Unemployed |
| Less than High School | 17 (81.0%) | 0 (0.0%) |
| High School Diploma | 23 (41.1%) | 0 (0.0%) |
| College / Associate Degree | 75 (90.4%) | 8 (9.3%) |
| Bachelor's Degree or higher | 312 (73.8%) | 3 (0.6%) |
| Total | 427 (73.2%) | 12 (2.1%) |
Employment Occupations by Sex in Long Beach
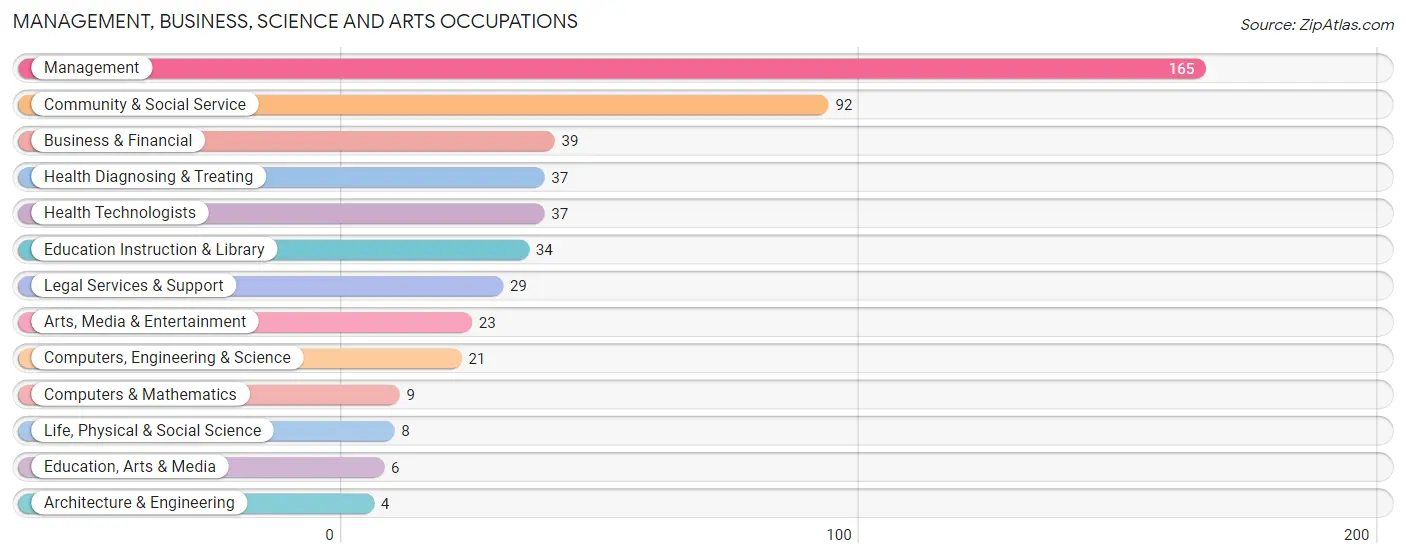
Management, Business, Science and Arts Occupations
The most common Management, Business, Science and Arts occupations in Long Beach are Management (165 | 29.5%), Community & Social Service (92 | 16.5%), Business & Financial (39 | 7.0%), Health Diagnosing & Treating (37 | 6.6%), and Health Technologists (37 | 6.6%).
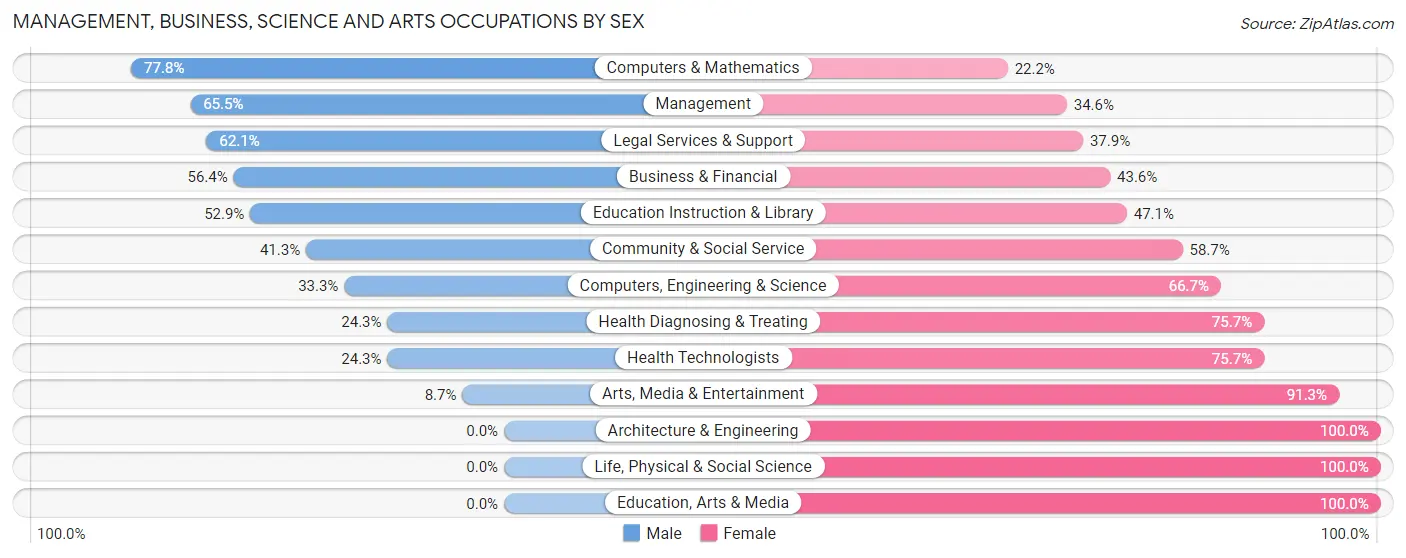
Management, Business, Science and Arts Occupations by Sex
Within the Management, Business, Science and Arts occupations in Long Beach, the most male-oriented occupations are Computers & Mathematics (77.8%), Management (65.4%), and Legal Services & Support (62.1%), while the most female-oriented occupations are Architecture & Engineering (100.0%), Life, Physical & Social Science (100.0%), and Education, Arts & Media (100.0%).
| Occupation | Male | Female |
| Management | 108 (65.4%) | 57 (34.5%) |
| Business & Financial | 22 (56.4%) | 17 (43.6%) |
| Computers, Engineering & Science | 7 (33.3%) | 14 (66.7%) |
| Computers & Mathematics | 7 (77.8%) | 2 (22.2%) |
| Architecture & Engineering | 0 (0.0%) | 4 (100.0%) |
| Life, Physical & Social Science | 0 (0.0%) | 8 (100.0%) |
| Community & Social Service | 38 (41.3%) | 54 (58.7%) |
| Education, Arts & Media | 0 (0.0%) | 6 (100.0%) |
| Legal Services & Support | 18 (62.1%) | 11 (37.9%) |
| Education Instruction & Library | 18 (52.9%) | 16 (47.1%) |
| Arts, Media & Entertainment | 2 (8.7%) | 21 (91.3%) |
| Health Diagnosing & Treating | 9 (24.3%) | 28 (75.7%) |
| Health Technologists | 9 (24.3%) | 28 (75.7%) |
| Total (Category) | 184 (52.0%) | 170 (48.0%) |
| Total (Overall) | 353 (63.1%) | 206 (36.8%) |
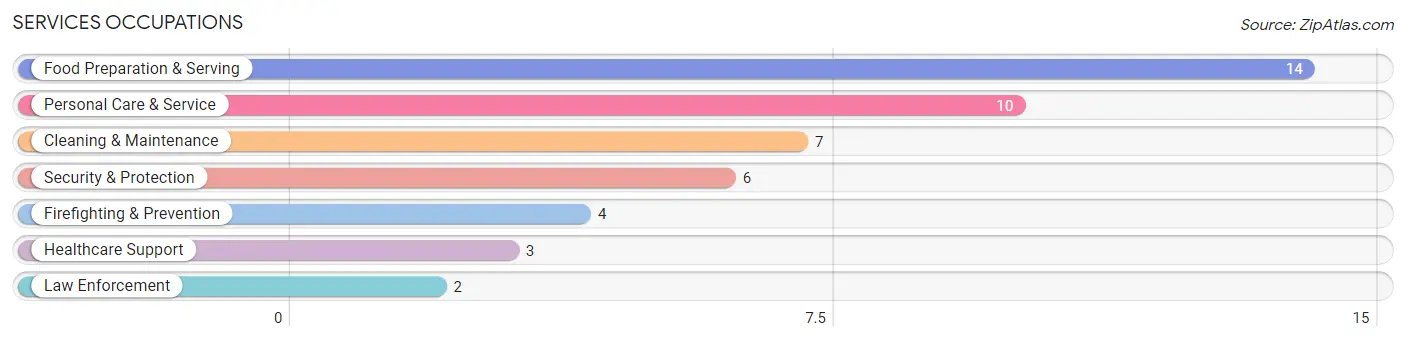
Services Occupations
The most common Services occupations in Long Beach are Food Preparation & Serving (14 | 2.5%), Personal Care & Service (10 | 1.8%), Cleaning & Maintenance (7 | 1.3%), Security & Protection (6 | 1.1%), and Firefighting & Prevention (4 | 0.7%).
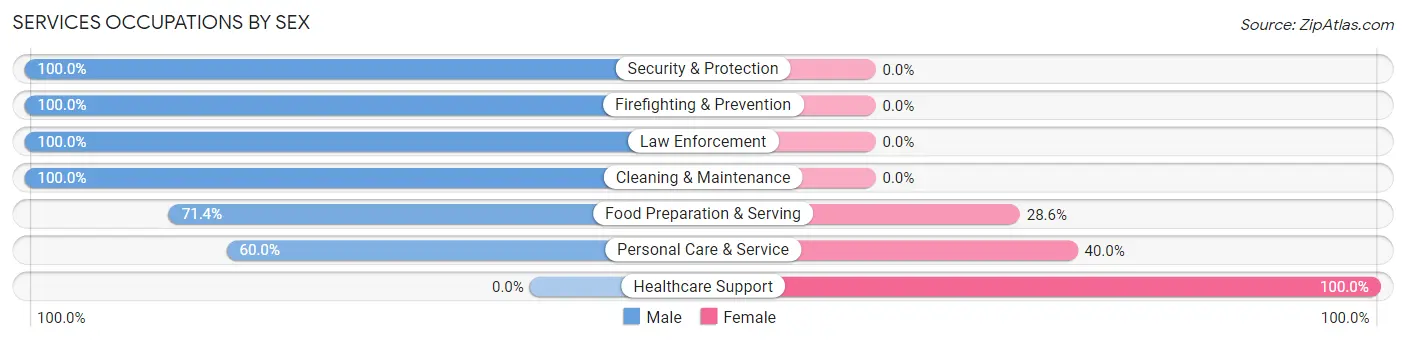
Services Occupations by Sex
Within the Services occupations in Long Beach, the most male-oriented occupations are Security & Protection (100.0%), Firefighting & Prevention (100.0%), and Law Enforcement (100.0%), while the most female-oriented occupations are Healthcare Support (100.0%), Personal Care & Service (40.0%), and Food Preparation & Serving (28.6%).
| Occupation | Male | Female |
| Healthcare Support | 0 (0.0%) | 3 (100.0%) |
| Security & Protection | 6 (100.0%) | 0 (0.0%) |
| Firefighting & Prevention | 4 (100.0%) | 0 (0.0%) |
| Law Enforcement | 2 (100.0%) | 0 (0.0%) |
| Food Preparation & Serving | 10 (71.4%) | 4 (28.6%) |
| Cleaning & Maintenance | 7 (100.0%) | 0 (0.0%) |
| Personal Care & Service | 6 (60.0%) | 4 (40.0%) |
| Total (Category) | 29 (72.5%) | 11 (27.5%) |
| Total (Overall) | 353 (63.1%) | 206 (36.8%) |
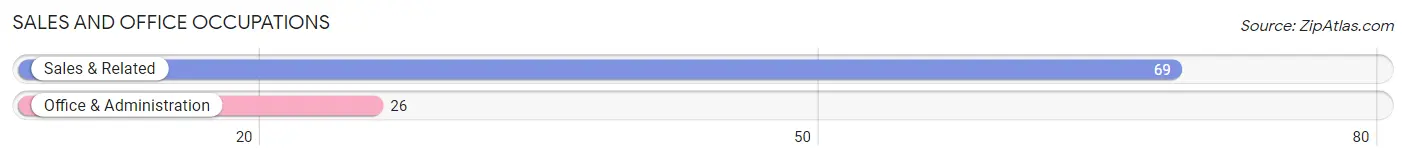
Sales and Office Occupations
The most common Sales and Office occupations in Long Beach are Sales & Related (69 | 12.3%), and Office & Administration (26 | 4.6%).
Sales and Office Occupations by Sex
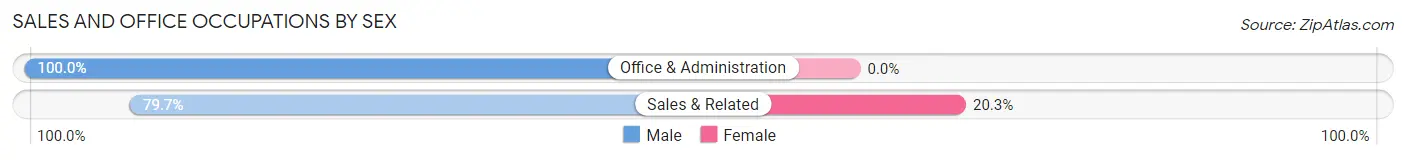
| Occupation | Male | Female |
| Sales & Related | 55 (79.7%) | 14 (20.3%) |
| Office & Administration | 26 (100.0%) | 0 (0.0%) |
| Total (Category) | 81 (85.3%) | 14 (14.7%) |
| Total (Overall) | 353 (63.1%) | 206 (36.8%) |
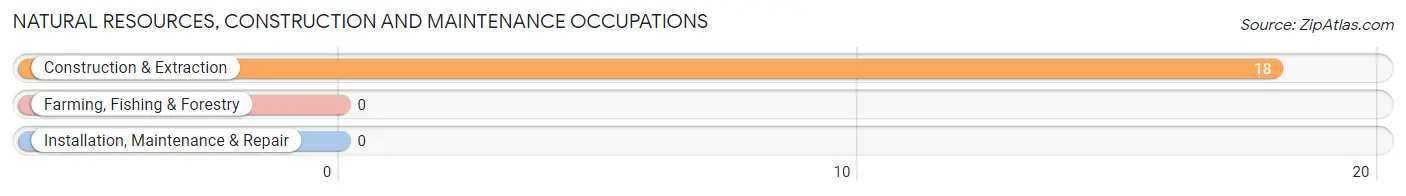
Natural Resources, Construction and Maintenance Occupations
The most common Natural Resources, Construction and Maintenance occupations in Long Beach are , and Construction & Extraction (18 | 3.2%).
Natural Resources, Construction and Maintenance Occupations by Sex
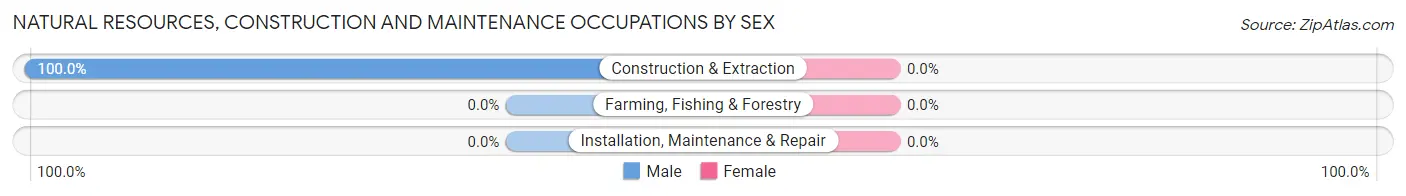
| Occupation | Male | Female |
| Farming, Fishing & Forestry | 0 (0.0%) | 0 (0.0%) |
| Construction & Extraction | 18 (100.0%) | 0 (0.0%) |
| Installation, Maintenance & Repair | 0 (0.0%) | 0 (0.0%) |
| Total (Category) | 18 (100.0%) | 0 (0.0%) |
| Total (Overall) | 353 (63.1%) | 206 (36.8%) |
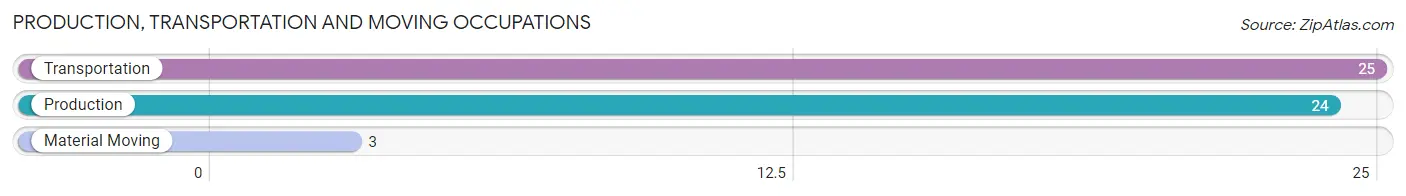
Production, Transportation and Moving Occupations
The most common Production, Transportation and Moving occupations in Long Beach are Transportation (25 | 4.5%), Production (24 | 4.3%), and Material Moving (3 | 0.5%).
Production, Transportation and Moving Occupations by Sex
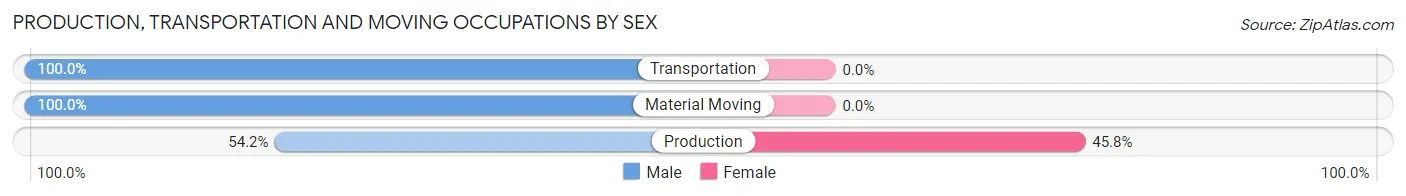
| Occupation | Male | Female |
| Production | 13 (54.2%) | 11 (45.8%) |
| Transportation | 25 (100.0%) | 0 (0.0%) |
| Material Moving | 3 (100.0%) | 0 (0.0%) |
| Total (Category) | 41 (78.8%) | 11 (21.1%) |
| Total (Overall) | 353 (63.1%) | 206 (36.8%) |
Employment Industries by Sex in Long Beach
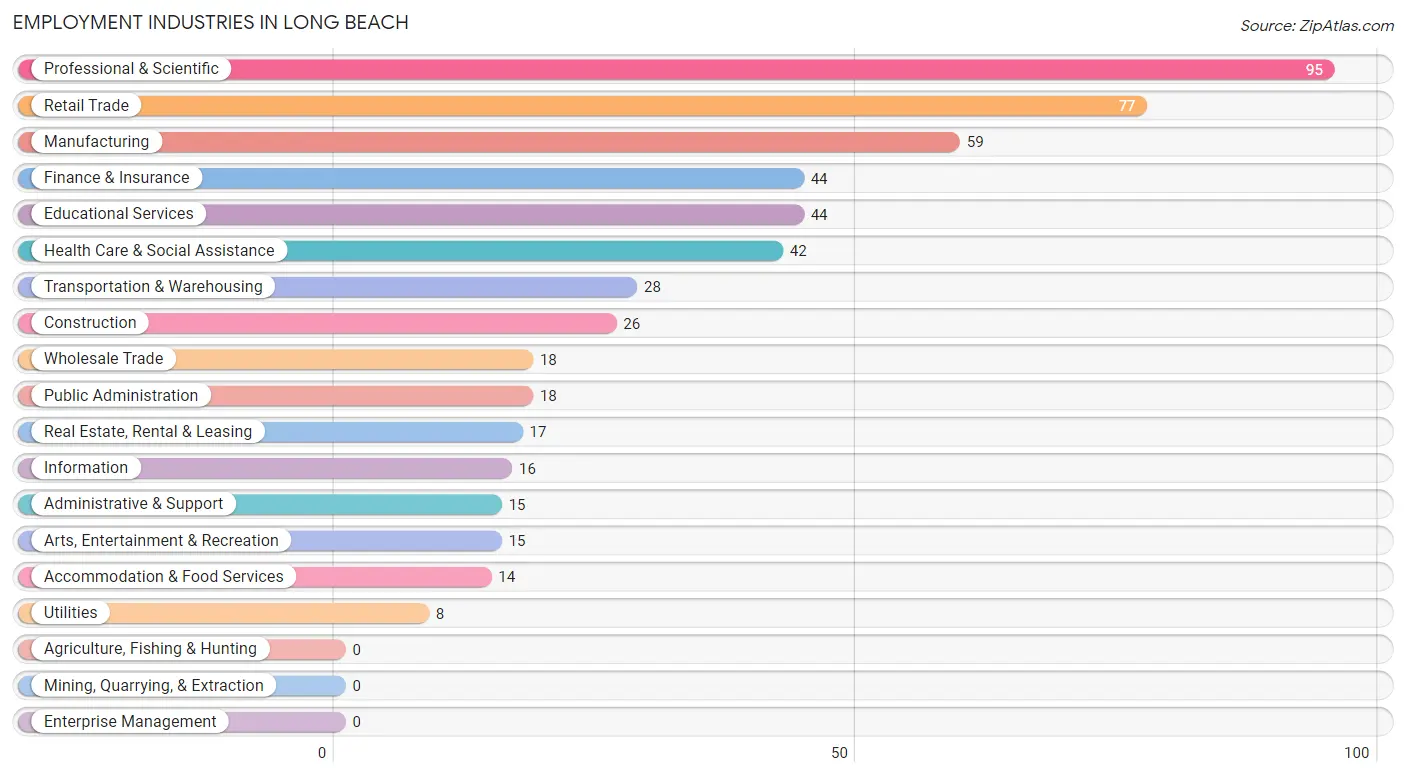
Employment Industries in Long Beach
The major employment industries in Long Beach include Professional & Scientific (95 | 17.0%), Retail Trade (77 | 13.8%), Manufacturing (59 | 10.5%), Finance & Insurance (44 | 7.9%), and Educational Services (44 | 7.9%).
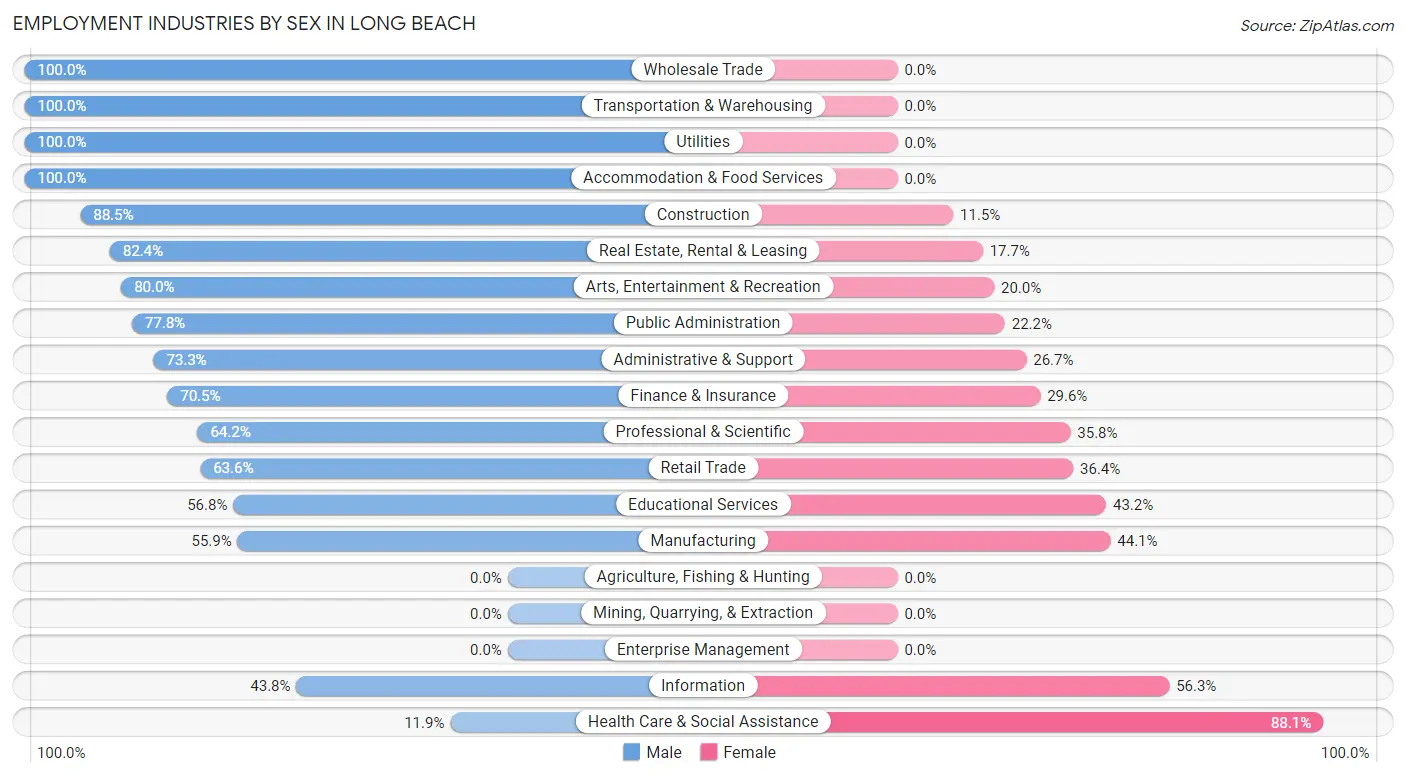
Employment Industries by Sex in Long Beach
The Long Beach industries that see more men than women are Wholesale Trade (100.0%), Transportation & Warehousing (100.0%), and Utilities (100.0%), whereas the industries that tend to have a higher number of women are Health Care & Social Assistance (88.1%), Information (56.2%), and Manufacturing (44.1%).
| Industry | Male | Female |
| Agriculture, Fishing & Hunting | 0 (0.0%) | 0 (0.0%) |
| Mining, Quarrying, & Extraction | 0 (0.0%) | 0 (0.0%) |
| Construction | 23 (88.5%) | 3 (11.5%) |
| Manufacturing | 33 (55.9%) | 26 (44.1%) |
| Wholesale Trade | 18 (100.0%) | 0 (0.0%) |
| Retail Trade | 49 (63.6%) | 28 (36.4%) |
| Transportation & Warehousing | 28 (100.0%) | 0 (0.0%) |
| Utilities | 8 (100.0%) | 0 (0.0%) |
| Information | 7 (43.8%) | 9 (56.2%) |
| Finance & Insurance | 31 (70.5%) | 13 (29.5%) |
| Real Estate, Rental & Leasing | 14 (82.4%) | 3 (17.6%) |
| Professional & Scientific | 61 (64.2%) | 34 (35.8%) |
| Enterprise Management | 0 (0.0%) | 0 (0.0%) |
| Administrative & Support | 11 (73.3%) | 4 (26.7%) |
| Educational Services | 25 (56.8%) | 19 (43.2%) |
| Health Care & Social Assistance | 5 (11.9%) | 37 (88.1%) |
| Arts, Entertainment & Recreation | 12 (80.0%) | 3 (20.0%) |
| Accommodation & Food Services | 14 (100.0%) | 0 (0.0%) |
| Public Administration | 14 (77.8%) | 4 (22.2%) |
| Total | 353 (63.1%) | 206 (36.8%) |
Education in Long Beach
School Enrollment in Long Beach
The most common levels of schooling among the 108 students in Long Beach are college / undergraduate (44 | 40.7%), high school (32 | 29.6%), and middle school (13 | 12.0%).
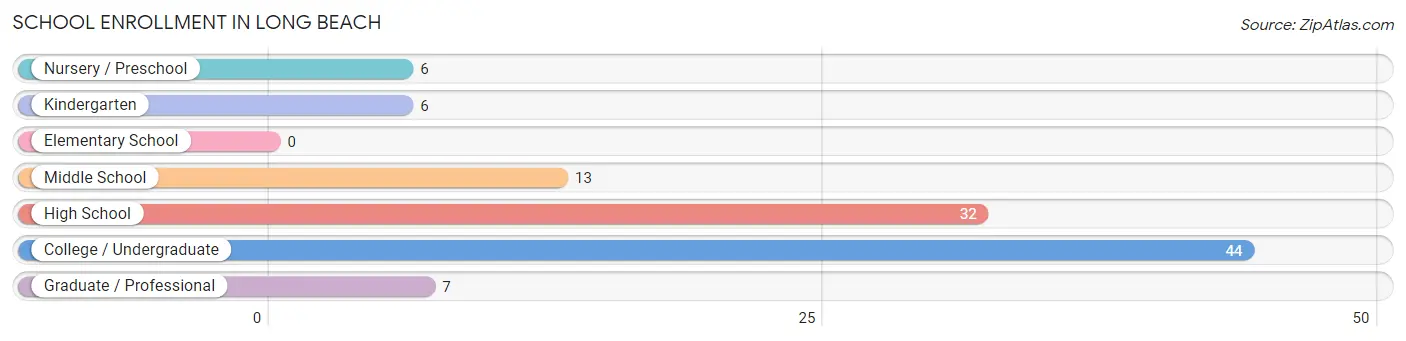
| School Level | # Students | % Students |
| Nursery / Preschool | 6 | 5.6% |
| Kindergarten | 6 | 5.6% |
| Elementary School | 0 | 0.0% |
| Middle School | 13 | 12.0% |
| High School | 32 | 29.6% |
| College / Undergraduate | 44 | 40.7% |
| Graduate / Professional | 7 | 6.5% |
| Total | 108 | 100.0% |
School Enrollment by Age by Funding Source in Long Beach
Out of a total of 108 students who are enrolled in schools in Long Beach, 66 (61.1%) attend a private institution, while the remaining 42 (38.9%) are enrolled in public schools. The age group of 3 to 4 year olds has the highest likelihood of being enrolled in private schools, with 6 (100.0% in the age bracket) enrolled. Conversely, the age group of 5 to 9 year old has the lowest likelihood of being enrolled in a private school, with 6 (100.0% in the age bracket) attending a public institution.
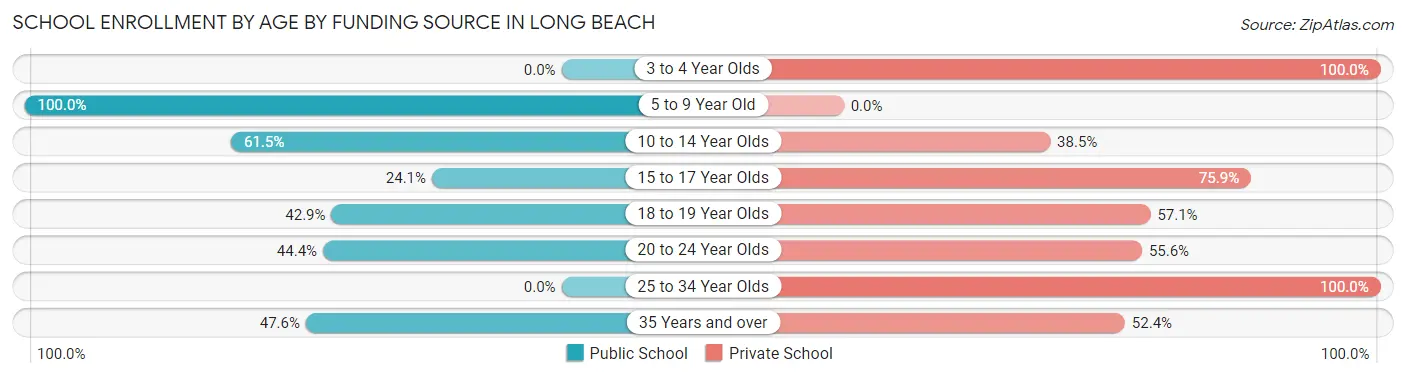
| Age Bracket | Public School | Private School |
| 3 to 4 Year Olds | 0 (0.0%) | 6 (100.0%) |
| 5 to 9 Year Old | 6 (100.0%) | 0 (0.0%) |
| 10 to 14 Year Olds | 8 (61.5%) | 5 (38.5%) |
| 15 to 17 Year Olds | 7 (24.1%) | 22 (75.9%) |
| 18 to 19 Year Olds | 3 (42.9%) | 4 (57.1%) |
| 20 to 24 Year Olds | 8 (44.4%) | 10 (55.6%) |
| 25 to 34 Year Olds | 0 (0.0%) | 8 (100.0%) |
| 35 Years and over | 10 (47.6%) | 11 (52.4%) |
| Total | 42 (38.9%) | 66 (61.1%) |
Educational Attainment by Field of Study in Long Beach
Business (182 | 22.3%), social sciences (114 | 14.0%), science & technology (90 | 11.0%), literature & languages (83 | 10.2%), and education (78 | 9.6%) are the most common fields of study among 817 individuals in Long Beach who have obtained a bachelor's degree or higher.
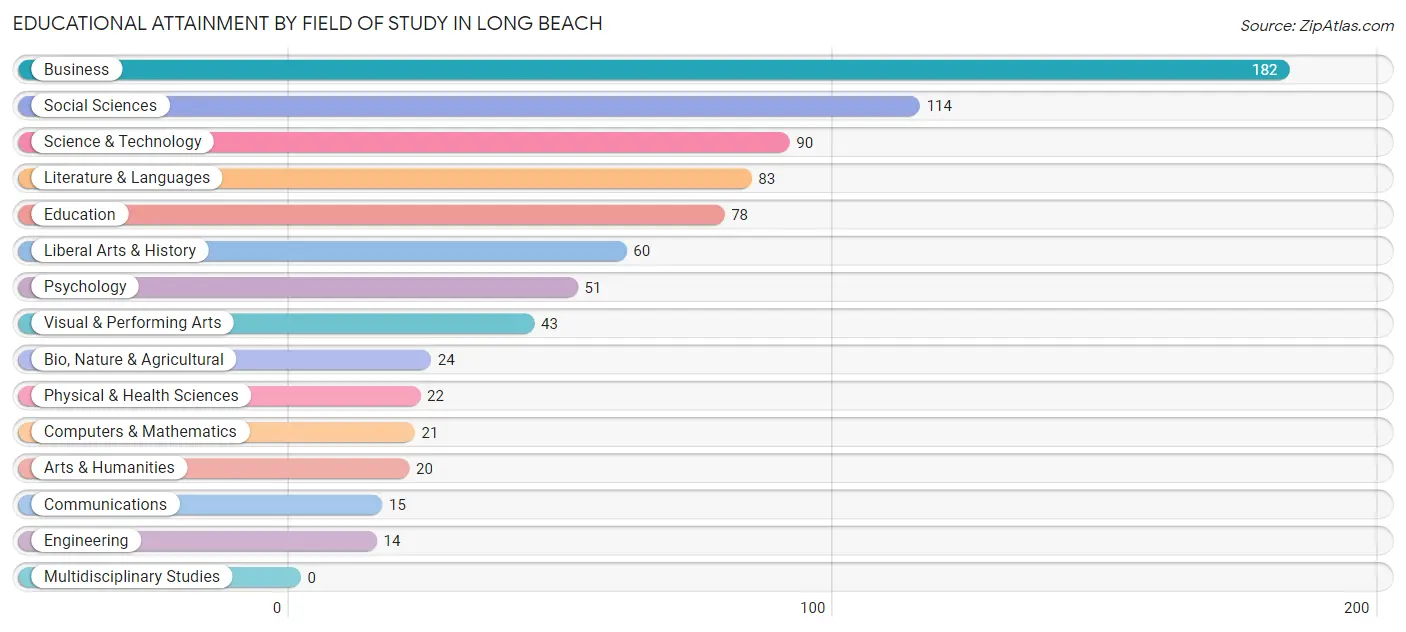
| Field of Study | # Graduates | % Graduates |
| Computers & Mathematics | 21 | 2.6% |
| Bio, Nature & Agricultural | 24 | 2.9% |
| Physical & Health Sciences | 22 | 2.7% |
| Psychology | 51 | 6.2% |
| Social Sciences | 114 | 14.0% |
| Engineering | 14 | 1.7% |
| Multidisciplinary Studies | 0 | 0.0% |
| Science & Technology | 90 | 11.0% |
| Business | 182 | 22.3% |
| Education | 78 | 9.6% |
| Literature & Languages | 83 | 10.2% |
| Liberal Arts & History | 60 | 7.3% |
| Visual & Performing Arts | 43 | 5.3% |
| Communications | 15 | 1.8% |
| Arts & Humanities | 20 | 2.5% |
| Total | 817 | 100.0% |
Transportation & Commute in Long Beach
Vehicle Availability by Sex in Long Beach
The most prevalent vehicle ownership categories in Long Beach are males with 2 vehicles (214, accounting for 62.9%) and females with 2 vehicles (101, making up 109.2%).
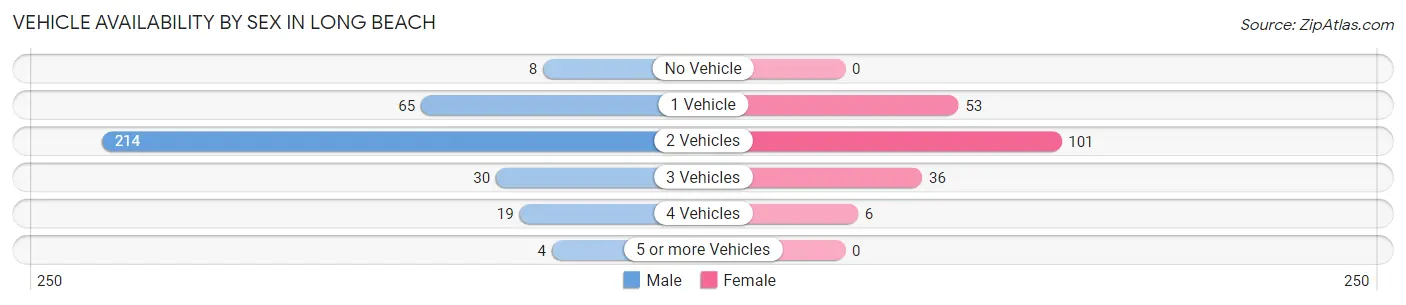
| Vehicles Available | Male | Female |
| No Vehicle | 8 (2.4%) | 0 (0.0%) |
| 1 Vehicle | 65 (19.1%) | 53 (27.0%) |
| 2 Vehicles | 214 (62.9%) | 101 (51.5%) |
| 3 Vehicles | 30 (8.8%) | 36 (18.4%) |
| 4 Vehicles | 19 (5.6%) | 6 (3.1%) |
| 5 or more Vehicles | 4 (1.2%) | 0 (0.0%) |
| Total | 340 (100.0%) | 196 (100.0%) |
Commute Time in Long Beach
The most frequently occuring commute durations in Long Beach are 10 to 14 minutes (95 commuters, 21.8%), 45 to 59 minutes (62 commuters, 14.2%), and 5 to 9 minutes (54 commuters, 12.4%).
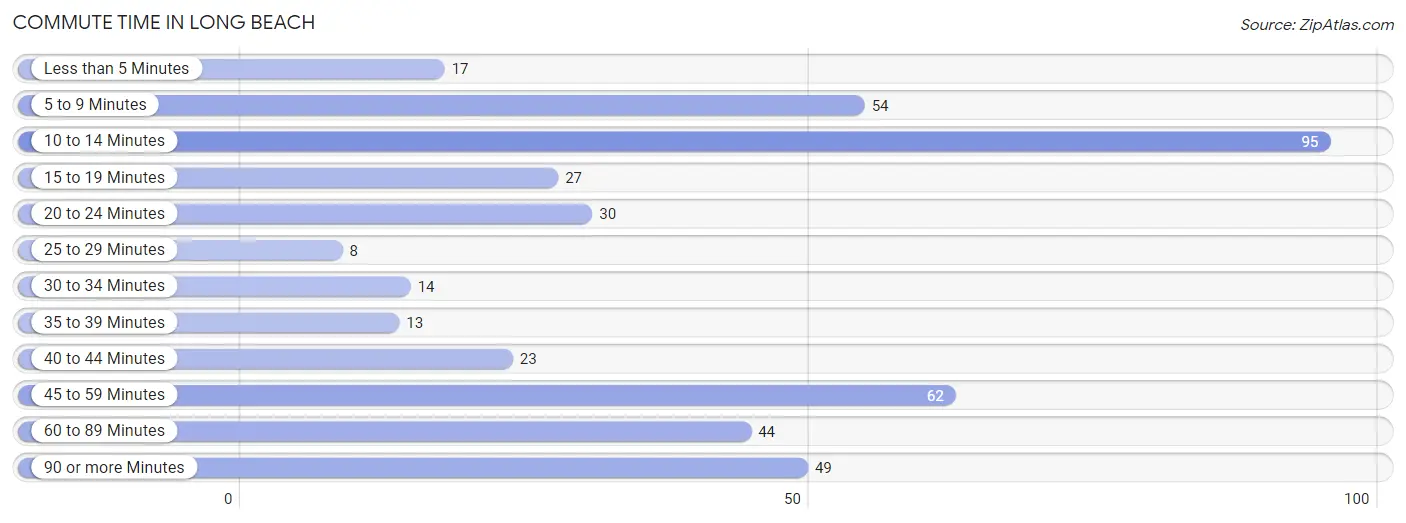
| Commute Time | # Commuters | % Commuters |
| Less than 5 Minutes | 17 | 3.9% |
| 5 to 9 Minutes | 54 | 12.4% |
| 10 to 14 Minutes | 95 | 21.8% |
| 15 to 19 Minutes | 27 | 6.2% |
| 20 to 24 Minutes | 30 | 6.9% |
| 25 to 29 Minutes | 8 | 1.8% |
| 30 to 34 Minutes | 14 | 3.2% |
| 35 to 39 Minutes | 13 | 3.0% |
| 40 to 44 Minutes | 23 | 5.3% |
| 45 to 59 Minutes | 62 | 14.2% |
| 60 to 89 Minutes | 44 | 10.1% |
| 90 or more Minutes | 49 | 11.2% |
Commute Time by Sex in Long Beach
The most common commute times in Long Beach are 10 to 14 minutes (75 commuters, 28.0%) for males and 45 to 59 minutes (40 commuters, 23.8%) for females.
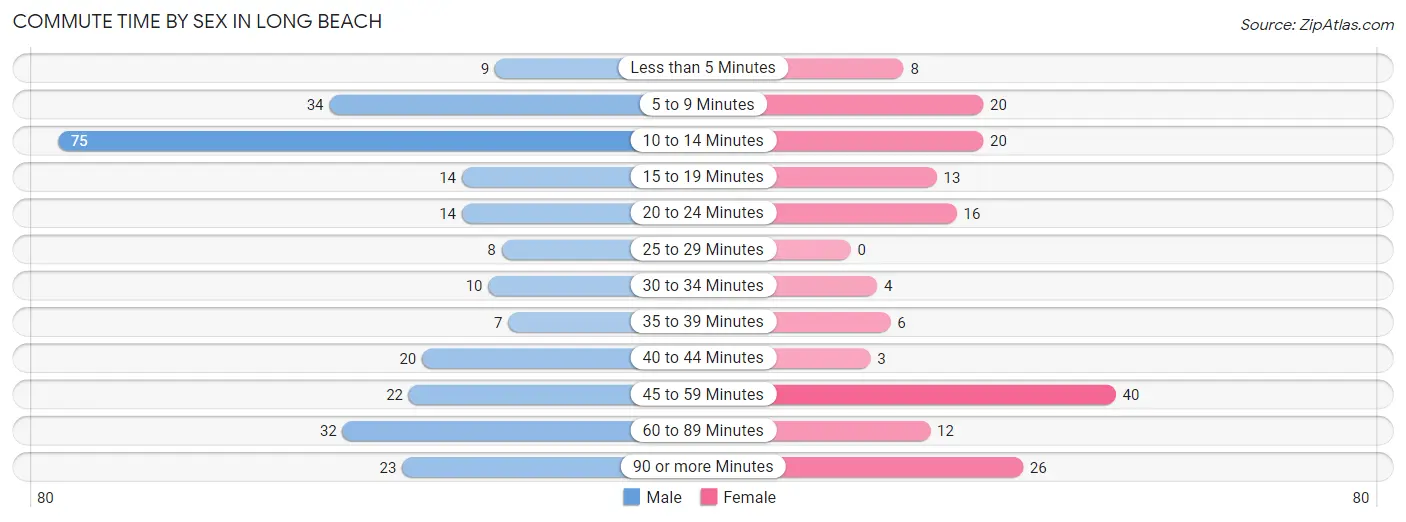
| Commute Time | Male | Female |
| Less than 5 Minutes | 9 (3.4%) | 8 (4.8%) |
| 5 to 9 Minutes | 34 (12.7%) | 20 (11.9%) |
| 10 to 14 Minutes | 75 (28.0%) | 20 (11.9%) |
| 15 to 19 Minutes | 14 (5.2%) | 13 (7.7%) |
| 20 to 24 Minutes | 14 (5.2%) | 16 (9.5%) |
| 25 to 29 Minutes | 8 (3.0%) | 0 (0.0%) |
| 30 to 34 Minutes | 10 (3.7%) | 4 (2.4%) |
| 35 to 39 Minutes | 7 (2.6%) | 6 (3.6%) |
| 40 to 44 Minutes | 20 (7.5%) | 3 (1.8%) |
| 45 to 59 Minutes | 22 (8.2%) | 40 (23.8%) |
| 60 to 89 Minutes | 32 (11.9%) | 12 (7.1%) |
| 90 or more Minutes | 23 (8.6%) | 26 (15.5%) |
Time of Departure to Work by Sex in Long Beach
The most frequent times of departure to work in Long Beach are 7:00 AM to 7:29 AM (56, 20.9%) for males and 8:00 AM to 8:29 AM (38, 22.6%) for females.
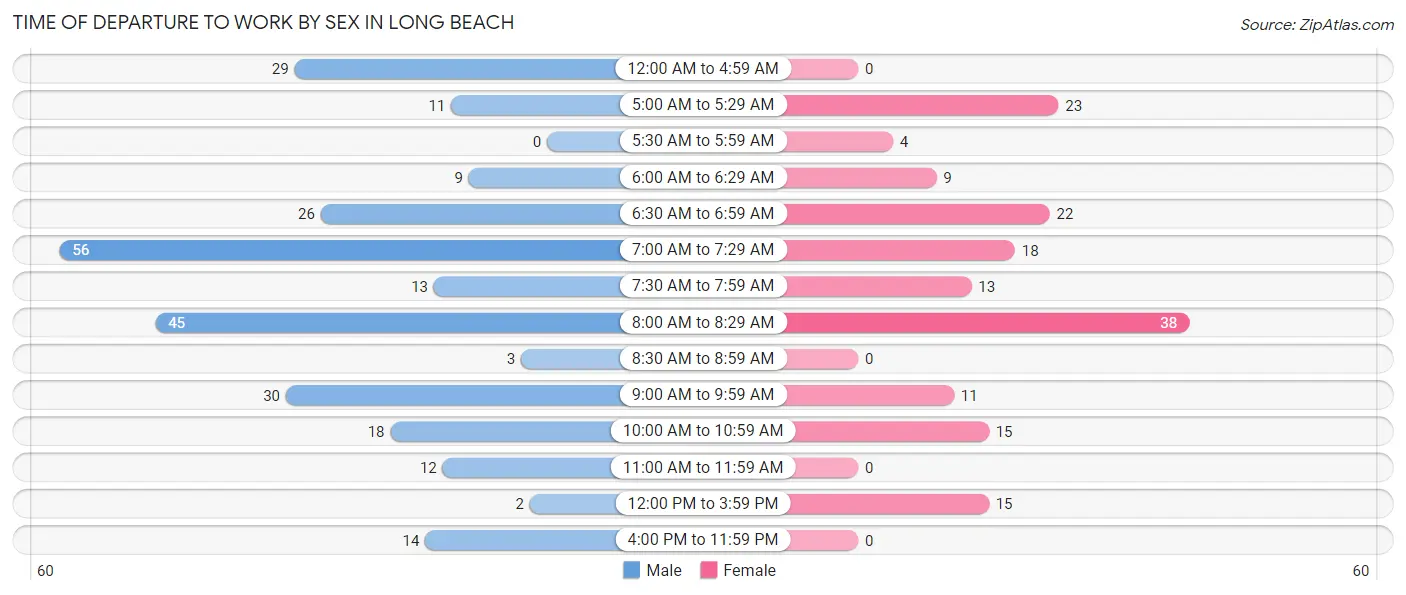
| Time of Departure | Male | Female |
| 12:00 AM to 4:59 AM | 29 (10.8%) | 0 (0.0%) |
| 5:00 AM to 5:29 AM | 11 (4.1%) | 23 (13.7%) |
| 5:30 AM to 5:59 AM | 0 (0.0%) | 4 (2.4%) |
| 6:00 AM to 6:29 AM | 9 (3.4%) | 9 (5.4%) |
| 6:30 AM to 6:59 AM | 26 (9.7%) | 22 (13.1%) |
| 7:00 AM to 7:29 AM | 56 (20.9%) | 18 (10.7%) |
| 7:30 AM to 7:59 AM | 13 (4.9%) | 13 (7.7%) |
| 8:00 AM to 8:29 AM | 45 (16.8%) | 38 (22.6%) |
| 8:30 AM to 8:59 AM | 3 (1.1%) | 0 (0.0%) |
| 9:00 AM to 9:59 AM | 30 (11.2%) | 11 (6.6%) |
| 10:00 AM to 10:59 AM | 18 (6.7%) | 15 (8.9%) |
| 11:00 AM to 11:59 AM | 12 (4.5%) | 0 (0.0%) |
| 12:00 PM to 3:59 PM | 2 (0.7%) | 15 (8.9%) |
| 4:00 PM to 11:59 PM | 14 (5.2%) | 0 (0.0%) |
| Total | 268 (100.0%) | 168 (100.0%) |
Housing Occupancy in Long Beach
Occupancy by Ownership in Long Beach
Of the total 629 dwellings in Long Beach, owner-occupied units account for 618 (98.3%), while renter-occupied units make up 11 (1.8%).
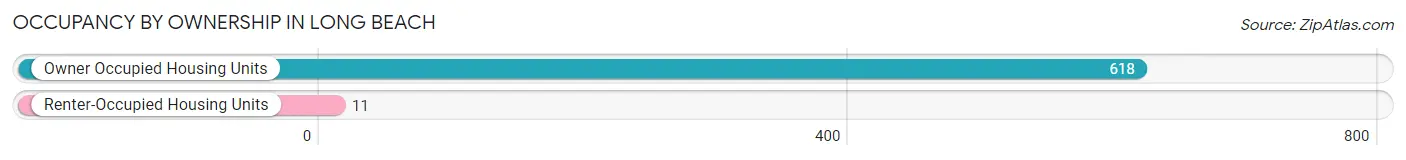
| Occupancy | # Housing Units | % Housing Units |
| Owner Occupied Housing Units | 618 | 98.3% |
| Renter-Occupied Housing Units | 11 | 1.8% |
| Total Occupied Housing Units | 629 | 100.0% |
Occupancy by Household Size in Long Beach
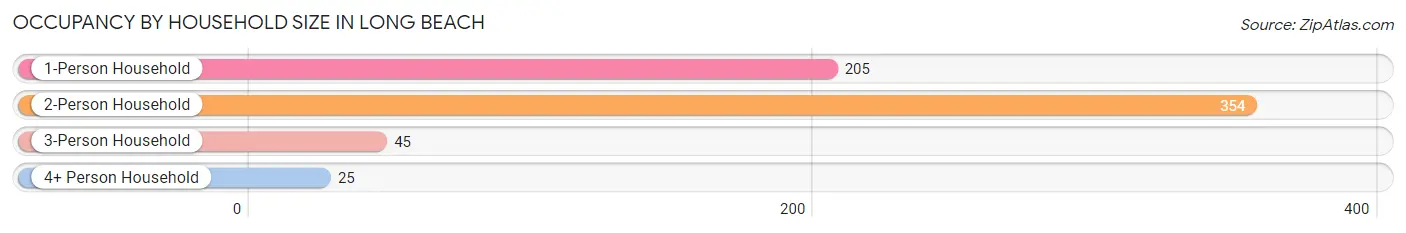
| Household Size | # Housing Units | % Housing Units |
| 1-Person Household | 205 | 32.6% |
| 2-Person Household | 354 | 56.3% |
| 3-Person Household | 45 | 7.1% |
| 4+ Person Household | 25 | 4.0% |
| Total Housing Units | 629 | 100.0% |
Occupancy by Ownership by Household Size in Long Beach
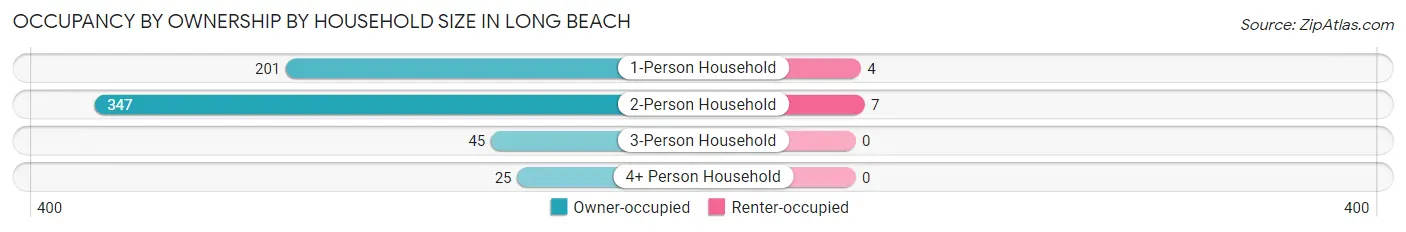
| Household Size | Owner-occupied | Renter-occupied |
| 1-Person Household | 201 (98.1%) | 4 (1.9%) |
| 2-Person Household | 347 (98.0%) | 7 (2.0%) |
| 3-Person Household | 45 (100.0%) | 0 (0.0%) |
| 4+ Person Household | 25 (100.0%) | 0 (0.0%) |
| Total Housing Units | 618 (98.3%) | 11 (1.8%) |
Occupancy by Educational Attainment in Long Beach
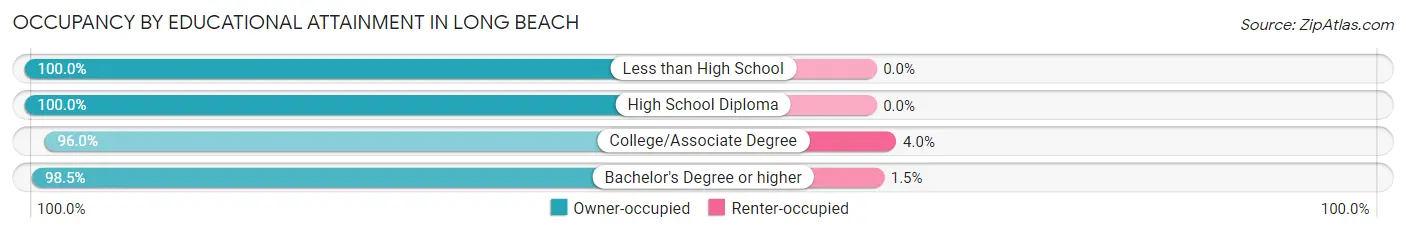
| Household Size | Owner-occupied | Renter-occupied |
| Less than High School | 7 (100.0%) | 0 (0.0%) |
| High School Diploma | 57 (100.0%) | 0 (0.0%) |
| College/Associate Degree | 97 (96.0%) | 4 (4.0%) |
| Bachelor's Degree or higher | 457 (98.5%) | 7 (1.5%) |
Occupancy by Age of Householder in Long Beach
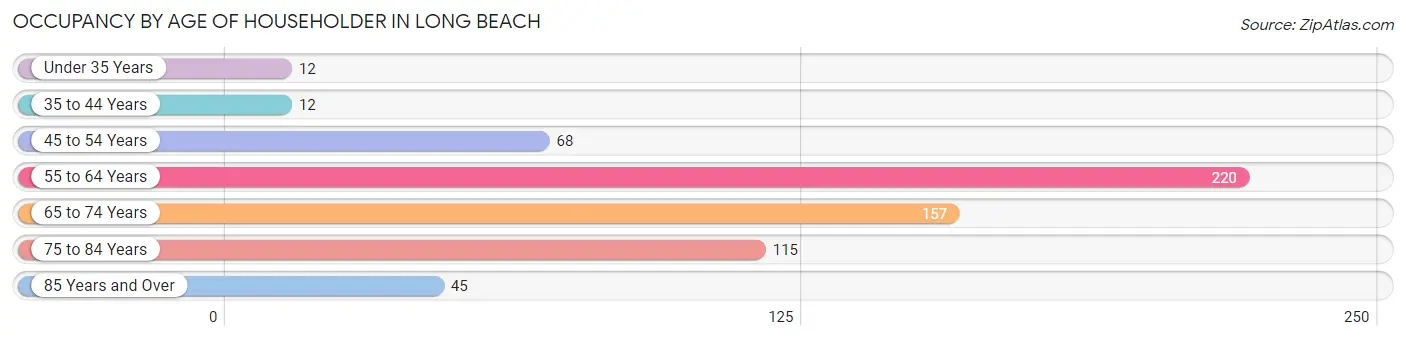
| Age Bracket | # Households | % Households |
| Under 35 Years | 12 | 1.9% |
| 35 to 44 Years | 12 | 1.9% |
| 45 to 54 Years | 68 | 10.8% |
| 55 to 64 Years | 220 | 35.0% |
| 65 to 74 Years | 157 | 25.0% |
| 75 to 84 Years | 115 | 18.3% |
| 85 Years and Over | 45 | 7.1% |
| Total | 629 | 100.0% |
Housing Finances in Long Beach
Median Income by Occupancy in Long Beach
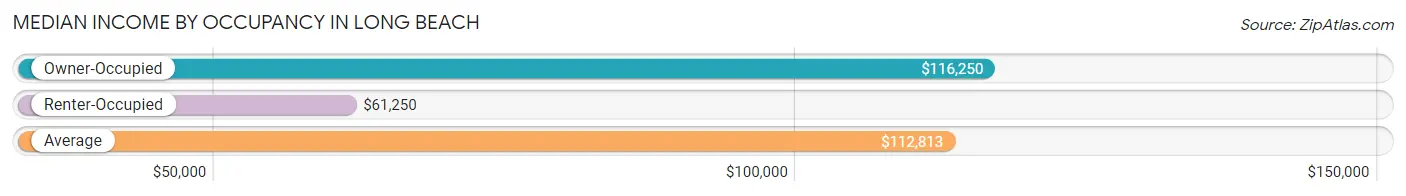
| Occupancy Type | # Households | Median Income |
| Owner-Occupied | 618 (98.3%) | $116,250 |
| Renter-Occupied | 11 (1.8%) | $61,250 |
| Average | 629 (100.0%) | $112,813 |
Occupancy by Householder Income Bracket in Long Beach
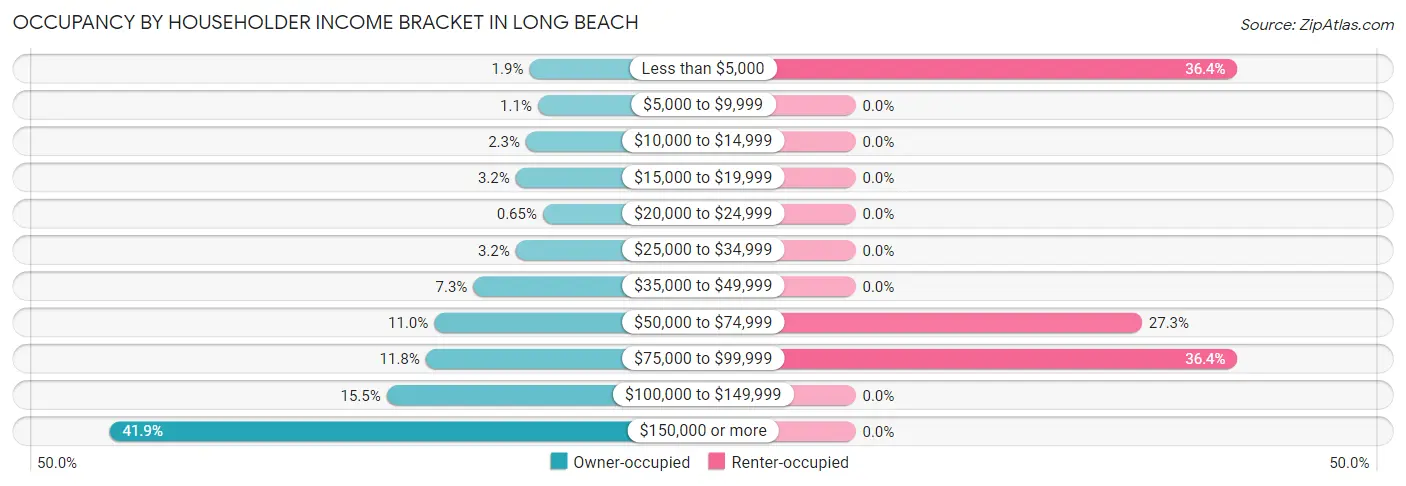
| Income Bracket | Owner-occupied | Renter-occupied |
| Less than $5,000 | 12 (1.9%) | 4 (36.4%) |
| $5,000 to $9,999 | 7 (1.1%) | 0 (0.0%) |
| $10,000 to $14,999 | 14 (2.3%) | 0 (0.0%) |
| $15,000 to $19,999 | 20 (3.2%) | 0 (0.0%) |
| $20,000 to $24,999 | 4 (0.6%) | 0 (0.0%) |
| $25,000 to $34,999 | 20 (3.2%) | 0 (0.0%) |
| $35,000 to $49,999 | 45 (7.3%) | 0 (0.0%) |
| $50,000 to $74,999 | 68 (11.0%) | 3 (27.3%) |
| $75,000 to $99,999 | 73 (11.8%) | 4 (36.4%) |
| $100,000 to $149,999 | 96 (15.5%) | 0 (0.0%) |
| $150,000 or more | 259 (41.9%) | 0 (0.0%) |
| Total | 618 (100.0%) | 11 (100.0%) |
Monthly Housing Cost Tiers in Long Beach
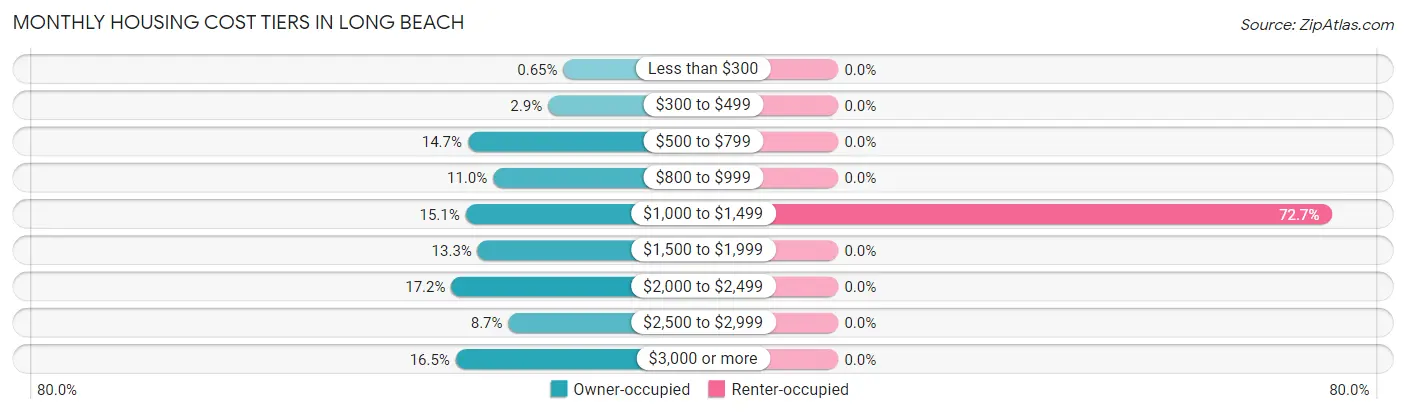
| Monthly Cost | Owner-occupied | Renter-occupied |
| Less than $300 | 4 (0.6%) | 0 (0.0%) |
| $300 to $499 | 18 (2.9%) | 0 (0.0%) |
| $500 to $799 | 91 (14.7%) | 0 (0.0%) |
| $800 to $999 | 68 (11.0%) | 0 (0.0%) |
| $1,000 to $1,499 | 93 (15.0%) | 8 (72.7%) |
| $1,500 to $1,999 | 82 (13.3%) | 0 (0.0%) |
| $2,000 to $2,499 | 106 (17.2%) | 0 (0.0%) |
| $2,500 to $2,999 | 54 (8.7%) | 0 (0.0%) |
| $3,000 or more | 102 (16.5%) | 0 (0.0%) |
| Total | 618 (100.0%) | 11 (100.0%) |
Physical Housing Characteristics in Long Beach
Housing Structures in Long Beach
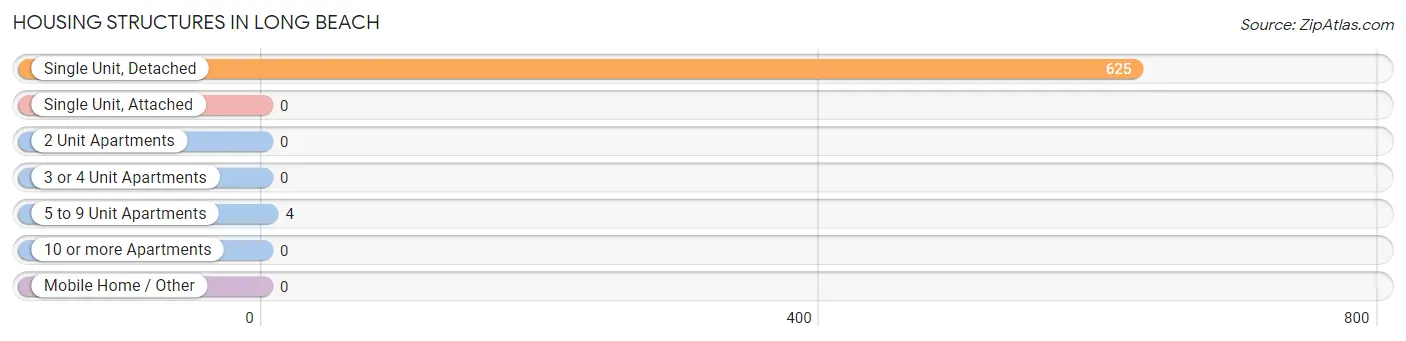
| Structure Type | # Housing Units | % Housing Units |
| Single Unit, Detached | 625 | 99.4% |
| Single Unit, Attached | 0 | 0.0% |
| 2 Unit Apartments | 0 | 0.0% |
| 3 or 4 Unit Apartments | 0 | 0.0% |
| 5 to 9 Unit Apartments | 4 | 0.6% |
| 10 or more Apartments | 0 | 0.0% |
| Mobile Home / Other | 0 | 0.0% |
| Total | 629 | 100.0% |
Housing Structures by Occupancy in Long Beach
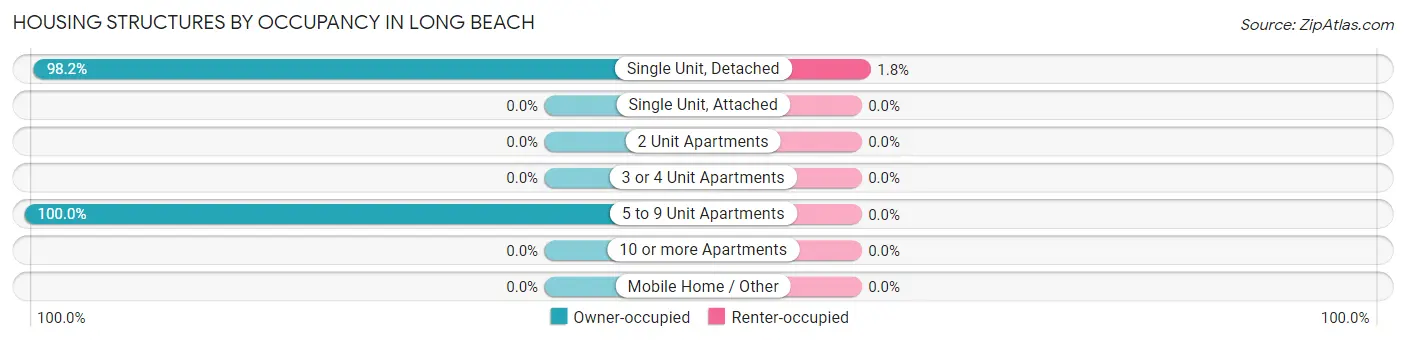
| Structure Type | Owner-occupied | Renter-occupied |
| Single Unit, Detached | 614 (98.2%) | 11 (1.8%) |
| Single Unit, Attached | 0 (0.0%) | 0 (0.0%) |
| 2 Unit Apartments | 0 (0.0%) | 0 (0.0%) |
| 3 or 4 Unit Apartments | 0 (0.0%) | 0 (0.0%) |
| 5 to 9 Unit Apartments | 4 (100.0%) | 0 (0.0%) |
| 10 or more Apartments | 0 (0.0%) | 0 (0.0%) |
| Mobile Home / Other | 0 (0.0%) | 0 (0.0%) |
| Total | 618 (98.3%) | 11 (1.8%) |
Housing Structures by Number of Rooms in Long Beach
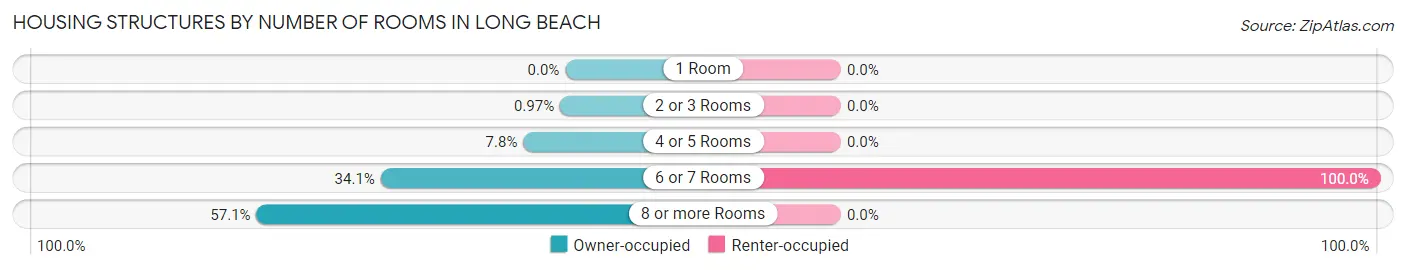
| Number of Rooms | Owner-occupied | Renter-occupied |
| 1 Room | 0 (0.0%) | 0 (0.0%) |
| 2 or 3 Rooms | 6 (1.0%) | 0 (0.0%) |
| 4 or 5 Rooms | 48 (7.8%) | 0 (0.0%) |
| 6 or 7 Rooms | 211 (34.1%) | 11 (100.0%) |
| 8 or more Rooms | 353 (57.1%) | 0 (0.0%) |
| Total | 618 (100.0%) | 11 (100.0%) |
Housing Structure by Heating Type in Long Beach
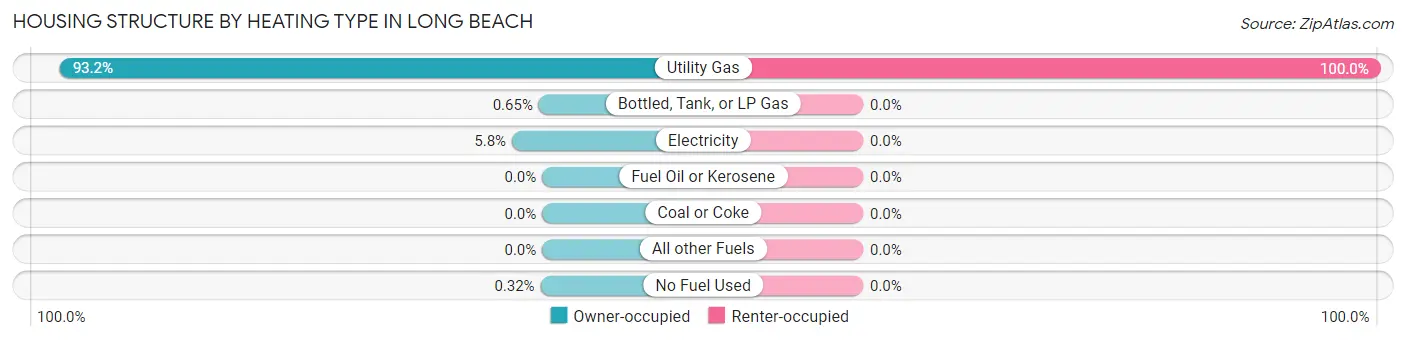
| Heating Type | Owner-occupied | Renter-occupied |
| Utility Gas | 576 (93.2%) | 11 (100.0%) |
| Bottled, Tank, or LP Gas | 4 (0.6%) | 0 (0.0%) |
| Electricity | 36 (5.8%) | 0 (0.0%) |
| Fuel Oil or Kerosene | 0 (0.0%) | 0 (0.0%) |
| Coal or Coke | 0 (0.0%) | 0 (0.0%) |
| All other Fuels | 0 (0.0%) | 0 (0.0%) |
| No Fuel Used | 2 (0.3%) | 0 (0.0%) |
| Total | 618 (100.0%) | 11 (100.0%) |
Household Vehicle Usage in Long Beach
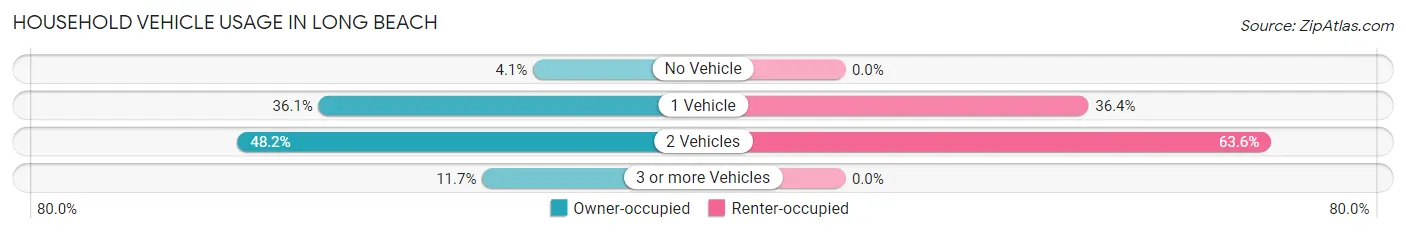
| Vehicles per Household | Owner-occupied | Renter-occupied |
| No Vehicle | 25 (4.1%) | 0 (0.0%) |
| 1 Vehicle | 223 (36.1%) | 4 (36.4%) |
| 2 Vehicles | 298 (48.2%) | 7 (63.6%) |
| 3 or more Vehicles | 72 (11.7%) | 0 (0.0%) |
| Total | 618 (100.0%) | 11 (100.0%) |
Real Estate & Mortgages in Long Beach
Real Estate and Mortgage Overview in Long Beach
| Characteristic | Without Mortgage | With Mortgage |
| Housing Units | 296 | 322 |
| Median Property Value | $642,400 | $571,400 |
| Median Household Income | $91,500 | $162 |
| Monthly Housing Costs | $926 | $89 |
| Real Estate Taxes | $5,469 | $0 |
Property Value by Mortgage Status in Long Beach
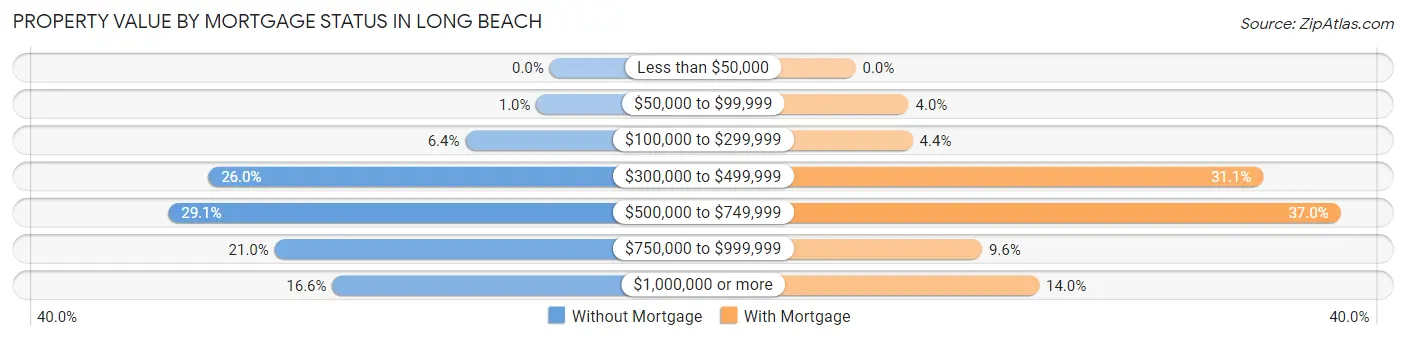
| Property Value | Without Mortgage | With Mortgage |
| Less than $50,000 | 0 (0.0%) | 0 (0.0%) |
| $50,000 to $99,999 | 3 (1.0%) | 13 (4.0%) |
| $100,000 to $299,999 | 19 (6.4%) | 14 (4.3%) |
| $300,000 to $499,999 | 77 (26.0%) | 100 (31.1%) |
| $500,000 to $749,999 | 86 (29.0%) | 119 (37.0%) |
| $750,000 to $999,999 | 62 (20.9%) | 31 (9.6%) |
| $1,000,000 or more | 49 (16.6%) | 45 (14.0%) |
| Total | 296 (100.0%) | 322 (100.0%) |
Household Income by Mortgage Status in Long Beach
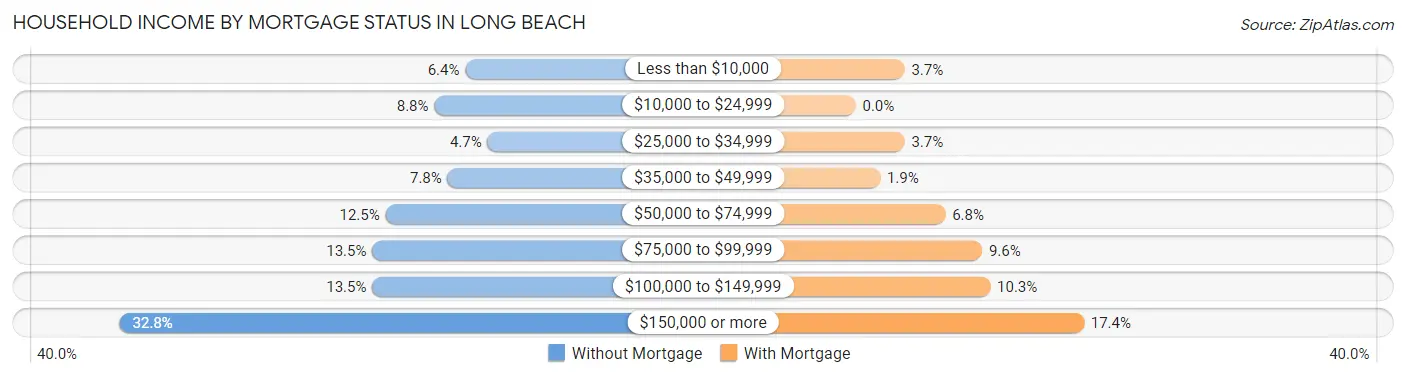
| Household Income | Without Mortgage | With Mortgage |
| Less than $10,000 | 19 (6.4%) | 12 (3.7%) |
| $10,000 to $24,999 | 26 (8.8%) | 0 (0.0%) |
| $25,000 to $34,999 | 14 (4.7%) | 12 (3.7%) |
| $35,000 to $49,999 | 23 (7.8%) | 6 (1.9%) |
| $50,000 to $74,999 | 37 (12.5%) | 22 (6.8%) |
| $75,000 to $99,999 | 40 (13.5%) | 31 (9.6%) |
| $100,000 to $149,999 | 40 (13.5%) | 33 (10.2%) |
| $150,000 or more | 97 (32.8%) | 56 (17.4%) |
| Total | 296 (100.0%) | 322 (100.0%) |
Property Value to Household Income Ratio in Long Beach
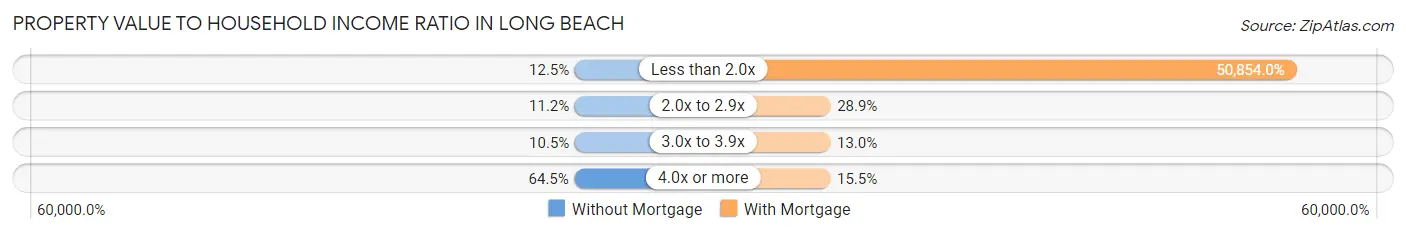
| Value-to-Income Ratio | Without Mortgage | With Mortgage |
| Less than 2.0x | 37 (12.5%) | 163,750 (50,854.0%) |
| 2.0x to 2.9x | 33 (11.2%) | 93 (28.9%) |
| 3.0x to 3.9x | 31 (10.5%) | 42 (13.0%) |
| 4.0x or more | 191 (64.5%) | 50 (15.5%) |
| Total | 296 (100.0%) | 322 (100.0%) |
Real Estate Taxes by Mortgage Status in Long Beach
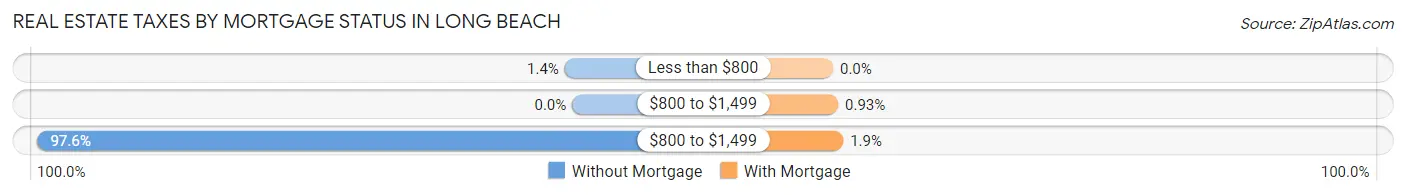
| Property Taxes | Without Mortgage | With Mortgage |
| Less than $800 | 4 (1.3%) | 0 (0.0%) |
| $800 to $1,499 | 0 (0.0%) | 3 (0.9%) |
| $800 to $1,499 | 289 (97.6%) | 6 (1.9%) |
| Total | 296 (100.0%) | 322 (100.0%) |
Health & Disability in Long Beach
Health Insurance Coverage by Age in Long Beach
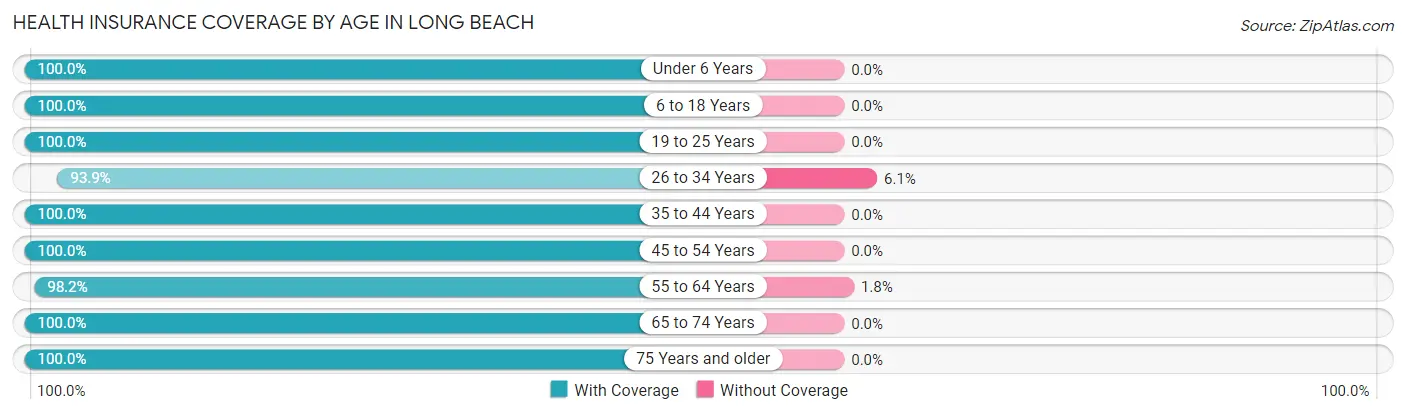
| Age Bracket | With Coverage | Without Coverage |
| Under 6 Years | 17 (100.0%) | 0 (0.0%) |
| 6 to 18 Years | 51 (100.0%) | 0 (0.0%) |
| 19 to 25 Years | 26 (100.0%) | 0 (0.0%) |
| 26 to 34 Years | 46 (93.9%) | 3 (6.1%) |
| 35 to 44 Years | 28 (100.0%) | 0 (0.0%) |
| 45 to 54 Years | 119 (100.0%) | 0 (0.0%) |
| 55 to 64 Years | 380 (98.2%) | 7 (1.8%) |
| 65 to 74 Years | 271 (100.0%) | 0 (0.0%) |
| 75 Years and older | 236 (100.0%) | 0 (0.0%) |
| Total | 1,174 (99.2%) | 10 (0.8%) |
Health Insurance Coverage by Citizenship Status in Long Beach
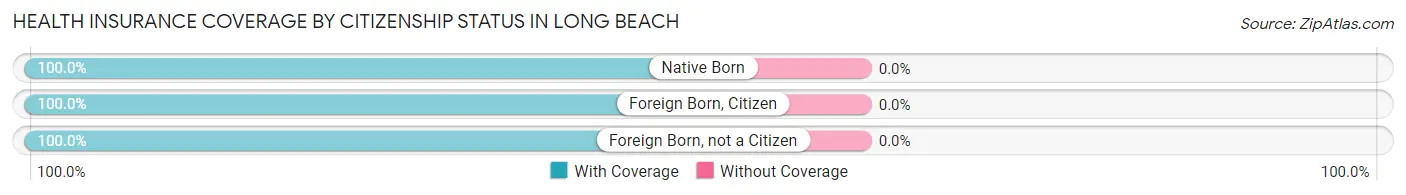
| Citizenship Status | With Coverage | Without Coverage |
| Native Born | 17 (100.0%) | 0 (0.0%) |
| Foreign Born, Citizen | 51 (100.0%) | 0 (0.0%) |
| Foreign Born, not a Citizen | 26 (100.0%) | 0 (0.0%) |
Health Insurance Coverage by Household Income in Long Beach
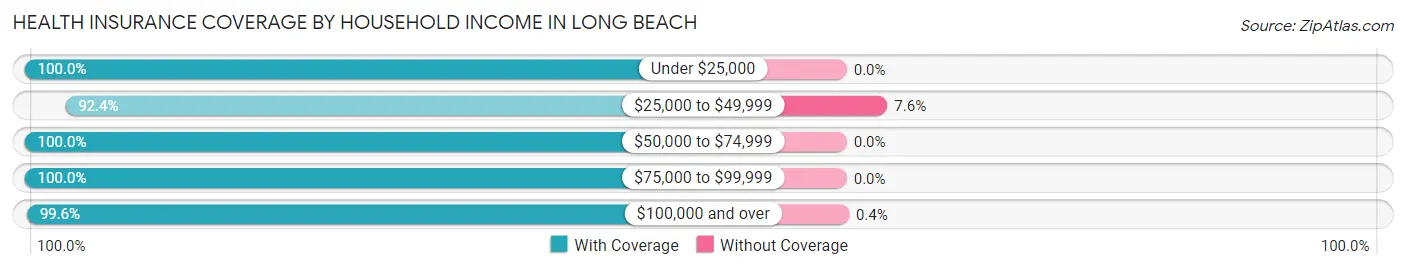
| Household Income | With Coverage | Without Coverage |
| Under $25,000 | 94 (100.0%) | 0 (0.0%) |
| $25,000 to $49,999 | 85 (92.4%) | 7 (7.6%) |
| $50,000 to $74,999 | 111 (100.0%) | 0 (0.0%) |
| $75,000 to $99,999 | 134 (100.0%) | 0 (0.0%) |
| $100,000 and over | 750 (99.6%) | 3 (0.4%) |
Public vs Private Health Insurance Coverage by Age in Long Beach
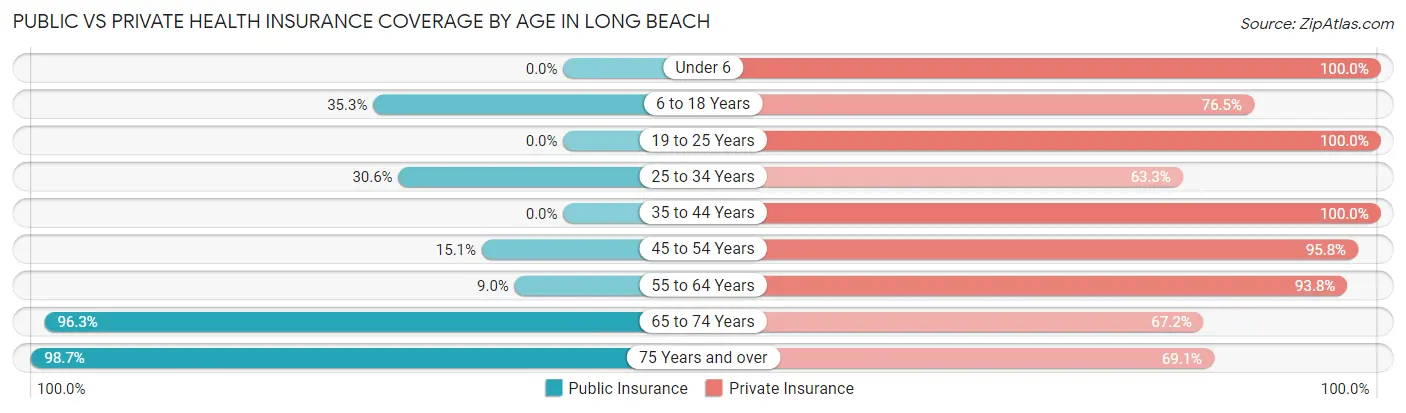
| Age Bracket | Public Insurance | Private Insurance |
| Under 6 | 0 (0.0%) | 17 (100.0%) |
| 6 to 18 Years | 18 (35.3%) | 39 (76.5%) |
| 19 to 25 Years | 0 (0.0%) | 26 (100.0%) |
| 25 to 34 Years | 15 (30.6%) | 31 (63.3%) |
| 35 to 44 Years | 0 (0.0%) | 28 (100.0%) |
| 45 to 54 Years | 18 (15.1%) | 114 (95.8%) |
| 55 to 64 Years | 35 (9.0%) | 363 (93.8%) |
| 65 to 74 Years | 261 (96.3%) | 182 (67.2%) |
| 75 Years and over | 233 (98.7%) | 163 (69.1%) |
| Total | 580 (49.0%) | 963 (81.3%) |
Disability Status by Sex by Age in Long Beach
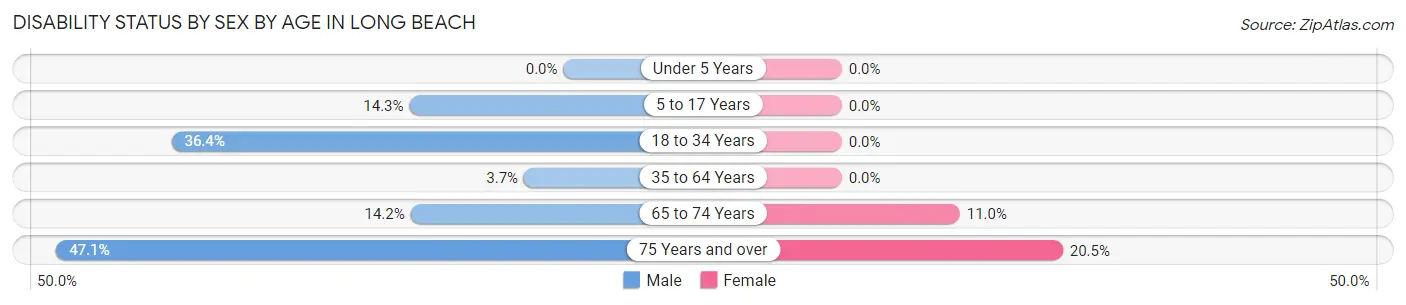
| Age Bracket | Male | Female |
| Under 5 Years | 0 (0.0%) | 0 (0.0%) |
| 5 to 17 Years | 2 (14.3%) | 0 (0.0%) |
| 18 to 34 Years | 16 (36.4%) | 0 (0.0%) |
| 35 to 64 Years | 10 (3.7%) | 0 (0.0%) |
| 65 to 74 Years | 19 (14.2%) | 15 (11.0%) |
| 75 Years and over | 56 (47.1%) | 24 (20.5%) |
Disability Class by Sex by Age in Long Beach
Disability Class: Hearing Difficulty
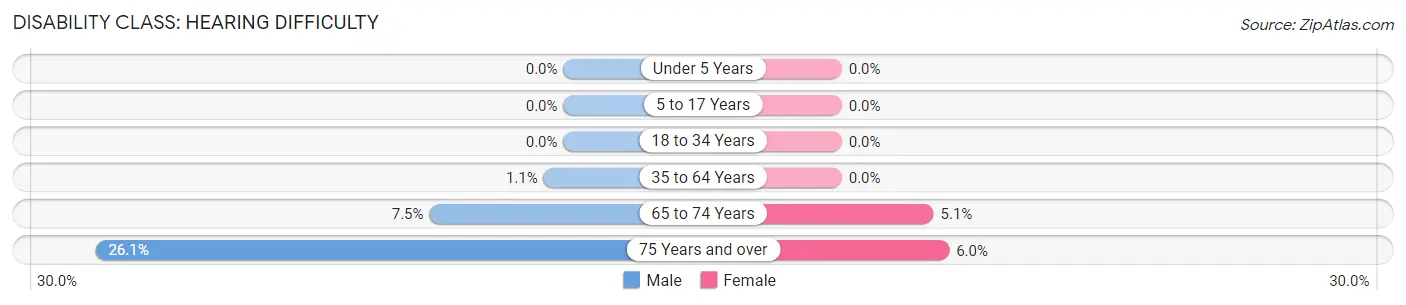
| Age Bracket | Male | Female |
| Under 5 Years | 0 (0.0%) | 0 (0.0%) |
| 5 to 17 Years | 0 (0.0%) | 0 (0.0%) |
| 18 to 34 Years | 0 (0.0%) | 0 (0.0%) |
| 35 to 64 Years | 3 (1.1%) | 0 (0.0%) |
| 65 to 74 Years | 10 (7.5%) | 7 (5.1%) |
| 75 Years and over | 31 (26.1%) | 7 (6.0%) |
Disability Class: Vision Difficulty
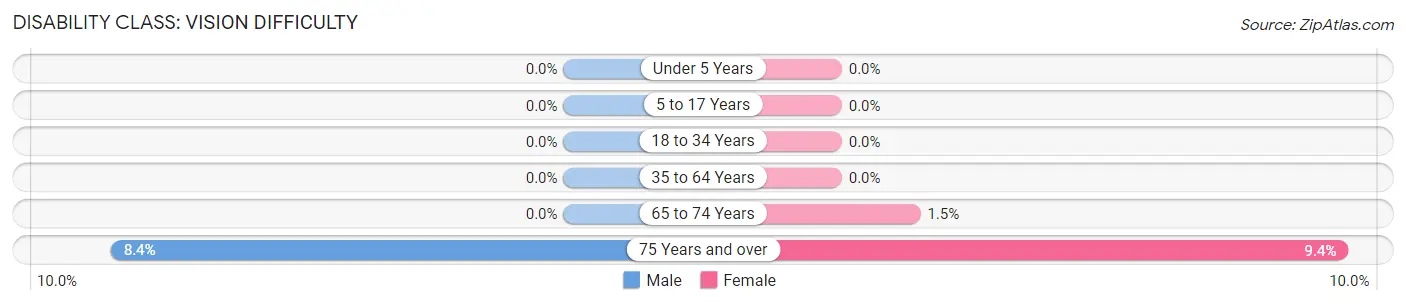
| Age Bracket | Male | Female |
| Under 5 Years | 0 (0.0%) | 0 (0.0%) |
| 5 to 17 Years | 0 (0.0%) | 0 (0.0%) |
| 18 to 34 Years | 0 (0.0%) | 0 (0.0%) |
| 35 to 64 Years | 0 (0.0%) | 0 (0.0%) |
| 65 to 74 Years | 0 (0.0%) | 2 (1.5%) |
| 75 Years and over | 10 (8.4%) | 11 (9.4%) |
Disability Class: Cognitive Difficulty
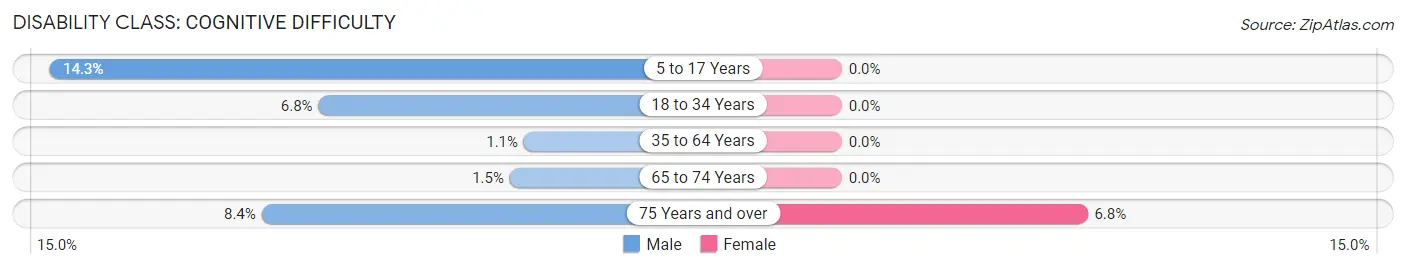
| Age Bracket | Male | Female |
| 5 to 17 Years | 2 (14.3%) | 0 (0.0%) |
| 18 to 34 Years | 3 (6.8%) | 0 (0.0%) |
| 35 to 64 Years | 3 (1.1%) | 0 (0.0%) |
| 65 to 74 Years | 2 (1.5%) | 0 (0.0%) |
| 75 Years and over | 10 (8.4%) | 8 (6.8%) |
Disability Class: Ambulatory Difficulty
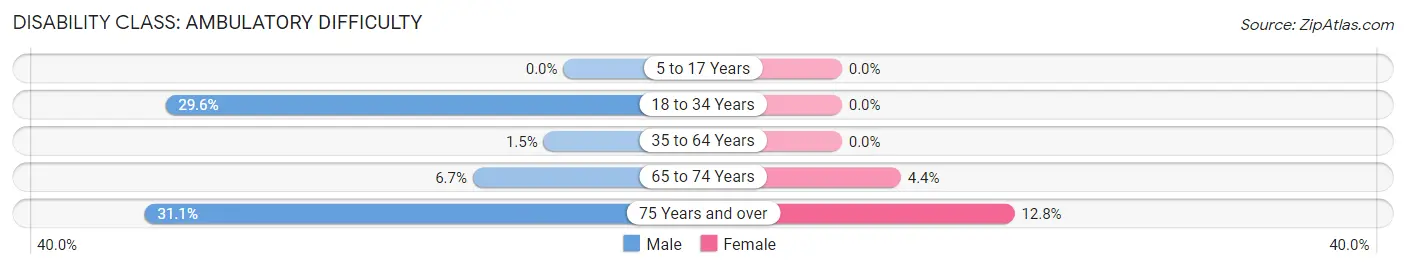
| Age Bracket | Male | Female |
| 5 to 17 Years | 0 (0.0%) | 0 (0.0%) |
| 18 to 34 Years | 13 (29.5%) | 0 (0.0%) |
| 35 to 64 Years | 4 (1.5%) | 0 (0.0%) |
| 65 to 74 Years | 9 (6.7%) | 6 (4.4%) |
| 75 Years and over | 37 (31.1%) | 15 (12.8%) |
Disability Class: Self-Care Difficulty
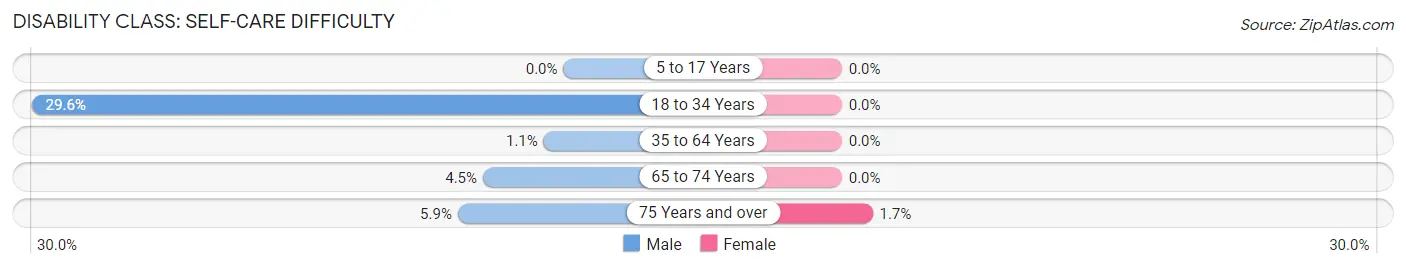
| Age Bracket | Male | Female |
| 5 to 17 Years | 0 (0.0%) | 0 (0.0%) |
| 18 to 34 Years | 13 (29.5%) | 0 (0.0%) |
| 35 to 64 Years | 3 (1.1%) | 0 (0.0%) |
| 65 to 74 Years | 6 (4.5%) | 0 (0.0%) |
| 75 Years and over | 7 (5.9%) | 2 (1.7%) |
Technology Access in Long Beach
Computing Device Access in Long Beach
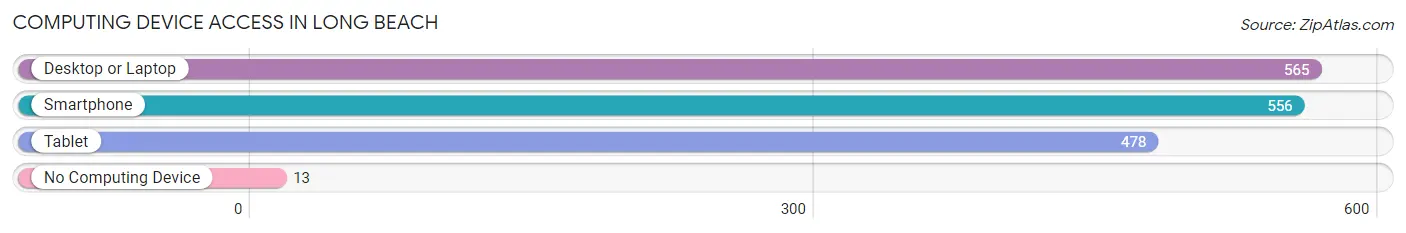
| Device Type | # Households | % Households |
| Desktop or Laptop | 565 | 89.8% |
| Smartphone | 556 | 88.4% |
| Tablet | 478 | 76.0% |
| No Computing Device | 13 | 2.1% |
| Total | 629 | 100.0% |
Internet Access in Long Beach
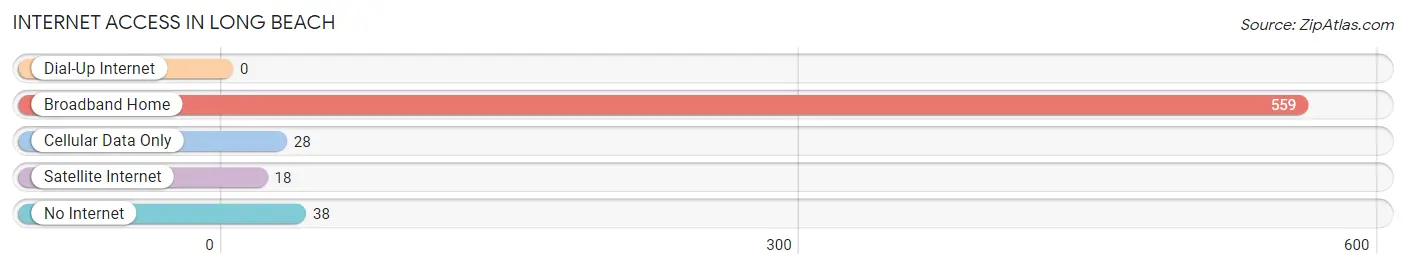
| Internet Type | # Households | % Households |
| Dial-Up Internet | 0 | 0.0% |
| Broadband Home | 559 | 88.9% |
| Cellular Data Only | 28 | 4.4% |
| Satellite Internet | 18 | 2.9% |
| No Internet | 38 | 6.0% |
| Total | 629 | 100.0% |
Long Beach Summary
Long Beach, Indiana is a small town located in LaPorte County, Indiana. It is situated on the shores of Lake Michigan, just south of Michigan City. The town has a population of just over 1,000 people and is a popular tourist destination due to its proximity to the lake.
History
Long Beach was founded in 1836 by a group of settlers from New York. The town was originally called “New York” but was later changed to Long Beach due to its long shoreline. The town was incorporated in 1867 and was a popular summer destination for wealthy Chicagoans. The town was also home to a number of resorts and hotels, which attracted visitors from all over the Midwest.
In the early 1900s, Long Beach was a popular destination for wealthy Chicagoans who wanted to escape the hustle and bustle of the city. The town was also home to a number of resorts and hotels, which attracted visitors from all over the Midwest.
In the 1950s, Long Beach began to decline as a tourist destination. The town’s economy shifted to focus on fishing and agriculture. The town’s population began to decline as well, and by the 1970s, the town had become a virtual ghost town.
In the 1980s, Long Beach began to experience a resurgence as a tourist destination. The town’s economy shifted to focus on tourism and recreation. The town’s population began to increase, and by the 2000s, the town had become a popular destination for tourists from all over the Midwest.
Geography
Long Beach is located in LaPorte County, Indiana. It is situated on the shores of Lake Michigan, just south of Michigan City. The town is bordered by the towns of LaPorte, Michigan City, and New Buffalo. The town is located in a flat, low-lying area, with the highest point being just over 200 feet above sea level.
The town is home to a number of parks and beaches, including Long Beach Park, which is located on the shores of Lake Michigan. The park features a beach, picnic areas, and a playground. The town is also home to a number of other parks, including the Long Beach Nature Preserve, which is home to a variety of wildlife.
Economy
Long Beach’s economy is largely based on tourism and recreation. The town is home to a number of resorts and hotels, which attract visitors from all over the Midwest. The town is also home to a number of restaurants, bars, and shops, which cater to tourists and locals alike.
The town is also home to a number of businesses, including a marina, a boat repair shop, and a number of other businesses. The town is also home to a number of manufacturing companies, which produce a variety of products, including furniture, clothing, and electronics.
Demographics
As of the 2010 census, Long Beach had a population of 1,072 people. The town is predominantly white, with the majority of the population being of German, Irish, and English descent. The town also has a small Hispanic population, as well as a small African American population.
The median household income in Long Beach is $45,000, and the median home value is $150,000. The town has a high rate of homeownership, with over 80% of the population owning their own homes. The town also has a low unemployment rate, with just over 4% of the population being unemployed.
Conclusion
Long Beach, Indiana is a small town located in LaPorte County, Indiana. It is situated on the shores of Lake Michigan, just south of Michigan City. The town has a population of just over 1,000 people and is a popular tourist destination due to its proximity to the lake. The town’s economy is largely based on tourism and recreation, and the town is home to a number of resorts and hotels, as well as a number of businesses. The town is predominantly white, with the majority of the population being of German, Irish, and English descent. The median household income in Long Beach is $45,000, and the median home value is $150,000.
Common Questions
What is the Total Population of Long Beach?
Total Population of Long Beach is 1,184.
What is the Total Male Population of Long Beach?
Total Male Population of Long Beach is 601.
What is the Total Female Population of Long Beach?
Total Female Population of Long Beach is 583.
What is the Ratio of Males per 100 Females in Long Beach?
There are 103.09 Males per 100 Females in Long Beach.
What is the Ratio of Females per 100 Males in Long Beach?
There are 97.00 Females per 100 Males in Long Beach.
What is the Median Population Age in Long Beach?
Median Population Age in Long Beach is 62.6 Years.
What is the Average Family Size in Long Beach
Average Family Size in Long Beach is 2.3 People.
What is the Average Household Size in Long Beach
Average Household Size in Long Beach is 1.9 People.
What is Per Capita Income in Long Beach?
Per Capita income in Long Beach is $119,126.
What is the Median Family Income in Long Beach?
Median Family Income in Long Beach is $164,063.
What is the Median Household income in Long Beach?
Median Household Income in Long Beach is $112,813.
What is Income or Wage Gap in Long Beach?
Income or Wage Gap in Long Beach is 35.5%.
Women in Long Beach earn 64.5 cents for every dollar earned by a man.
What is Family Income Deficit in Long Beach?
Family Income Deficit in Long Beach is $16,500.
Families that are below poverty line in Long Beach earn $16,500 less on average than the poverty threshold level.
What is Inequality or Gini Index in Long Beach?
Inequality or Gini Index in Long Beach is 0.56.
How Large is the Labor Force in Long Beach?
There are 574 People in the Labor Forcein in Long Beach.
What is the Percentage of People in the Labor Force in Long Beach?
50.5% of People are in the Labor Force in Long Beach.
What is the Unemployment Rate in Long Beach?
Unemployment Rate in Long Beach is 2.6%.