Westville, IN
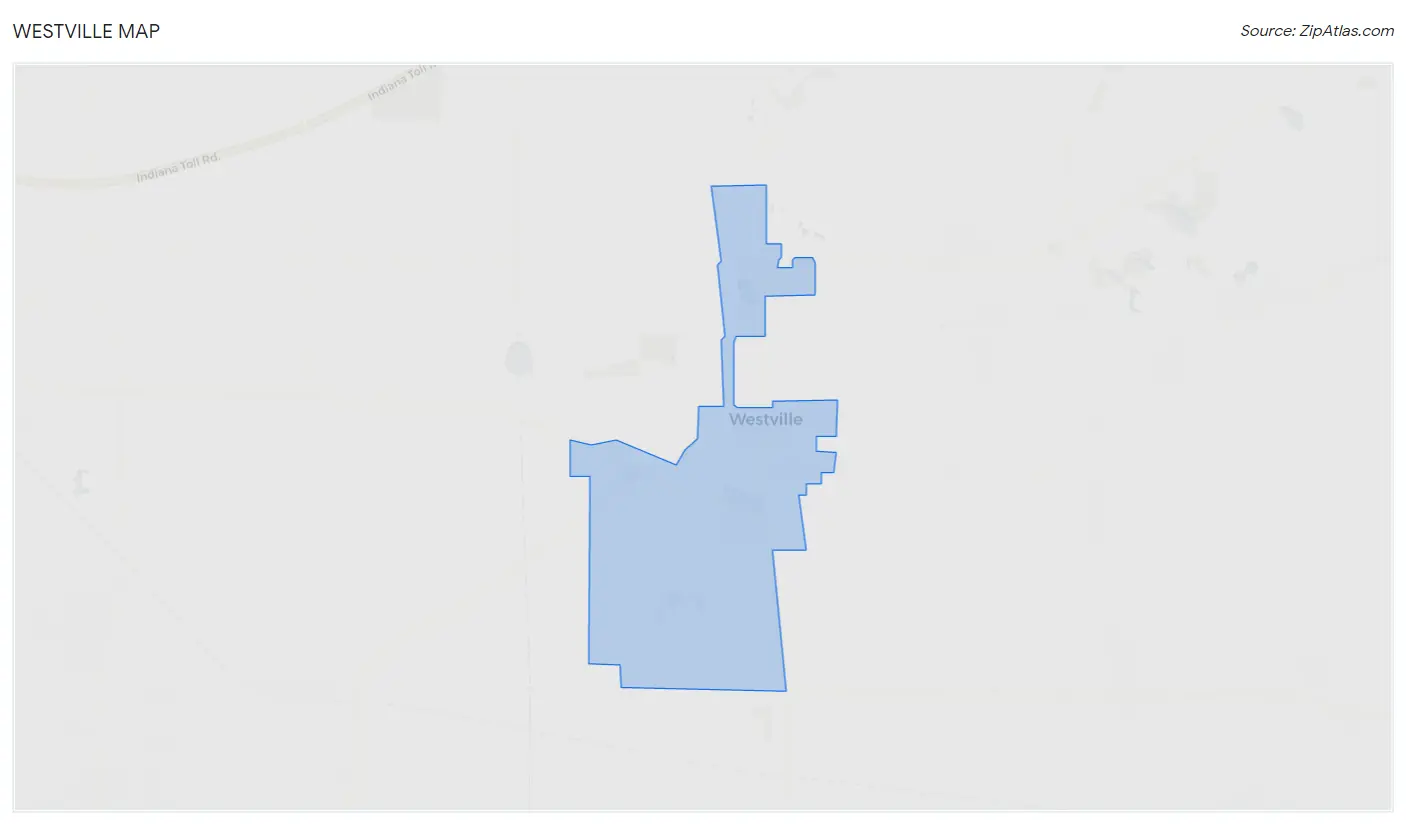
Westville Map
Westville Overview
5,885
TOTAL POPULATION
4,668
MALE POPULATION
1,217
FEMALE POPULATION
383.57
MALES / 100 FEMALES
26.07
FEMALES / 100 MALES
37.6
MEDIAN AGE
3.1
AVG FAMILY SIZE
2.5
AVG HOUSEHOLD SIZE
$14,357
PER CAPITA INCOME
$73,750
AVG FAMILY INCOME
$57,889
AVG HOUSEHOLD INCOME
23.2%
WAGE / INCOME GAP [ % ]
76.8¢/ $1
WAGE / INCOME GAP [ $ ]
0.39
INEQUALITY / GINI INDEX
1,299
LABOR FORCE [ PEOPLE ]
24.3%
PERCENT IN LABOR FORCE
8.9%
UNEMPLOYMENT RATE
Westville Zip Codes
Westville Area Codes
Race in Westville
The most populous races in Westville are White / Caucasian (4,380 | 74.4%), Black / African American (1,347 | 22.9%), and Hispanic or Latino (253 | 4.3%).
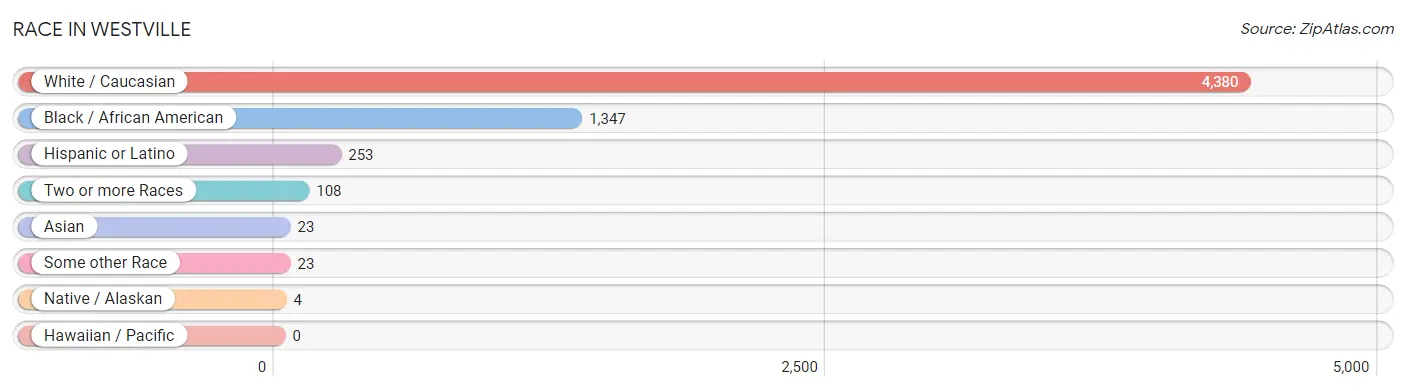
| Race | # Population | % Population |
| Asian | 23 | 0.4% |
| Black / African American | 1,347 | 22.9% |
| Hawaiian / Pacific | 0 | 0.0% |
| Hispanic or Latino | 253 | 4.3% |
| Native / Alaskan | 4 | 0.1% |
| White / Caucasian | 4,380 | 74.4% |
| Two or more Races | 108 | 1.8% |
| Some other Race | 23 | 0.4% |
| Total | 5,885 | 100.0% |
Ancestry in Westville
The most populous ancestries reported in Westville are German (705 | 12.0%), Polish (440 | 7.5%), Irish (395 | 6.7%), Slovak (319 | 5.4%), and English (310 | 5.3%), together accounting for 36.9% of all Westville residents.
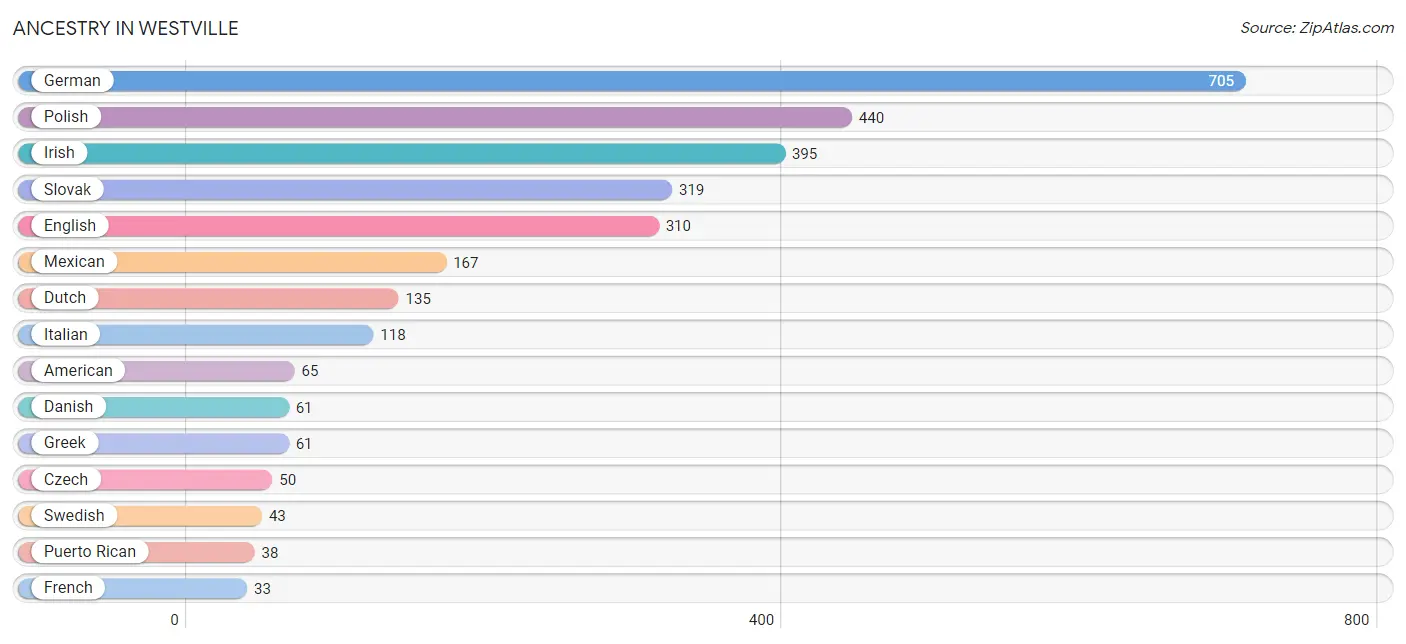
| Ancestry | # Population | % Population |
| African | 16 | 0.3% |
| American | 65 | 1.1% |
| Austrian | 29 | 0.5% |
| Blackfeet | 4 | 0.1% |
| Canadian | 5 | 0.1% |
| Cherokee | 7 | 0.1% |
| Croatian | 5 | 0.1% |
| Czech | 50 | 0.9% |
| Danish | 61 | 1.0% |
| Dutch | 135 | 2.3% |
| Eastern European | 28 | 0.5% |
| English | 310 | 5.3% |
| European | 18 | 0.3% |
| French | 33 | 0.6% |
| French Canadian | 6 | 0.1% |
| German | 705 | 12.0% |
| Greek | 61 | 1.0% |
| Hungarian | 12 | 0.2% |
| Irish | 395 | 6.7% |
| Italian | 118 | 2.0% |
| Korean | 12 | 0.2% |
| Mexican | 167 | 2.8% |
| Northern European | 18 | 0.3% |
| Norwegian | 7 | 0.1% |
| Pakistani | 11 | 0.2% |
| Polish | 440 | 7.5% |
| Puerto Rican | 38 | 0.6% |
| Romanian | 5 | 0.1% |
| Scottish | 32 | 0.5% |
| Slovak | 319 | 5.4% |
| Subsaharan African | 16 | 0.3% |
| Swedish | 43 | 0.7% |
| Swiss | 5 | 0.1% |
| Ukrainian | 16 | 0.3% |
| Welsh | 5 | 0.1% | View All 35 Rows |
Immigrants in Westville
The most numerous immigrant groups reported in Westville came from Central America (81 | 1.4%), Latin America (81 | 1.4%), Mexico (74 | 1.3%), Europe (29 | 0.5%), and Northern Europe (24 | 0.4%), together accounting for 4.9% of all Westville residents.
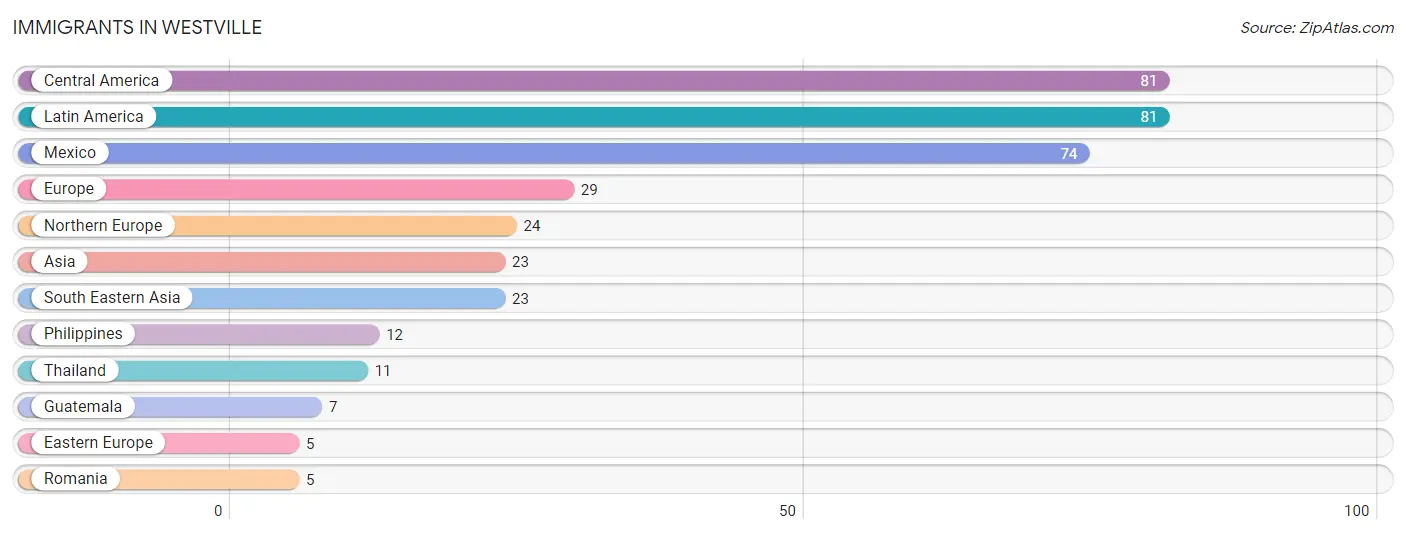
| Immigration Origin | # Population | % Population |
| Asia | 23 | 0.4% |
| Central America | 81 | 1.4% |
| Eastern Europe | 5 | 0.1% |
| Europe | 29 | 0.5% |
| Guatemala | 7 | 0.1% |
| Latin America | 81 | 1.4% |
| Mexico | 74 | 1.3% |
| Northern Europe | 24 | 0.4% |
| Philippines | 12 | 0.2% |
| Romania | 5 | 0.1% |
| South Eastern Asia | 23 | 0.4% |
| Thailand | 11 | 0.2% | View All 12 Rows |
Sex and Age in Westville
Sex and Age in Westville
The most populous age groups in Westville are 30 to 34 Years (690 | 14.8%) for men and 40 to 44 Years (158 | 13.0%) for women.
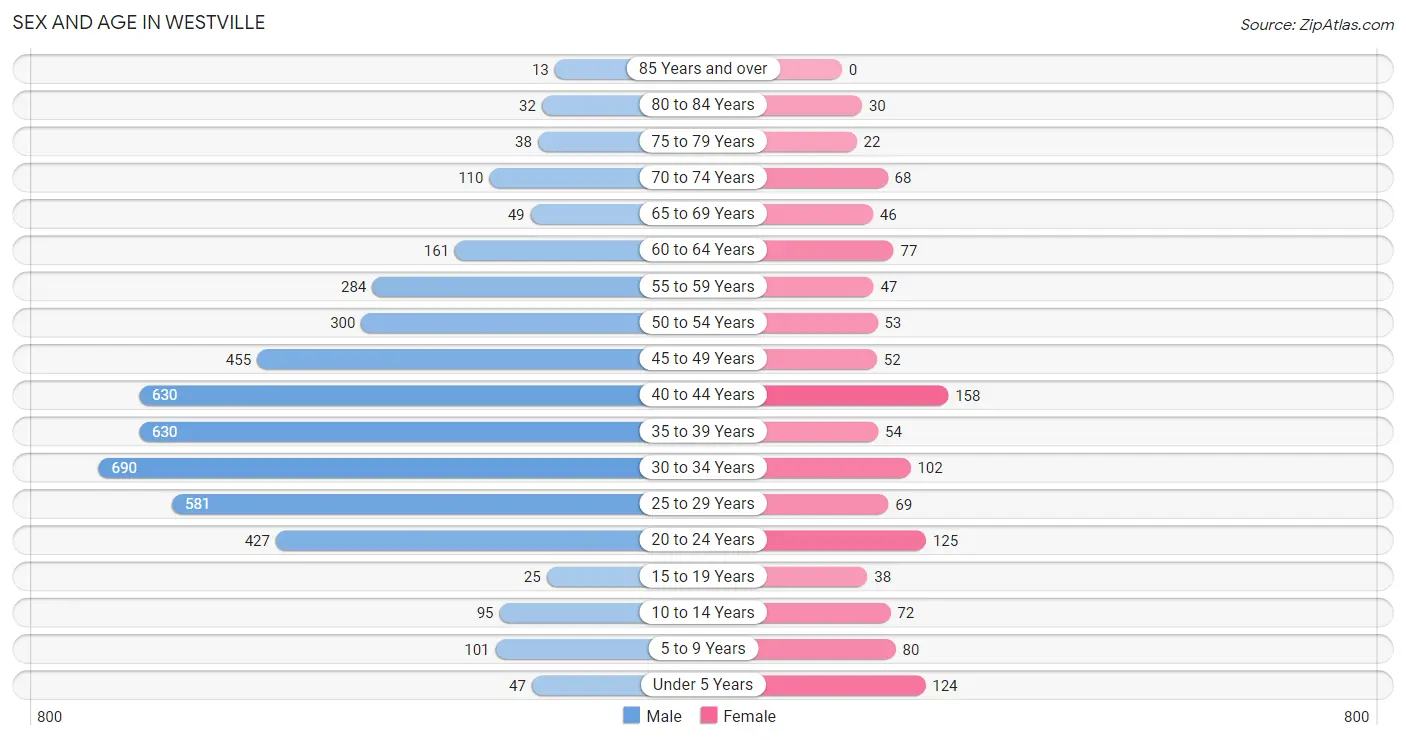
| Age Bracket | Male | Female |
| Under 5 Years | 47 (1.0%) | 124 (10.2%) |
| 5 to 9 Years | 101 (2.2%) | 80 (6.6%) |
| 10 to 14 Years | 95 (2.0%) | 72 (5.9%) |
| 15 to 19 Years | 25 (0.5%) | 38 (3.1%) |
| 20 to 24 Years | 427 (9.1%) | 125 (10.3%) |
| 25 to 29 Years | 581 (12.4%) | 69 (5.7%) |
| 30 to 34 Years | 690 (14.8%) | 102 (8.4%) |
| 35 to 39 Years | 630 (13.5%) | 54 (4.4%) |
| 40 to 44 Years | 630 (13.5%) | 158 (13.0%) |
| 45 to 49 Years | 455 (9.8%) | 52 (4.3%) |
| 50 to 54 Years | 300 (6.4%) | 53 (4.3%) |
| 55 to 59 Years | 284 (6.1%) | 47 (3.9%) |
| 60 to 64 Years | 161 (3.5%) | 77 (6.3%) |
| 65 to 69 Years | 49 (1.1%) | 46 (3.8%) |
| 70 to 74 Years | 110 (2.4%) | 68 (5.6%) |
| 75 to 79 Years | 38 (0.8%) | 22 (1.8%) |
| 80 to 84 Years | 32 (0.7%) | 30 (2.5%) |
| 85 Years and over | 13 (0.3%) | 0 (0.0%) |
| Total | 4,668 (100.0%) | 1,217 (100.0%) |
Families and Households in Westville
Median Family Size in Westville
The median family size in Westville is 3.06 persons per family, with married-couple families (390 | 63.7%) accounting for the largest median family size of 3.36 persons per family. On the other hand, single male/father families (39 | 6.4%) represent the smallest median family size with 1.97 persons per family.
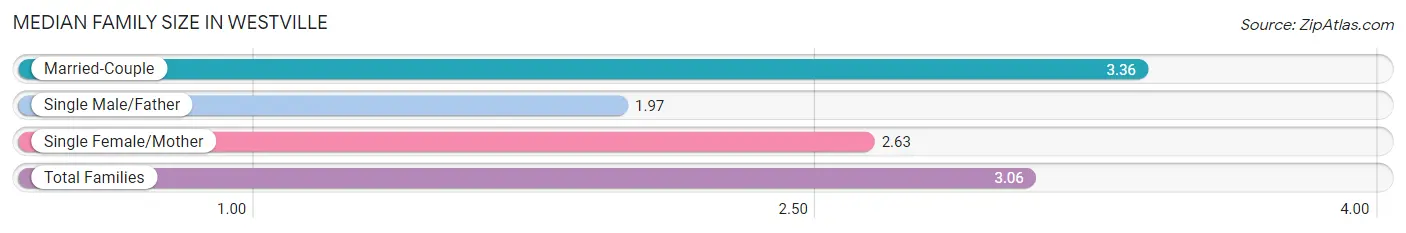
| Family Type | # Families | Family Size |
| Married-Couple | 390 (63.7%) | 3.36 |
| Single Male/Father | 39 (6.4%) | 1.97 |
| Single Female/Mother | 183 (29.9%) | 2.63 |
| Total Families | 612 (100.0%) | 3.06 |
Median Household Size in Westville
The median household size in Westville is 2.45 persons per household, with married-couple households (390 | 40.2%) accounting for the largest median household size of 3.37 persons per household. non-family households (358 | 36.9%) represent the smallest median household size with 1.22 persons per household.
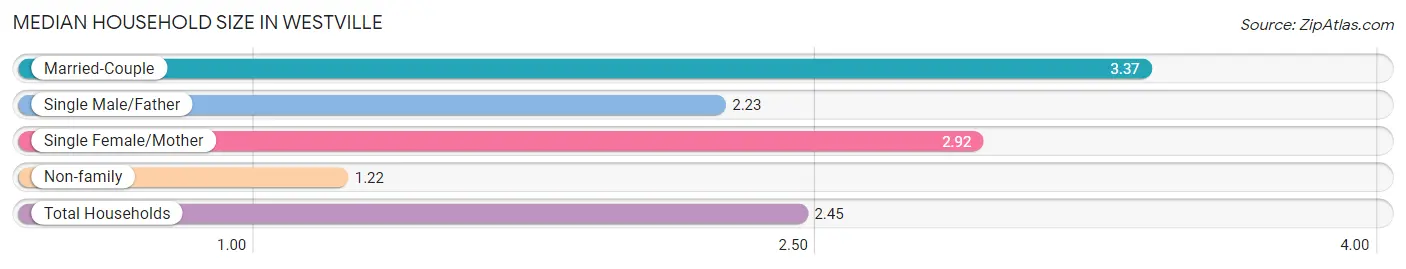
| Household Type | # Households | Household Size |
| Married-Couple | 390 (40.2%) | 3.37 |
| Single Male/Father | 39 (4.0%) | 2.23 |
| Single Female/Mother | 183 (18.9%) | 2.92 |
| Non-family | 358 (36.9%) | 1.22 |
| Total Households | 970 (100.0%) | 2.45 |
Household Size by Marriage Status in Westville
Out of a total of 970 households in Westville, 612 (63.1%) are family households, while 358 (36.9%) are nonfamily households. The most numerous type of family households are 2-person households, comprising 256, and the most common type of nonfamily households are 1-person households, comprising 288.
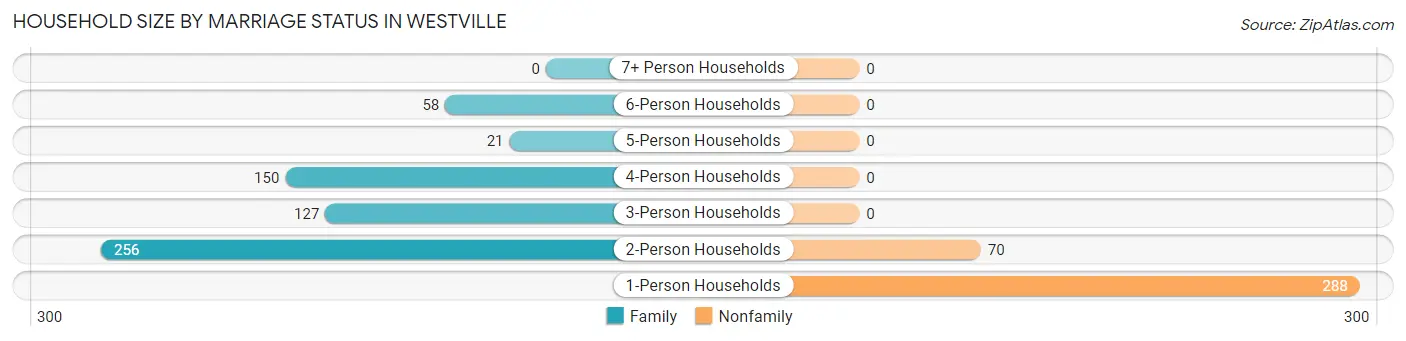
| Household Size | Family Households | Nonfamily Households |
| 1-Person Households | - | 288 (29.7%) |
| 2-Person Households | 256 (26.4%) | 70 (7.2%) |
| 3-Person Households | 127 (13.1%) | 0 (0.0%) |
| 4-Person Households | 150 (15.5%) | 0 (0.0%) |
| 5-Person Households | 21 (2.2%) | 0 (0.0%) |
| 6-Person Households | 58 (6.0%) | 0 (0.0%) |
| 7+ Person Households | 0 (0.0%) | 0 (0.0%) |
| Total | 612 (63.1%) | 358 (36.9%) |
Female Fertility in Westville
Fertility by Age in Westville
Average fertility rate in Westville is 82.0 births per 1,000 women. Women in the age bracket of 20 to 34 years have the highest fertility rate with 139.0 births per 1,000 women. Women in the age bracket of 20 to 34 years acount for 82.0% of all women with births.
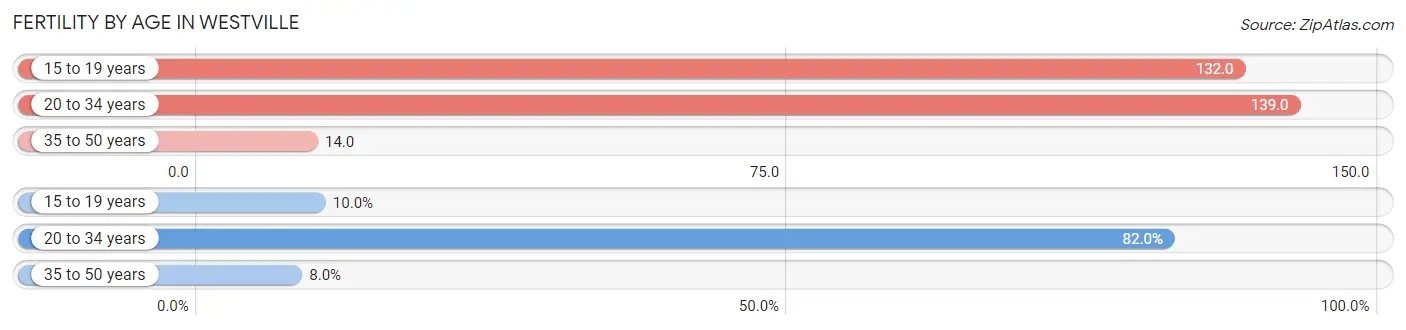
| Age Bracket | Women with Births | Births / 1,000 Women |
| 15 to 19 years | 5 (10.0%) | 132.0 |
| 20 to 34 years | 41 (82.0%) | 139.0 |
| 35 to 50 years | 4 (8.0%) | 14.0 |
| Total | 50 (100.0%) | 82.0 |
Fertility by Age by Marriage Status in Westville
46.0% of women with births (50) in Westville are married. The highest percentage of unmarried women with births falls into 15 to 19 years age bracket with 100.0% of them unmarried at the time of birth, while the lowest percentage of unmarried women with births belong to 35 to 50 years age bracket with 0.0% of them unmarried.
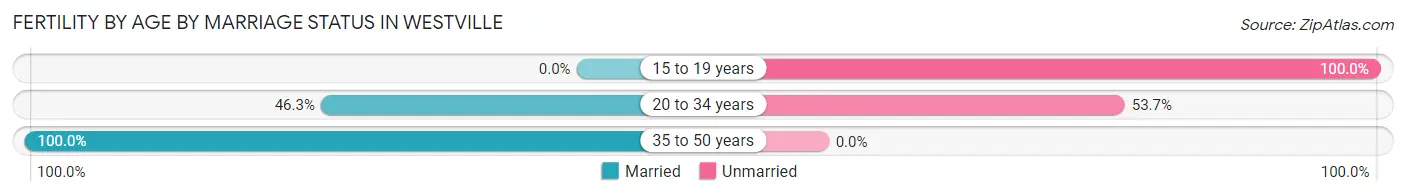
| Age Bracket | Married | Unmarried |
| 15 to 19 years | 0 (0.0%) | 5 (100.0%) |
| 20 to 34 years | 19 (46.3%) | 22 (53.7%) |
| 35 to 50 years | 4 (100.0%) | 0 (0.0%) |
| Total | 23 (46.0%) | 27 (54.0%) |
Fertility by Education in Westville
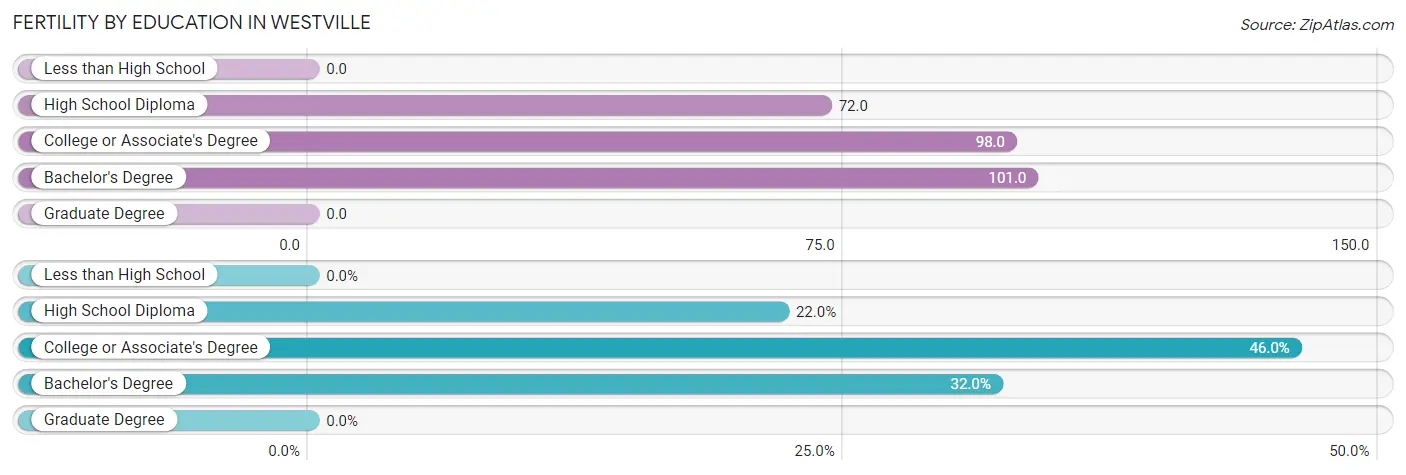
| Educational Attainment | Women with Births | Births / 1,000 Women |
| Less than High School | 0 (0.0%) | 0.0 |
| High School Diploma | 11 (22.0%) | 72.0 |
| College or Associate's Degree | 23 (46.0%) | 98.0 |
| Bachelor's Degree | 16 (32.0%) | 101.0 |
| Graduate Degree | 0 (0.0%) | 0.0 |
| Total | 50 (100.0%) | 82.0 |
Fertility by Education by Marriage Status in Westville
54.0% of women with births in Westville are unmarried. Women with the educational attainment of high school diploma are most likely to be married with 100.0% of them married at childbirth, while women with the educational attainment of bachelor's degree are least likely to be married with 100.0% of them unmarried at childbirth.
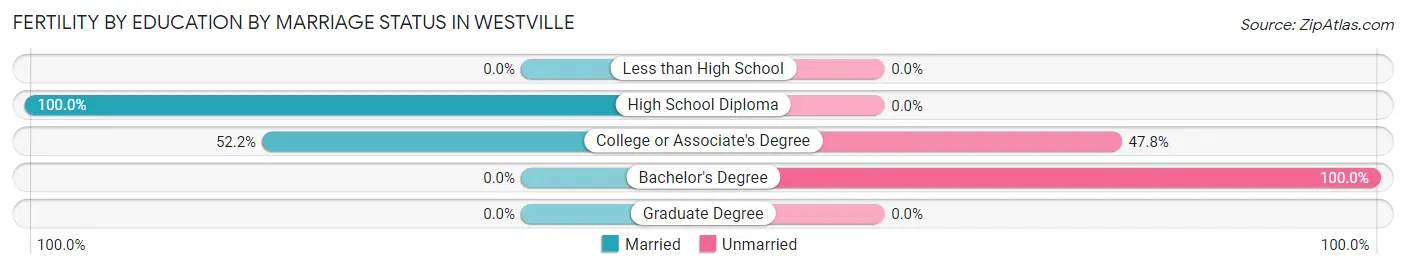
| Educational Attainment | Married | Unmarried |
| Less than High School | 0 (0.0%) | 0 (0.0%) |
| High School Diploma | 11 (100.0%) | 0 (0.0%) |
| College or Associate's Degree | 12 (52.2%) | 11 (47.8%) |
| Bachelor's Degree | 0 (0.0%) | 16 (100.0%) |
| Graduate Degree | 0 (0.0%) | 0 (0.0%) |
| Total | 23 (46.0%) | 27 (54.0%) |
Income in Westville
Income Overview in Westville
Per Capita Income in Westville is $14,357, while median incomes of families and households are $73,750 and $57,889 respectively.
| Characteristic | Number | Measure |
| Per Capita Income | 5,885 | $14,357 |
| Median Family Income | 612 | $73,750 |
| Mean Family Income | 612 | $88,014 |
| Median Household Income | 970 | $57,889 |
| Mean Household Income | 970 | $76,189 |
| Income Deficit | 612 | $0 |
| Wage / Income Gap (%) | 5,885 | 23.18% |
| Wage / Income Gap ($) | 5,885 | 76.82¢ per $1 |
| Gini / Inequality Index | 5,885 | 0.39 |
Earnings by Sex in Westville
Average Earnings in Westville are $38,632, $44,861 for men and $34,462 for women, a difference of 23.2%.
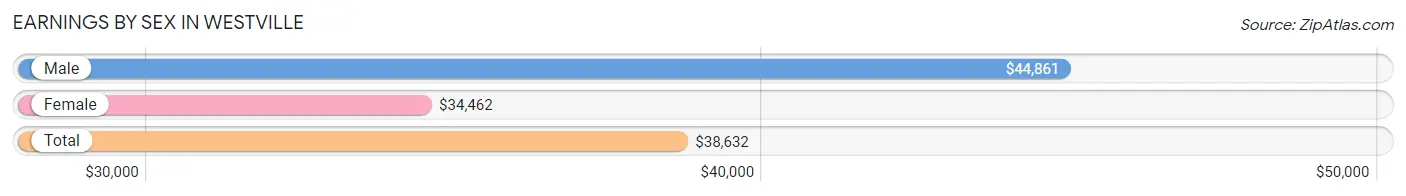
| Sex | Number | Average Earnings |
| Male | 984 (61.0%) | $44,861 |
| Female | 630 (39.0%) | $34,462 |
| Total | 1,614 (100.0%) | $38,632 |
Earnings by Sex by Income Bracket in Westville
The most common earnings brackets in Westville are $20,000 to $22,499 for men (116 | 11.8%) and $30,000 to $34,999 for women (94 | 14.9%).
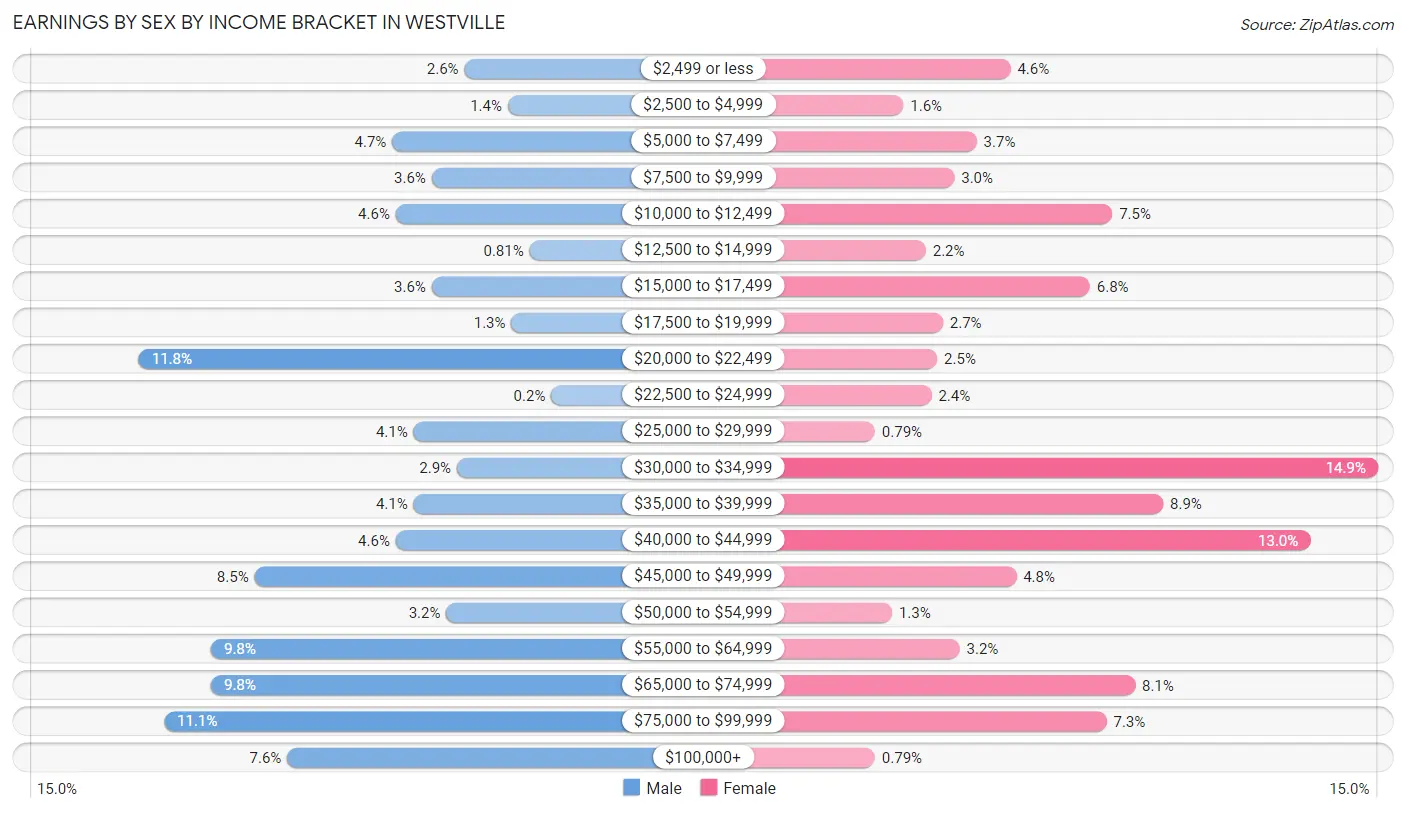
| Income | Male | Female |
| $2,499 or less | 26 (2.6%) | 29 (4.6%) |
| $2,500 to $4,999 | 14 (1.4%) | 10 (1.6%) |
| $5,000 to $7,499 | 46 (4.7%) | 23 (3.6%) |
| $7,500 to $9,999 | 35 (3.6%) | 19 (3.0%) |
| $10,000 to $12,499 | 45 (4.6%) | 47 (7.5%) |
| $12,500 to $14,999 | 8 (0.8%) | 14 (2.2%) |
| $15,000 to $17,499 | 35 (3.6%) | 43 (6.8%) |
| $17,500 to $19,999 | 13 (1.3%) | 17 (2.7%) |
| $20,000 to $22,499 | 116 (11.8%) | 16 (2.5%) |
| $22,500 to $24,999 | 2 (0.2%) | 15 (2.4%) |
| $25,000 to $29,999 | 40 (4.1%) | 5 (0.8%) |
| $30,000 to $34,999 | 28 (2.9%) | 94 (14.9%) |
| $35,000 to $39,999 | 40 (4.1%) | 56 (8.9%) |
| $40,000 to $44,999 | 45 (4.6%) | 82 (13.0%) |
| $45,000 to $49,999 | 84 (8.5%) | 30 (4.8%) |
| $50,000 to $54,999 | 31 (3.2%) | 8 (1.3%) |
| $55,000 to $64,999 | 96 (9.8%) | 20 (3.2%) |
| $65,000 to $74,999 | 96 (9.8%) | 51 (8.1%) |
| $75,000 to $99,999 | 109 (11.1%) | 46 (7.3%) |
| $100,000+ | 75 (7.6%) | 5 (0.8%) |
| Total | 984 (100.0%) | 630 (100.0%) |
Earnings by Sex by Educational Attainment in Westville
Average earnings in Westville are $47,742 for men and $38,750 for women, a difference of 18.8%. Men with an educational attainment of college or associate's degree enjoy the highest average annual earnings of $63,500, while those with less than high school education earn the least with $20,469. Women with an educational attainment of bachelor's degree earn the most with the average annual earnings of $65,231, while those with high school diploma education have the smallest earnings of $23,667.
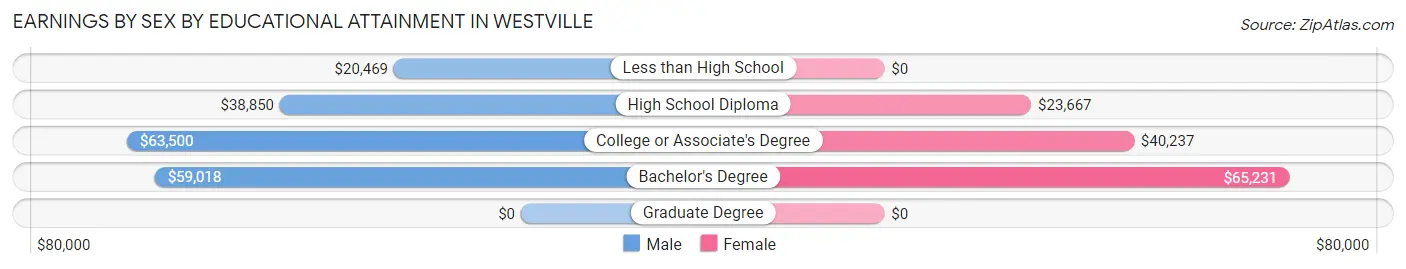
| Educational Attainment | Male Income | Female Income |
| Less than High School | $20,469 | $0 |
| High School Diploma | $38,850 | $23,667 |
| College or Associate's Degree | $63,500 | $40,237 |
| Bachelor's Degree | $59,018 | $65,231 |
| Graduate Degree | - | - |
| Total | $47,742 | $38,750 |
Family Income in Westville
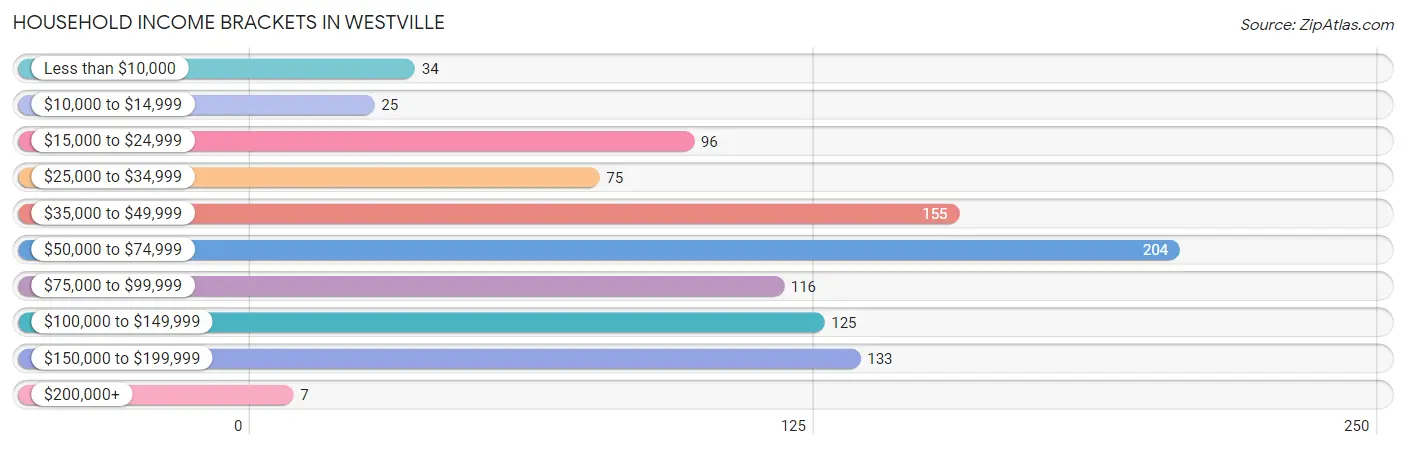
Family Income Brackets in Westville
According to the Westville family income data, there are 134 families falling into the $50,000 to $74,999 income range, which is the most common income bracket and makes up 21.9% of all families. Conversely, the $200,000+ income bracket is the least frequent group with only 7 families (1.1%) belonging to this category.
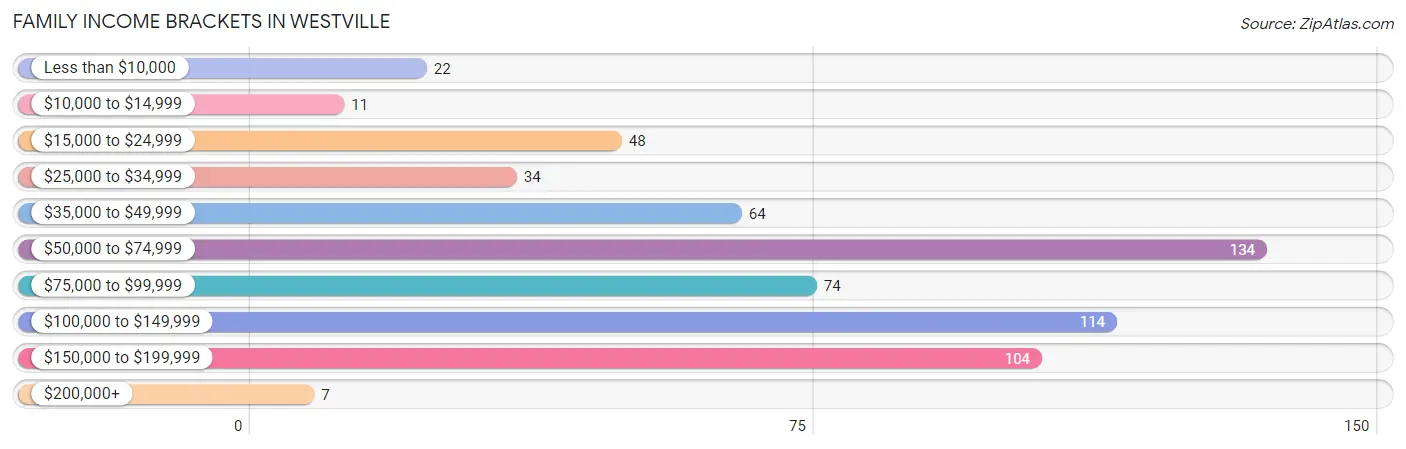
| Income Bracket | # Families | % Families |
| Less than $10,000 | 22 | 3.6% |
| $10,000 to $14,999 | 11 | 1.8% |
| $15,000 to $24,999 | 48 | 7.8% |
| $25,000 to $34,999 | 34 | 5.6% |
| $35,000 to $49,999 | 64 | 10.5% |
| $50,000 to $74,999 | 134 | 21.9% |
| $75,000 to $99,999 | 74 | 12.1% |
| $100,000 to $149,999 | 114 | 18.6% |
| $150,000 to $199,999 | 104 | 17.0% |
| $200,000+ | 7 | 1.1% |
Family Income by Famaliy Size in Westville
4-person families (112 | 18.3%) account for the highest median family income in Westville with $125,455 per family, while 2-person families (291 | 47.5%) have the highest median income of $35,586 per family member.
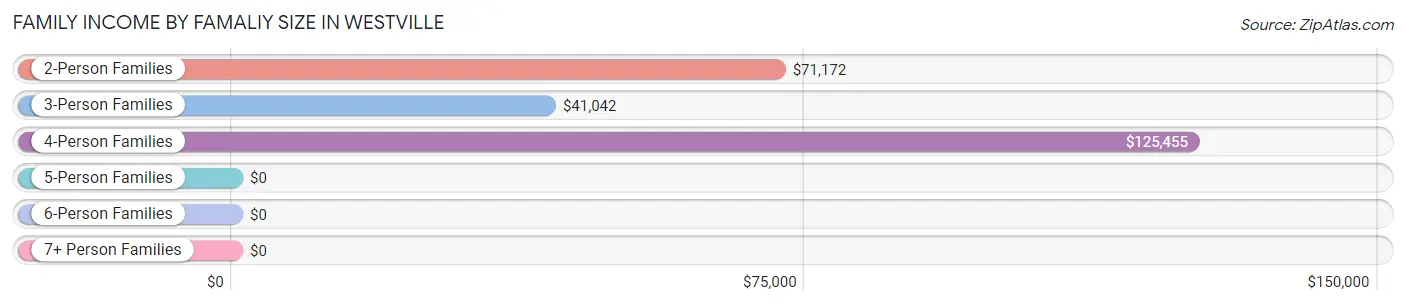
| Income Bracket | # Families | Median Income |
| 2-Person Families | 291 (47.5%) | $71,172 |
| 3-Person Families | 130 (21.2%) | $41,042 |
| 4-Person Families | 112 (18.3%) | $125,455 |
| 5-Person Families | 21 (3.4%) | $0 |
| 6-Person Families | 58 (9.5%) | $0 |
| 7+ Person Families | 0 (0.0%) | $0 |
| Total | 612 (100.0%) | $73,750 |
Family Income by Number of Earners in Westville
The median family income in Westville is $73,750, with families comprising 3+ earners (78) having the highest median family income of $165,819, while families with no earners (77) have the lowest median family income of $49,688, accounting for 12.8% and 12.6% of families, respectively.
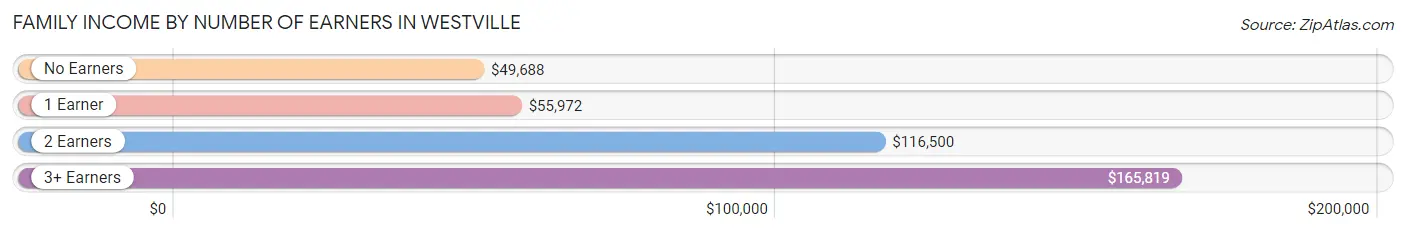
| Number of Earners | # Families | Median Income |
| No Earners | 77 (12.6%) | $49,688 |
| 1 Earner | 233 (38.1%) | $55,972 |
| 2 Earners | 224 (36.6%) | $116,500 |
| 3+ Earners | 78 (12.8%) | $165,819 |
| Total | 612 (100.0%) | $73,750 |
Household Income in Westville
Household Income Brackets in Westville
With 204 households falling in the category, the $50,000 to $74,999 income range is the most frequent in Westville, accounting for 21.0% of all households. In contrast, only 7 households (0.7%) fall into the $200,000+ income bracket, making it the least populous group.
| Income Bracket | # Households | % Households |
| Less than $10,000 | 34 | 3.5% |
| $10,000 to $14,999 | 25 | 2.6% |
| $15,000 to $24,999 | 96 | 9.9% |
| $25,000 to $34,999 | 75 | 7.7% |
| $35,000 to $49,999 | 155 | 16.0% |
| $50,000 to $74,999 | 204 | 21.0% |
| $75,000 to $99,999 | 116 | 12.0% |
| $100,000 to $149,999 | 125 | 12.9% |
| $150,000 to $199,999 | 133 | 13.7% |
| $200,000+ | 7 | 0.7% |
Household Income by Householder Age in Westville
The median household income in Westville is $57,889, with the highest median household income of $83,417 found in the 25 to 44 years age bracket for the primary householder. A total of 456 households (47.0%) fall into this category. Meanwhile, the 65+ years age bracket for the primary householder has the lowest median household income of $37,813, with 237 households (24.4%) in this group.
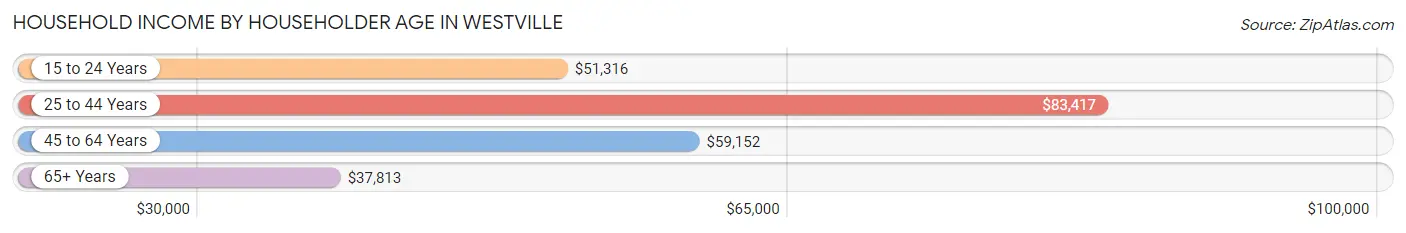
| Income Bracket | # Households | Median Income |
| 15 to 24 Years | 32 (3.3%) | $51,316 |
| 25 to 44 Years | 456 (47.0%) | $83,417 |
| 45 to 64 Years | 245 (25.3%) | $59,152 |
| 65+ Years | 237 (24.4%) | $37,813 |
| Total | 970 (100.0%) | $57,889 |
Poverty in Westville
Income Below Poverty by Sex and Age in Westville
With 7.7% poverty level for males and 12.2% for females among the residents of Westville, 16 and 17 year old males and 15 year old females are the most vulnerable to poverty, with 5 males (71.4%) and 14 females (100.0%) in their respective age groups living below the poverty level.
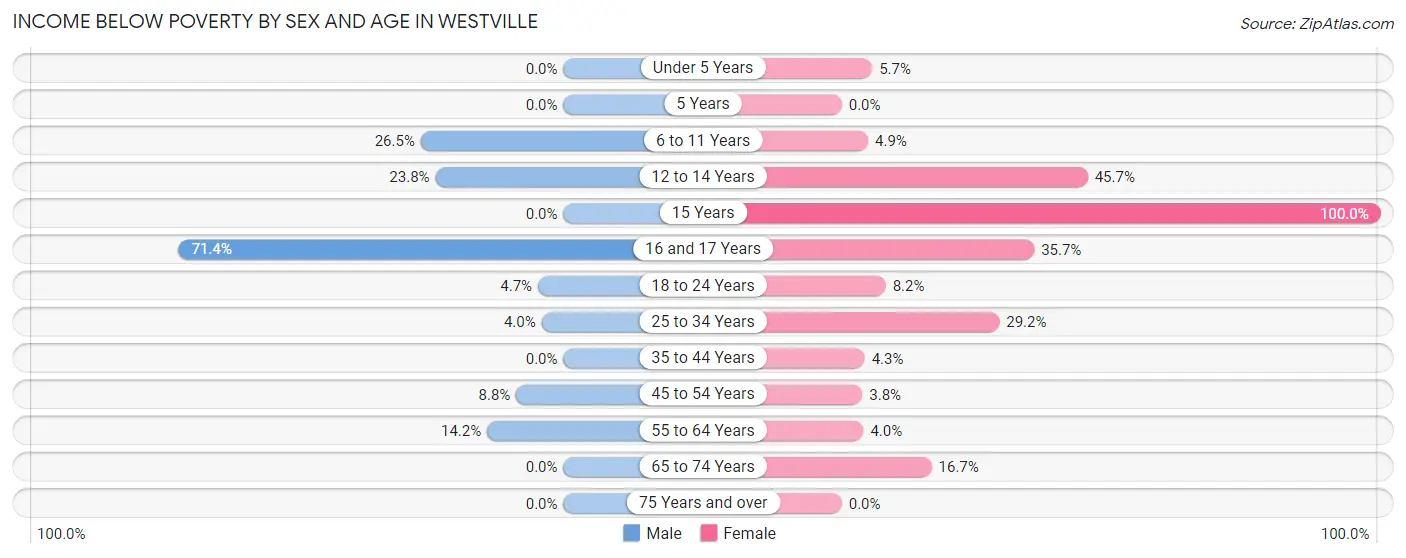
| Age Bracket | Male | Female |
| Under 5 Years | 0 (0.0%) | 7 (5.7%) |
| 5 Years | 0 (0.0%) | 0 (0.0%) |
| 6 to 11 Years | 27 (26.5%) | 4 (4.9%) |
| 12 to 14 Years | 19 (23.7%) | 21 (45.7%) |
| 15 Years | 0 (0.0%) | 14 (100.0%) |
| 16 and 17 Years | 5 (71.4%) | 5 (35.7%) |
| 18 to 24 Years | 6 (4.7%) | 11 (8.2%) |
| 25 to 34 Years | 8 (4.0%) | 50 (29.2%) |
| 35 to 44 Years | 0 (0.0%) | 9 (4.3%) |
| 45 to 54 Years | 7 (8.7%) | 4 (3.8%) |
| 55 to 64 Years | 17 (14.2%) | 5 (4.0%) |
| 65 to 74 Years | 0 (0.0%) | 19 (16.7%) |
| 75 Years and over | 0 (0.0%) | 0 (0.0%) |
| Total | 89 (7.7%) | 149 (12.2%) |
Income Above Poverty by Sex and Age in Westville
According to the poverty statistics in Westville, males aged under 5 years and females aged 5 years are the age groups that are most secure financially, with 100.0% of males and 100.0% of females in these age groups living above the poverty line.
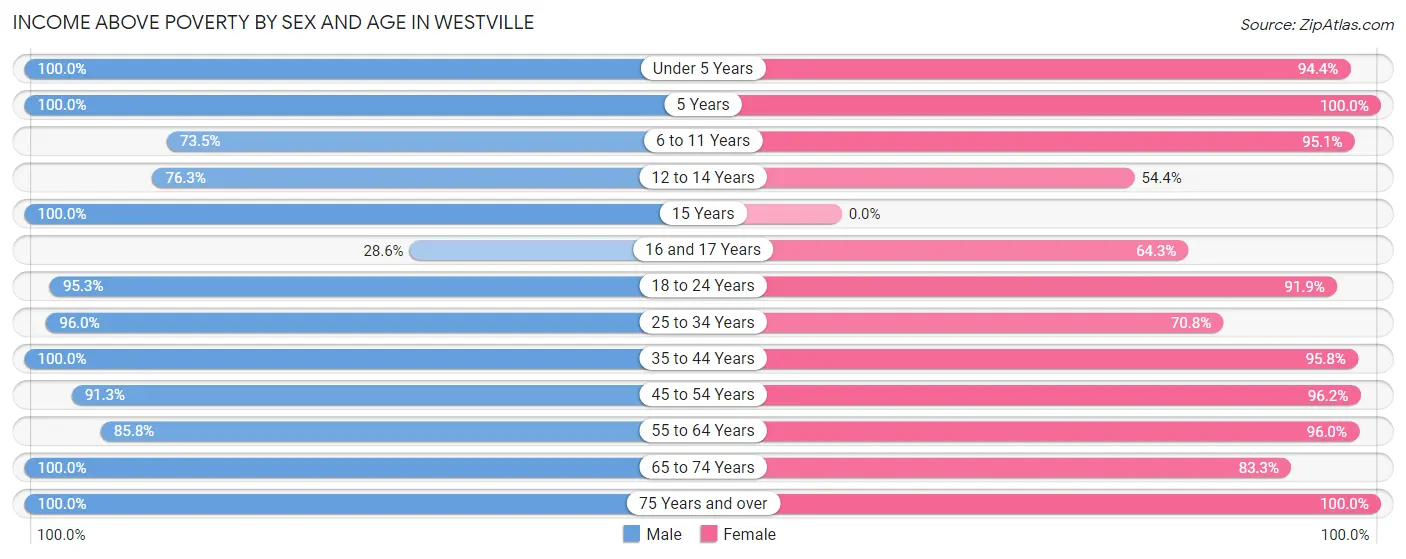
| Age Bracket | Male | Female |
| Under 5 Years | 47 (100.0%) | 117 (94.4%) |
| 5 Years | 12 (100.0%) | 24 (100.0%) |
| 6 to 11 Years | 75 (73.5%) | 78 (95.1%) |
| 12 to 14 Years | 61 (76.2%) | 25 (54.3%) |
| 15 Years | 6 (100.0%) | 0 (0.0%) |
| 16 and 17 Years | 2 (28.6%) | 9 (64.3%) |
| 18 to 24 Years | 121 (95.3%) | 124 (91.8%) |
| 25 to 34 Years | 190 (96.0%) | 121 (70.8%) |
| 35 to 44 Years | 216 (100.0%) | 203 (95.8%) |
| 45 to 54 Years | 73 (91.2%) | 101 (96.2%) |
| 55 to 64 Years | 103 (85.8%) | 119 (96.0%) |
| 65 to 74 Years | 76 (100.0%) | 95 (83.3%) |
| 75 Years and over | 83 (100.0%) | 52 (100.0%) |
| Total | 1,065 (92.3%) | 1,068 (87.8%) |
Income Below Poverty Among Married-Couple Families in Westville
The poverty statistics for married-couple families in Westville show that 1.0% or 4 of the total 390 families live below the poverty line. Families with no children have the highest poverty rate of 2.2%, comprising of 4 families. On the other hand, families with 1 or 2 children have the lowest poverty rate of 0.0%, which includes 0 families.
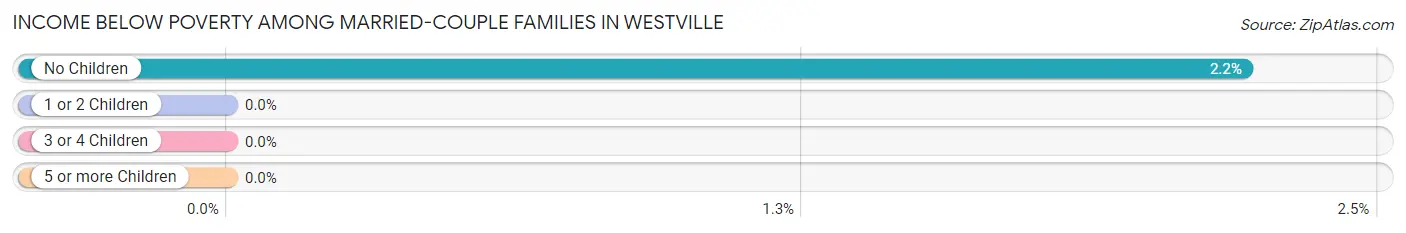
| Children | Above Poverty | Below Poverty |
| No Children | 177 (97.8%) | 4 (2.2%) |
| 1 or 2 Children | 203 (100.0%) | 0 (0.0%) |
| 3 or 4 Children | 6 (100.0%) | 0 (0.0%) |
| 5 or more Children | 0 (0.0%) | 0 (0.0%) |
| Total | 386 (99.0%) | 4 (1.0%) |
Income Below Poverty Among Single-Parent Households in Westville
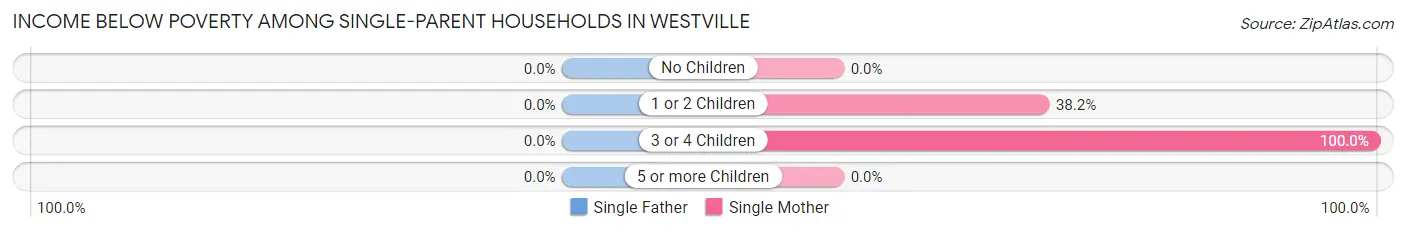
| Children | Single Father | Single Mother |
| No Children | 0 (0.0%) | 0 (0.0%) |
| 1 or 2 Children | 0 (0.0%) | 39 (38.2%) |
| 3 or 4 Children | 0 (0.0%) | 18 (100.0%) |
| 5 or more Children | 0 (0.0%) | 0 (0.0%) |
| Total | 0 (0.0%) | 57 (31.1%) |
Income Below Poverty Among Married-Couple vs Single-Parent Households in Westville
The poverty data for Westville shows that 4 of the married-couple family households (1.0%) and 57 of the single-parent households (25.7%) are living below the poverty level. Within the married-couple family households, those with no children have the highest poverty rate, with 4 households (2.2%) falling below the poverty line. Among the single-parent households, those with 3 or 4 children have the highest poverty rate, with 18 household (100.0%) living below poverty.
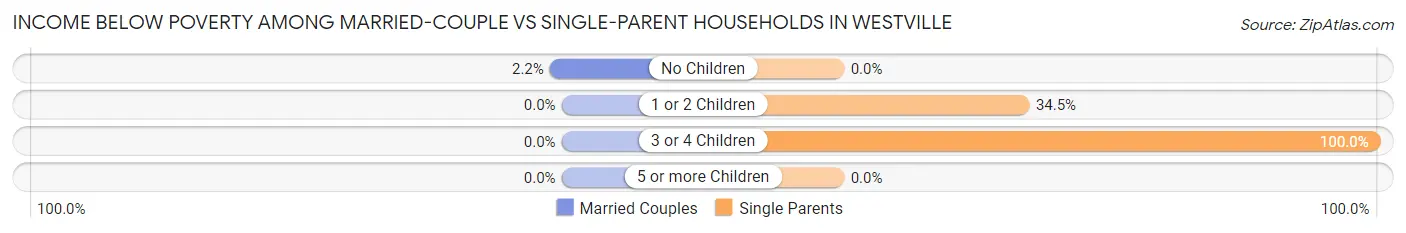
| Children | Married-Couple Families | Single-Parent Households |
| No Children | 4 (2.2%) | 0 (0.0%) |
| 1 or 2 Children | 0 (0.0%) | 39 (34.5%) |
| 3 or 4 Children | 0 (0.0%) | 18 (100.0%) |
| 5 or more Children | 0 (0.0%) | 0 (0.0%) |
| Total | 4 (1.0%) | 57 (25.7%) |
Employment Characteristics in Westville
Employment by Class of Employer in Westville
Among the 1,144 employed individuals in Westville, private company employees (730 | 63.8%), state government employees (188 | 16.4%), and local government employees (120 | 10.5%) make up the most common classes of employment.
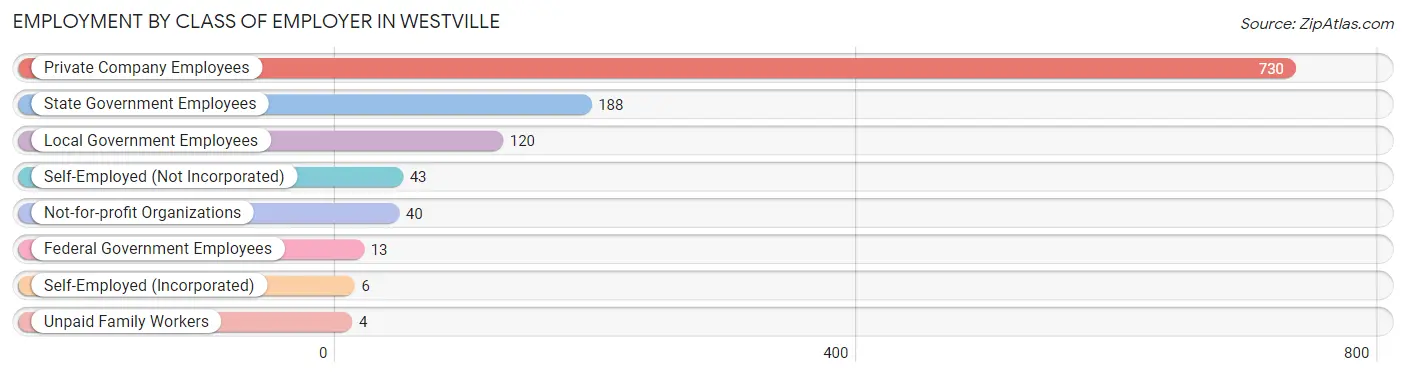
| Employer Class | # Employees | % Employees |
| Private Company Employees | 730 | 63.8% |
| Self-Employed (Incorporated) | 6 | 0.5% |
| Self-Employed (Not Incorporated) | 43 | 3.8% |
| Not-for-profit Organizations | 40 | 3.5% |
| Local Government Employees | 120 | 10.5% |
| State Government Employees | 188 | 16.4% |
| Federal Government Employees | 13 | 1.1% |
| Unpaid Family Workers | 4 | 0.4% |
| Total | 1,144 | 100.0% |
Employment Status by Age in Westville
According to the labor force statistics for Westville, out of the total population over 16 years of age (5,346), 24.3% or 1,299 individuals are in the labor force, with 8.9% or 116 of them unemployed. The age group with the highest labor force participation rate is 16 to 19 years, with 41.9% or 18 individuals in the labor force. Within the labor force, the 20 to 24 years age range has the highest percentage of unemployed individuals, with 38.4% or 81 of them being unemployed.
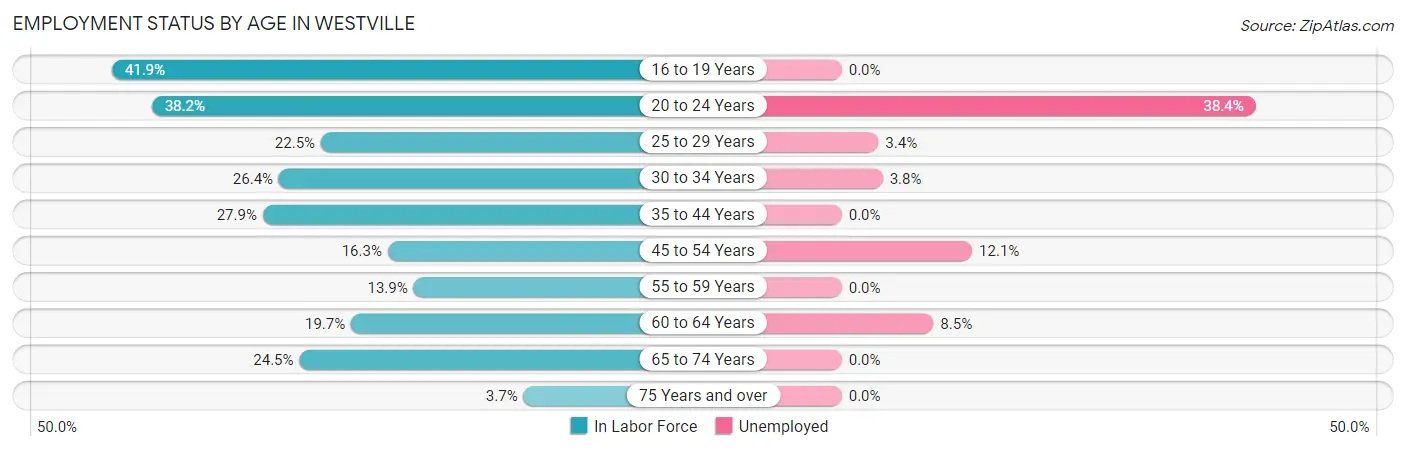
| Age Bracket | In Labor Force | Unemployed |
| 16 to 19 Years | 18 (41.9%) | 0 (0.0%) |
| 20 to 24 Years | 211 (38.2%) | 81 (38.4%) |
| 25 to 29 Years | 146 (22.5%) | 5 (3.4%) |
| 30 to 34 Years | 209 (26.4%) | 8 (3.8%) |
| 35 to 44 Years | 411 (27.9%) | 0 (0.0%) |
| 45 to 54 Years | 140 (16.3%) | 17 (12.1%) |
| 55 to 59 Years | 46 (13.9%) | 0 (0.0%) |
| 60 to 64 Years | 47 (19.7%) | 4 (8.5%) |
| 65 to 74 Years | 67 (24.5%) | 0 (0.0%) |
| 75 Years and over | 5 (3.7%) | 0 (0.0%) |
| Total | 1,299 (24.3%) | 116 (8.9%) |
Employment Status by Educational Attainment in Westville
According to labor force statistics for Westville, 23.0% of individuals (999) out of the total population between 25 and 64 years of age (4,343) are in the labor force, with 3.4% or 34 of them being unemployed. The group with the highest labor force participation rate are those with the educational attainment of bachelor's degree or higher, with 82.0% or 209 individuals in the labor force. Within the labor force, individuals with less than high school education have the highest percentage of unemployment, with 22.8% or 13 of them being unemployed.
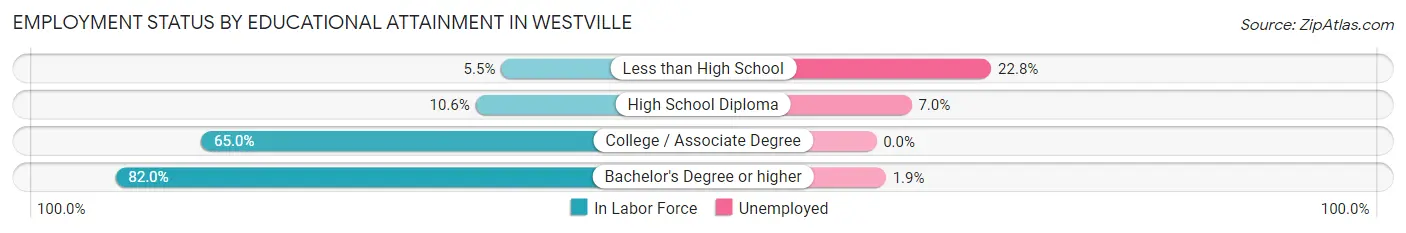
| Educational Attainment | In Labor Force | Unemployed |
| Less than High School | 57 (5.5%) | 238 (22.8%) |
| High School Diploma | 243 (10.6%) | 161 (7.0%) |
| College / Associate Degree | 489 (65.0%) | 0 (0.0%) |
| Bachelor's Degree or higher | 209 (82.0%) | 5 (1.9%) |
| Total | 999 (23.0%) | 148 (3.4%) |
Employment Occupations by Sex in Westville
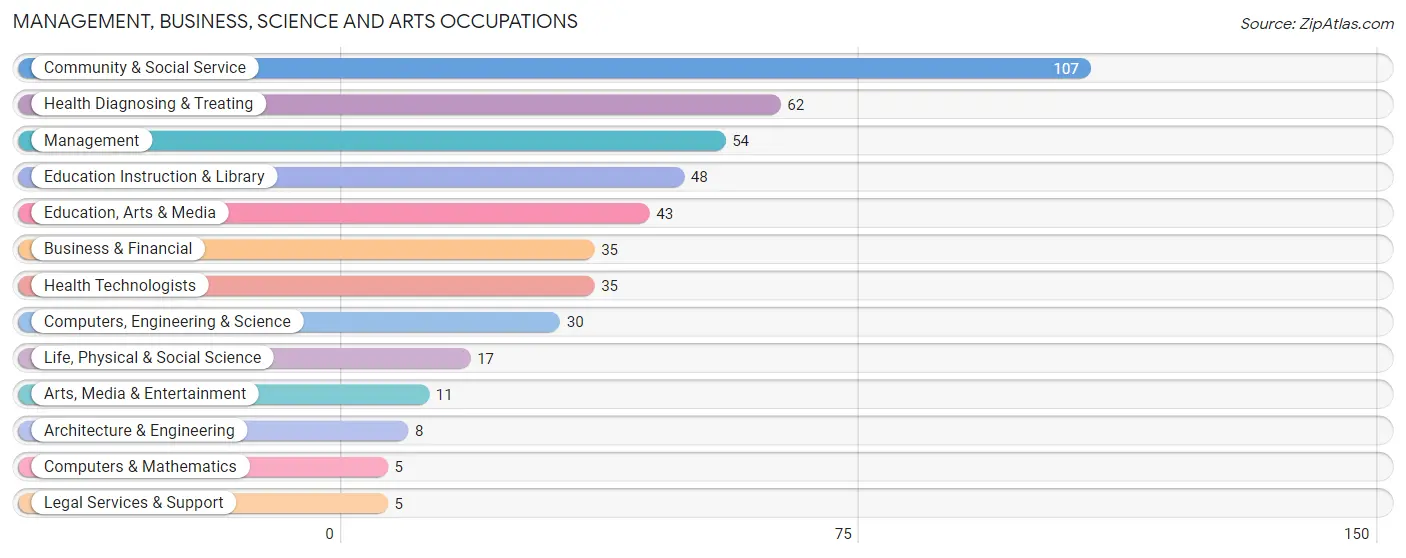
Management, Business, Science and Arts Occupations
The most common Management, Business, Science and Arts occupations in Westville are Community & Social Service (107 | 9.0%), Health Diagnosing & Treating (62 | 5.2%), Management (54 | 4.6%), Education Instruction & Library (48 | 4.1%), and Education, Arts & Media (43 | 3.6%).
Management, Business, Science and Arts Occupations by Sex
Within the Management, Business, Science and Arts occupations in Westville, the most male-oriented occupations are Computers & Mathematics (100.0%), Architecture & Engineering (100.0%), and Legal Services & Support (100.0%), while the most female-oriented occupations are Life, Physical & Social Science (100.0%), Education Instruction & Library (100.0%), and Business & Financial (85.7%).
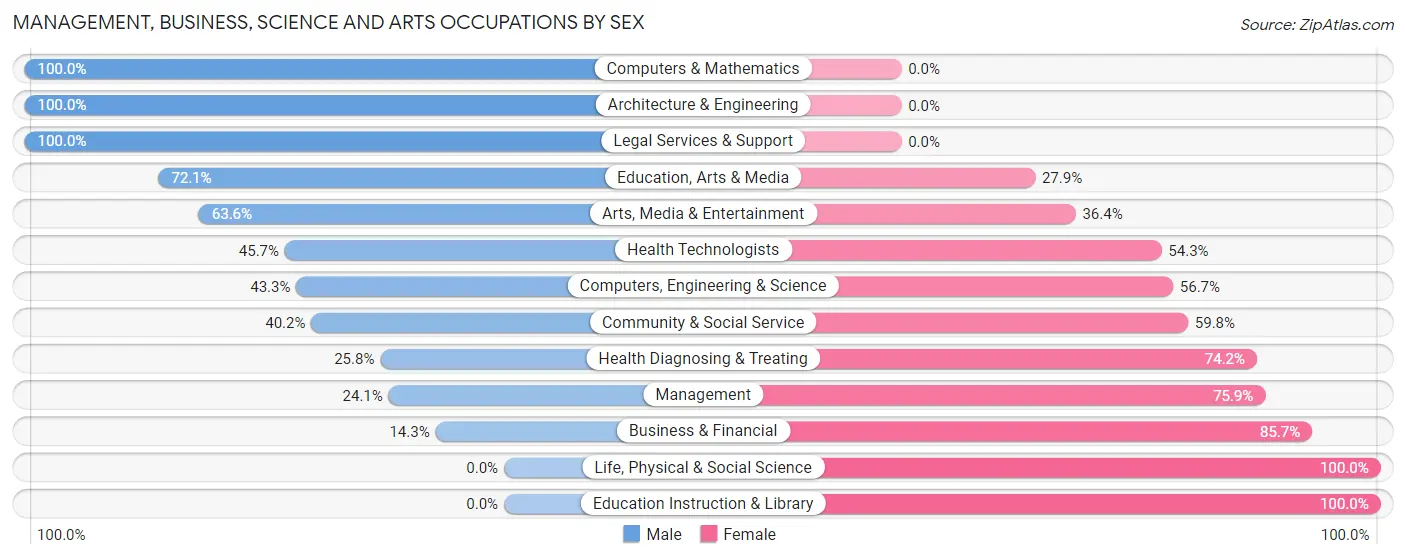
| Occupation | Male | Female |
| Management | 13 (24.1%) | 41 (75.9%) |
| Business & Financial | 5 (14.3%) | 30 (85.7%) |
| Computers, Engineering & Science | 13 (43.3%) | 17 (56.7%) |
| Computers & Mathematics | 5 (100.0%) | 0 (0.0%) |
| Architecture & Engineering | 8 (100.0%) | 0 (0.0%) |
| Life, Physical & Social Science | 0 (0.0%) | 17 (100.0%) |
| Community & Social Service | 43 (40.2%) | 64 (59.8%) |
| Education, Arts & Media | 31 (72.1%) | 12 (27.9%) |
| Legal Services & Support | 5 (100.0%) | 0 (0.0%) |
| Education Instruction & Library | 0 (0.0%) | 48 (100.0%) |
| Arts, Media & Entertainment | 7 (63.6%) | 4 (36.4%) |
| Health Diagnosing & Treating | 16 (25.8%) | 46 (74.2%) |
| Health Technologists | 16 (45.7%) | 19 (54.3%) |
| Total (Category) | 90 (31.2%) | 198 (68.8%) |
| Total (Overall) | 580 (49.0%) | 604 (51.0%) |
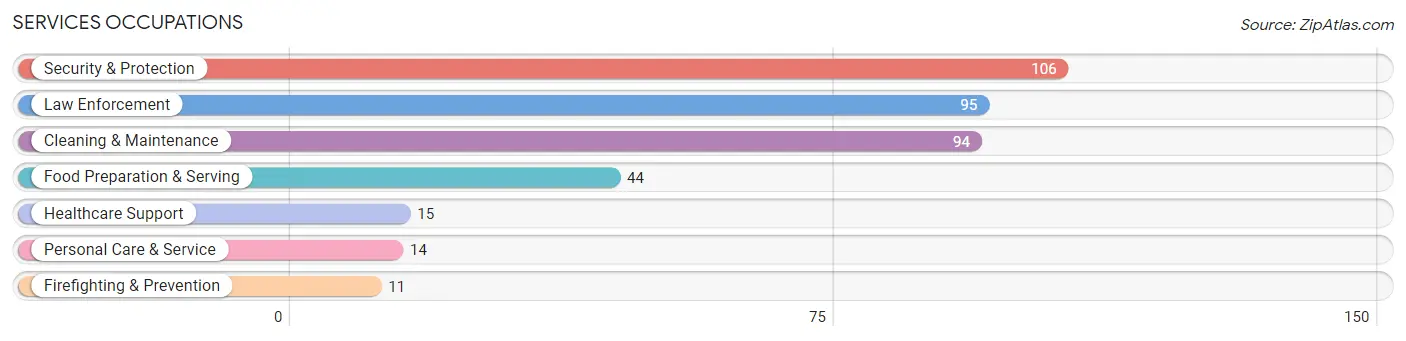
Services Occupations
The most common Services occupations in Westville are Security & Protection (106 | 8.9%), Law Enforcement (95 | 8.0%), Cleaning & Maintenance (94 | 7.9%), Food Preparation & Serving (44 | 3.7%), and Healthcare Support (15 | 1.3%).
Services Occupations by Sex
Within the Services occupations in Westville, the most male-oriented occupations are Firefighting & Prevention (100.0%), Personal Care & Service (100.0%), and Cleaning & Maintenance (63.8%), while the most female-oriented occupations are Healthcare Support (100.0%), Law Enforcement (78.9%), and Security & Protection (70.8%).
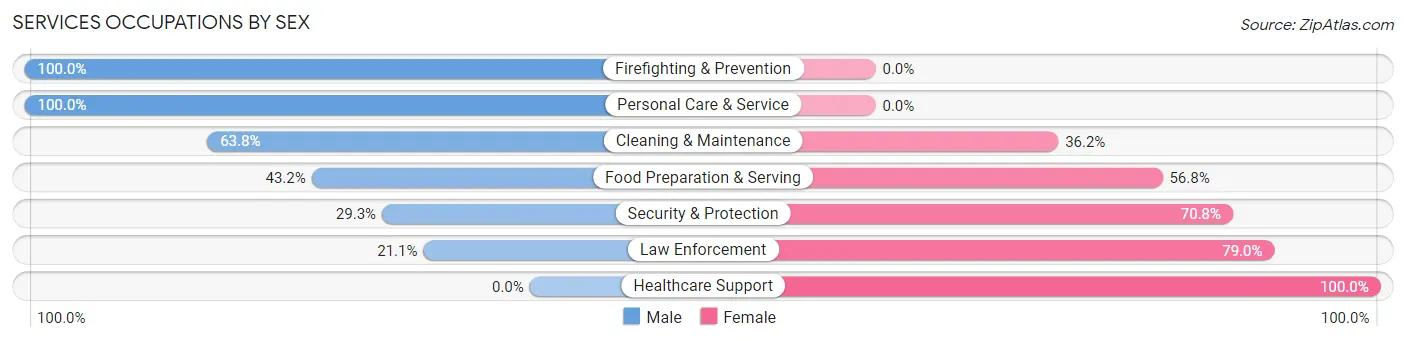
| Occupation | Male | Female |
| Healthcare Support | 0 (0.0%) | 15 (100.0%) |
| Security & Protection | 31 (29.2%) | 75 (70.8%) |
| Firefighting & Prevention | 11 (100.0%) | 0 (0.0%) |
| Law Enforcement | 20 (21.0%) | 75 (78.9%) |
| Food Preparation & Serving | 19 (43.2%) | 25 (56.8%) |
| Cleaning & Maintenance | 60 (63.8%) | 34 (36.2%) |
| Personal Care & Service | 14 (100.0%) | 0 (0.0%) |
| Total (Category) | 124 (45.4%) | 149 (54.6%) |
| Total (Overall) | 580 (49.0%) | 604 (51.0%) |
Sales and Office Occupations
The most common Sales and Office occupations in Westville are Office & Administration (190 | 16.1%), and Sales & Related (40 | 3.4%).
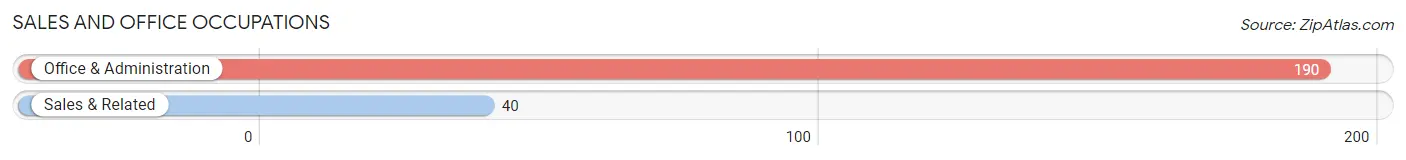
Sales and Office Occupations by Sex

| Occupation | Male | Female |
| Sales & Related | 22 (55.0%) | 18 (45.0%) |
| Office & Administration | 32 (16.8%) | 158 (83.2%) |
| Total (Category) | 54 (23.5%) | 176 (76.5%) |
| Total (Overall) | 580 (49.0%) | 604 (51.0%) |
Natural Resources, Construction and Maintenance Occupations
The most common Natural Resources, Construction and Maintenance occupations in Westville are Installation, Maintenance & Repair (91 | 7.7%), and Construction & Extraction (49 | 4.1%).
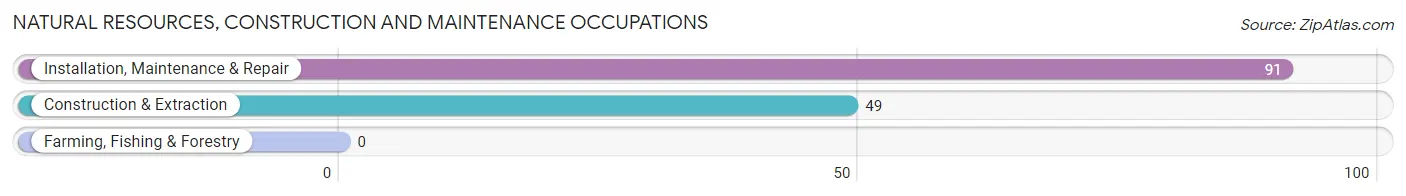
Natural Resources, Construction and Maintenance Occupations by Sex

| Occupation | Male | Female |
| Farming, Fishing & Forestry | 0 (0.0%) | 0 (0.0%) |
| Construction & Extraction | 49 (100.0%) | 0 (0.0%) |
| Installation, Maintenance & Repair | 91 (100.0%) | 0 (0.0%) |
| Total (Category) | 140 (100.0%) | 0 (0.0%) |
| Total (Overall) | 580 (49.0%) | 604 (51.0%) |
Production, Transportation and Moving Occupations
The most common Production, Transportation and Moving occupations in Westville are Production (141 | 11.9%), Material Moving (64 | 5.4%), and Transportation (48 | 4.1%).
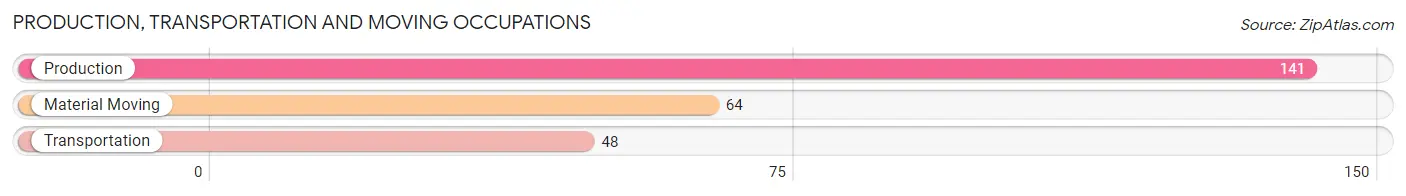
Production, Transportation and Moving Occupations by Sex
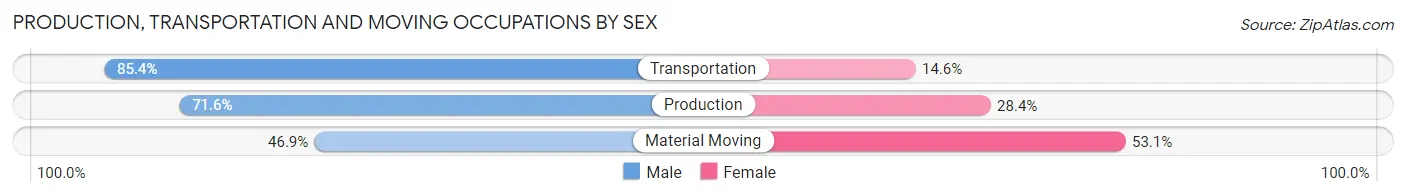
| Occupation | Male | Female |
| Production | 101 (71.6%) | 40 (28.4%) |
| Transportation | 41 (85.4%) | 7 (14.6%) |
| Material Moving | 30 (46.9%) | 34 (53.1%) |
| Total (Category) | 172 (68.0%) | 81 (32.0%) |
| Total (Overall) | 580 (49.0%) | 604 (51.0%) |
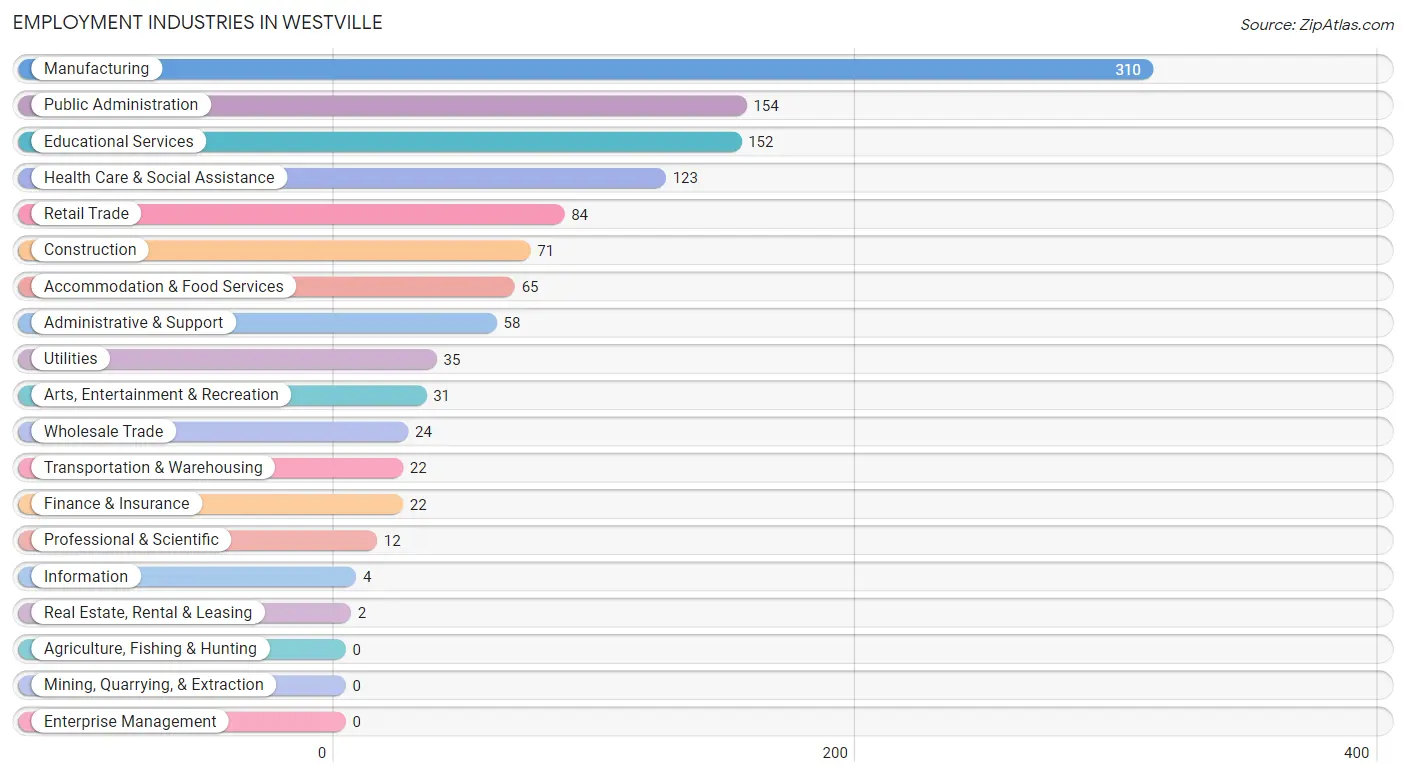
Employment Industries by Sex in Westville
Employment Industries in Westville
The major employment industries in Westville include Manufacturing (310 | 26.2%), Public Administration (154 | 13.0%), Educational Services (152 | 12.8%), Health Care & Social Assistance (123 | 10.4%), and Retail Trade (84 | 7.1%).
Employment Industries by Sex in Westville
The Westville industries that see more men than women are Arts, Entertainment & Recreation (100.0%), Construction (81.7%), and Manufacturing (67.7%), whereas the industries that tend to have a higher number of women are Wholesale Trade (100.0%), Information (100.0%), and Real Estate, Rental & Leasing (100.0%).
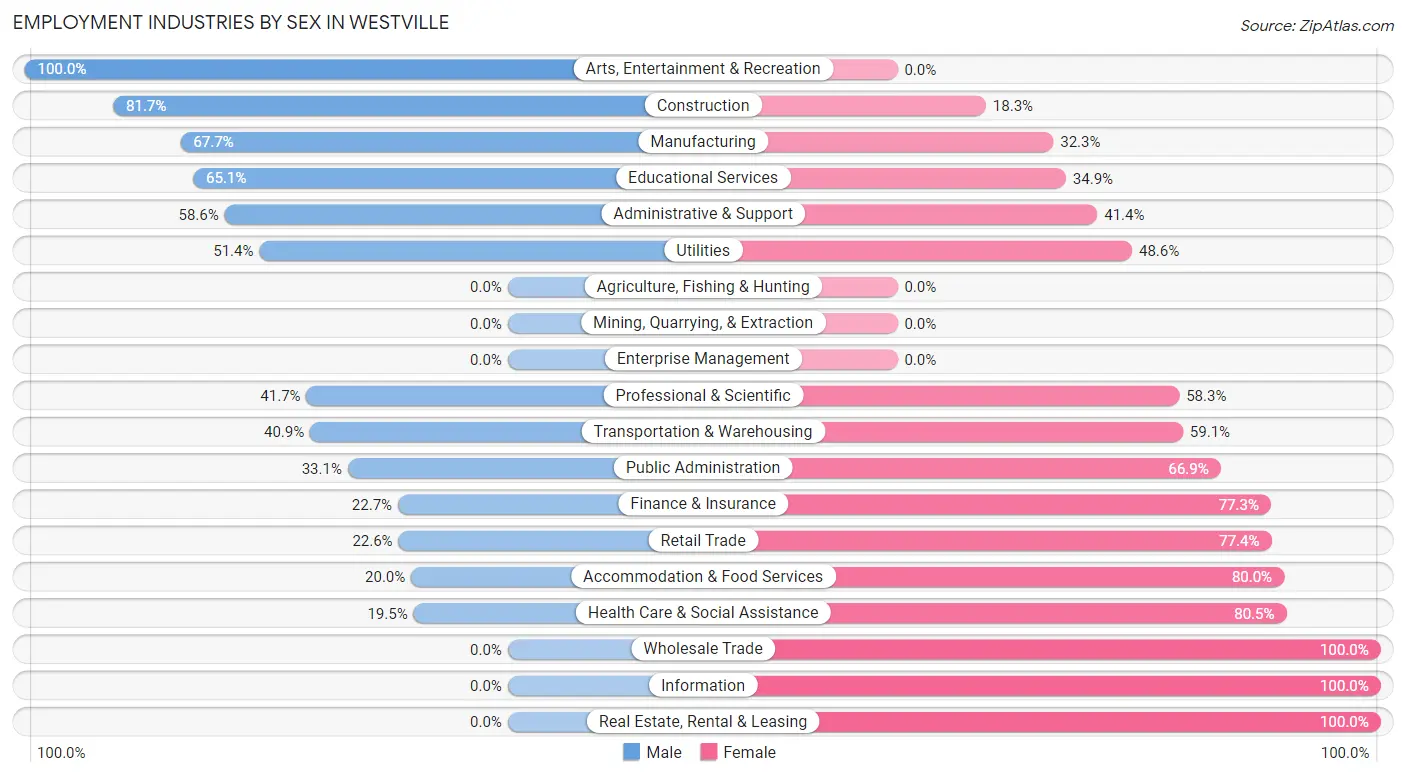
| Industry | Male | Female |
| Agriculture, Fishing & Hunting | 0 (0.0%) | 0 (0.0%) |
| Mining, Quarrying, & Extraction | 0 (0.0%) | 0 (0.0%) |
| Construction | 58 (81.7%) | 13 (18.3%) |
| Manufacturing | 210 (67.7%) | 100 (32.3%) |
| Wholesale Trade | 0 (0.0%) | 24 (100.0%) |
| Retail Trade | 19 (22.6%) | 65 (77.4%) |
| Transportation & Warehousing | 9 (40.9%) | 13 (59.1%) |
| Utilities | 18 (51.4%) | 17 (48.6%) |
| Information | 0 (0.0%) | 4 (100.0%) |
| Finance & Insurance | 5 (22.7%) | 17 (77.3%) |
| Real Estate, Rental & Leasing | 0 (0.0%) | 2 (100.0%) |
| Professional & Scientific | 5 (41.7%) | 7 (58.3%) |
| Enterprise Management | 0 (0.0%) | 0 (0.0%) |
| Administrative & Support | 34 (58.6%) | 24 (41.4%) |
| Educational Services | 99 (65.1%) | 53 (34.9%) |
| Health Care & Social Assistance | 24 (19.5%) | 99 (80.5%) |
| Arts, Entertainment & Recreation | 31 (100.0%) | 0 (0.0%) |
| Accommodation & Food Services | 13 (20.0%) | 52 (80.0%) |
| Public Administration | 51 (33.1%) | 103 (66.9%) |
| Total | 580 (49.0%) | 604 (51.0%) |
Education in Westville
School Enrollment in Westville
The most common levels of schooling among the 450 students in Westville are elementary school (130 | 28.9%), high school (107 | 23.8%), and middle school (105 | 23.3%).
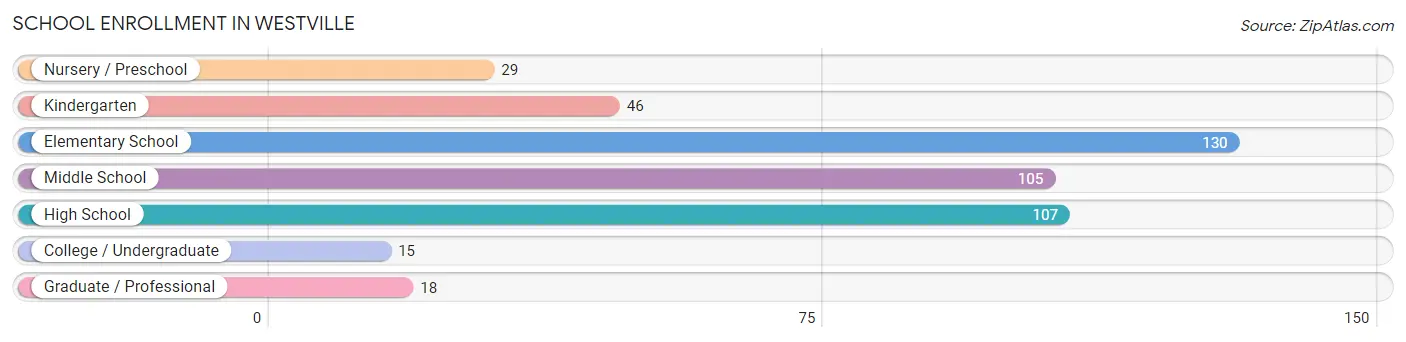
| School Level | # Students | % Students |
| Nursery / Preschool | 29 | 6.4% |
| Kindergarten | 46 | 10.2% |
| Elementary School | 130 | 28.9% |
| Middle School | 105 | 23.3% |
| High School | 107 | 23.8% |
| College / Undergraduate | 15 | 3.3% |
| Graduate / Professional | 18 | 4.0% |
| Total | 450 | 100.0% |
School Enrollment by Age by Funding Source in Westville
Out of a total of 450 students who are enrolled in schools in Westville, 41 (9.1%) attend a private institution, while the remaining 409 (90.9%) are enrolled in public schools. The age group of 20 to 24 year olds has the highest likelihood of being enrolled in private schools, with 6 (100.0% in the age bracket) enrolled. Conversely, the age group of 3 to 4 year olds has the lowest likelihood of being enrolled in a private school, with 17 (100.0% in the age bracket) attending a public institution.
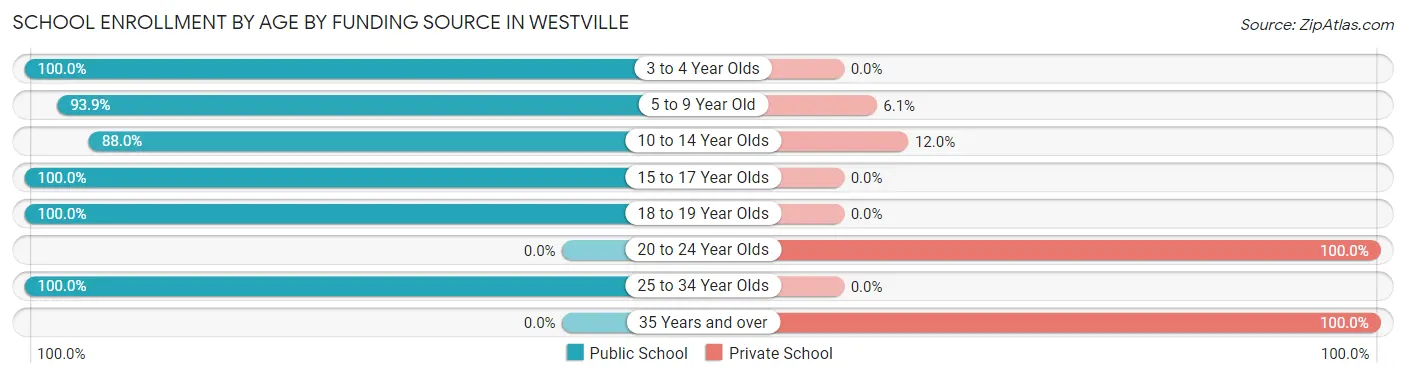
| Age Bracket | Public School | Private School |
| 3 to 4 Year Olds | 17 (100.0%) | 0 (0.0%) |
| 5 to 9 Year Old | 170 (93.9%) | 11 (6.1%) |
| 10 to 14 Year Olds | 147 (88.0%) | 20 (12.0%) |
| 15 to 17 Year Olds | 41 (100.0%) | 0 (0.0%) |
| 18 to 19 Year Olds | 11 (100.0%) | 0 (0.0%) |
| 20 to 24 Year Olds | 0 (0.0%) | 6 (100.0%) |
| 25 to 34 Year Olds | 23 (100.0%) | 0 (0.0%) |
| 35 Years and over | 0 (0.0%) | 4 (100.0%) |
| Total | 409 (90.9%) | 41 (9.1%) |
Educational Attainment by Field of Study in Westville
Arts & humanities (41 | 14.9%), science & technology (38 | 13.8%), education (37 | 13.5%), business (36 | 13.1%), and engineering (34 | 12.4%) are the most common fields of study among 275 individuals in Westville who have obtained a bachelor's degree or higher.
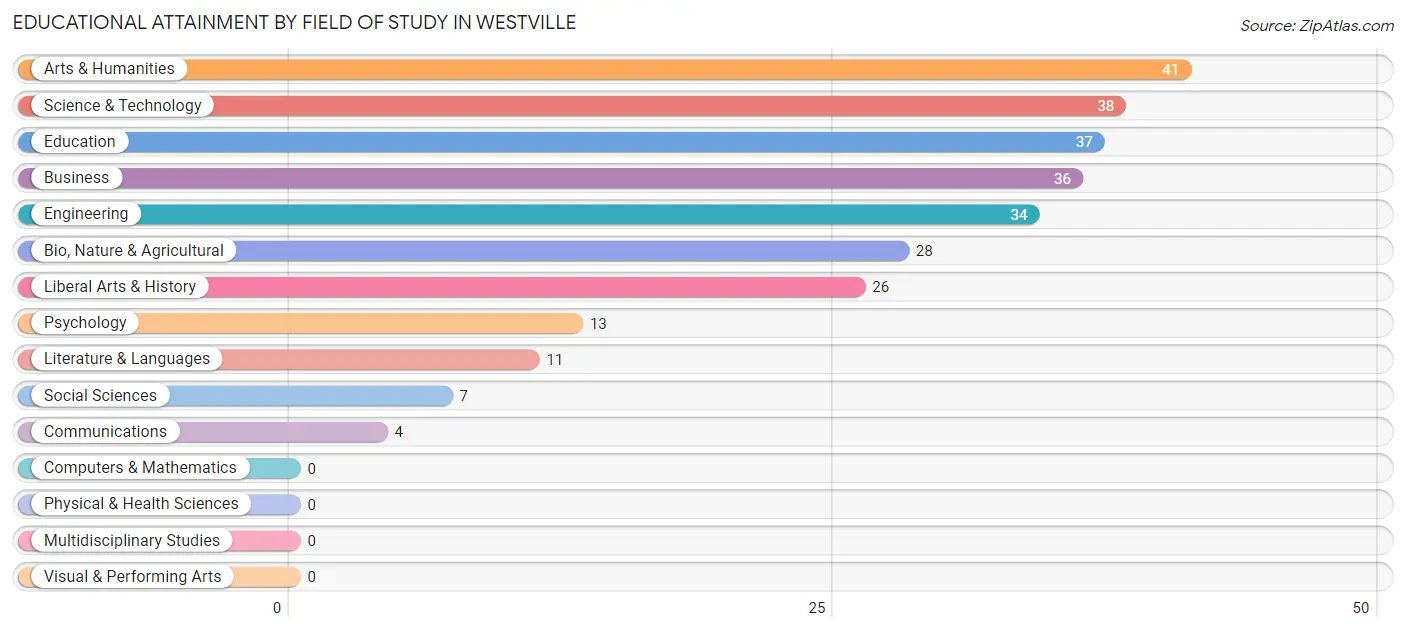
| Field of Study | # Graduates | % Graduates |
| Computers & Mathematics | 0 | 0.0% |
| Bio, Nature & Agricultural | 28 | 10.2% |
| Physical & Health Sciences | 0 | 0.0% |
| Psychology | 13 | 4.7% |
| Social Sciences | 7 | 2.5% |
| Engineering | 34 | 12.4% |
| Multidisciplinary Studies | 0 | 0.0% |
| Science & Technology | 38 | 13.8% |
| Business | 36 | 13.1% |
| Education | 37 | 13.5% |
| Literature & Languages | 11 | 4.0% |
| Liberal Arts & History | 26 | 9.5% |
| Visual & Performing Arts | 0 | 0.0% |
| Communications | 4 | 1.5% |
| Arts & Humanities | 41 | 14.9% |
| Total | 275 | 100.0% |
Transportation & Commute in Westville
Vehicle Availability by Sex in Westville
The most prevalent vehicle ownership categories in Westville are males with 2 vehicles (342, accounting for 62.1%) and females with 2 vehicles (298, making up 57.7%).
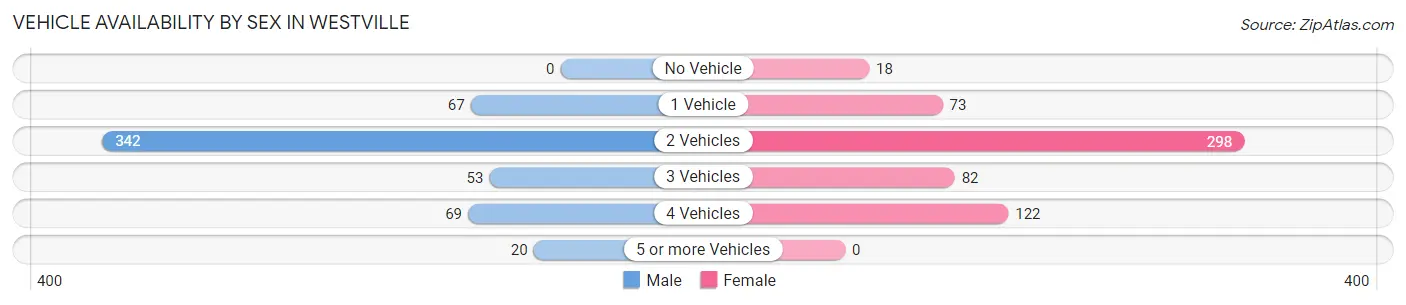
| Vehicles Available | Male | Female |
| No Vehicle | 0 (0.0%) | 18 (3.0%) |
| 1 Vehicle | 67 (12.2%) | 73 (12.3%) |
| 2 Vehicles | 342 (62.1%) | 298 (50.2%) |
| 3 Vehicles | 53 (9.6%) | 82 (13.8%) |
| 4 Vehicles | 69 (12.5%) | 122 (20.6%) |
| 5 or more Vehicles | 20 (3.6%) | 0 (0.0%) |
| Total | 551 (100.0%) | 593 (100.0%) |
Commute Time in Westville
The most frequently occuring commute durations in Westville are 20 to 24 minutes (287 commuters, 26.1%), 5 to 9 minutes (141 commuters, 12.8%), and 30 to 34 minutes (130 commuters, 11.8%).
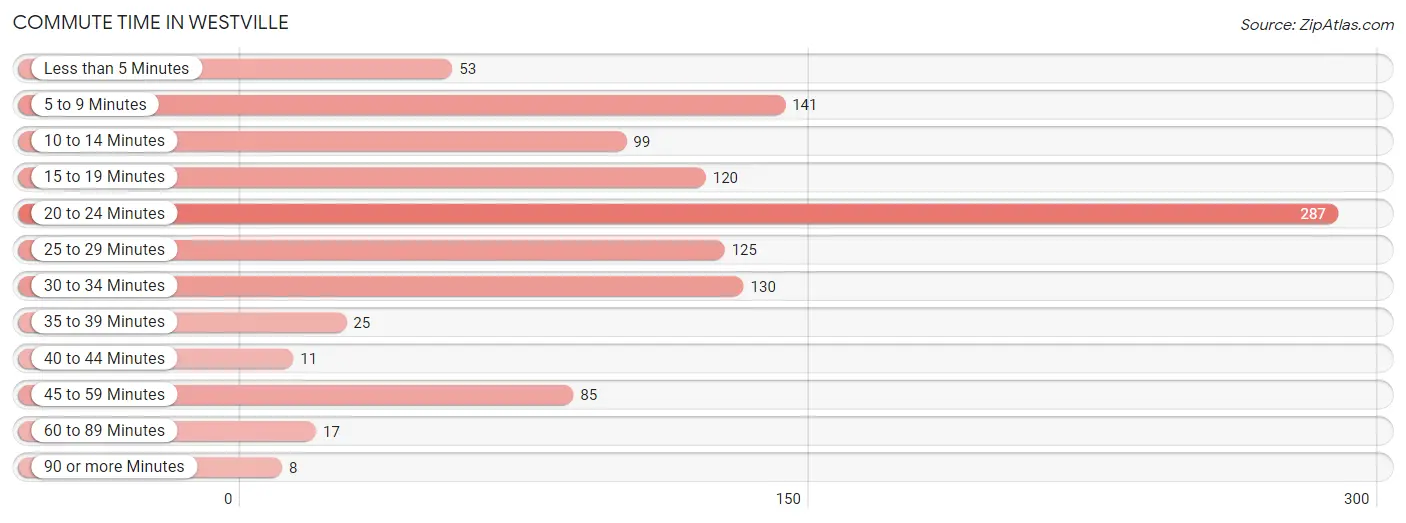
| Commute Time | # Commuters | % Commuters |
| Less than 5 Minutes | 53 | 4.8% |
| 5 to 9 Minutes | 141 | 12.8% |
| 10 to 14 Minutes | 99 | 9.0% |
| 15 to 19 Minutes | 120 | 10.9% |
| 20 to 24 Minutes | 287 | 26.1% |
| 25 to 29 Minutes | 125 | 11.4% |
| 30 to 34 Minutes | 130 | 11.8% |
| 35 to 39 Minutes | 25 | 2.3% |
| 40 to 44 Minutes | 11 | 1.0% |
| 45 to 59 Minutes | 85 | 7.7% |
| 60 to 89 Minutes | 17 | 1.5% |
| 90 or more Minutes | 8 | 0.7% |
Commute Time by Sex in Westville
The most common commute times in Westville are 5 to 9 minutes (122 commuters, 22.6%) for males and 20 to 24 minutes (165 commuters, 29.4%) for females.
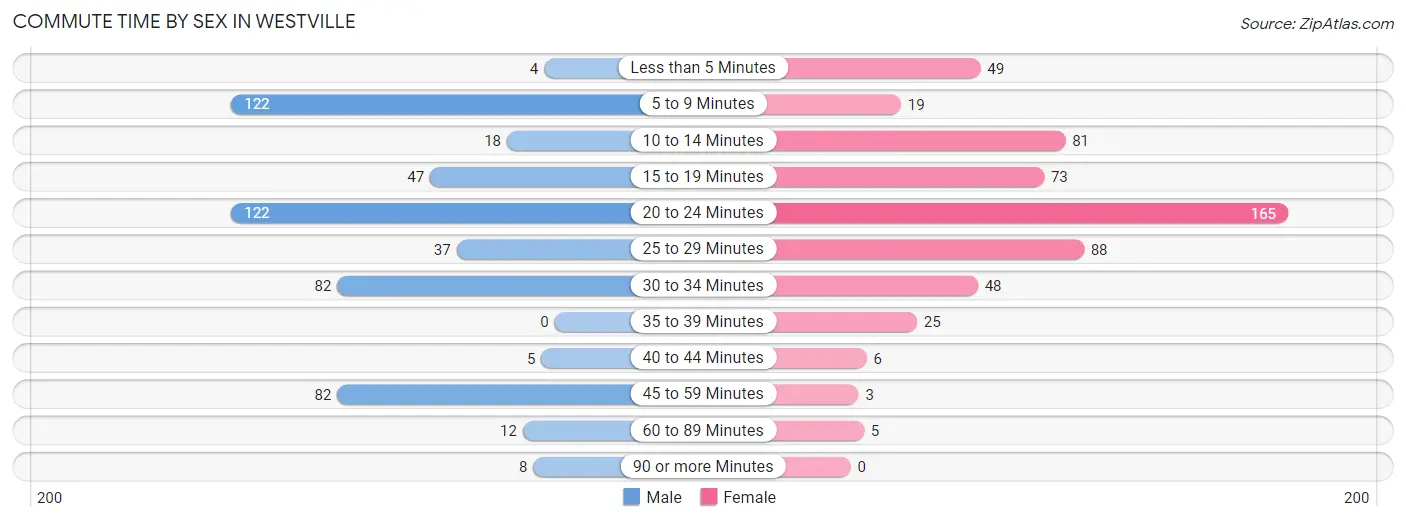
| Commute Time | Male | Female |
| Less than 5 Minutes | 4 (0.7%) | 49 (8.7%) |
| 5 to 9 Minutes | 122 (22.6%) | 19 (3.4%) |
| 10 to 14 Minutes | 18 (3.3%) | 81 (14.4%) |
| 15 to 19 Minutes | 47 (8.7%) | 73 (13.0%) |
| 20 to 24 Minutes | 122 (22.6%) | 165 (29.4%) |
| 25 to 29 Minutes | 37 (6.9%) | 88 (15.7%) |
| 30 to 34 Minutes | 82 (15.2%) | 48 (8.5%) |
| 35 to 39 Minutes | 0 (0.0%) | 25 (4.4%) |
| 40 to 44 Minutes | 5 (0.9%) | 6 (1.1%) |
| 45 to 59 Minutes | 82 (15.2%) | 3 (0.5%) |
| 60 to 89 Minutes | 12 (2.2%) | 5 (0.9%) |
| 90 or more Minutes | 8 (1.5%) | 0 (0.0%) |
Time of Departure to Work by Sex in Westville
The most frequent times of departure to work in Westville are 6:30 AM to 6:59 AM (108, 20.0%) for males and 7:00 AM to 7:29 AM (169, 30.1%) for females.
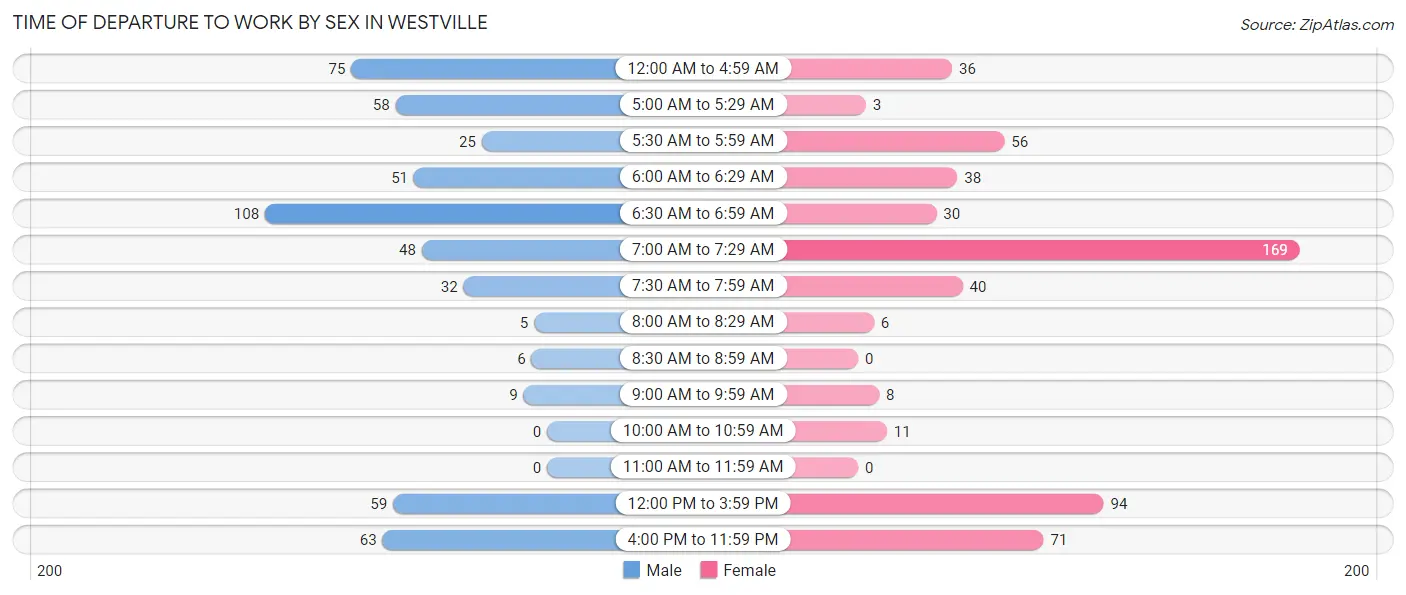
| Time of Departure | Male | Female |
| 12:00 AM to 4:59 AM | 75 (13.9%) | 36 (6.4%) |
| 5:00 AM to 5:29 AM | 58 (10.8%) | 3 (0.5%) |
| 5:30 AM to 5:59 AM | 25 (4.6%) | 56 (10.0%) |
| 6:00 AM to 6:29 AM | 51 (9.5%) | 38 (6.8%) |
| 6:30 AM to 6:59 AM | 108 (20.0%) | 30 (5.3%) |
| 7:00 AM to 7:29 AM | 48 (8.9%) | 169 (30.1%) |
| 7:30 AM to 7:59 AM | 32 (5.9%) | 40 (7.1%) |
| 8:00 AM to 8:29 AM | 5 (0.9%) | 6 (1.1%) |
| 8:30 AM to 8:59 AM | 6 (1.1%) | 0 (0.0%) |
| 9:00 AM to 9:59 AM | 9 (1.7%) | 8 (1.4%) |
| 10:00 AM to 10:59 AM | 0 (0.0%) | 11 (2.0%) |
| 11:00 AM to 11:59 AM | 0 (0.0%) | 0 (0.0%) |
| 12:00 PM to 3:59 PM | 59 (11.0%) | 94 (16.7%) |
| 4:00 PM to 11:59 PM | 63 (11.7%) | 71 (12.6%) |
| Total | 539 (100.0%) | 562 (100.0%) |
Housing Occupancy in Westville
Occupancy by Ownership in Westville
Of the total 970 dwellings in Westville, owner-occupied units account for 797 (82.2%), while renter-occupied units make up 173 (17.8%).
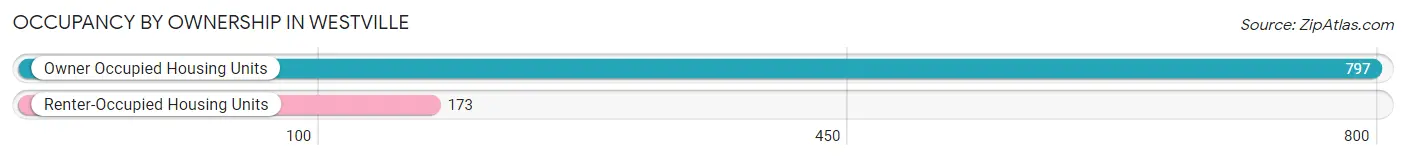
| Occupancy | # Housing Units | % Housing Units |
| Owner Occupied Housing Units | 797 | 82.2% |
| Renter-Occupied Housing Units | 173 | 17.8% |
| Total Occupied Housing Units | 970 | 100.0% |
Occupancy by Household Size in Westville
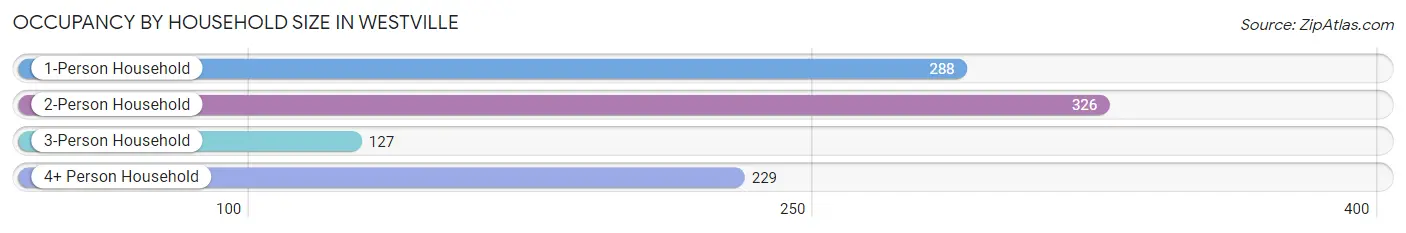
| Household Size | # Housing Units | % Housing Units |
| 1-Person Household | 288 | 29.7% |
| 2-Person Household | 326 | 33.6% |
| 3-Person Household | 127 | 13.1% |
| 4+ Person Household | 229 | 23.6% |
| Total Housing Units | 970 | 100.0% |
Occupancy by Ownership by Household Size in Westville
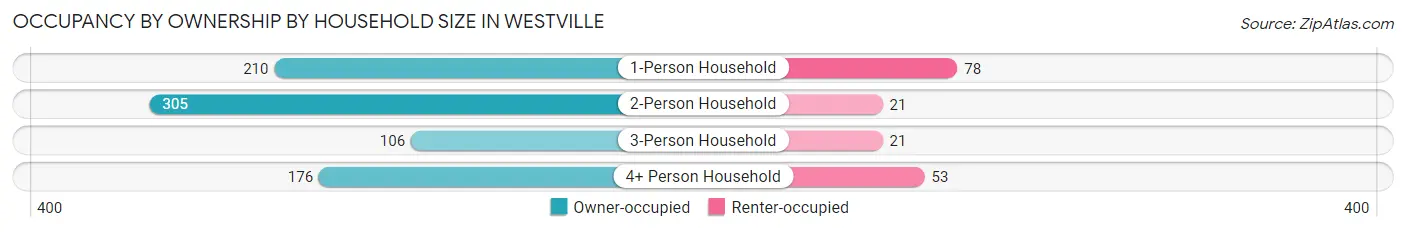
| Household Size | Owner-occupied | Renter-occupied |
| 1-Person Household | 210 (72.9%) | 78 (27.1%) |
| 2-Person Household | 305 (93.6%) | 21 (6.4%) |
| 3-Person Household | 106 (83.5%) | 21 (16.5%) |
| 4+ Person Household | 176 (76.9%) | 53 (23.1%) |
| Total Housing Units | 797 (82.2%) | 173 (17.8%) |
Occupancy by Educational Attainment in Westville
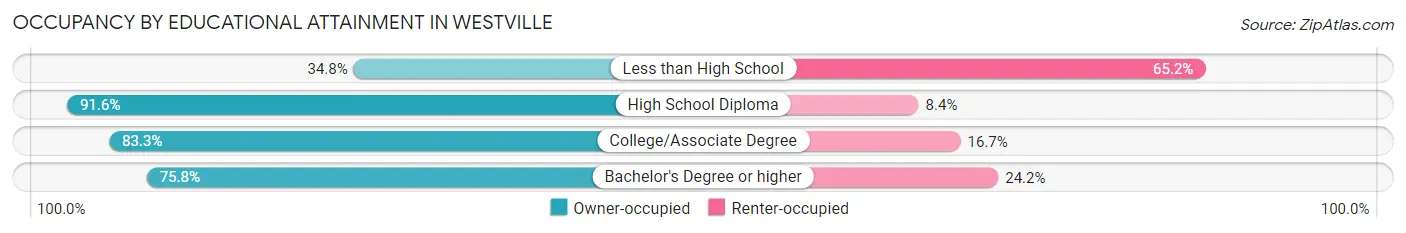
| Household Size | Owner-occupied | Renter-occupied |
| Less than High School | 16 (34.8%) | 30 (65.2%) |
| High School Diploma | 261 (91.6%) | 24 (8.4%) |
| College/Associate Degree | 398 (83.3%) | 80 (16.7%) |
| Bachelor's Degree or higher | 122 (75.8%) | 39 (24.2%) |
Occupancy by Age of Householder in Westville
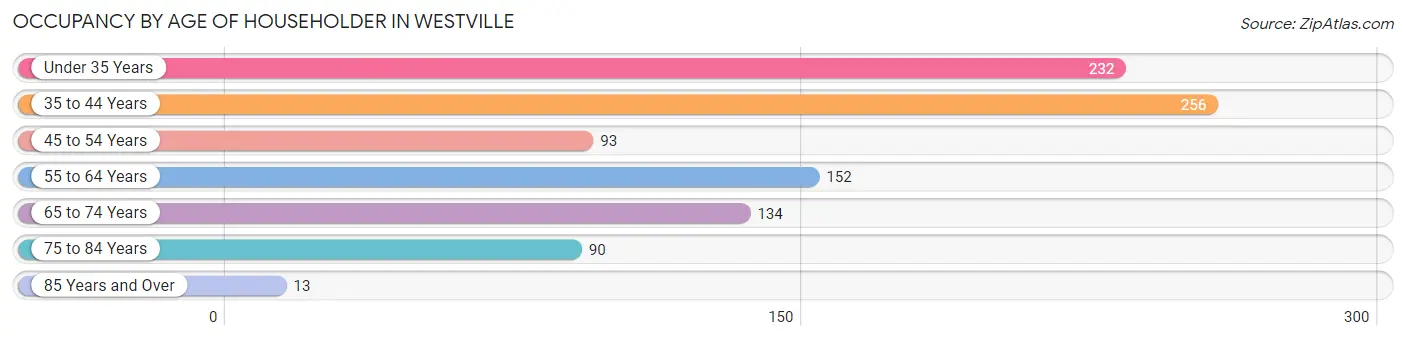
| Age Bracket | # Households | % Households |
| Under 35 Years | 232 | 23.9% |
| 35 to 44 Years | 256 | 26.4% |
| 45 to 54 Years | 93 | 9.6% |
| 55 to 64 Years | 152 | 15.7% |
| 65 to 74 Years | 134 | 13.8% |
| 75 to 84 Years | 90 | 9.3% |
| 85 Years and Over | 13 | 1.3% |
| Total | 970 | 100.0% |
Housing Finances in Westville
Median Income by Occupancy in Westville
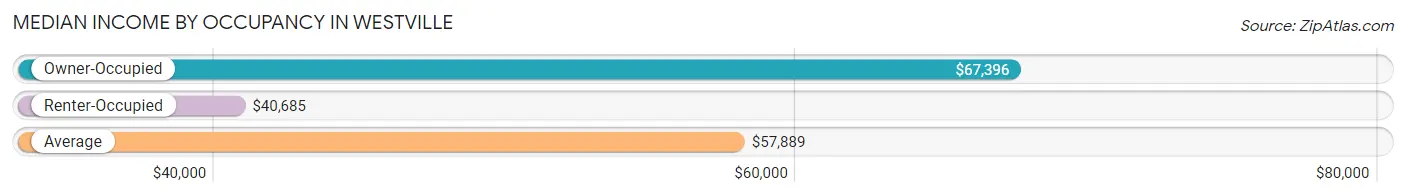
| Occupancy Type | # Households | Median Income |
| Owner-Occupied | 797 (82.2%) | $67,396 |
| Renter-Occupied | 173 (17.8%) | $40,685 |
| Average | 970 (100.0%) | $57,889 |
Occupancy by Householder Income Bracket in Westville
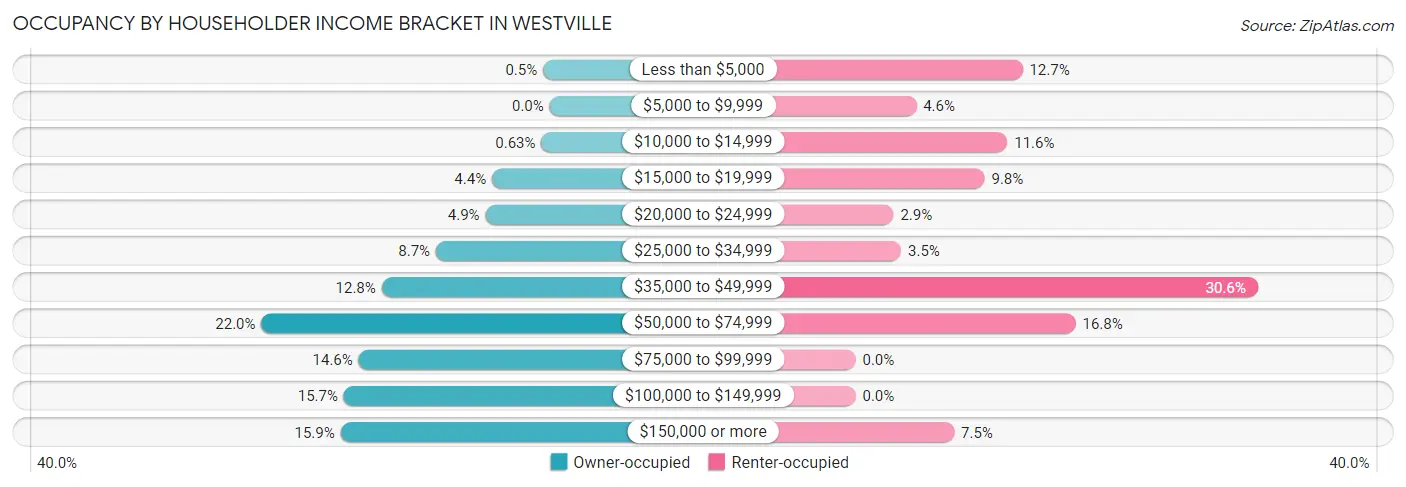
| Income Bracket | Owner-occupied | Renter-occupied |
| Less than $5,000 | 4 (0.5%) | 22 (12.7%) |
| $5,000 to $9,999 | 0 (0.0%) | 8 (4.6%) |
| $10,000 to $14,999 | 5 (0.6%) | 20 (11.6%) |
| $15,000 to $19,999 | 35 (4.4%) | 17 (9.8%) |
| $20,000 to $24,999 | 39 (4.9%) | 5 (2.9%) |
| $25,000 to $34,999 | 69 (8.7%) | 6 (3.5%) |
| $35,000 to $49,999 | 102 (12.8%) | 53 (30.6%) |
| $50,000 to $74,999 | 175 (22.0%) | 29 (16.8%) |
| $75,000 to $99,999 | 116 (14.5%) | 0 (0.0%) |
| $100,000 to $149,999 | 125 (15.7%) | 0 (0.0%) |
| $150,000 or more | 127 (15.9%) | 13 (7.5%) |
| Total | 797 (100.0%) | 173 (100.0%) |
Monthly Housing Cost Tiers in Westville
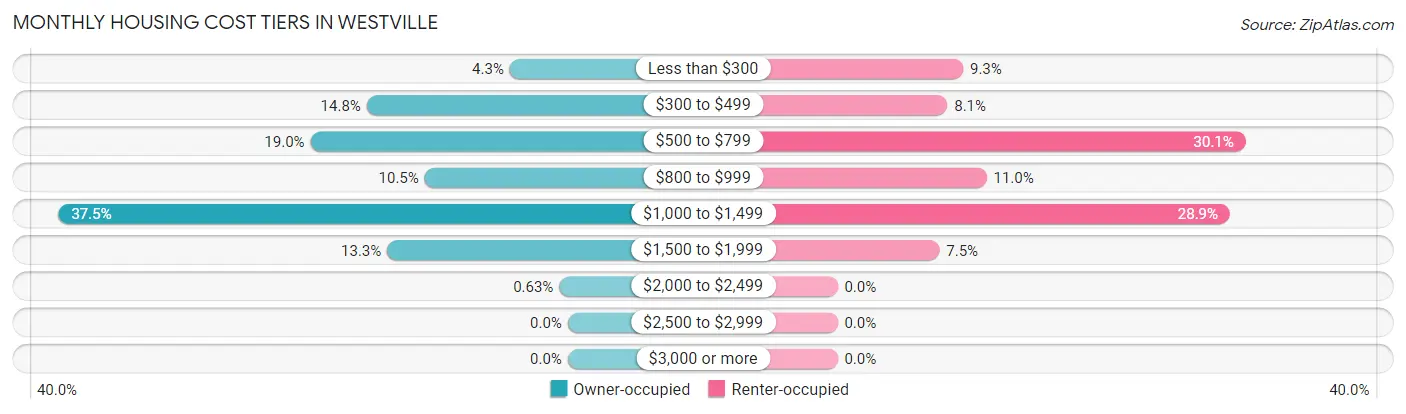
| Monthly Cost | Owner-occupied | Renter-occupied |
| Less than $300 | 34 (4.3%) | 16 (9.2%) |
| $300 to $499 | 118 (14.8%) | 14 (8.1%) |
| $500 to $799 | 151 (19.0%) | 52 (30.1%) |
| $800 to $999 | 84 (10.5%) | 19 (11.0%) |
| $1,000 to $1,499 | 299 (37.5%) | 50 (28.9%) |
| $1,500 to $1,999 | 106 (13.3%) | 13 (7.5%) |
| $2,000 to $2,499 | 5 (0.6%) | 0 (0.0%) |
| $2,500 to $2,999 | 0 (0.0%) | 0 (0.0%) |
| $3,000 or more | 0 (0.0%) | 0 (0.0%) |
| Total | 797 (100.0%) | 173 (100.0%) |
Physical Housing Characteristics in Westville
Housing Structures in Westville
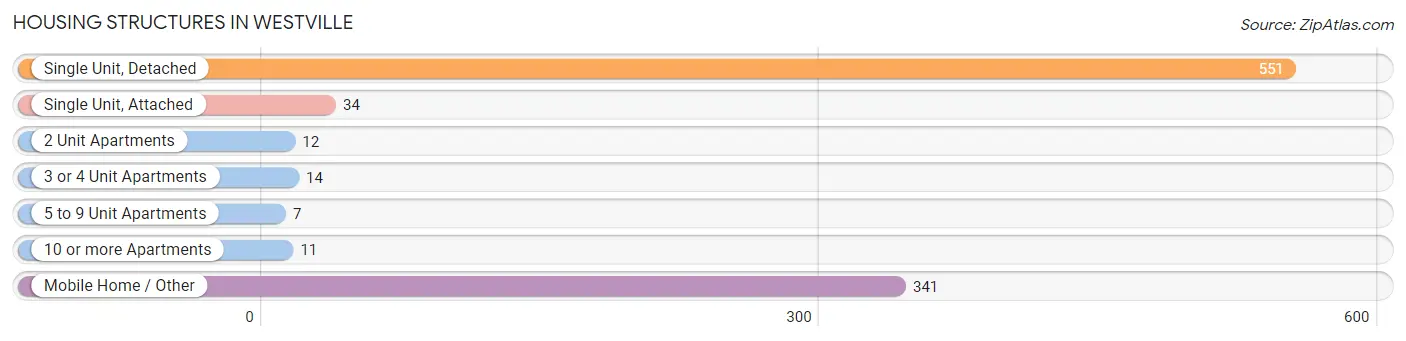
| Structure Type | # Housing Units | % Housing Units |
| Single Unit, Detached | 551 | 56.8% |
| Single Unit, Attached | 34 | 3.5% |
| 2 Unit Apartments | 12 | 1.2% |
| 3 or 4 Unit Apartments | 14 | 1.4% |
| 5 to 9 Unit Apartments | 7 | 0.7% |
| 10 or more Apartments | 11 | 1.1% |
| Mobile Home / Other | 341 | 35.1% |
| Total | 970 | 100.0% |
Housing Structures by Occupancy in Westville
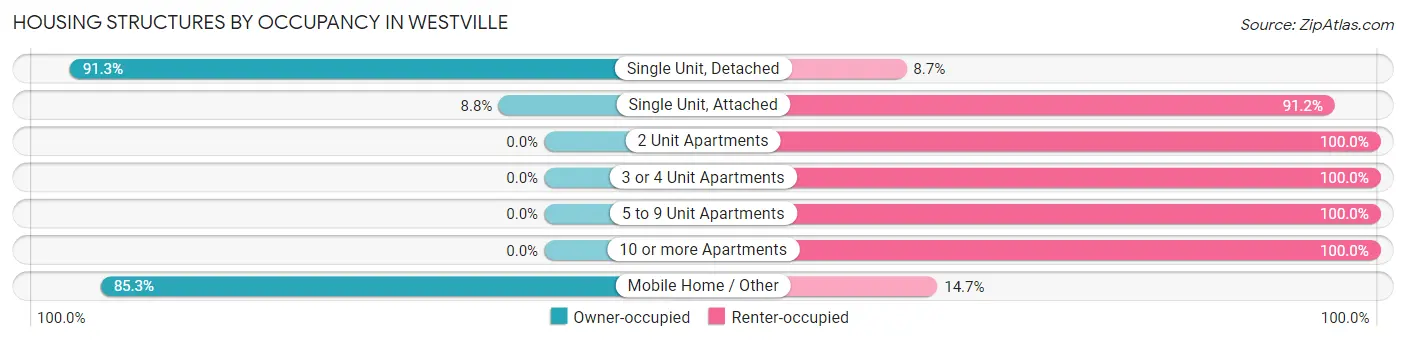
| Structure Type | Owner-occupied | Renter-occupied |
| Single Unit, Detached | 503 (91.3%) | 48 (8.7%) |
| Single Unit, Attached | 3 (8.8%) | 31 (91.2%) |
| 2 Unit Apartments | 0 (0.0%) | 12 (100.0%) |
| 3 or 4 Unit Apartments | 0 (0.0%) | 14 (100.0%) |
| 5 to 9 Unit Apartments | 0 (0.0%) | 7 (100.0%) |
| 10 or more Apartments | 0 (0.0%) | 11 (100.0%) |
| Mobile Home / Other | 291 (85.3%) | 50 (14.7%) |
| Total | 797 (82.2%) | 173 (17.8%) |
Housing Structures by Number of Rooms in Westville
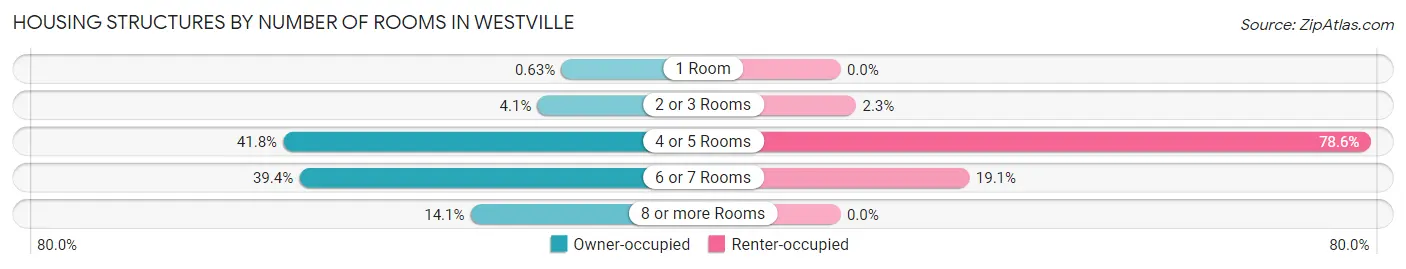
| Number of Rooms | Owner-occupied | Renter-occupied |
| 1 Room | 5 (0.6%) | 0 (0.0%) |
| 2 or 3 Rooms | 33 (4.1%) | 4 (2.3%) |
| 4 or 5 Rooms | 333 (41.8%) | 136 (78.6%) |
| 6 or 7 Rooms | 314 (39.4%) | 33 (19.1%) |
| 8 or more Rooms | 112 (14.1%) | 0 (0.0%) |
| Total | 797 (100.0%) | 173 (100.0%) |
Housing Structure by Heating Type in Westville
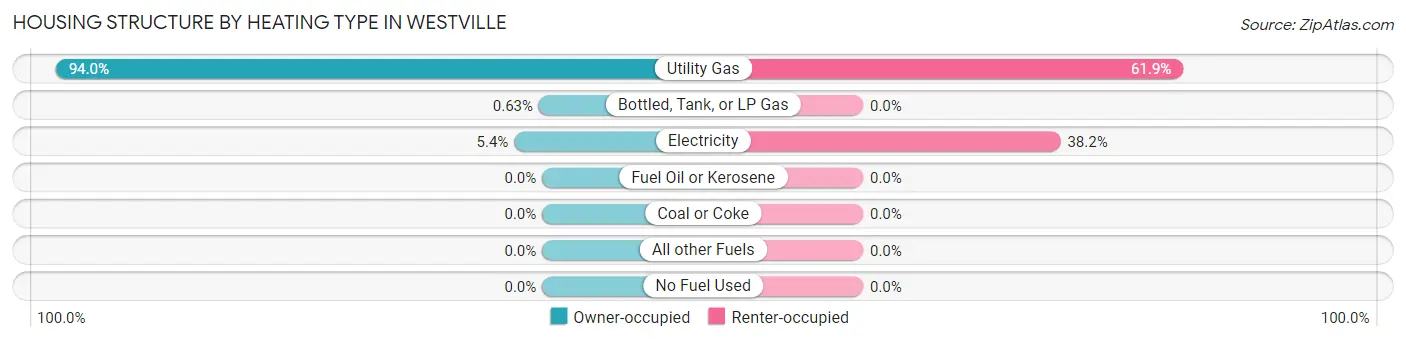
| Heating Type | Owner-occupied | Renter-occupied |
| Utility Gas | 749 (94.0%) | 107 (61.9%) |
| Bottled, Tank, or LP Gas | 5 (0.6%) | 0 (0.0%) |
| Electricity | 43 (5.4%) | 66 (38.2%) |
| Fuel Oil or Kerosene | 0 (0.0%) | 0 (0.0%) |
| Coal or Coke | 0 (0.0%) | 0 (0.0%) |
| All other Fuels | 0 (0.0%) | 0 (0.0%) |
| No Fuel Used | 0 (0.0%) | 0 (0.0%) |
| Total | 797 (100.0%) | 173 (100.0%) |
Household Vehicle Usage in Westville
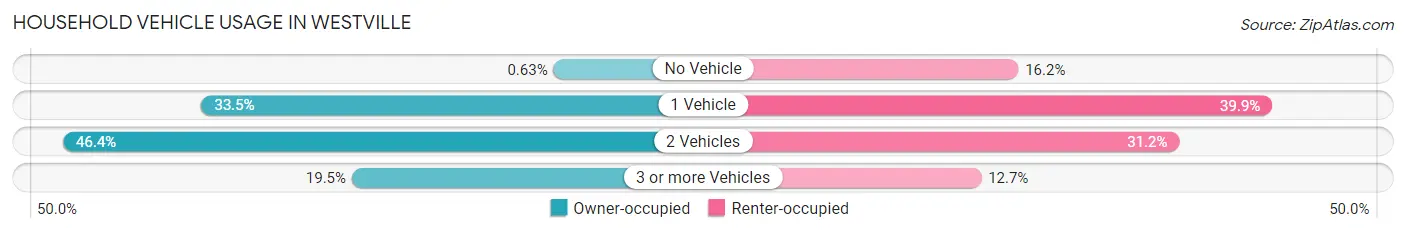
| Vehicles per Household | Owner-occupied | Renter-occupied |
| No Vehicle | 5 (0.6%) | 28 (16.2%) |
| 1 Vehicle | 267 (33.5%) | 69 (39.9%) |
| 2 Vehicles | 370 (46.4%) | 54 (31.2%) |
| 3 or more Vehicles | 155 (19.5%) | 22 (12.7%) |
| Total | 797 (100.0%) | 173 (100.0%) |
Real Estate & Mortgages in Westville
Real Estate and Mortgage Overview in Westville
| Characteristic | Without Mortgage | With Mortgage |
| Housing Units | 280 | 517 |
| Median Property Value | $46,300 | $180,400 |
| Median Household Income | $43,000 | $106 |
| Monthly Housing Costs | $470 | $0 |
| Real Estate Taxes | $476 | $24 |
Property Value by Mortgage Status in Westville
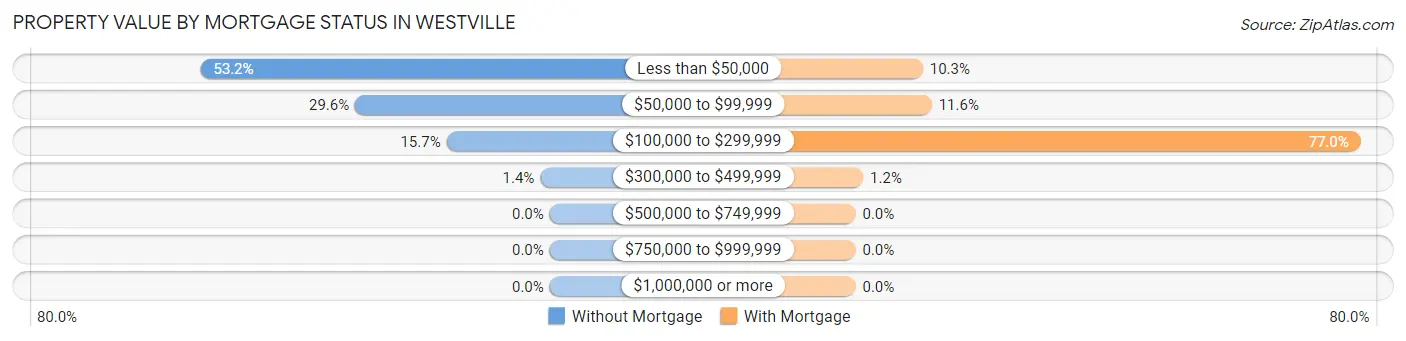
| Property Value | Without Mortgage | With Mortgage |
| Less than $50,000 | 149 (53.2%) | 53 (10.2%) |
| $50,000 to $99,999 | 83 (29.6%) | 60 (11.6%) |
| $100,000 to $299,999 | 44 (15.7%) | 398 (77.0%) |
| $300,000 to $499,999 | 4 (1.4%) | 6 (1.2%) |
| $500,000 to $749,999 | 0 (0.0%) | 0 (0.0%) |
| $750,000 to $999,999 | 0 (0.0%) | 0 (0.0%) |
| $1,000,000 or more | 0 (0.0%) | 0 (0.0%) |
| Total | 280 (100.0%) | 517 (100.0%) |
Household Income by Mortgage Status in Westville
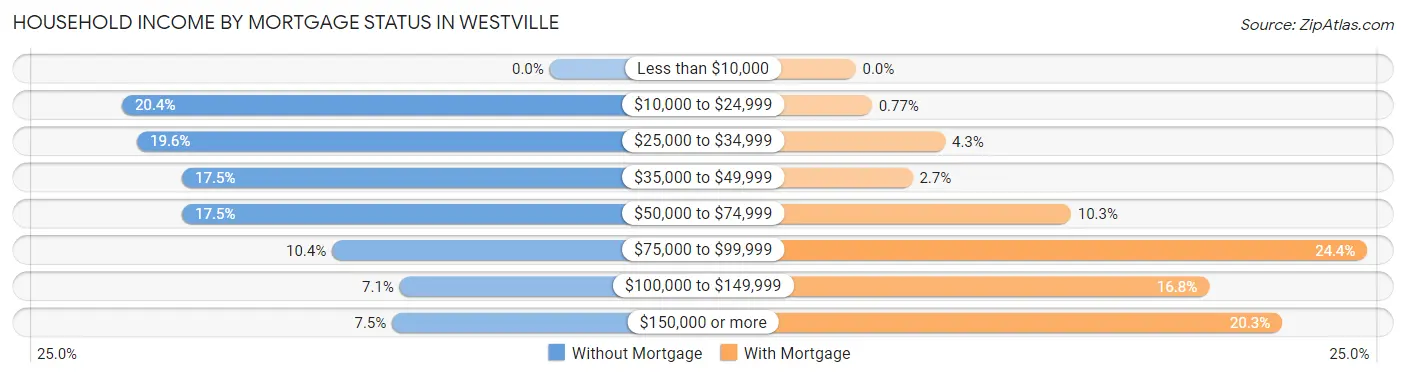
| Household Income | Without Mortgage | With Mortgage |
| Less than $10,000 | 0 (0.0%) | 0 (0.0%) |
| $10,000 to $24,999 | 57 (20.4%) | 4 (0.8%) |
| $25,000 to $34,999 | 55 (19.6%) | 22 (4.3%) |
| $35,000 to $49,999 | 49 (17.5%) | 14 (2.7%) |
| $50,000 to $74,999 | 49 (17.5%) | 53 (10.2%) |
| $75,000 to $99,999 | 29 (10.4%) | 126 (24.4%) |
| $100,000 to $149,999 | 20 (7.1%) | 87 (16.8%) |
| $150,000 or more | 21 (7.5%) | 105 (20.3%) |
| Total | 280 (100.0%) | 517 (100.0%) |
Property Value to Household Income Ratio in Westville
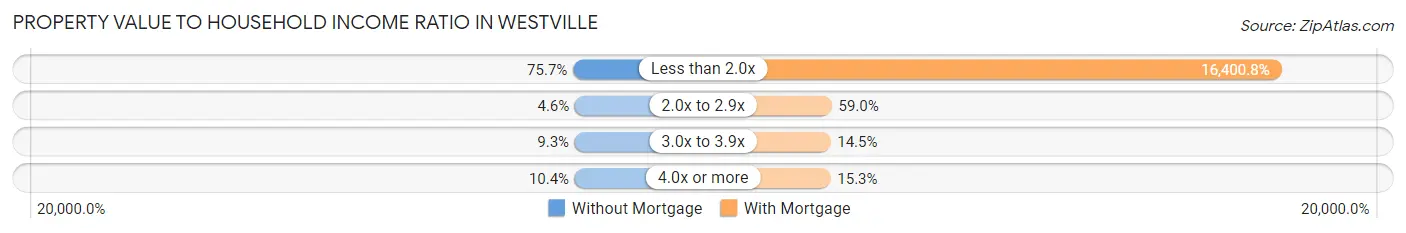
| Value-to-Income Ratio | Without Mortgage | With Mortgage |
| Less than 2.0x | 212 (75.7%) | 84,792 (16,400.8%) |
| 2.0x to 2.9x | 13 (4.6%) | 305 (59.0%) |
| 3.0x to 3.9x | 26 (9.3%) | 75 (14.5%) |
| 4.0x or more | 29 (10.4%) | 79 (15.3%) |
| Total | 280 (100.0%) | 517 (100.0%) |
Real Estate Taxes by Mortgage Status in Westville
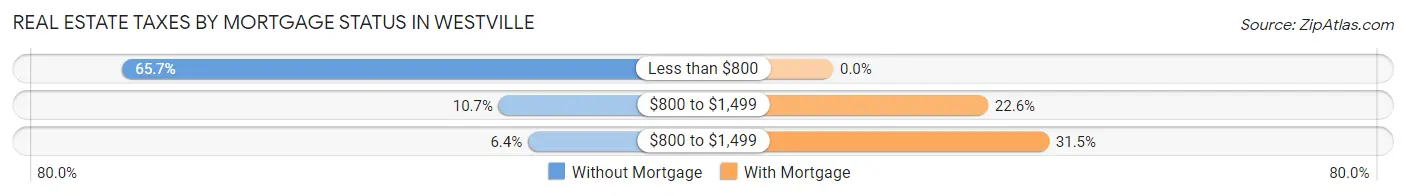
| Property Taxes | Without Mortgage | With Mortgage |
| Less than $800 | 184 (65.7%) | 0 (0.0%) |
| $800 to $1,499 | 30 (10.7%) | 117 (22.6%) |
| $800 to $1,499 | 18 (6.4%) | 163 (31.5%) |
| Total | 280 (100.0%) | 517 (100.0%) |
Health & Disability in Westville
Health Insurance Coverage by Age in Westville
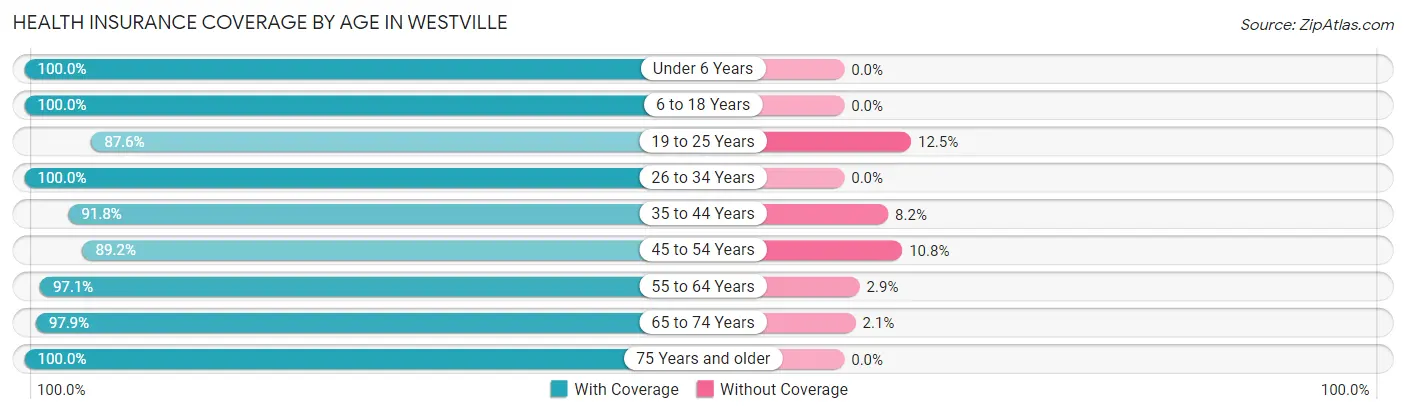
| Age Bracket | With Coverage | Without Coverage |
| Under 6 Years | 207 (100.0%) | 0 (0.0%) |
| 6 to 18 Years | 369 (100.0%) | 0 (0.0%) |
| 19 to 25 Years | 239 (87.5%) | 34 (12.4%) |
| 26 to 34 Years | 342 (100.0%) | 0 (0.0%) |
| 35 to 44 Years | 393 (91.8%) | 35 (8.2%) |
| 45 to 54 Years | 165 (89.2%) | 20 (10.8%) |
| 55 to 64 Years | 237 (97.1%) | 7 (2.9%) |
| 65 to 74 Years | 186 (97.9%) | 4 (2.1%) |
| 75 Years and older | 135 (100.0%) | 0 (0.0%) |
| Total | 2,273 (95.8%) | 100 (4.2%) |
Health Insurance Coverage by Citizenship Status in Westville
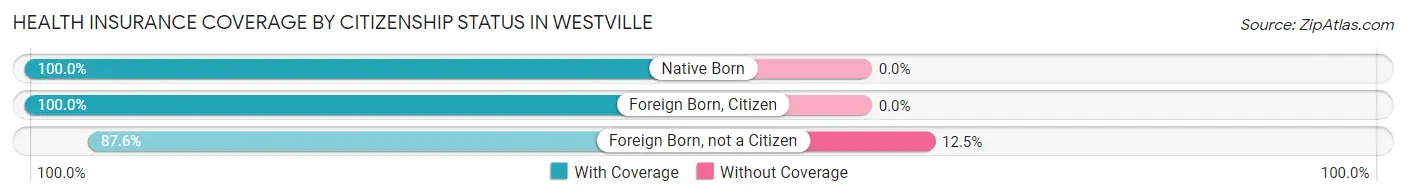
| Citizenship Status | With Coverage | Without Coverage |
| Native Born | 207 (100.0%) | 0 (0.0%) |
| Foreign Born, Citizen | 369 (100.0%) | 0 (0.0%) |
| Foreign Born, not a Citizen | 239 (87.5%) | 34 (12.4%) |
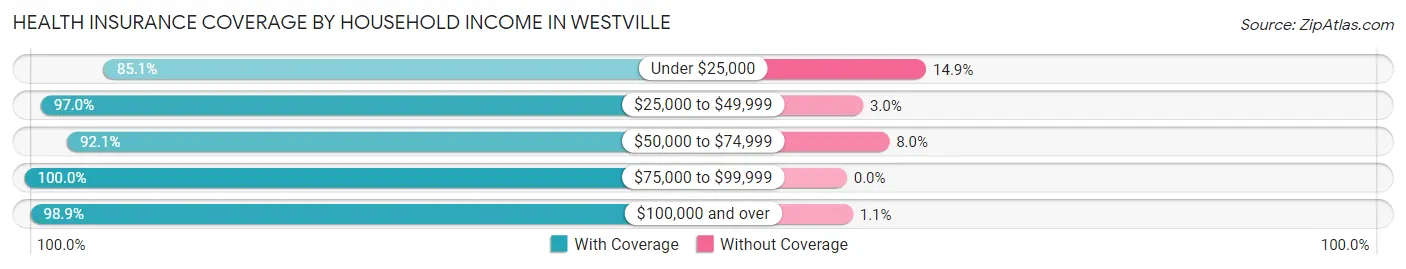
Health Insurance Coverage by Household Income in Westville
| Household Income | With Coverage | Without Coverage |
| Under $25,000 | 235 (85.1%) | 41 (14.9%) |
| $25,000 to $49,999 | 415 (97.0%) | 13 (3.0%) |
| $50,000 to $74,999 | 405 (92.0%) | 35 (8.0%) |
| $75,000 to $99,999 | 246 (100.0%) | 0 (0.0%) |
| $100,000 and over | 972 (98.9%) | 11 (1.1%) |
Public vs Private Health Insurance Coverage by Age in Westville
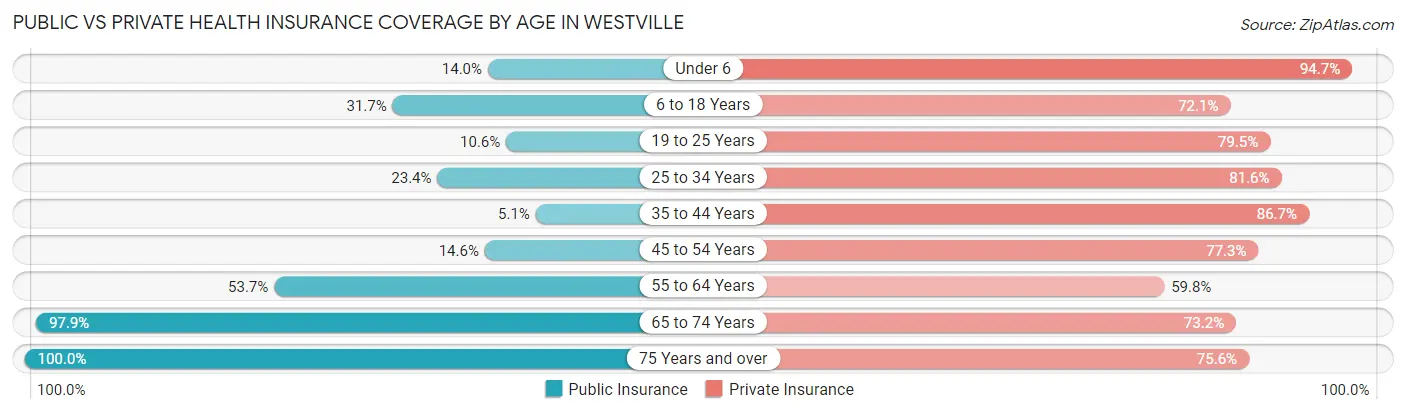
| Age Bracket | Public Insurance | Private Insurance |
| Under 6 | 29 (14.0%) | 196 (94.7%) |
| 6 to 18 Years | 117 (31.7%) | 266 (72.1%) |
| 19 to 25 Years | 29 (10.6%) | 217 (79.5%) |
| 25 to 34 Years | 80 (23.4%) | 279 (81.6%) |
| 35 to 44 Years | 22 (5.1%) | 371 (86.7%) |
| 45 to 54 Years | 27 (14.6%) | 143 (77.3%) |
| 55 to 64 Years | 131 (53.7%) | 146 (59.8%) |
| 65 to 74 Years | 186 (97.9%) | 139 (73.2%) |
| 75 Years and over | 135 (100.0%) | 102 (75.6%) |
| Total | 756 (31.9%) | 1,859 (78.3%) |
Disability Status by Sex by Age in Westville
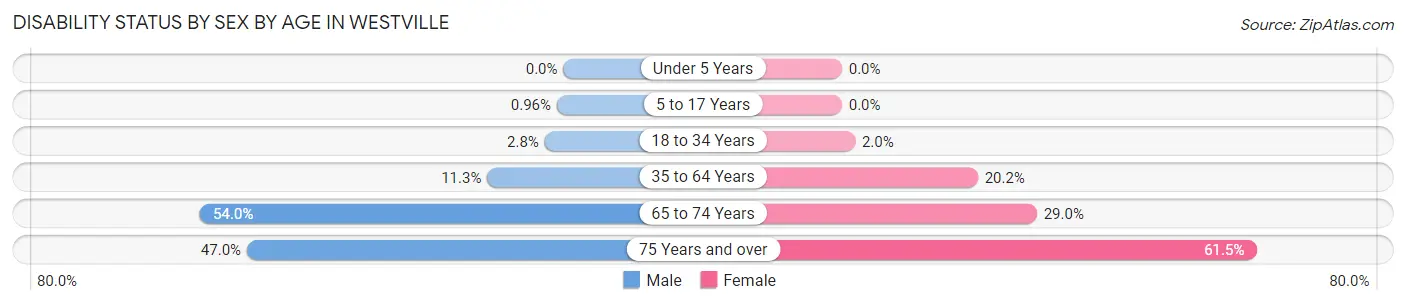
| Age Bracket | Male | Female |
| Under 5 Years | 0 (0.0%) | 0 (0.0%) |
| 5 to 17 Years | 2 (1.0%) | 0 (0.0%) |
| 18 to 34 Years | 9 (2.8%) | 6 (2.0%) |
| 35 to 64 Years | 47 (11.3%) | 89 (20.2%) |
| 65 to 74 Years | 41 (53.9%) | 33 (28.9%) |
| 75 Years and over | 39 (47.0%) | 32 (61.5%) |
Disability Class by Sex by Age in Westville
Disability Class: Hearing Difficulty
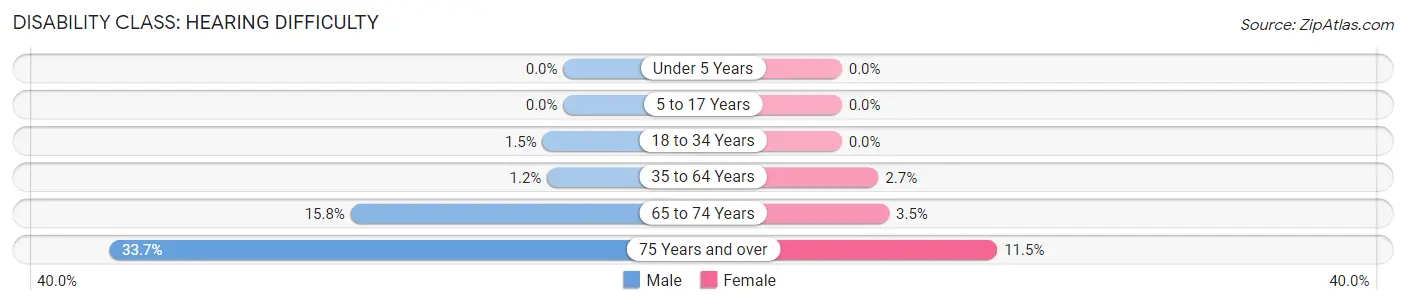
| Age Bracket | Male | Female |
| Under 5 Years | 0 (0.0%) | 0 (0.0%) |
| 5 to 17 Years | 0 (0.0%) | 0 (0.0%) |
| 18 to 34 Years | 5 (1.5%) | 0 (0.0%) |
| 35 to 64 Years | 5 (1.2%) | 12 (2.7%) |
| 65 to 74 Years | 12 (15.8%) | 4 (3.5%) |
| 75 Years and over | 28 (33.7%) | 6 (11.5%) |
Disability Class: Vision Difficulty
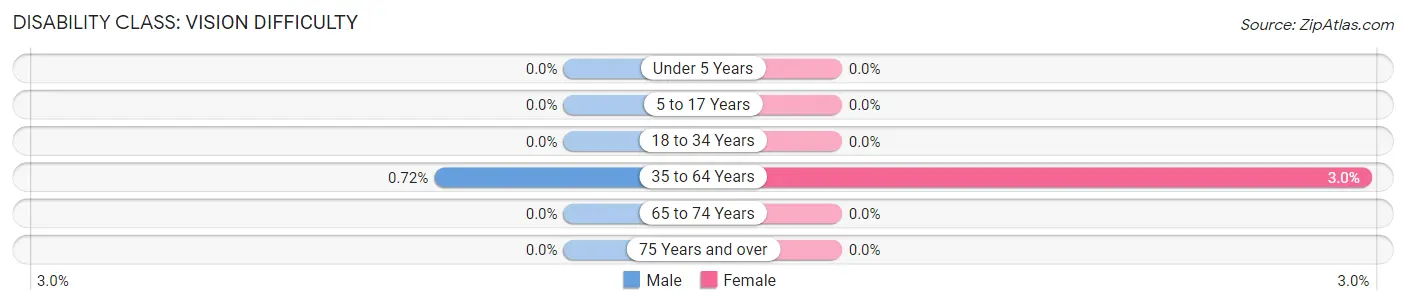
| Age Bracket | Male | Female |
| Under 5 Years | 0 (0.0%) | 0 (0.0%) |
| 5 to 17 Years | 0 (0.0%) | 0 (0.0%) |
| 18 to 34 Years | 0 (0.0%) | 0 (0.0%) |
| 35 to 64 Years | 3 (0.7%) | 13 (2.9%) |
| 65 to 74 Years | 0 (0.0%) | 0 (0.0%) |
| 75 Years and over | 0 (0.0%) | 0 (0.0%) |
Disability Class: Cognitive Difficulty
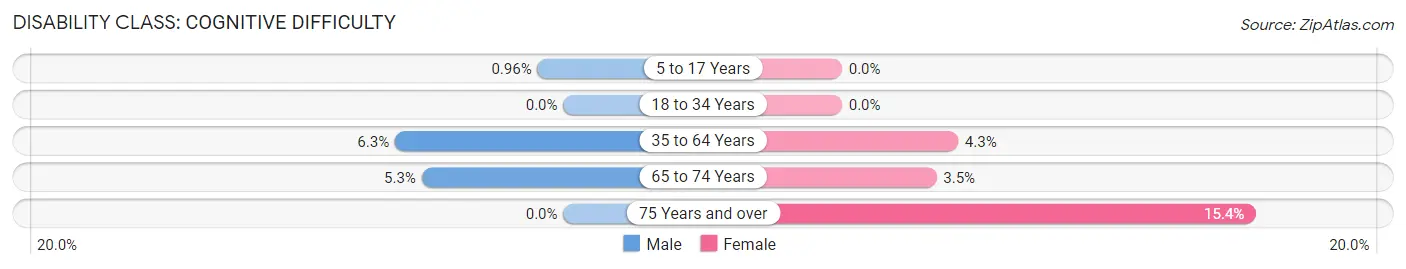
| Age Bracket | Male | Female |
| 5 to 17 Years | 2 (1.0%) | 0 (0.0%) |
| 18 to 34 Years | 0 (0.0%) | 0 (0.0%) |
| 35 to 64 Years | 26 (6.2%) | 19 (4.3%) |
| 65 to 74 Years | 4 (5.3%) | 4 (3.5%) |
| 75 Years and over | 0 (0.0%) | 8 (15.4%) |
Disability Class: Ambulatory Difficulty
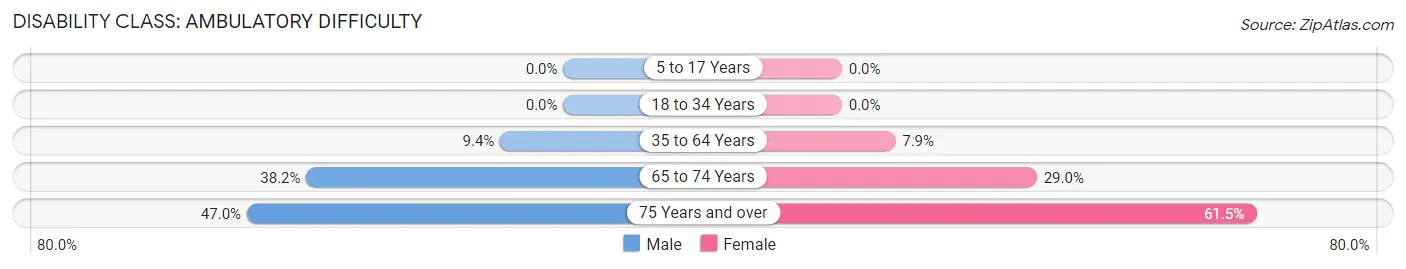
| Age Bracket | Male | Female |
| 5 to 17 Years | 0 (0.0%) | 0 (0.0%) |
| 18 to 34 Years | 0 (0.0%) | 0 (0.0%) |
| 35 to 64 Years | 39 (9.4%) | 35 (7.9%) |
| 65 to 74 Years | 29 (38.2%) | 33 (28.9%) |
| 75 Years and over | 39 (47.0%) | 32 (61.5%) |
Disability Class: Self-Care Difficulty
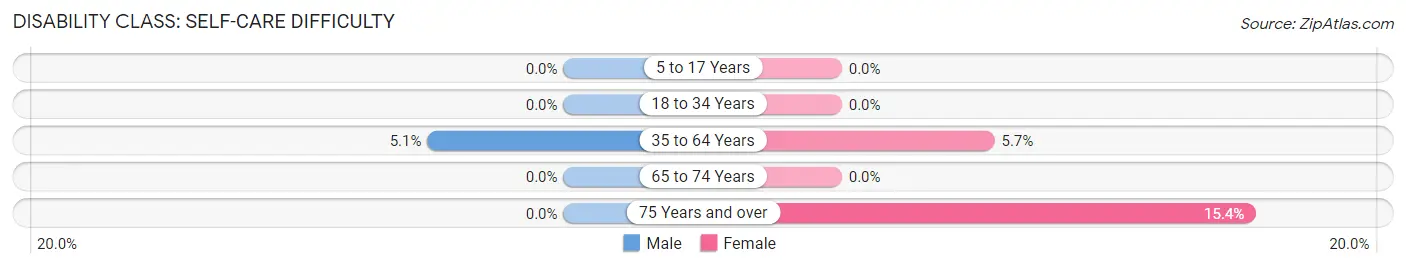
| Age Bracket | Male | Female |
| 5 to 17 Years | 0 (0.0%) | 0 (0.0%) |
| 18 to 34 Years | 0 (0.0%) | 0 (0.0%) |
| 35 to 64 Years | 21 (5.1%) | 25 (5.7%) |
| 65 to 74 Years | 0 (0.0%) | 0 (0.0%) |
| 75 Years and over | 0 (0.0%) | 8 (15.4%) |
Technology Access in Westville
Computing Device Access in Westville
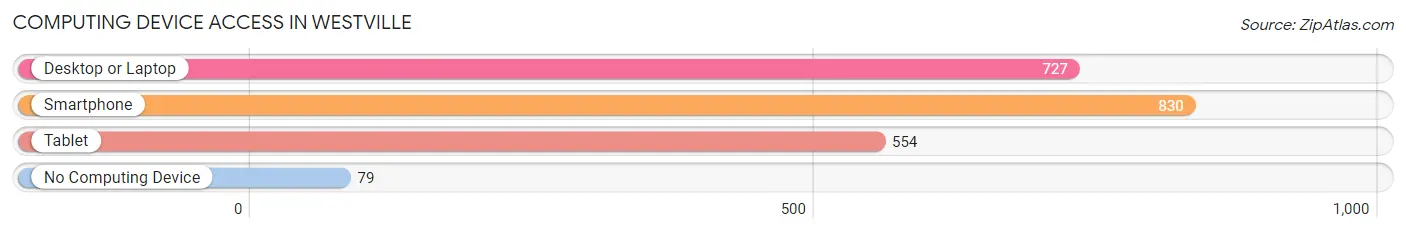
| Device Type | # Households | % Households |
| Desktop or Laptop | 727 | 75.0% |
| Smartphone | 830 | 85.6% |
| Tablet | 554 | 57.1% |
| No Computing Device | 79 | 8.1% |
| Total | 970 | 100.0% |
Internet Access in Westville
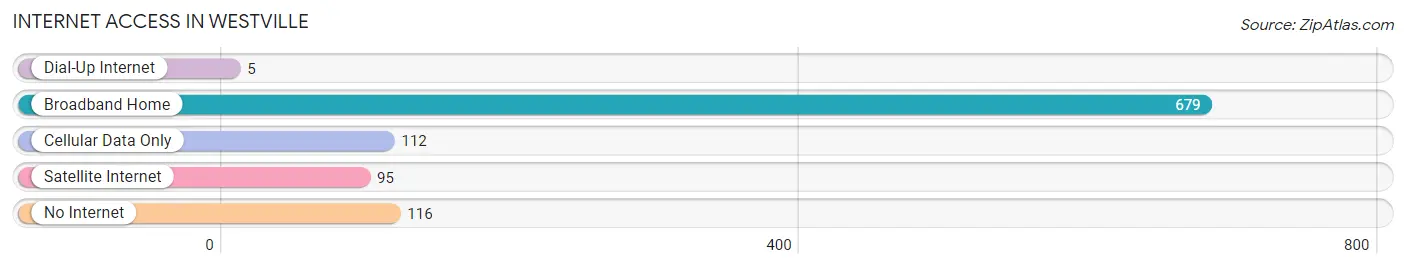
| Internet Type | # Households | % Households |
| Dial-Up Internet | 5 | 0.5% |
| Broadband Home | 679 | 70.0% |
| Cellular Data Only | 112 | 11.6% |
| Satellite Internet | 95 | 9.8% |
| No Internet | 116 | 12.0% |
| Total | 970 | 100.0% |
Westville Summary
History
The town of Westville, Indiana is located in LaPorte County, approximately 50 miles east of Chicago. The town was founded in 1836 by a group of settlers from New England. The settlers were attracted to the area due to its rich soil and abundant natural resources. The town was originally named West Point, but was later changed to Westville in 1837.
The town quickly grew and prospered due to its location on the Michigan Road, which connected the Great Lakes to the Ohio River. The town was also a major stop on the Underground Railroad, providing a safe haven for escaped slaves.
In the late 19th century, Westville became a major industrial center. The town was home to several factories, including a paper mill, a brickyard, and a foundry. The town also had a thriving agricultural industry, with many farmers growing corn, wheat, and other crops.
The town continued to grow and prosper throughout the 20th century. In the 1950s, the town was home to several large manufacturing companies, including a steel mill and a chemical plant. The town also had a thriving retail sector, with several stores and restaurants.
Geography
Westville is located in LaPorte County, Indiana, approximately 50 miles east of Chicago. The town is situated on the banks of the Kankakee River, which flows through the town. The town is surrounded by rolling hills and farmland, with several small lakes and ponds in the area.
The town has a total area of 4.2 square miles, with a population of approximately 5,000 people. The town is located in the Central Time Zone and has a humid continental climate, with hot summers and cold winters.
Economy
Westville’s economy is largely based on manufacturing and agriculture. The town is home to several large manufacturing companies, including a steel mill and a chemical plant. The town also has a thriving agricultural industry, with many farmers growing corn, wheat, and other crops.
The town also has a thriving retail sector, with several stores and restaurants. The town is also home to several small businesses, including a hardware store, a grocery store, and a pharmacy.
Demographics
As of the 2010 census, the population of Westville was 5,000 people. The town has a median household income of $45,000 and a median family income of $50,000. The town is predominantly white, with approximately 90% of the population identifying as Caucasian. The town also has a small Hispanic population, with approximately 5% of the population identifying as Hispanic or Latino. The town also has a small African American population, with approximately 2% of the population identifying as African American.
Common Questions
What is the Total Population of Westville?
Total Population of Westville is 5,885.
What is the Total Male Population of Westville?
Total Male Population of Westville is 4,668.
What is the Total Female Population of Westville?
Total Female Population of Westville is 1,217.
What is the Ratio of Males per 100 Females in Westville?
There are 383.57 Males per 100 Females in Westville.
What is the Ratio of Females per 100 Males in Westville?
There are 26.07 Females per 100 Males in Westville.
What is the Median Population Age in Westville?
Median Population Age in Westville is 37.6 Years.
What is the Average Family Size in Westville
Average Family Size in Westville is 3.1 People.
What is the Average Household Size in Westville
Average Household Size in Westville is 2.5 People.
What is Per Capita Income in Westville?
Per Capita income in Westville is $14,357.
What is the Median Family Income in Westville?
Median Family Income in Westville is $73,750.
What is the Median Household income in Westville?
Median Household Income in Westville is $57,889.
What is Income or Wage Gap in Westville?
Income or Wage Gap in Westville is 23.2%.
Women in Westville earn 76.8 cents for every dollar earned by a man.
What is Inequality or Gini Index in Westville?
Inequality or Gini Index in Westville is 0.39.
How Large is the Labor Force in Westville?
There are 1,299 People in the Labor Forcein in Westville.
What is the Percentage of People in the Labor Force in Westville?
24.3% of People are in the Labor Force in Westville.
What is the Unemployment Rate in Westville?
Unemployment Rate in Westville is 8.9%.