Peru, IN
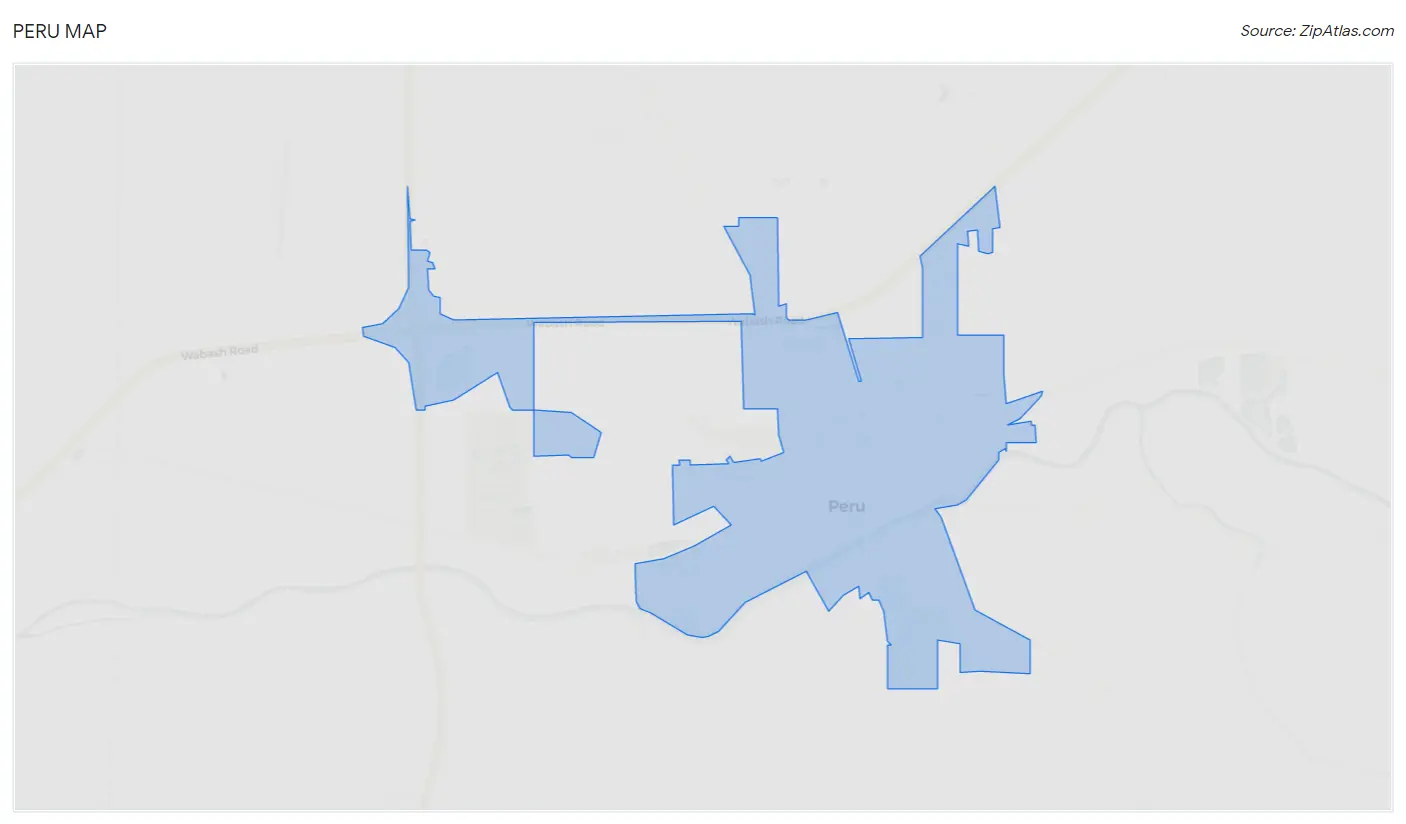
Peru Map
Peru Overview
10,862
TOTAL POPULATION
5,467
MALE POPULATION
5,395
FEMALE POPULATION
101.33
MALES / 100 FEMALES
98.68
FEMALES / 100 MALES
41.3
MEDIAN AGE
3.1
AVG FAMILY SIZE
2.4
AVG HOUSEHOLD SIZE
$23,913
PER CAPITA INCOME
$54,479
AVG FAMILY INCOME
$44,665
AVG HOUSEHOLD INCOME
2.4%
WAGE / INCOME GAP [ % ]
97.6¢/ $1
WAGE / INCOME GAP [ $ ]
$13,512
FAMILY INCOME DEFICIT
0.41
INEQUALITY / GINI INDEX
5,037
LABOR FORCE [ PEOPLE ]
57.6%
PERCENT IN LABOR FORCE
6.4%
UNEMPLOYMENT RATE
Peru Zip Codes
Peru Area Codes
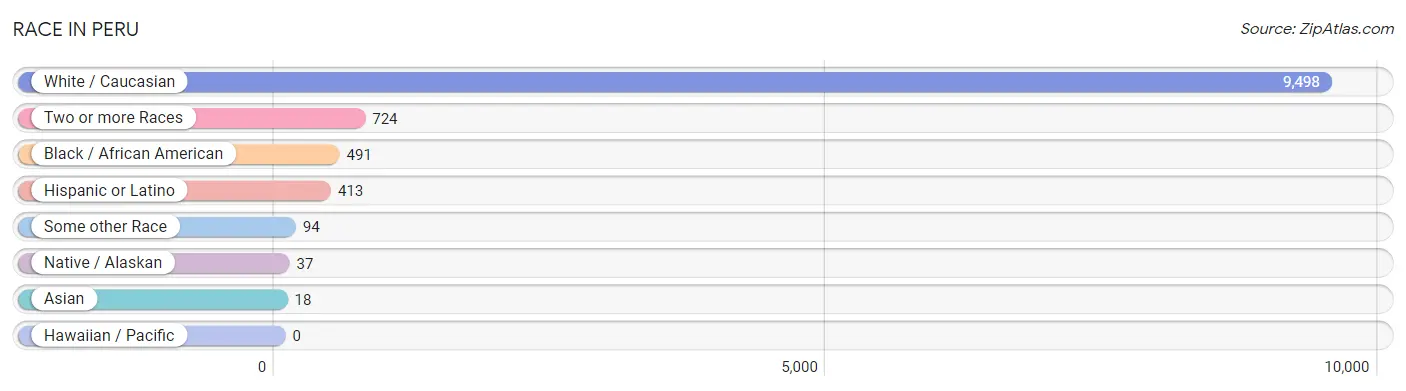
Race in Peru
The most populous races in Peru are White / Caucasian (9,498 | 87.4%), Two or more Races (724 | 6.7%), and Black / African American (491 | 4.5%).
| Race | # Population | % Population |
| Asian | 18 | 0.2% |
| Black / African American | 491 | 4.5% |
| Hawaiian / Pacific | 0 | 0.0% |
| Hispanic or Latino | 413 | 3.8% |
| Native / Alaskan | 37 | 0.3% |
| White / Caucasian | 9,498 | 87.4% |
| Two or more Races | 724 | 6.7% |
| Some other Race | 94 | 0.9% |
| Total | 10,862 | 100.0% |
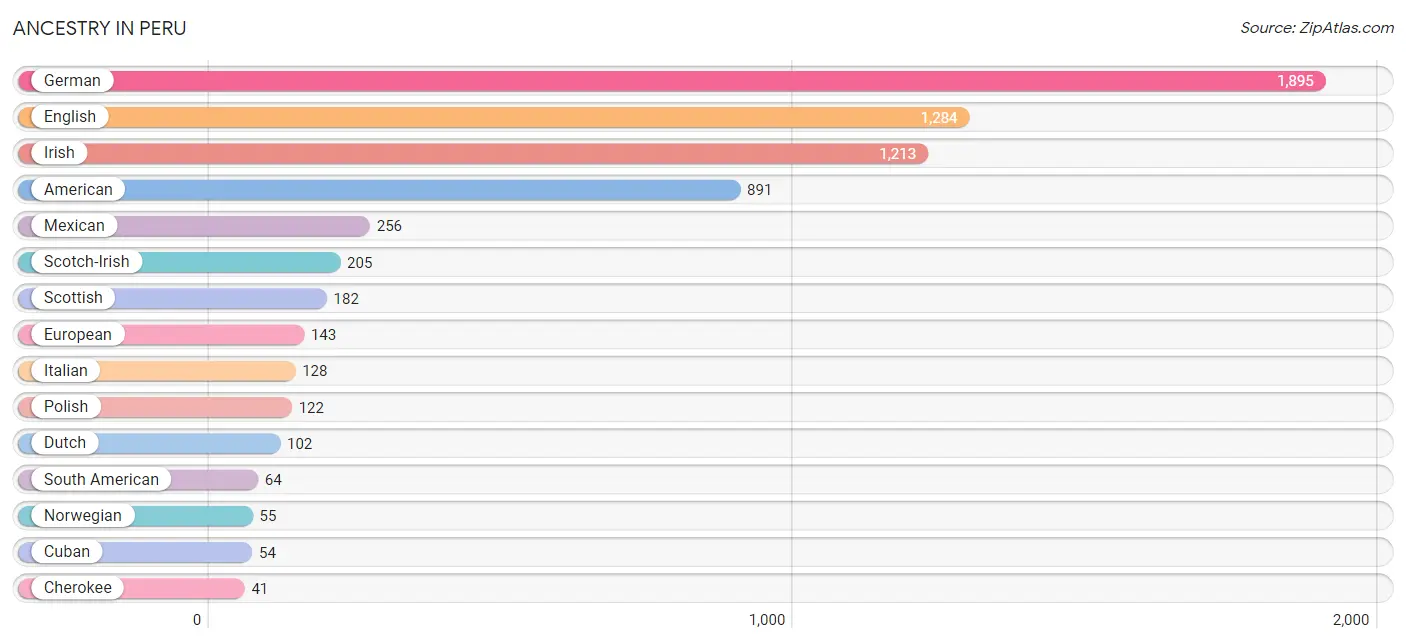
Ancestry in Peru
The most populous ancestries reported in Peru are German (1,895 | 17.4%), English (1,284 | 11.8%), Irish (1,213 | 11.2%), American (891 | 8.2%), and Mexican (256 | 2.4%), together accounting for 51.0% of all Peru residents.
| Ancestry | # Population | % Population |
| American | 891 | 8.2% |
| Austrian | 6 | 0.1% |
| British | 1 | 0.0% |
| Burmese | 19 | 0.2% |
| Cherokee | 41 | 0.4% |
| Cuban | 54 | 0.5% |
| Czech | 5 | 0.1% |
| Dutch | 102 | 0.9% |
| English | 1,284 | 11.8% |
| European | 143 | 1.3% |
| French | 31 | 0.3% |
| German | 1,895 | 17.4% |
| Hungarian | 26 | 0.2% |
| Irish | 1,213 | 11.2% |
| Italian | 128 | 1.2% |
| Jamaican | 4 | 0.0% |
| Korean | 6 | 0.1% |
| Lithuanian | 23 | 0.2% |
| Macedonian | 13 | 0.1% |
| Mexican | 256 | 2.4% |
| Navajo | 8 | 0.1% |
| Northern European | 21 | 0.2% |
| Norwegian | 55 | 0.5% |
| Pennsylvania German | 6 | 0.1% |
| Polish | 122 | 1.1% |
| Puerto Rican | 39 | 0.4% |
| Scandinavian | 34 | 0.3% |
| Scotch-Irish | 205 | 1.9% |
| Scottish | 182 | 1.7% |
| Slovene | 5 | 0.1% |
| South American | 64 | 0.6% |
| Sri Lankan | 18 | 0.2% |
| Swedish | 35 | 0.3% |
| Swiss | 24 | 0.2% |
| Welsh | 20 | 0.2% |
| West Indian | 4 | 0.0% | View All 36 Rows |
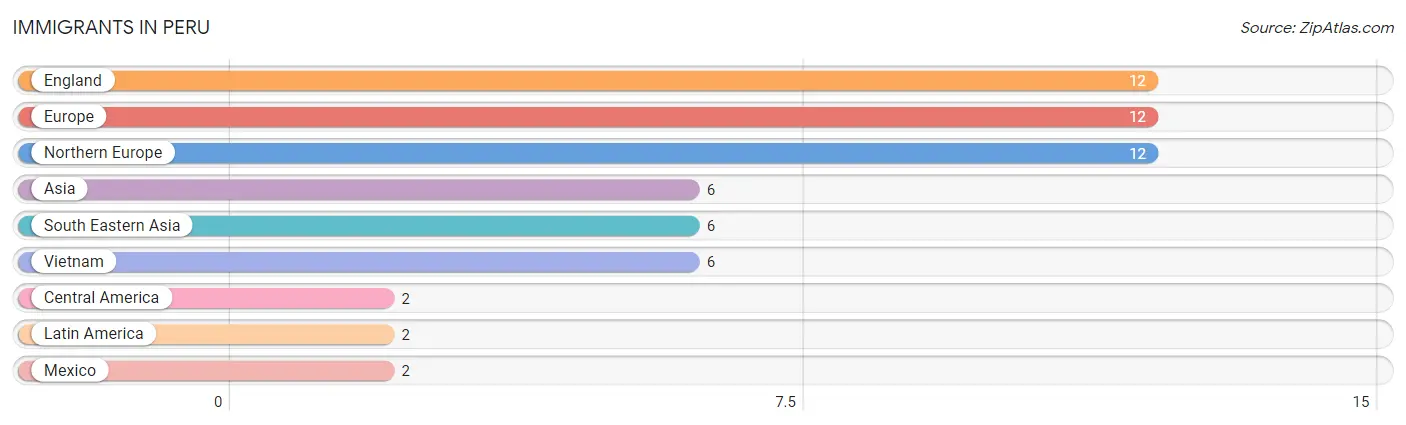
Immigrants in Peru
The most numerous immigrant groups reported in Peru came from England (12 | 0.1%), Europe (12 | 0.1%), Northern Europe (12 | 0.1%), Asia (6 | 0.1%), and South Eastern Asia (6 | 0.1%), together accounting for 0.4% of all Peru residents.
| Immigration Origin | # Population | % Population |
| Asia | 6 | 0.1% |
| Central America | 2 | 0.0% |
| England | 12 | 0.1% |
| Europe | 12 | 0.1% |
| Latin America | 2 | 0.0% |
| Mexico | 2 | 0.0% |
| Northern Europe | 12 | 0.1% |
| South Eastern Asia | 6 | 0.1% |
| Vietnam | 6 | 0.1% | View All 9 Rows |
Sex and Age in Peru
Sex and Age in Peru
The most populous age groups in Peru are 15 to 19 Years (611 | 11.2%) for men and 65 to 69 Years (454 | 8.4%) for women.
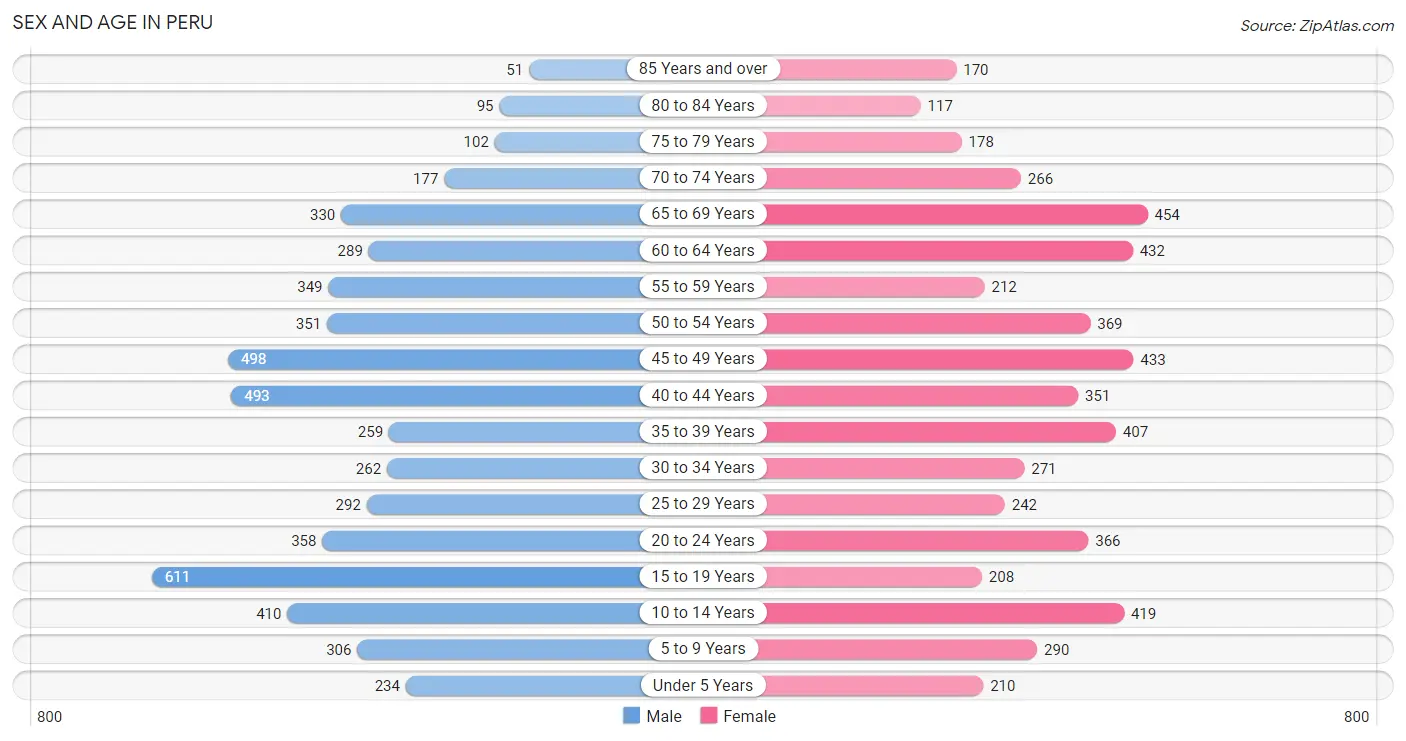
| Age Bracket | Male | Female |
| Under 5 Years | 234 (4.3%) | 210 (3.9%) |
| 5 to 9 Years | 306 (5.6%) | 290 (5.4%) |
| 10 to 14 Years | 410 (7.5%) | 419 (7.8%) |
| 15 to 19 Years | 611 (11.2%) | 208 (3.9%) |
| 20 to 24 Years | 358 (6.6%) | 366 (6.8%) |
| 25 to 29 Years | 292 (5.3%) | 242 (4.5%) |
| 30 to 34 Years | 262 (4.8%) | 271 (5.0%) |
| 35 to 39 Years | 259 (4.7%) | 407 (7.5%) |
| 40 to 44 Years | 493 (9.0%) | 351 (6.5%) |
| 45 to 49 Years | 498 (9.1%) | 433 (8.0%) |
| 50 to 54 Years | 351 (6.4%) | 369 (6.8%) |
| 55 to 59 Years | 349 (6.4%) | 212 (3.9%) |
| 60 to 64 Years | 289 (5.3%) | 432 (8.0%) |
| 65 to 69 Years | 330 (6.0%) | 454 (8.4%) |
| 70 to 74 Years | 177 (3.2%) | 266 (4.9%) |
| 75 to 79 Years | 102 (1.9%) | 178 (3.3%) |
| 80 to 84 Years | 95 (1.7%) | 117 (2.2%) |
| 85 Years and over | 51 (0.9%) | 170 (3.2%) |
| Total | 5,467 (100.0%) | 5,395 (100.0%) |
Families and Households in Peru
Median Family Size in Peru
The median family size in Peru is 3.06 persons per family, with single female/mother families (754 | 28.1%) accounting for the largest median family size of 3.45 persons per family. On the other hand, single male/father families (194 | 7.2%) represent the smallest median family size with 2.40 persons per family.
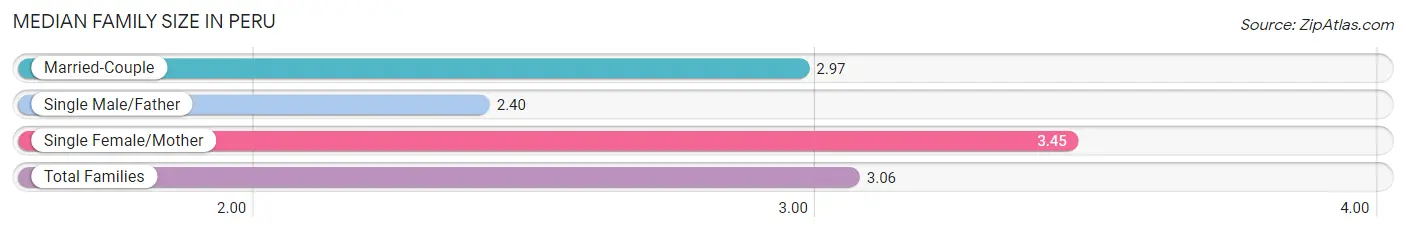
| Family Type | # Families | Family Size |
| Married-Couple | 1,740 (64.7%) | 2.97 |
| Single Male/Father | 194 (7.2%) | 2.40 |
| Single Female/Mother | 754 (28.1%) | 3.45 |
| Total Families | 2,688 (100.0%) | 3.06 |
Median Household Size in Peru
The median household size in Peru is 2.43 persons per household, with single female/mother households (754 | 17.1%) accounting for the largest median household size of 4.13 persons per household. non-family households (1,723 | 39.1%) represent the smallest median household size with 1.15 persons per household.
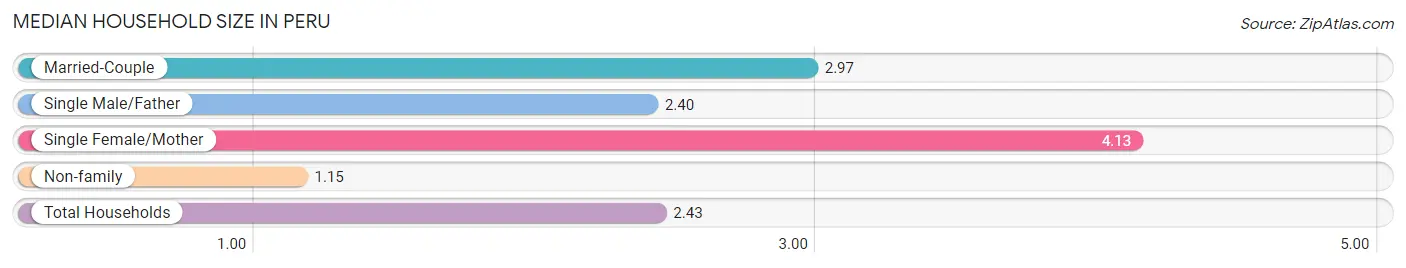
| Household Type | # Households | Household Size |
| Married-Couple | 1,740 (39.5%) | 2.97 |
| Single Male/Father | 194 (4.4%) | 2.40 |
| Single Female/Mother | 754 (17.1%) | 4.13 |
| Non-family | 1,723 (39.1%) | 1.15 |
| Total Households | 4,411 (100.0%) | 2.43 |
Household Size by Marriage Status in Peru
Out of a total of 4,411 households in Peru, 2,688 (60.9%) are family households, while 1,723 (39.1%) are nonfamily households. The most numerous type of family households are 2-person households, comprising 1,168, and the most common type of nonfamily households are 1-person households, comprising 1,510.
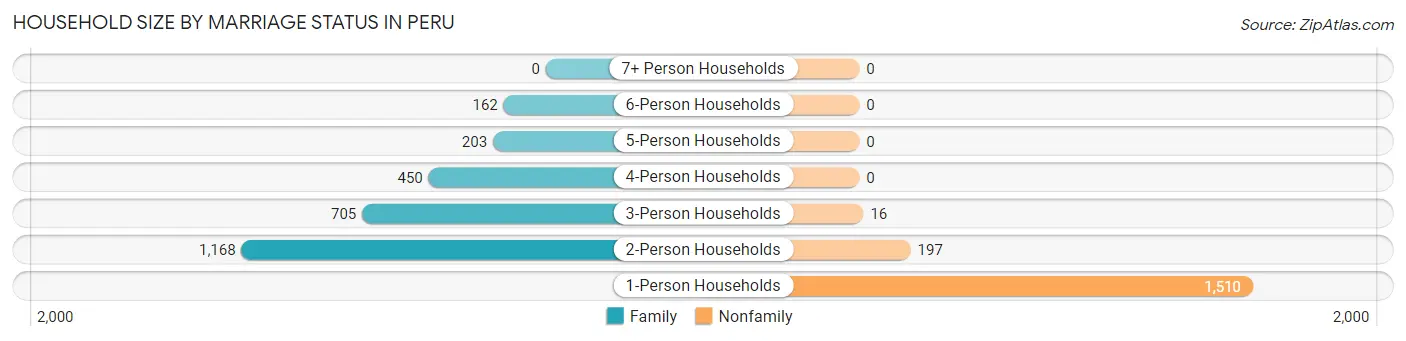
| Household Size | Family Households | Nonfamily Households |
| 1-Person Households | - | 1,510 (34.2%) |
| 2-Person Households | 1,168 (26.5%) | 197 (4.5%) |
| 3-Person Households | 705 (16.0%) | 16 (0.4%) |
| 4-Person Households | 450 (10.2%) | 0 (0.0%) |
| 5-Person Households | 203 (4.6%) | 0 (0.0%) |
| 6-Person Households | 162 (3.7%) | 0 (0.0%) |
| 7+ Person Households | 0 (0.0%) | 0 (0.0%) |
| Total | 2,688 (60.9%) | 1,723 (39.1%) |
Female Fertility in Peru
Fertility by Age in Peru
Average fertility rate in Peru is 25.0 births per 1,000 women. Women in the age bracket of 20 to 34 years have the highest fertility rate with 55.0 births per 1,000 women. Women in the age bracket of 20 to 34 years acount for 81.4% of all women with births.
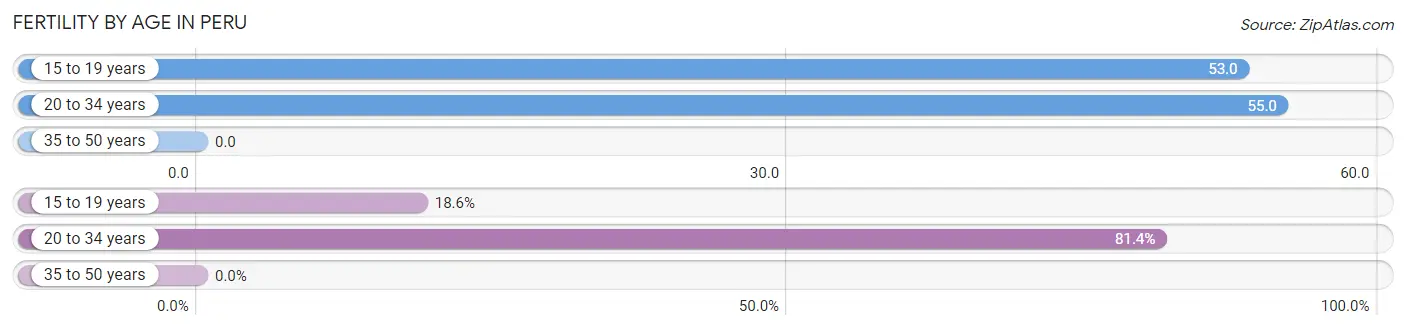
| Age Bracket | Women with Births | Births / 1,000 Women |
| 15 to 19 years | 11 (18.6%) | 53.0 |
| 20 to 34 years | 48 (81.4%) | 55.0 |
| 35 to 50 years | 0 (0.0%) | 0.0 |
| Total | 59 (100.0%) | 25.0 |
Fertility by Age by Marriage Status in Peru
18.6% of women with births (59) in Peru are married. The highest percentage of unmarried women with births falls into 20 to 34 years age bracket with 100.0% of them unmarried at the time of birth, while the lowest percentage of unmarried women with births belong to 15 to 19 years age bracket with 0.0% of them unmarried.
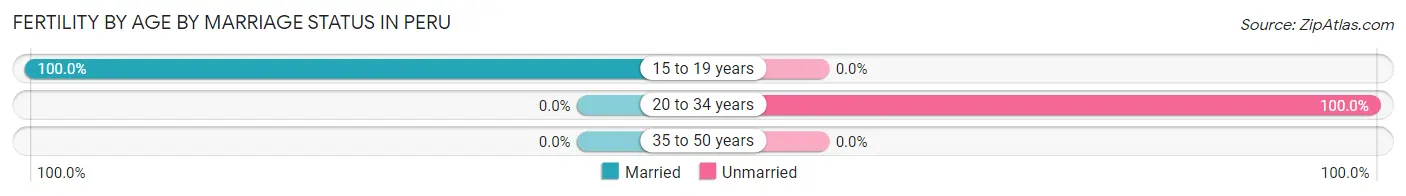
| Age Bracket | Married | Unmarried |
| 15 to 19 years | 11 (100.0%) | 0 (0.0%) |
| 20 to 34 years | 0 (0.0%) | 48 (100.0%) |
| 35 to 50 years | 0 (0.0%) | 0 (0.0%) |
| Total | 11 (18.6%) | 48 (81.4%) |
Fertility by Education in Peru
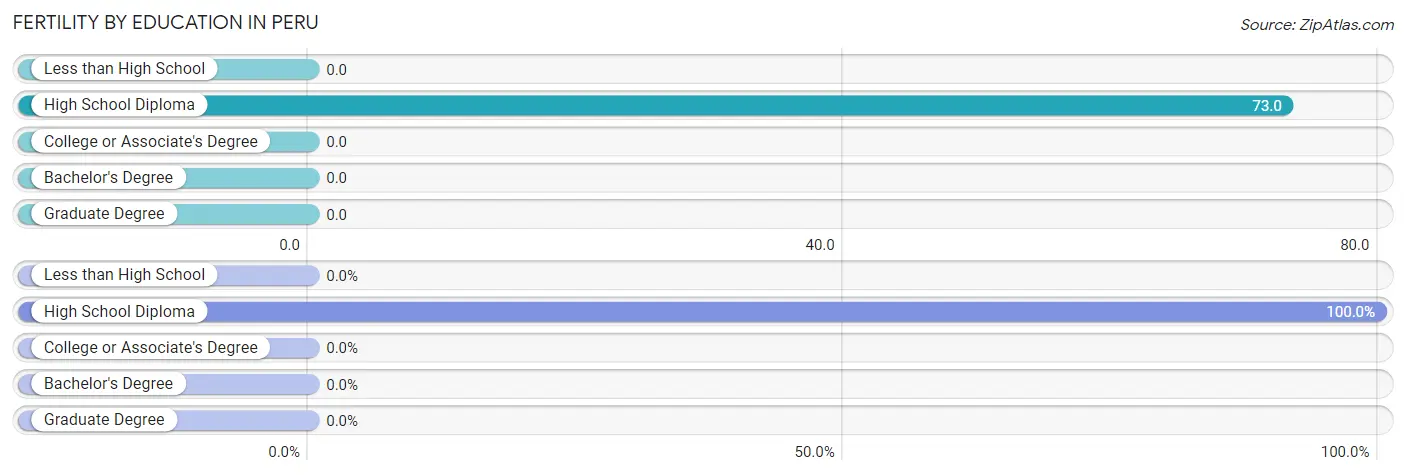
| Educational Attainment | Women with Births | Births / 1,000 Women |
| Less than High School | 0 (0.0%) | 0.0 |
| High School Diploma | 59 (100.0%) | 73.0 |
| College or Associate's Degree | 0 (0.0%) | 0.0 |
| Bachelor's Degree | 0 (0.0%) | 0.0 |
| Graduate Degree | 0 (0.0%) | 0.0 |
| Total | 59 (100.0%) | 25.0 |
Fertility by Education by Marriage Status in Peru
81.4% of women with births in Peru are unmarried. Women with the educational attainment of high school diploma are most likely to be married with 18.6% of them married at childbirth, while women with the educational attainment of high school diploma are least likely to be married with 81.4% of them unmarried at childbirth.
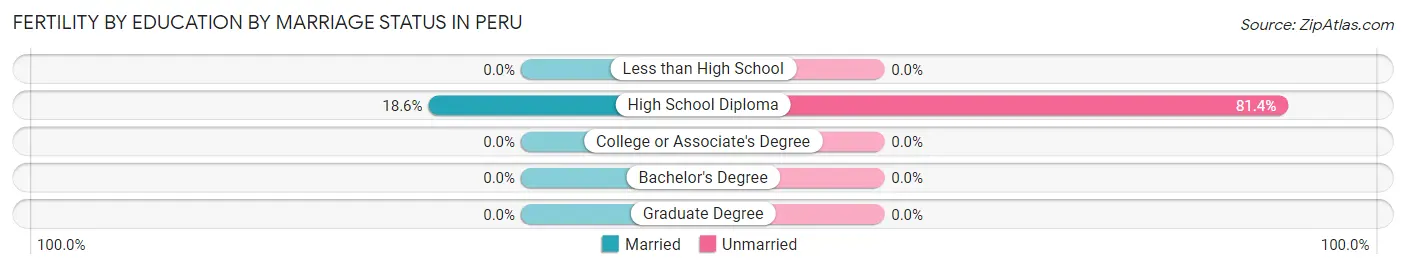
| Educational Attainment | Married | Unmarried |
| Less than High School | 0 (0.0%) | 0 (0.0%) |
| High School Diploma | 11 (18.6%) | 48 (81.4%) |
| College or Associate's Degree | 0 (0.0%) | 0 (0.0%) |
| Bachelor's Degree | 0 (0.0%) | 0 (0.0%) |
| Graduate Degree | 0 (0.0%) | 0 (0.0%) |
| Total | 11 (18.6%) | 48 (81.4%) |
Income in Peru
Income Overview in Peru
Per Capita Income in Peru is $23,913, while median incomes of families and households are $54,479 and $44,665 respectively.
| Characteristic | Number | Measure |
| Per Capita Income | 10,862 | $23,913 |
| Median Family Income | 2,688 | $54,479 |
| Mean Family Income | 2,688 | $65,011 |
| Median Household Income | 4,411 | $44,665 |
| Mean Household Income | 4,411 | $56,114 |
| Income Deficit | 2,688 | $13,512 |
| Wage / Income Gap (%) | 10,862 | 2.44% |
| Wage / Income Gap ($) | 10,862 | 97.56¢ per $1 |
| Gini / Inequality Index | 10,862 | 0.41 |
Earnings by Sex in Peru
Average Earnings in Peru are $29,770, $30,110 for men and $29,375 for women, a difference of 2.4%.
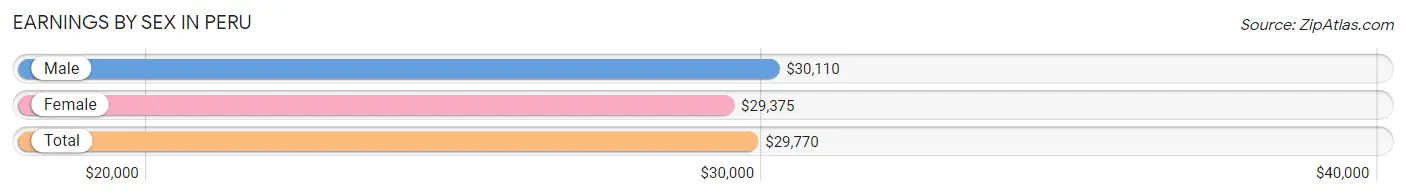
| Sex | Number | Average Earnings |
| Male | 2,986 (56.1%) | $30,110 |
| Female | 2,334 (43.9%) | $29,375 |
| Total | 5,320 (100.0%) | $29,770 |
Earnings by Sex by Income Bracket in Peru
The most common earnings brackets in Peru are $45,000 to $49,999 for men (225 | 7.5%) and $2,499 or less for women (277 | 11.9%).
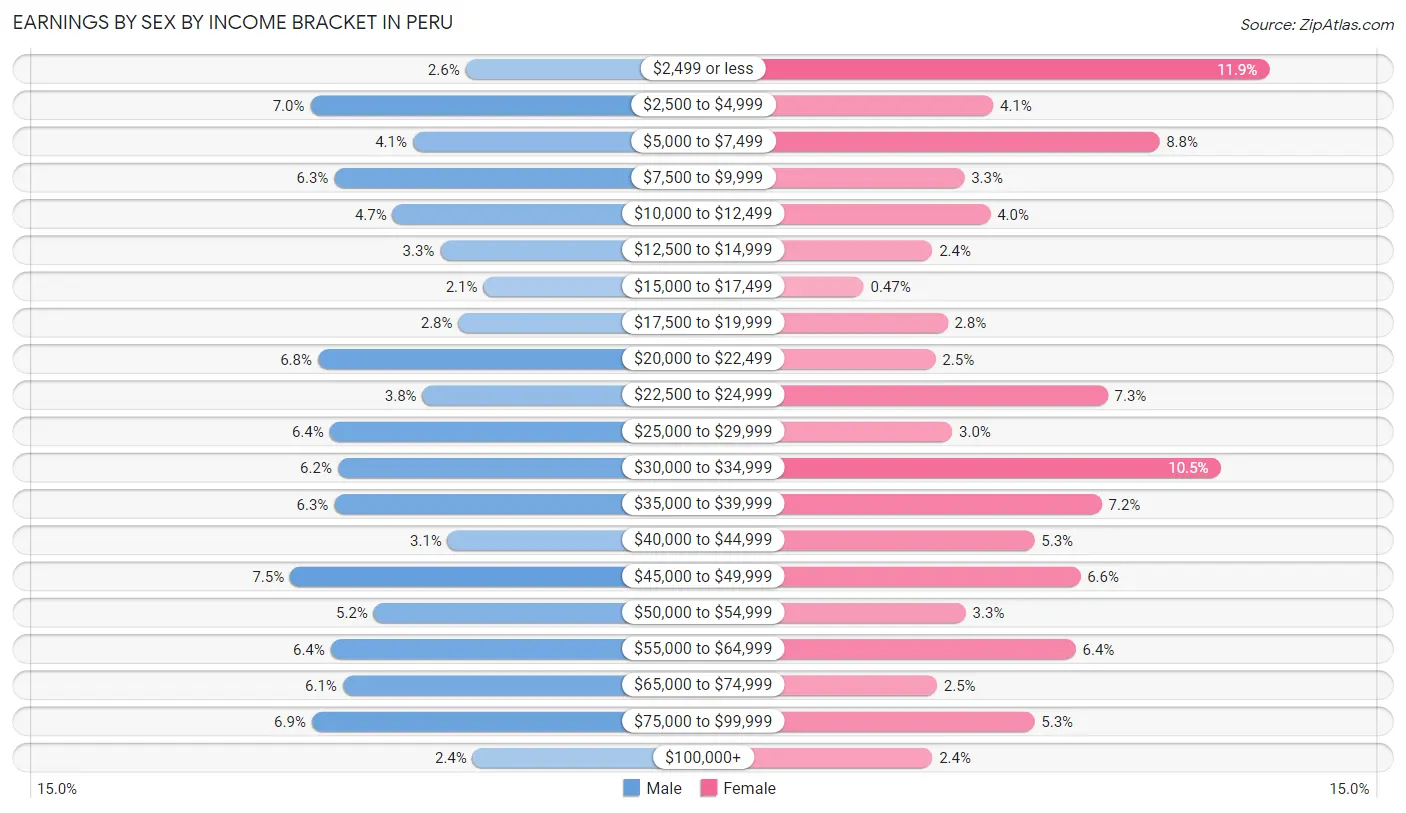
| Income | Male | Female |
| $2,499 or less | 78 (2.6%) | 277 (11.9%) |
| $2,500 to $4,999 | 208 (7.0%) | 96 (4.1%) |
| $5,000 to $7,499 | 122 (4.1%) | 205 (8.8%) |
| $7,500 to $9,999 | 188 (6.3%) | 77 (3.3%) |
| $10,000 to $12,499 | 139 (4.7%) | 94 (4.0%) |
| $12,500 to $14,999 | 99 (3.3%) | 56 (2.4%) |
| $15,000 to $17,499 | 63 (2.1%) | 11 (0.5%) |
| $17,500 to $19,999 | 84 (2.8%) | 66 (2.8%) |
| $20,000 to $22,499 | 202 (6.8%) | 58 (2.5%) |
| $22,500 to $24,999 | 114 (3.8%) | 171 (7.3%) |
| $25,000 to $29,999 | 192 (6.4%) | 69 (3.0%) |
| $30,000 to $34,999 | 185 (6.2%) | 245 (10.5%) |
| $35,000 to $39,999 | 188 (6.3%) | 167 (7.2%) |
| $40,000 to $44,999 | 93 (3.1%) | 123 (5.3%) |
| $45,000 to $49,999 | 225 (7.5%) | 153 (6.6%) |
| $50,000 to $54,999 | 155 (5.2%) | 78 (3.3%) |
| $55,000 to $64,999 | 191 (6.4%) | 150 (6.4%) |
| $65,000 to $74,999 | 181 (6.1%) | 59 (2.5%) |
| $75,000 to $99,999 | 207 (6.9%) | 123 (5.3%) |
| $100,000+ | 72 (2.4%) | 56 (2.4%) |
| Total | 2,986 (100.0%) | 2,334 (100.0%) |
Earnings by Sex by Educational Attainment in Peru
Average earnings in Peru are $36,157 for men and $32,256 for women, a difference of 10.8%. Men with an educational attainment of graduate degree enjoy the highest average annual earnings of $64,464, while those with less than high school education earn the least with $16,693. Women with an educational attainment of bachelor's degree earn the most with the average annual earnings of $53,958, while those with graduate degree education have the smallest earnings of $2,499.
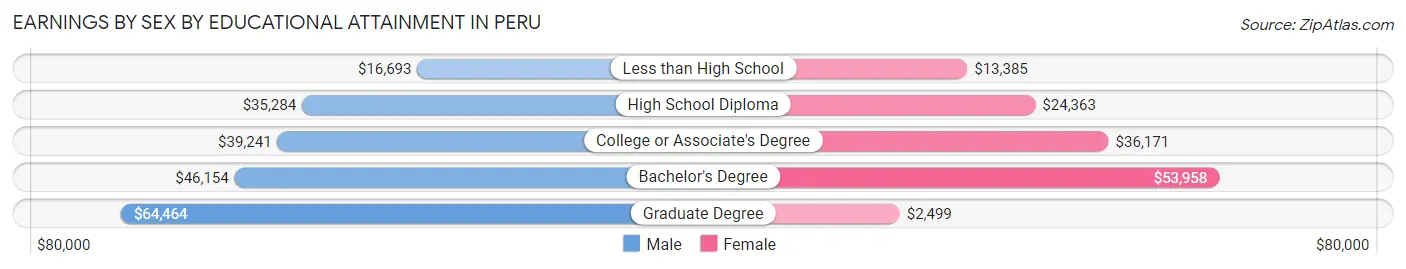
| Educational Attainment | Male Income | Female Income |
| Less than High School | $16,693 | $13,385 |
| High School Diploma | $35,284 | $24,363 |
| College or Associate's Degree | $39,241 | $36,171 |
| Bachelor's Degree | $46,154 | $53,958 |
| Graduate Degree | $64,464 | $2,499 |
| Total | $36,157 | $32,256 |
Family Income in Peru
Family Income Brackets in Peru
According to the Peru family income data, there are 470 families falling into the $75,000 to $99,999 income range, which is the most common income bracket and makes up 17.5% of all families. Conversely, the $150,000 to $199,999 income bracket is the least frequent group with only 48 families (1.8%) belonging to this category.
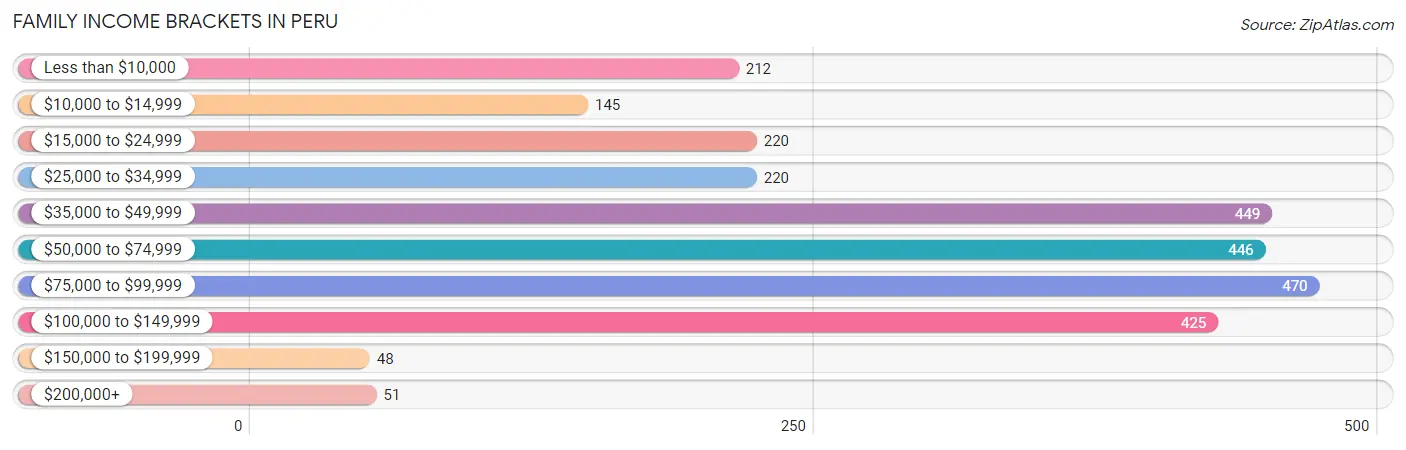
| Income Bracket | # Families | % Families |
| Less than $10,000 | 212 | 7.9% |
| $10,000 to $14,999 | 145 | 5.4% |
| $15,000 to $24,999 | 220 | 8.2% |
| $25,000 to $34,999 | 220 | 8.2% |
| $35,000 to $49,999 | 449 | 16.7% |
| $50,000 to $74,999 | 446 | 16.6% |
| $75,000 to $99,999 | 470 | 17.5% |
| $100,000 to $149,999 | 425 | 15.8% |
| $150,000 to $199,999 | 48 | 1.8% |
| $200,000+ | 51 | 1.9% |
Family Income by Famaliy Size in Peru
3-person families (662 | 24.6%) account for the highest median family income in Peru with $78,088 per family, while 2-person families (1,336 | 49.7%) have the highest median income of $26,856 per family member.
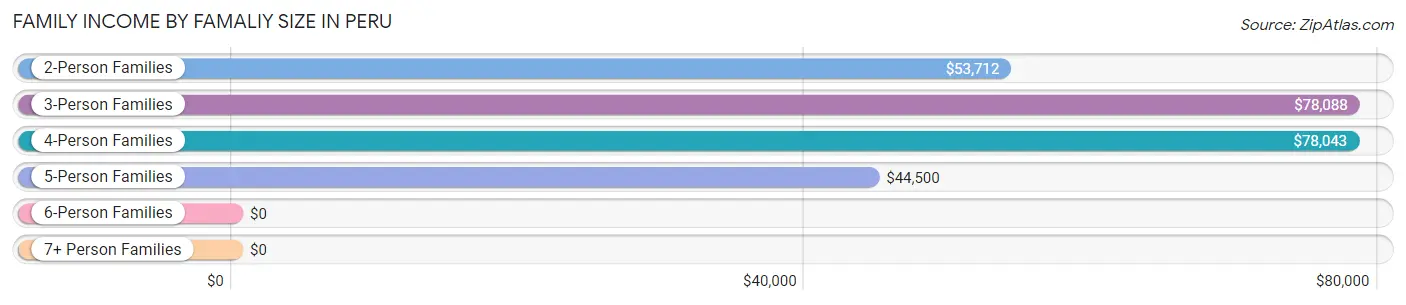
| Income Bracket | # Families | Median Income |
| 2-Person Families | 1,336 (49.7%) | $53,712 |
| 3-Person Families | 662 (24.6%) | $78,088 |
| 4-Person Families | 370 (13.8%) | $78,043 |
| 5-Person Families | 172 (6.4%) | $44,500 |
| 6-Person Families | 148 (5.5%) | $0 |
| 7+ Person Families | 0 (0.0%) | $0 |
| Total | 2,688 (100.0%) | $54,479 |
Family Income by Number of Earners in Peru
The median family income in Peru is $54,479, with families comprising 3+ earners (308) having the highest median family income of $83,910, while families with no earners (524) have the lowest median family income of $31,071, accounting for 11.5% and 19.5% of families, respectively.
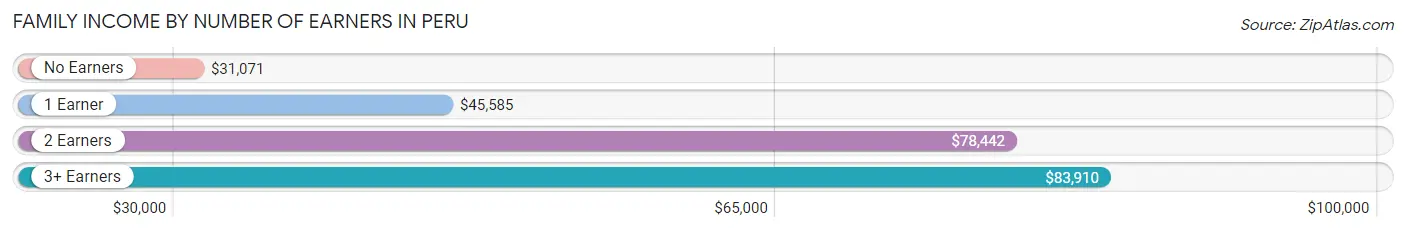
| Number of Earners | # Families | Median Income |
| No Earners | 524 (19.5%) | $31,071 |
| 1 Earner | 921 (34.3%) | $45,585 |
| 2 Earners | 935 (34.8%) | $78,442 |
| 3+ Earners | 308 (11.5%) | $83,910 |
| Total | 2,688 (100.0%) | $54,479 |
Household Income in Peru
Household Income Brackets in Peru
With 812 households falling in the category, the $35,000 to $49,999 income range is the most frequent in Peru, accounting for 18.4% of all households. In contrast, only 49 households (1.1%) fall into the $200,000+ income bracket, making it the least populous group.
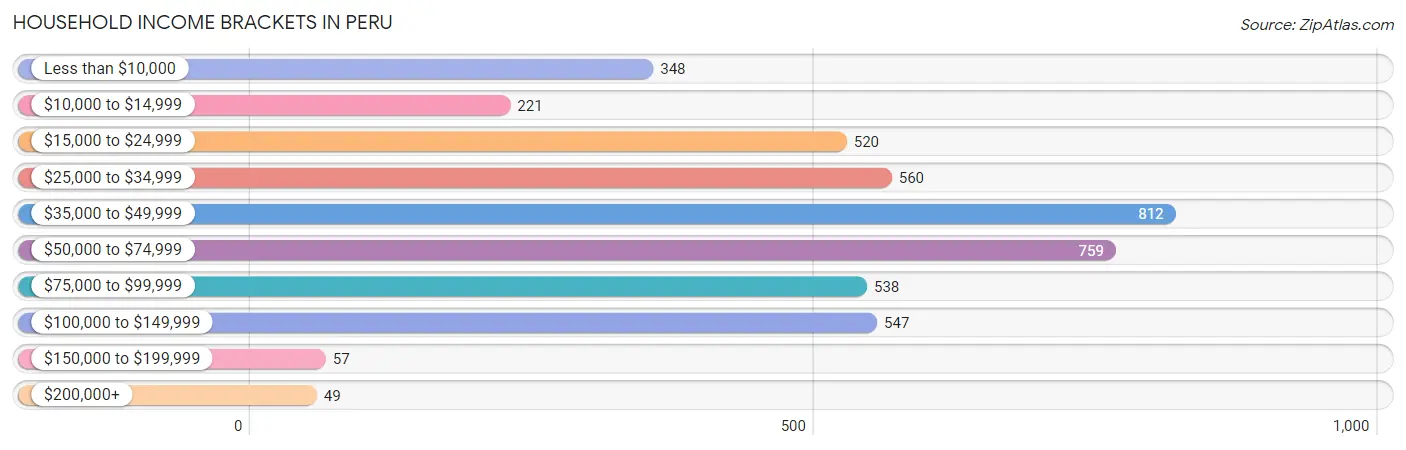
| Income Bracket | # Households | % Households |
| Less than $10,000 | 348 | 7.9% |
| $10,000 to $14,999 | 221 | 5.0% |
| $15,000 to $24,999 | 520 | 11.8% |
| $25,000 to $34,999 | 560 | 12.7% |
| $35,000 to $49,999 | 812 | 18.4% |
| $50,000 to $74,999 | 759 | 17.2% |
| $75,000 to $99,999 | 538 | 12.2% |
| $100,000 to $149,999 | 547 | 12.4% |
| $150,000 to $199,999 | 57 | 1.3% |
| $200,000+ | 49 | 1.1% |
Household Income by Householder Age in Peru
The median household income in Peru is $44,665, with the highest median household income of $55,729 found in the 45 to 64 years age bracket for the primary householder. A total of 1,565 households (35.5%) fall into this category. Meanwhile, the 15 to 24 years age bracket for the primary householder has the lowest median household income of $30,714, with 168 households (3.8%) in this group.
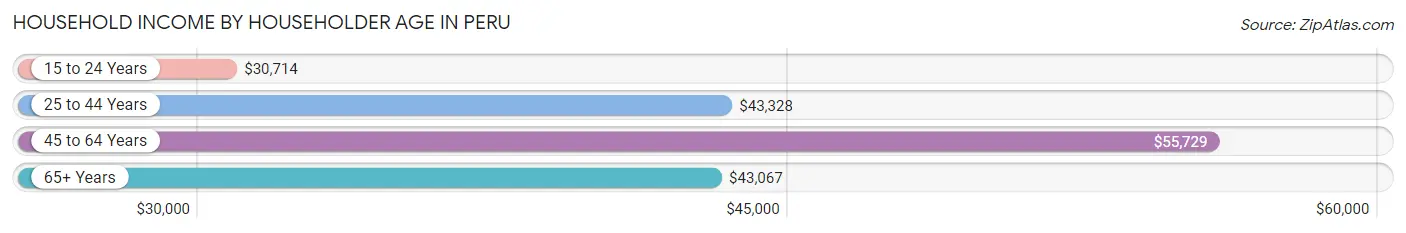
| Income Bracket | # Households | Median Income |
| 15 to 24 Years | 168 (3.8%) | $30,714 |
| 25 to 44 Years | 1,367 (31.0%) | $43,328 |
| 45 to 64 Years | 1,565 (35.5%) | $55,729 |
| 65+ Years | 1,311 (29.7%) | $43,067 |
| Total | 4,411 (100.0%) | $44,665 |
Poverty in Peru
Income Below Poverty by Sex and Age in Peru
With 23.6% poverty level for males and 27.4% for females among the residents of Peru, under 5 year old males and 5 year old females are the most vulnerable to poverty, with 170 males (72.7%) and 28 females (84.9%) in their respective age groups living below the poverty level.
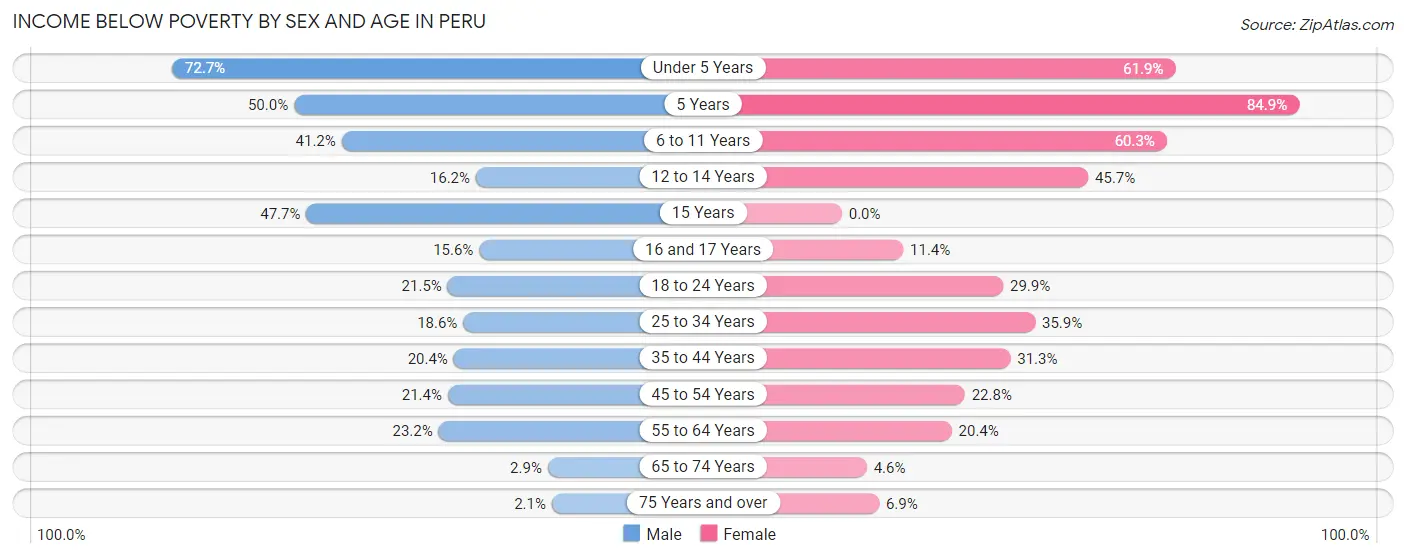
| Age Bracket | Male | Female |
| Under 5 Years | 170 (72.7%) | 130 (61.9%) |
| 5 Years | 46 (50.0%) | 28 (84.9%) |
| 6 to 11 Years | 170 (41.2%) | 243 (60.3%) |
| 12 to 14 Years | 32 (16.2%) | 123 (45.7%) |
| 15 Years | 104 (47.7%) | 0 (0.0%) |
| 16 and 17 Years | 30 (15.6%) | 14 (11.4%) |
| 18 to 24 Years | 120 (21.5%) | 126 (29.9%) |
| 25 to 34 Years | 103 (18.6%) | 184 (35.9%) |
| 35 to 44 Years | 153 (20.3%) | 237 (31.3%) |
| 45 to 54 Years | 182 (21.4%) | 183 (22.8%) |
| 55 to 64 Years | 146 (23.2%) | 129 (20.4%) |
| 65 to 74 Years | 14 (2.9%) | 33 (4.6%) |
| 75 Years and over | 5 (2.1%) | 28 (6.9%) |
| Total | 1,275 (23.6%) | 1,458 (27.4%) |
Income Above Poverty by Sex and Age in Peru
According to the poverty statistics in Peru, males aged 75 years and over and females aged 15 years are the age groups that are most secure financially, with 97.9% of males and 100.0% of females in these age groups living above the poverty line.
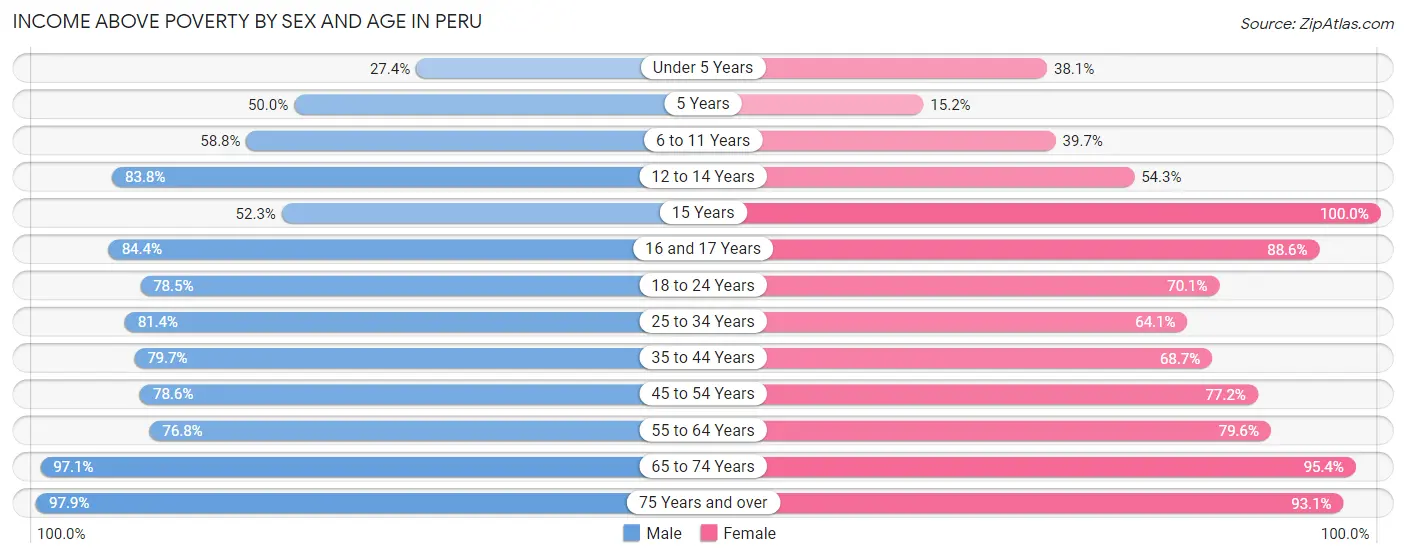
| Age Bracket | Male | Female |
| Under 5 Years | 64 (27.4%) | 80 (38.1%) |
| 5 Years | 46 (50.0%) | 5 (15.1%) |
| 6 to 11 Years | 243 (58.8%) | 160 (39.7%) |
| 12 to 14 Years | 165 (83.8%) | 146 (54.3%) |
| 15 Years | 114 (52.3%) | 30 (100.0%) |
| 16 and 17 Years | 162 (84.4%) | 109 (88.6%) |
| 18 to 24 Years | 439 (78.5%) | 295 (70.1%) |
| 25 to 34 Years | 451 (81.4%) | 329 (64.1%) |
| 35 to 44 Years | 599 (79.6%) | 521 (68.7%) |
| 45 to 54 Years | 667 (78.6%) | 619 (77.2%) |
| 55 to 64 Years | 484 (76.8%) | 504 (79.6%) |
| 65 to 74 Years | 468 (97.1%) | 681 (95.4%) |
| 75 Years and over | 229 (97.9%) | 378 (93.1%) |
| Total | 4,131 (76.4%) | 3,857 (72.6%) |
Income Below Poverty Among Married-Couple Families in Peru
The poverty statistics for married-couple families in Peru show that 14.7% or 255 of the total 1,740 families live below the poverty line. Families with 3 or 4 children have the highest poverty rate of 68.8%, comprising of 119 families. On the other hand, families with no children have the lowest poverty rate of 4.0%, which includes 43 families.
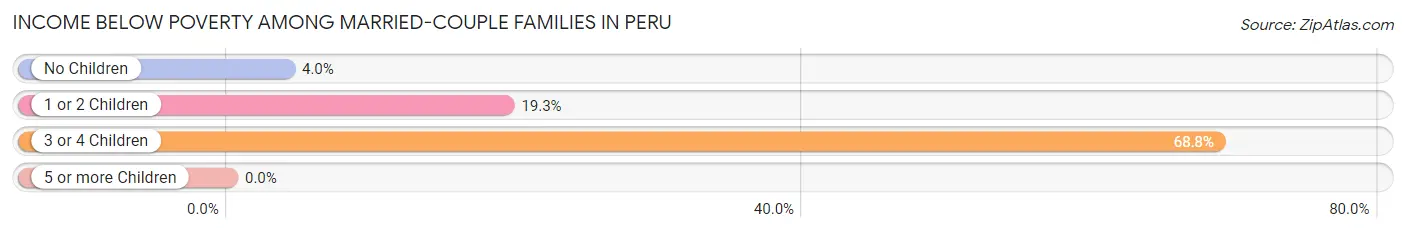
| Children | Above Poverty | Below Poverty |
| No Children | 1,041 (96.0%) | 43 (4.0%) |
| 1 or 2 Children | 390 (80.7%) | 93 (19.3%) |
| 3 or 4 Children | 54 (31.2%) | 119 (68.8%) |
| 5 or more Children | 0 (0.0%) | 0 (0.0%) |
| Total | 1,485 (85.3%) | 255 (14.7%) |
Income Below Poverty Among Single-Parent Households in Peru
According to the poverty data in Peru, 33.5% or 65 single-father households and 33.0% or 249 single-mother households are living below the poverty line. Among single-father households, those with 1 or 2 children have the highest poverty rate, with 60 households (57.7%) experiencing poverty. Likewise, among single-mother households, those with 3 or 4 children have the highest poverty rate, with 81 households (74.3%) falling below the poverty line.
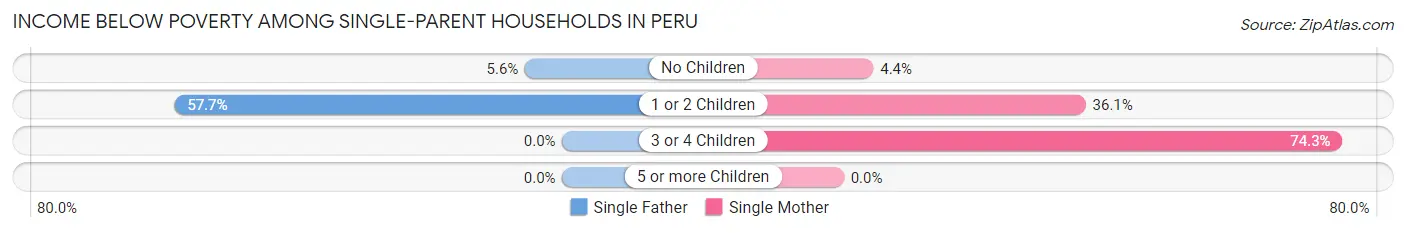
| Children | Single Father | Single Mother |
| No Children | 5 (5.6%) | 9 (4.4%) |
| 1 or 2 Children | 60 (57.7%) | 159 (36.0%) |
| 3 or 4 Children | 0 (0.0%) | 81 (74.3%) |
| 5 or more Children | 0 (0.0%) | 0 (0.0%) |
| Total | 65 (33.5%) | 249 (33.0%) |
Income Below Poverty Among Married-Couple vs Single-Parent Households in Peru
The poverty data for Peru shows that 255 of the married-couple family households (14.7%) and 314 of the single-parent households (33.1%) are living below the poverty level. Within the married-couple family households, those with 3 or 4 children have the highest poverty rate, with 119 households (68.8%) falling below the poverty line. Among the single-parent households, those with 3 or 4 children have the highest poverty rate, with 81 household (74.3%) living below poverty.
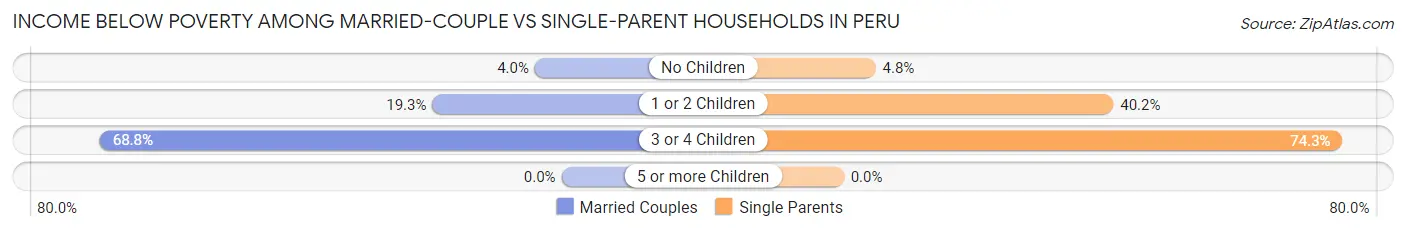
| Children | Married-Couple Families | Single-Parent Households |
| No Children | 43 (4.0%) | 14 (4.8%) |
| 1 or 2 Children | 93 (19.3%) | 219 (40.2%) |
| 3 or 4 Children | 119 (68.8%) | 81 (74.3%) |
| 5 or more Children | 0 (0.0%) | 0 (0.0%) |
| Total | 255 (14.7%) | 314 (33.1%) |
Employment Characteristics in Peru
Employment by Class of Employer in Peru
Among the 4,520 employed individuals in Peru, private company employees (3,311 | 73.3%), not-for-profit organizations (408 | 9.0%), and local government employees (237 | 5.2%) make up the most common classes of employment.
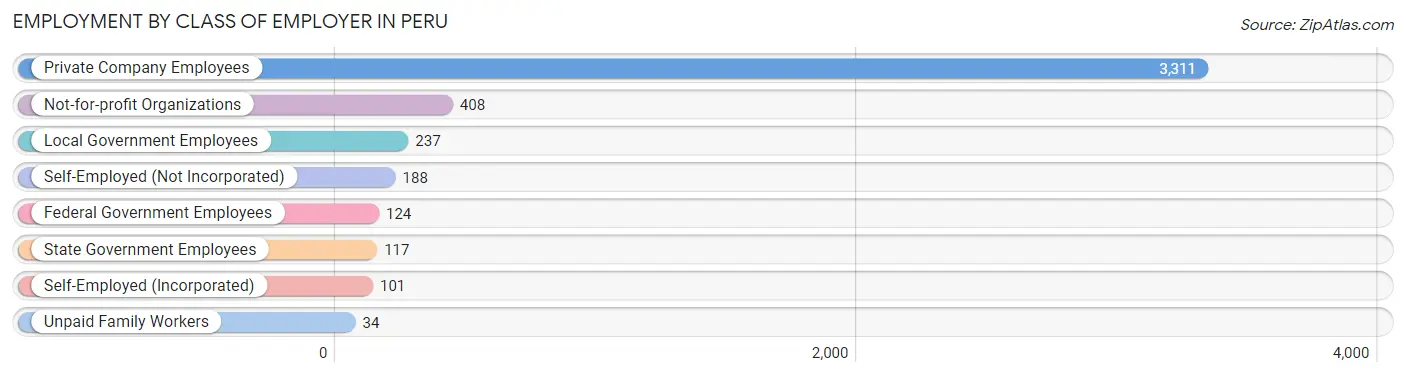
| Employer Class | # Employees | % Employees |
| Private Company Employees | 3,311 | 73.3% |
| Self-Employed (Incorporated) | 101 | 2.2% |
| Self-Employed (Not Incorporated) | 188 | 4.2% |
| Not-for-profit Organizations | 408 | 9.0% |
| Local Government Employees | 237 | 5.2% |
| State Government Employees | 117 | 2.6% |
| Federal Government Employees | 124 | 2.7% |
| Unpaid Family Workers | 34 | 0.7% |
| Total | 4,520 | 100.0% |
Employment Status by Age in Peru
According to the labor force statistics for Peru, out of the total population over 16 years of age (8,745), 57.6% or 5,037 individuals are in the labor force, with 6.4% or 322 of them unemployed. The age group with the highest labor force participation rate is 20 to 24 years, with 79.8% or 578 individuals in the labor force. Within the labor force, the 16 to 19 years age range has the highest percentage of unemployed individuals, with 13.4% or 48 of them being unemployed.
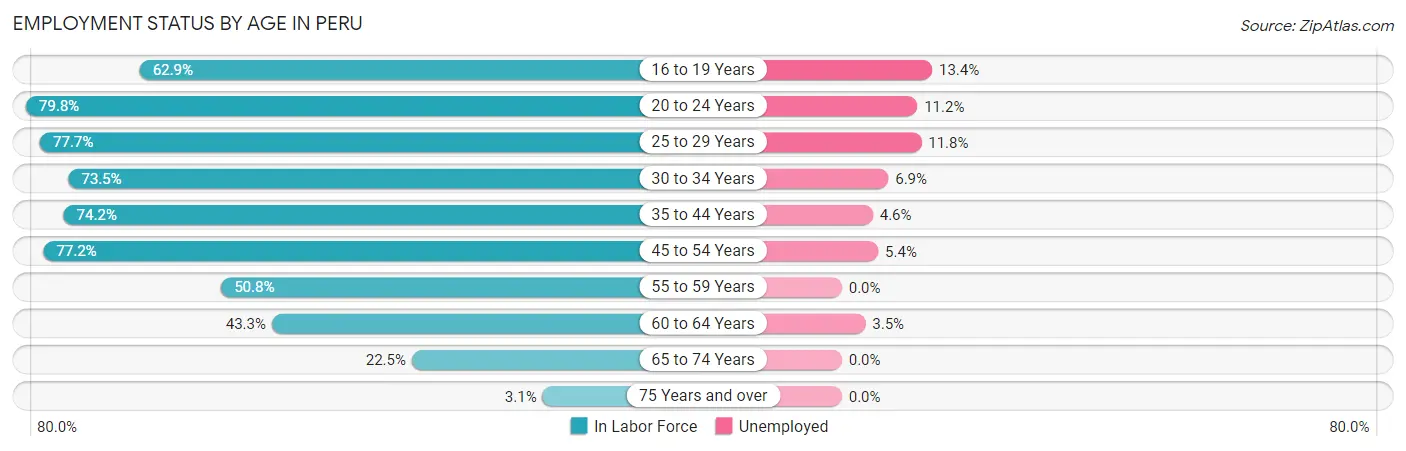
| Age Bracket | In Labor Force | Unemployed |
| 16 to 19 Years | 359 (62.9%) | 48 (13.4%) |
| 20 to 24 Years | 578 (79.8%) | 65 (11.2%) |
| 25 to 29 Years | 415 (77.7%) | 49 (11.8%) |
| 30 to 34 Years | 392 (73.5%) | 27 (6.9%) |
| 35 to 44 Years | 1,120 (74.2%) | 52 (4.6%) |
| 45 to 54 Years | 1,275 (77.2%) | 69 (5.4%) |
| 55 to 59 Years | 285 (50.8%) | 0 (0.0%) |
| 60 to 64 Years | 312 (43.3%) | 11 (3.5%) |
| 65 to 74 Years | 276 (22.5%) | 0 (0.0%) |
| 75 Years and over | 22 (3.1%) | 0 (0.0%) |
| Total | 5,037 (57.6%) | 322 (6.4%) |
Employment Status by Educational Attainment in Peru
According to labor force statistics for Peru, 68.9% of individuals (3,796) out of the total population between 25 and 64 years of age (5,510) are in the labor force, with 5.5% or 209 of them being unemployed. The group with the highest labor force participation rate are those with the educational attainment of college / associate degree, with 72.2% or 1,101 individuals in the labor force. Within the labor force, individuals with less than high school education have the highest percentage of unemployment, with 6.5% or 25 of them being unemployed.
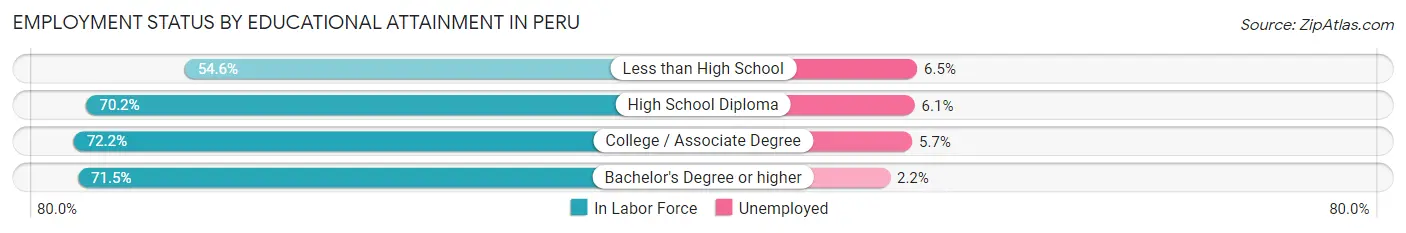
| Educational Attainment | In Labor Force | Unemployed |
| Less than High School | 387 (54.6%) | 46 (6.5%) |
| High School Diploma | 1,731 (70.2%) | 150 (6.1%) |
| College / Associate Degree | 1,101 (72.2%) | 87 (5.7%) |
| Bachelor's Degree or higher | 579 (71.5%) | 18 (2.2%) |
| Total | 3,796 (68.9%) | 303 (5.5%) |
Employment Occupations by Sex in Peru
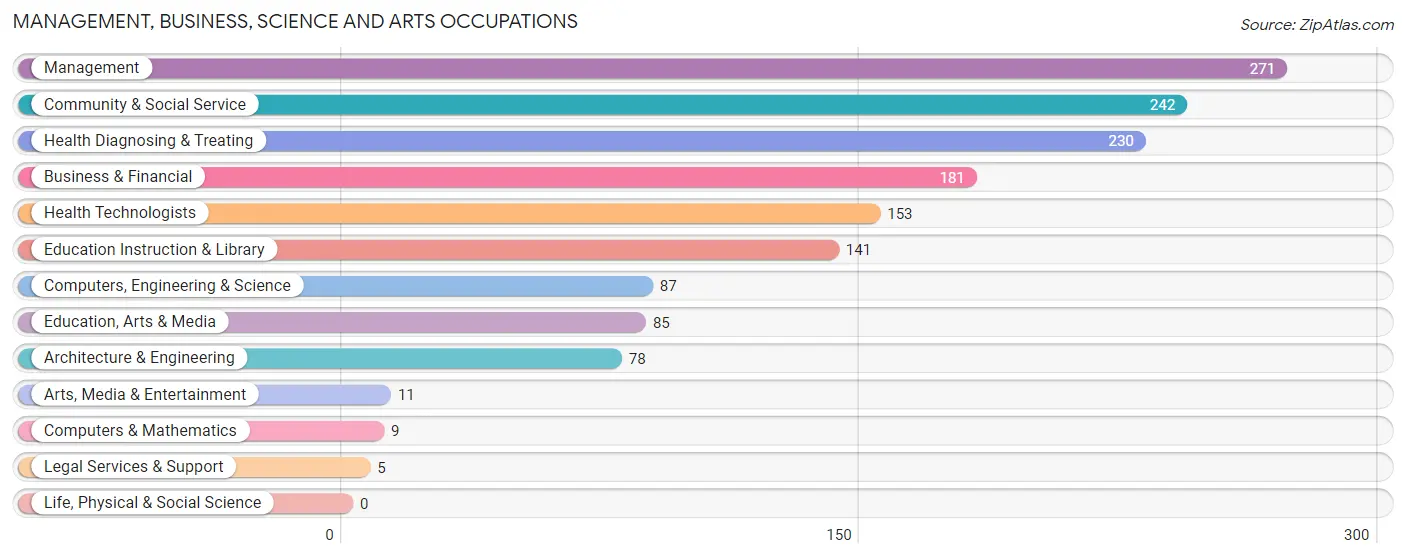
Management, Business, Science and Arts Occupations
The most common Management, Business, Science and Arts occupations in Peru are Management (271 | 5.8%), Community & Social Service (242 | 5.1%), Health Diagnosing & Treating (230 | 4.9%), Business & Financial (181 | 3.8%), and Health Technologists (153 | 3.3%).
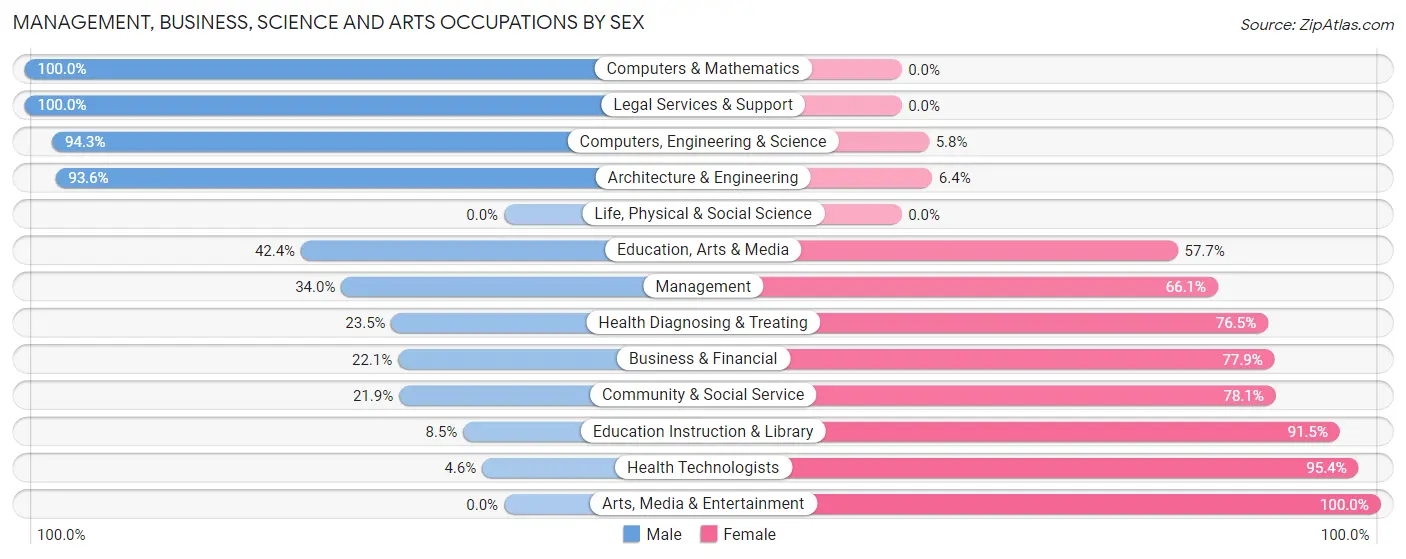
Management, Business, Science and Arts Occupations by Sex
Within the Management, Business, Science and Arts occupations in Peru, the most male-oriented occupations are Computers & Mathematics (100.0%), Legal Services & Support (100.0%), and Computers, Engineering & Science (94.3%), while the most female-oriented occupations are Arts, Media & Entertainment (100.0%), Health Technologists (95.4%), and Education Instruction & Library (91.5%).
| Occupation | Male | Female |
| Management | 92 (34.0%) | 179 (66.0%) |
| Business & Financial | 40 (22.1%) | 141 (77.9%) |
| Computers, Engineering & Science | 82 (94.3%) | 5 (5.8%) |
| Computers & Mathematics | 9 (100.0%) | 0 (0.0%) |
| Architecture & Engineering | 73 (93.6%) | 5 (6.4%) |
| Life, Physical & Social Science | 0 (0.0%) | 0 (0.0%) |
| Community & Social Service | 53 (21.9%) | 189 (78.1%) |
| Education, Arts & Media | 36 (42.3%) | 49 (57.7%) |
| Legal Services & Support | 5 (100.0%) | 0 (0.0%) |
| Education Instruction & Library | 12 (8.5%) | 129 (91.5%) |
| Arts, Media & Entertainment | 0 (0.0%) | 11 (100.0%) |
| Health Diagnosing & Treating | 54 (23.5%) | 176 (76.5%) |
| Health Technologists | 7 (4.6%) | 146 (95.4%) |
| Total (Category) | 321 (31.8%) | 690 (68.2%) |
| Total (Overall) | 2,675 (56.8%) | 2,038 (43.2%) |
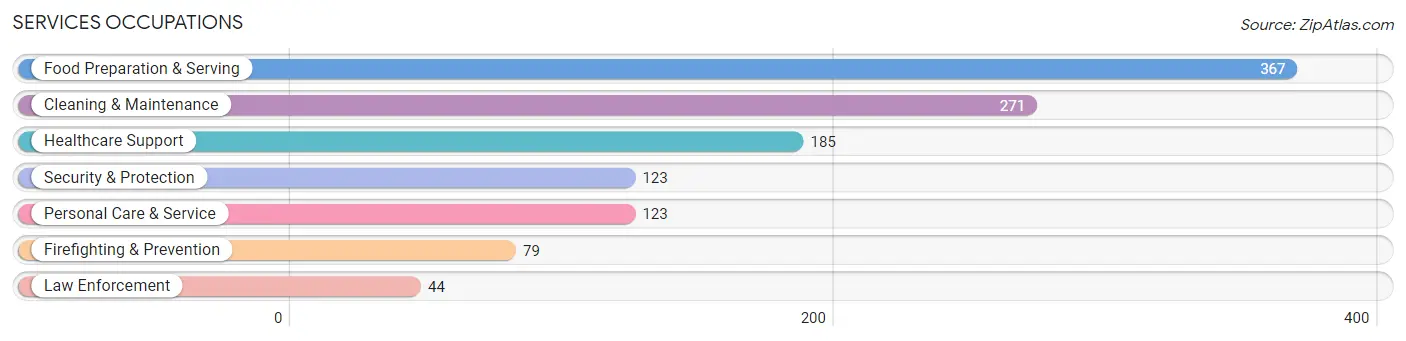
Services Occupations
The most common Services occupations in Peru are Food Preparation & Serving (367 | 7.8%), Cleaning & Maintenance (271 | 5.8%), Healthcare Support (185 | 3.9%), Security & Protection (123 | 2.6%), and Personal Care & Service (123 | 2.6%).
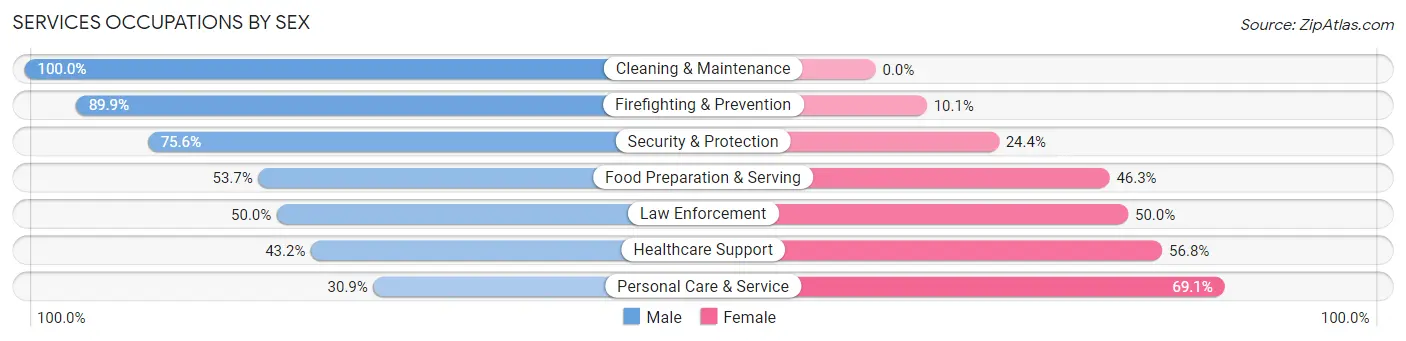
Services Occupations by Sex
Within the Services occupations in Peru, the most male-oriented occupations are Cleaning & Maintenance (100.0%), Firefighting & Prevention (89.9%), and Security & Protection (75.6%), while the most female-oriented occupations are Personal Care & Service (69.1%), Healthcare Support (56.8%), and Law Enforcement (50.0%).
| Occupation | Male | Female |
| Healthcare Support | 80 (43.2%) | 105 (56.8%) |
| Security & Protection | 93 (75.6%) | 30 (24.4%) |
| Firefighting & Prevention | 71 (89.9%) | 8 (10.1%) |
| Law Enforcement | 22 (50.0%) | 22 (50.0%) |
| Food Preparation & Serving | 197 (53.7%) | 170 (46.3%) |
| Cleaning & Maintenance | 271 (100.0%) | 0 (0.0%) |
| Personal Care & Service | 38 (30.9%) | 85 (69.1%) |
| Total (Category) | 679 (63.5%) | 390 (36.5%) |
| Total (Overall) | 2,675 (56.8%) | 2,038 (43.2%) |
Sales and Office Occupations
The most common Sales and Office occupations in Peru are Sales & Related (476 | 10.1%), and Office & Administration (365 | 7.7%).

Sales and Office Occupations by Sex

| Occupation | Male | Female |
| Sales & Related | 265 (55.7%) | 211 (44.3%) |
| Office & Administration | 62 (17.0%) | 303 (83.0%) |
| Total (Category) | 327 (38.9%) | 514 (61.1%) |
| Total (Overall) | 2,675 (56.8%) | 2,038 (43.2%) |
Natural Resources, Construction and Maintenance Occupations
The most common Natural Resources, Construction and Maintenance occupations in Peru are Construction & Extraction (309 | 6.6%), Installation, Maintenance & Repair (100 | 2.1%), and Farming, Fishing & Forestry (19 | 0.4%).
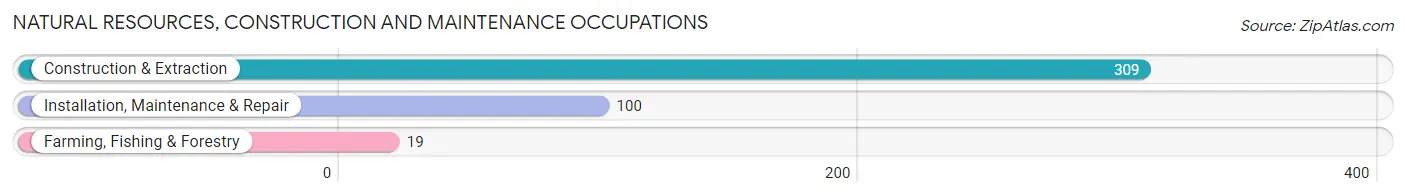
Natural Resources, Construction and Maintenance Occupations by Sex

| Occupation | Male | Female |
| Farming, Fishing & Forestry | 19 (100.0%) | 0 (0.0%) |
| Construction & Extraction | 309 (100.0%) | 0 (0.0%) |
| Installation, Maintenance & Repair | 93 (93.0%) | 7 (7.0%) |
| Total (Category) | 421 (98.4%) | 7 (1.6%) |
| Total (Overall) | 2,675 (56.8%) | 2,038 (43.2%) |
Production, Transportation and Moving Occupations
The most common Production, Transportation and Moving occupations in Peru are Production (761 | 16.2%), Material Moving (402 | 8.5%), and Transportation (201 | 4.3%).
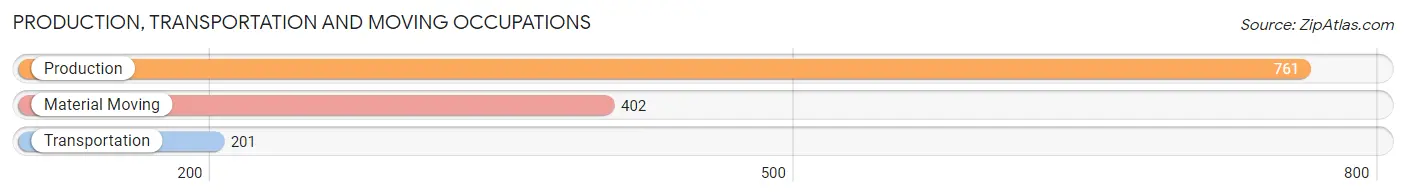
Production, Transportation and Moving Occupations by Sex
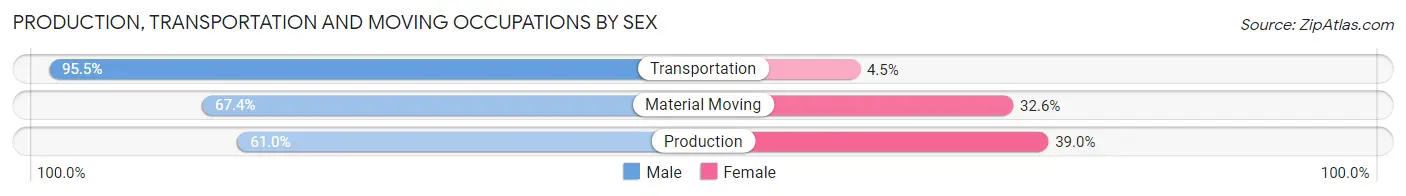
| Occupation | Male | Female |
| Production | 464 (61.0%) | 297 (39.0%) |
| Transportation | 192 (95.5%) | 9 (4.5%) |
| Material Moving | 271 (67.4%) | 131 (32.6%) |
| Total (Category) | 927 (68.0%) | 437 (32.0%) |
| Total (Overall) | 2,675 (56.8%) | 2,038 (43.2%) |
Employment Industries by Sex in Peru
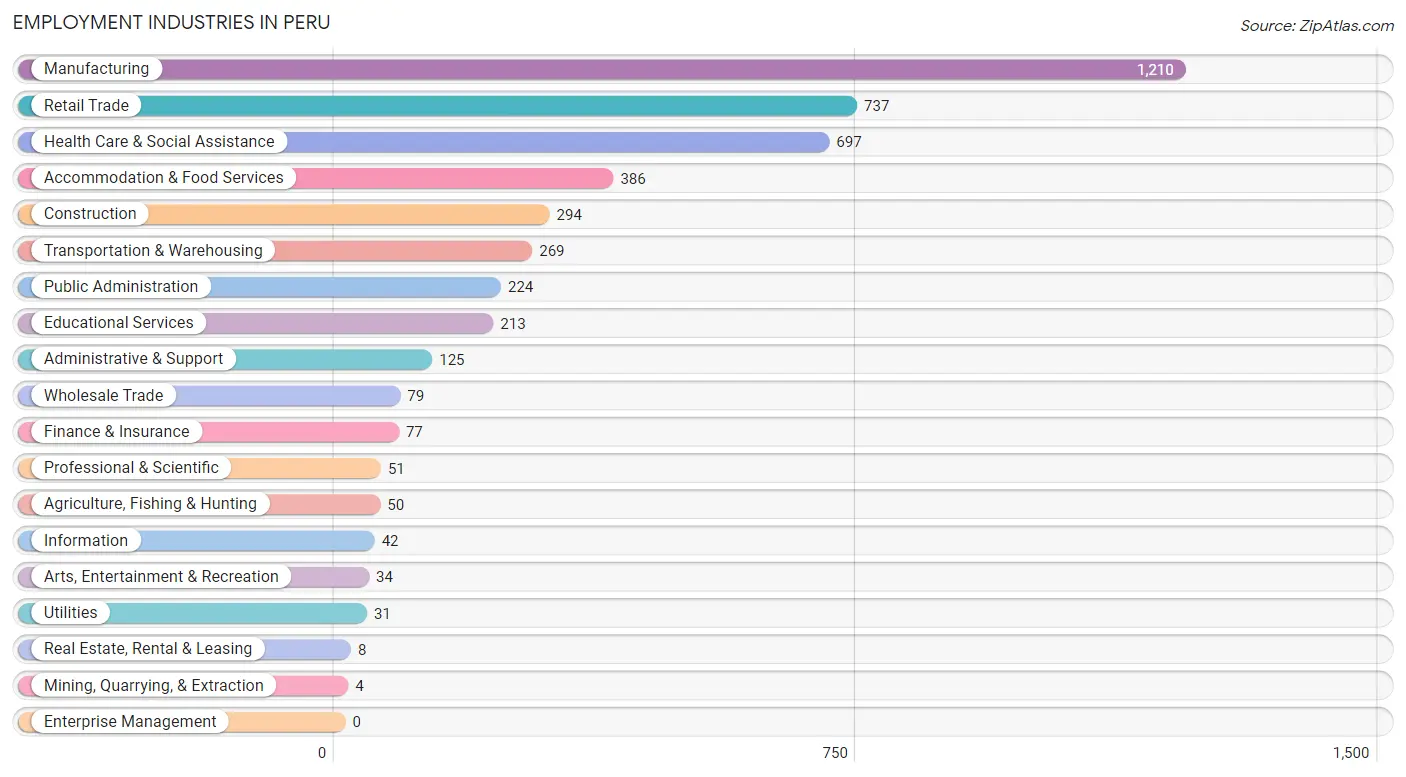
Employment Industries in Peru
The major employment industries in Peru include Manufacturing (1,210 | 25.7%), Retail Trade (737 | 15.6%), Health Care & Social Assistance (697 | 14.8%), Accommodation & Food Services (386 | 8.2%), and Construction (294 | 6.2%).
Employment Industries by Sex in Peru
The Peru industries that see more men than women are Agriculture, Fishing & Hunting (100.0%), Mining, Quarrying, & Extraction (100.0%), and Utilities (100.0%), whereas the industries that tend to have a higher number of women are Finance & Insurance (83.1%), Educational Services (81.2%), and Health Care & Social Assistance (81.2%).
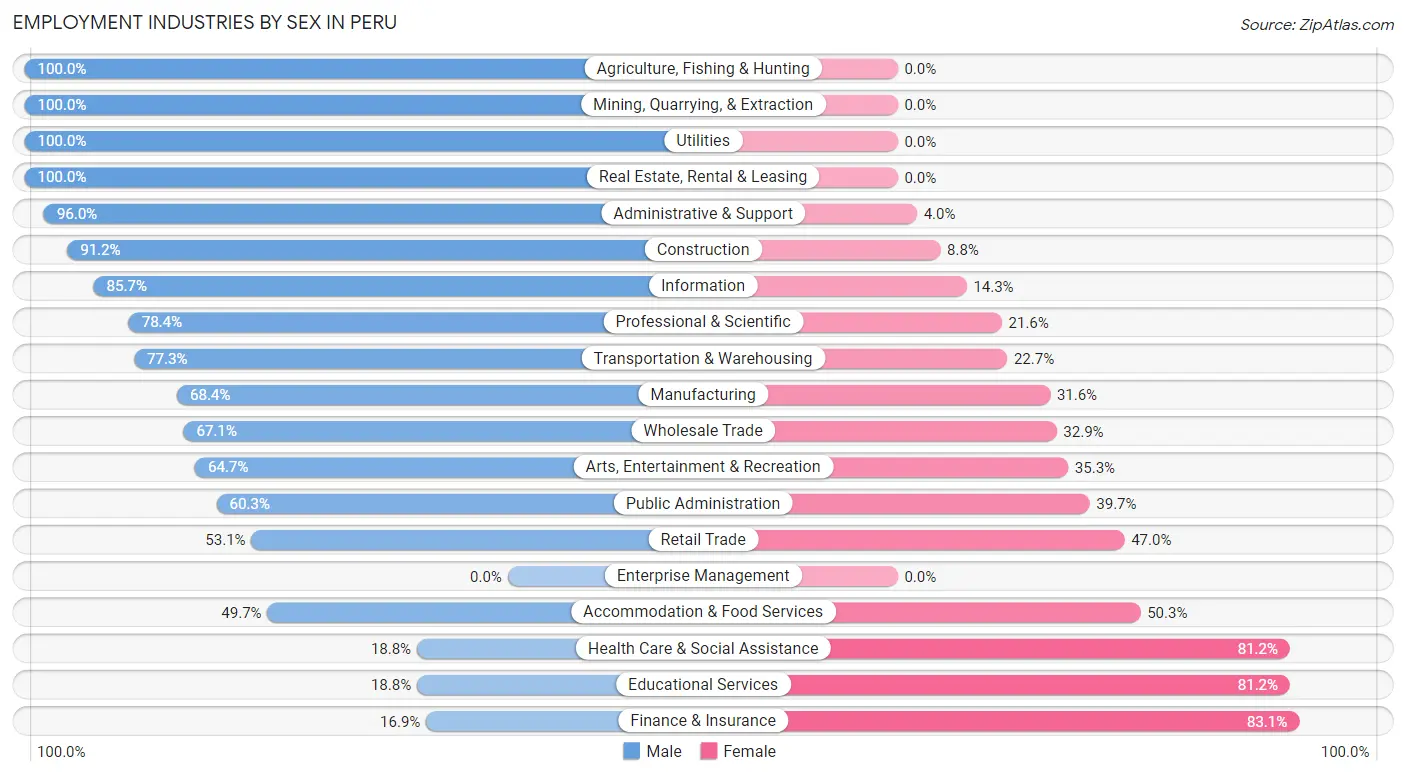
| Industry | Male | Female |
| Agriculture, Fishing & Hunting | 50 (100.0%) | 0 (0.0%) |
| Mining, Quarrying, & Extraction | 4 (100.0%) | 0 (0.0%) |
| Construction | 268 (91.2%) | 26 (8.8%) |
| Manufacturing | 828 (68.4%) | 382 (31.6%) |
| Wholesale Trade | 53 (67.1%) | 26 (32.9%) |
| Retail Trade | 391 (53.0%) | 346 (46.9%) |
| Transportation & Warehousing | 208 (77.3%) | 61 (22.7%) |
| Utilities | 31 (100.0%) | 0 (0.0%) |
| Information | 36 (85.7%) | 6 (14.3%) |
| Finance & Insurance | 13 (16.9%) | 64 (83.1%) |
| Real Estate, Rental & Leasing | 8 (100.0%) | 0 (0.0%) |
| Professional & Scientific | 40 (78.4%) | 11 (21.6%) |
| Enterprise Management | 0 (0.0%) | 0 (0.0%) |
| Administrative & Support | 120 (96.0%) | 5 (4.0%) |
| Educational Services | 40 (18.8%) | 173 (81.2%) |
| Health Care & Social Assistance | 131 (18.8%) | 566 (81.2%) |
| Arts, Entertainment & Recreation | 22 (64.7%) | 12 (35.3%) |
| Accommodation & Food Services | 192 (49.7%) | 194 (50.3%) |
| Public Administration | 135 (60.3%) | 89 (39.7%) |
| Total | 2,675 (56.8%) | 2,038 (43.2%) |
Education in Peru
School Enrollment in Peru
The most common levels of schooling among the 2,421 students in Peru are middle school (688 | 28.4%), high school (613 | 25.3%), and elementary school (530 | 21.9%).
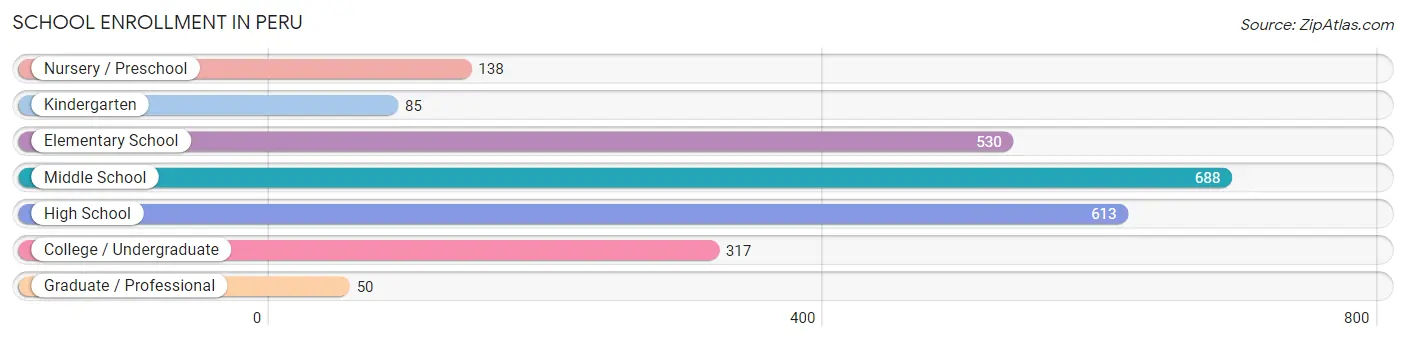
| School Level | # Students | % Students |
| Nursery / Preschool | 138 | 5.7% |
| Kindergarten | 85 | 3.5% |
| Elementary School | 530 | 21.9% |
| Middle School | 688 | 28.4% |
| High School | 613 | 25.3% |
| College / Undergraduate | 317 | 13.1% |
| Graduate / Professional | 50 | 2.1% |
| Total | 2,421 | 100.0% |
School Enrollment by Age by Funding Source in Peru
Out of a total of 2,421 students who are enrolled in schools in Peru, 116 (4.8%) attend a private institution, while the remaining 2,305 (95.2%) are enrolled in public schools. The age group of 20 to 24 year olds has the highest likelihood of being enrolled in private schools, with 45 (35.7% in the age bracket) enrolled. Conversely, the age group of 18 to 19 year olds has the lowest likelihood of being enrolled in a private school, with 104 (100.0% in the age bracket) attending a public institution.
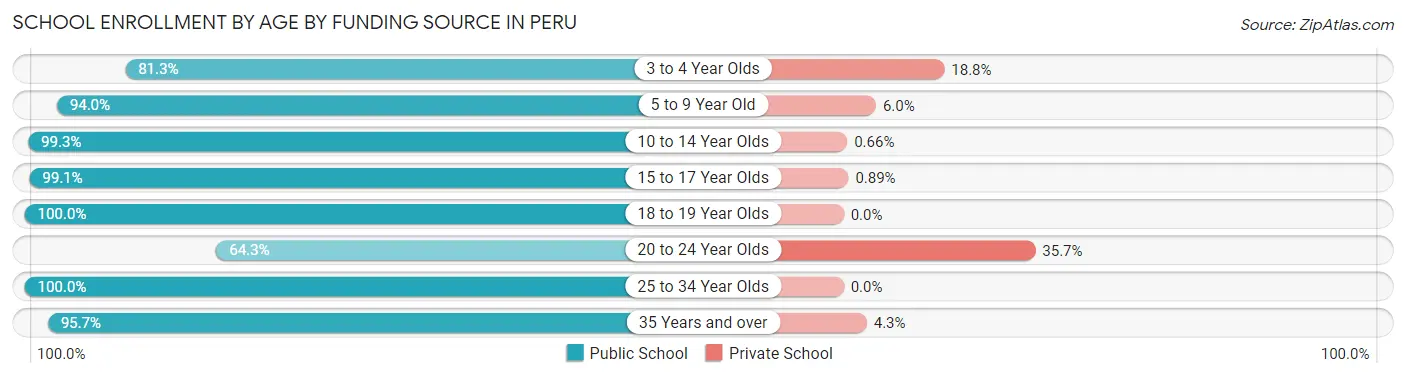
| Age Bracket | Public School | Private School |
| 3 to 4 Year Olds | 91 (81.2%) | 21 (18.8%) |
| 5 to 9 Year Old | 531 (94.0%) | 34 (6.0%) |
| 10 to 14 Year Olds | 752 (99.3%) | 5 (0.7%) |
| 15 to 17 Year Olds | 558 (99.1%) | 5 (0.9%) |
| 18 to 19 Year Olds | 104 (100.0%) | 0 (0.0%) |
| 20 to 24 Year Olds | 81 (64.3%) | 45 (35.7%) |
| 25 to 34 Year Olds | 78 (100.0%) | 0 (0.0%) |
| 35 Years and over | 111 (95.7%) | 5 (4.3%) |
| Total | 2,305 (95.2%) | 116 (4.8%) |
Educational Attainment by Field of Study in Peru
Education (251 | 22.7%), business (245 | 22.1%), arts & humanities (187 | 16.9%), science & technology (99 | 8.9%), and psychology (60 | 5.4%) are the most common fields of study among 1,107 individuals in Peru who have obtained a bachelor's degree or higher.
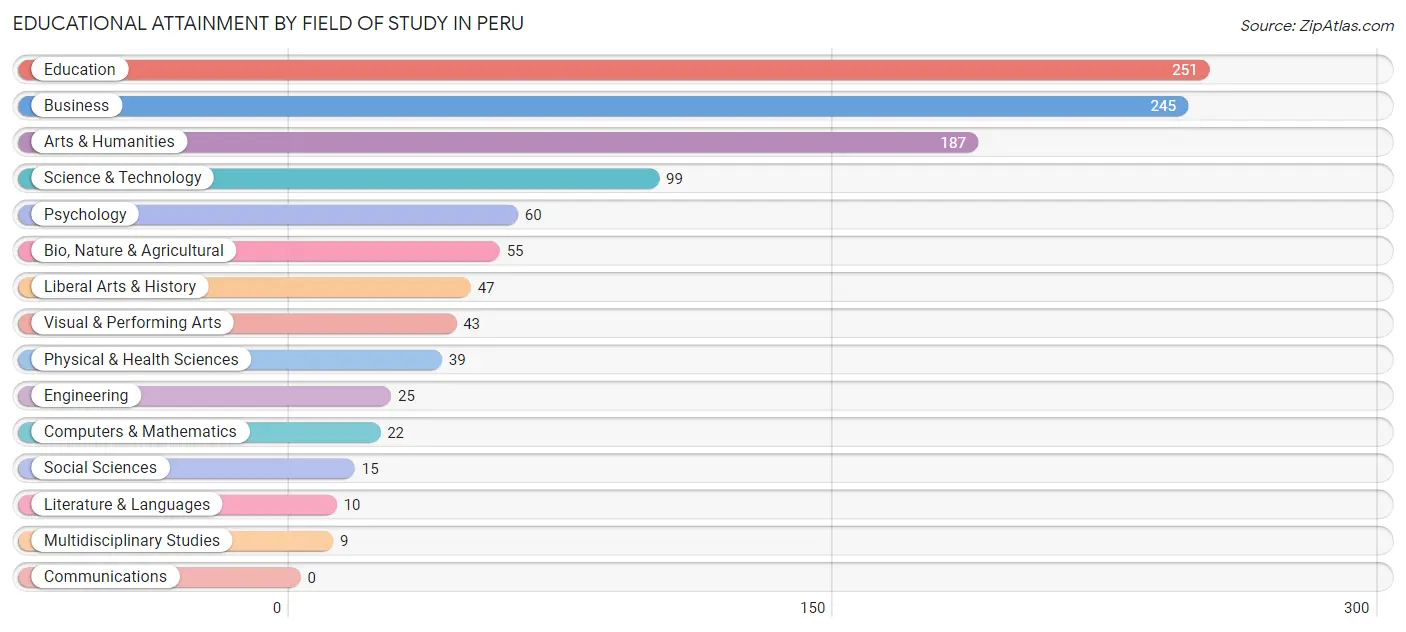
| Field of Study | # Graduates | % Graduates |
| Computers & Mathematics | 22 | 2.0% |
| Bio, Nature & Agricultural | 55 | 5.0% |
| Physical & Health Sciences | 39 | 3.5% |
| Psychology | 60 | 5.4% |
| Social Sciences | 15 | 1.4% |
| Engineering | 25 | 2.3% |
| Multidisciplinary Studies | 9 | 0.8% |
| Science & Technology | 99 | 8.9% |
| Business | 245 | 22.1% |
| Education | 251 | 22.7% |
| Literature & Languages | 10 | 0.9% |
| Liberal Arts & History | 47 | 4.3% |
| Visual & Performing Arts | 43 | 3.9% |
| Communications | 0 | 0.0% |
| Arts & Humanities | 187 | 16.9% |
| Total | 1,107 | 100.0% |
Transportation & Commute in Peru
Vehicle Availability by Sex in Peru
The most prevalent vehicle ownership categories in Peru are males with 2 vehicles (1,017, accounting for 39.4%) and females with 2 vehicles (752, making up 52.6%).
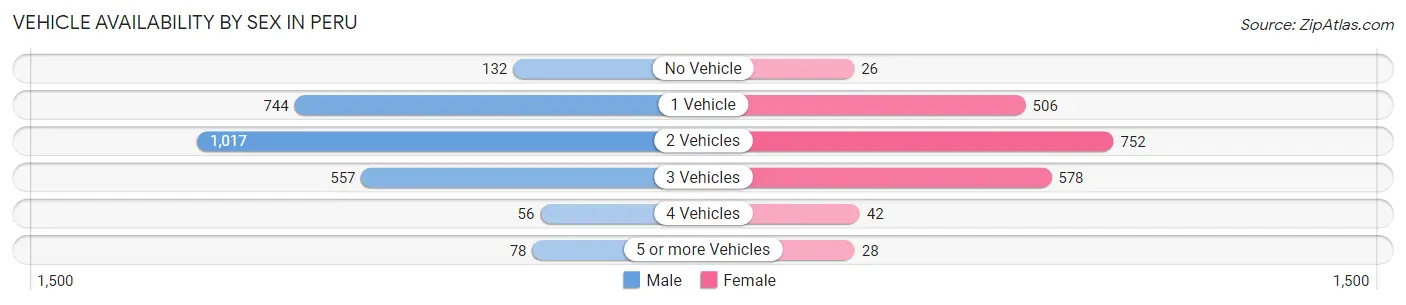
| Vehicles Available | Male | Female |
| No Vehicle | 132 (5.1%) | 26 (1.3%) |
| 1 Vehicle | 744 (28.8%) | 506 (26.2%) |
| 2 Vehicles | 1,017 (39.4%) | 752 (38.9%) |
| 3 Vehicles | 557 (21.6%) | 578 (29.9%) |
| 4 Vehicles | 56 (2.2%) | 42 (2.2%) |
| 5 or more Vehicles | 78 (3.0%) | 28 (1.5%) |
| Total | 2,584 (100.0%) | 1,932 (100.0%) |
Commute Time in Peru
The most frequently occuring commute durations in Peru are 5 to 9 minutes (743 commuters, 17.1%), 20 to 24 minutes (701 commuters, 16.2%), and 10 to 14 minutes (627 commuters, 14.4%).
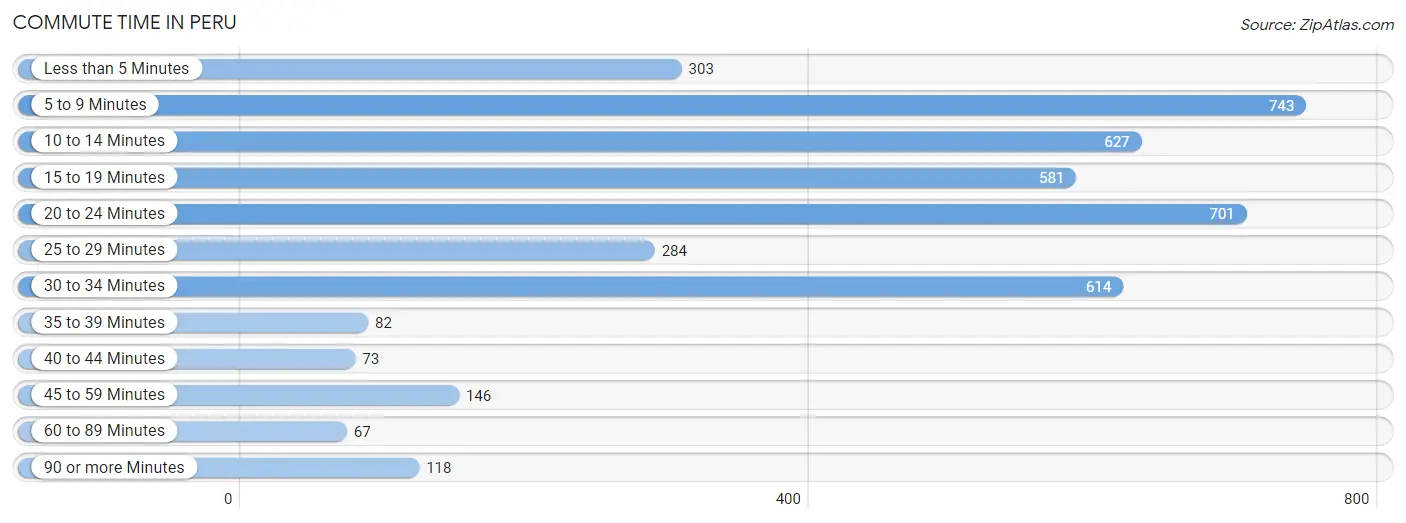
| Commute Time | # Commuters | % Commuters |
| Less than 5 Minutes | 303 | 7.0% |
| 5 to 9 Minutes | 743 | 17.1% |
| 10 to 14 Minutes | 627 | 14.4% |
| 15 to 19 Minutes | 581 | 13.4% |
| 20 to 24 Minutes | 701 | 16.2% |
| 25 to 29 Minutes | 284 | 6.6% |
| 30 to 34 Minutes | 614 | 14.1% |
| 35 to 39 Minutes | 82 | 1.9% |
| 40 to 44 Minutes | 73 | 1.7% |
| 45 to 59 Minutes | 146 | 3.4% |
| 60 to 89 Minutes | 67 | 1.5% |
| 90 or more Minutes | 118 | 2.7% |
Commute Time by Sex in Peru
The most common commute times in Peru are 30 to 34 minutes (419 commuters, 16.8%) for males and 5 to 9 minutes (409 commuters, 22.2%) for females.
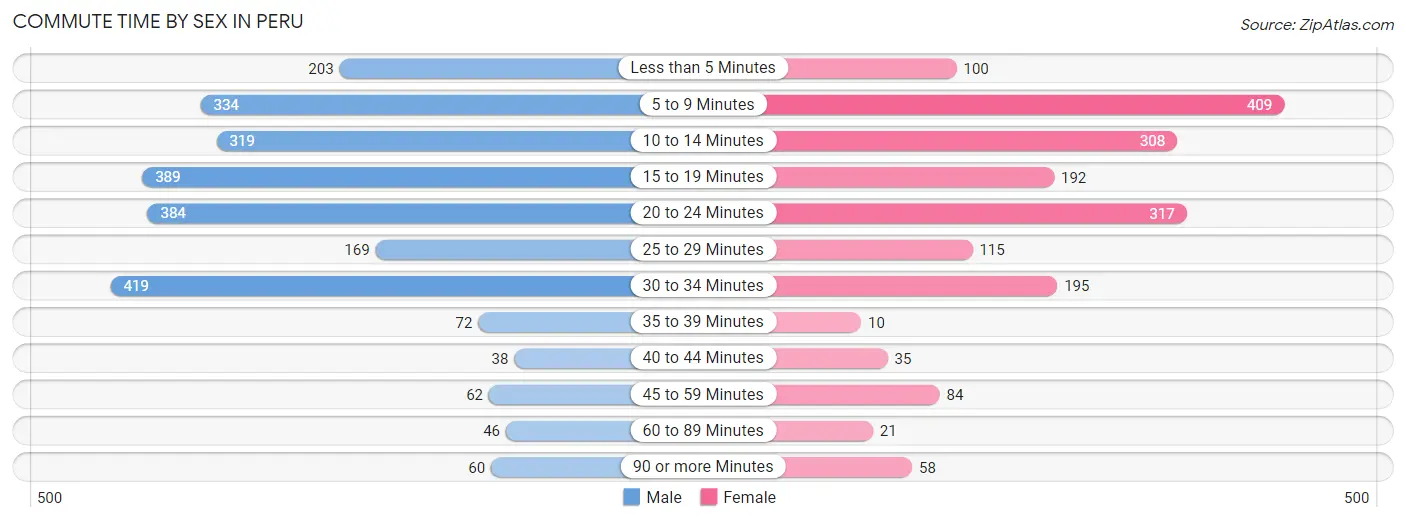
| Commute Time | Male | Female |
| Less than 5 Minutes | 203 (8.1%) | 100 (5.4%) |
| 5 to 9 Minutes | 334 (13.4%) | 409 (22.2%) |
| 10 to 14 Minutes | 319 (12.8%) | 308 (16.7%) |
| 15 to 19 Minutes | 389 (15.6%) | 192 (10.4%) |
| 20 to 24 Minutes | 384 (15.4%) | 317 (17.2%) |
| 25 to 29 Minutes | 169 (6.8%) | 115 (6.2%) |
| 30 to 34 Minutes | 419 (16.8%) | 195 (10.6%) |
| 35 to 39 Minutes | 72 (2.9%) | 10 (0.5%) |
| 40 to 44 Minutes | 38 (1.5%) | 35 (1.9%) |
| 45 to 59 Minutes | 62 (2.5%) | 84 (4.6%) |
| 60 to 89 Minutes | 46 (1.8%) | 21 (1.1%) |
| 90 or more Minutes | 60 (2.4%) | 58 (3.2%) |
Time of Departure to Work by Sex in Peru
The most frequent times of departure to work in Peru are 4:00 PM to 11:59 PM (468, 18.8%) for males and 7:30 AM to 7:59 AM (307, 16.7%) for females.
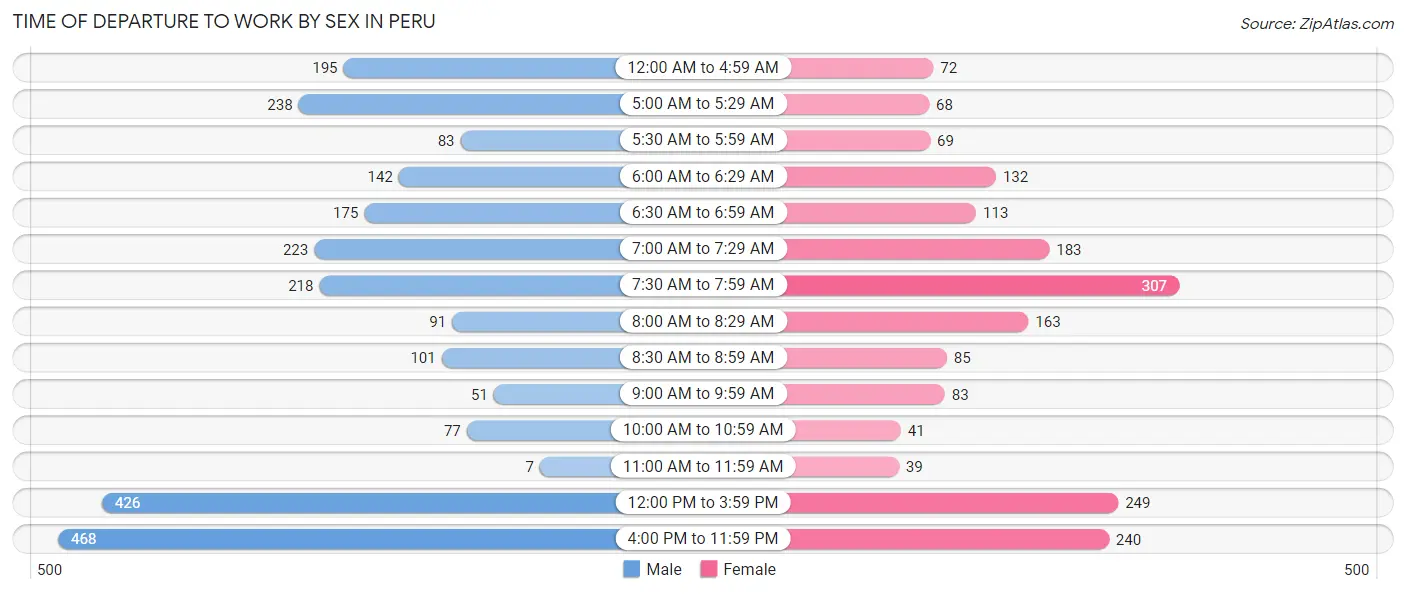
| Time of Departure | Male | Female |
| 12:00 AM to 4:59 AM | 195 (7.8%) | 72 (3.9%) |
| 5:00 AM to 5:29 AM | 238 (9.5%) | 68 (3.7%) |
| 5:30 AM to 5:59 AM | 83 (3.3%) | 69 (3.7%) |
| 6:00 AM to 6:29 AM | 142 (5.7%) | 132 (7.2%) |
| 6:30 AM to 6:59 AM | 175 (7.0%) | 113 (6.1%) |
| 7:00 AM to 7:29 AM | 223 (8.9%) | 183 (9.9%) |
| 7:30 AM to 7:59 AM | 218 (8.7%) | 307 (16.7%) |
| 8:00 AM to 8:29 AM | 91 (3.6%) | 163 (8.8%) |
| 8:30 AM to 8:59 AM | 101 (4.1%) | 85 (4.6%) |
| 9:00 AM to 9:59 AM | 51 (2.0%) | 83 (4.5%) |
| 10:00 AM to 10:59 AM | 77 (3.1%) | 41 (2.2%) |
| 11:00 AM to 11:59 AM | 7 (0.3%) | 39 (2.1%) |
| 12:00 PM to 3:59 PM | 426 (17.1%) | 249 (13.5%) |
| 4:00 PM to 11:59 PM | 468 (18.8%) | 240 (13.0%) |
| Total | 2,495 (100.0%) | 1,844 (100.0%) |
Housing Occupancy in Peru
Occupancy by Ownership in Peru
Of the total 4,411 dwellings in Peru, owner-occupied units account for 3,089 (70.0%), while renter-occupied units make up 1,322 (30.0%).
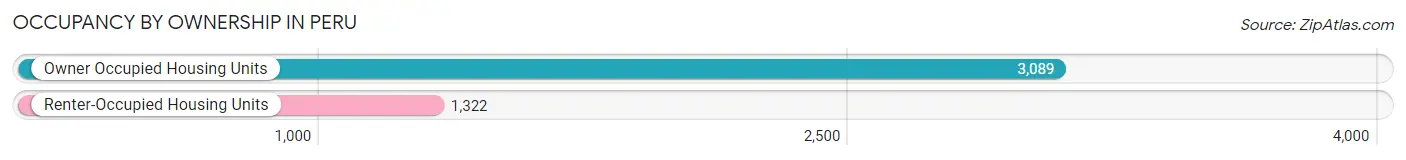
| Occupancy | # Housing Units | % Housing Units |
| Owner Occupied Housing Units | 3,089 | 70.0% |
| Renter-Occupied Housing Units | 1,322 | 30.0% |
| Total Occupied Housing Units | 4,411 | 100.0% |
Occupancy by Household Size in Peru
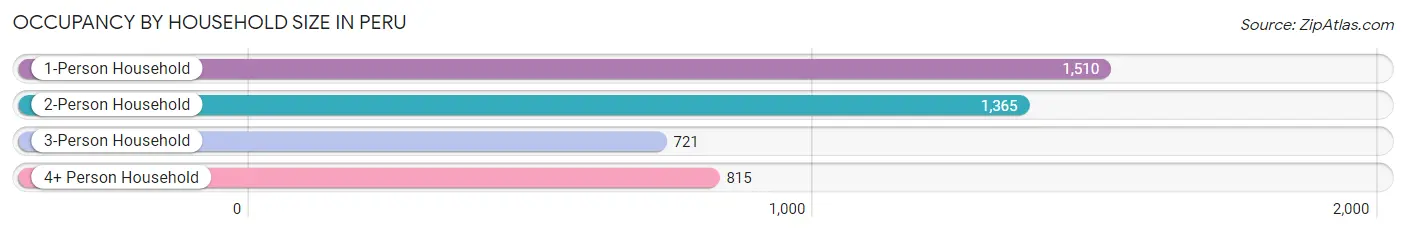
| Household Size | # Housing Units | % Housing Units |
| 1-Person Household | 1,510 | 34.2% |
| 2-Person Household | 1,365 | 30.9% |
| 3-Person Household | 721 | 16.4% |
| 4+ Person Household | 815 | 18.5% |
| Total Housing Units | 4,411 | 100.0% |
Occupancy by Ownership by Household Size in Peru
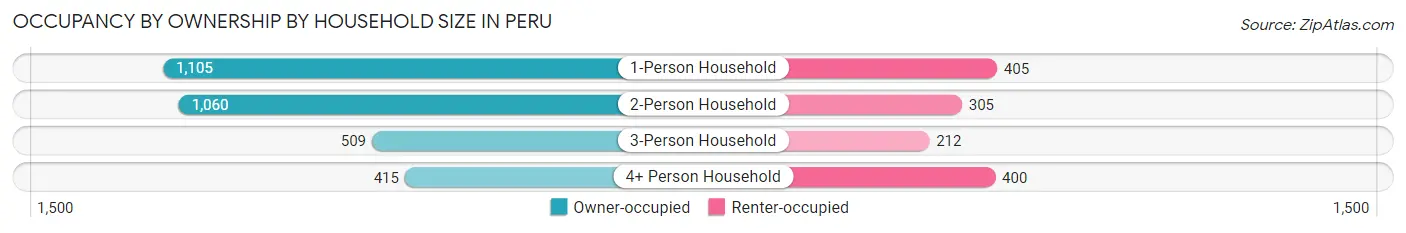
| Household Size | Owner-occupied | Renter-occupied |
| 1-Person Household | 1,105 (73.2%) | 405 (26.8%) |
| 2-Person Household | 1,060 (77.7%) | 305 (22.3%) |
| 3-Person Household | 509 (70.6%) | 212 (29.4%) |
| 4+ Person Household | 415 (50.9%) | 400 (49.1%) |
| Total Housing Units | 3,089 (70.0%) | 1,322 (30.0%) |
Occupancy by Educational Attainment in Peru
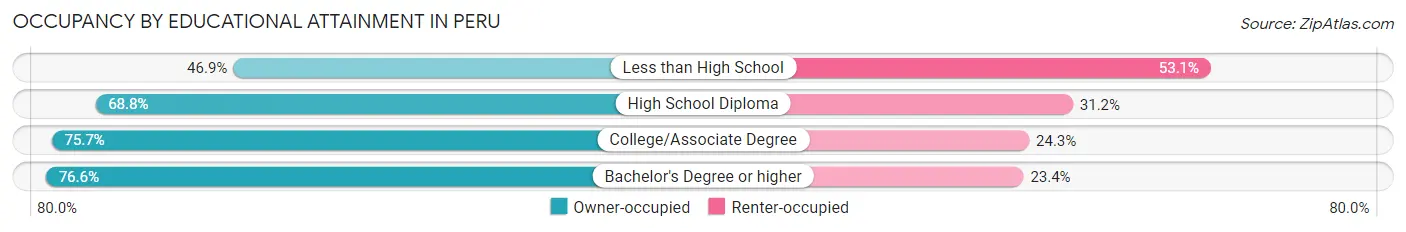
| Household Size | Owner-occupied | Renter-occupied |
| Less than High School | 236 (46.9%) | 267 (53.1%) |
| High School Diploma | 1,142 (68.8%) | 518 (31.2%) |
| College/Associate Degree | 999 (75.7%) | 320 (24.3%) |
| Bachelor's Degree or higher | 712 (76.6%) | 217 (23.4%) |
Occupancy by Age of Householder in Peru
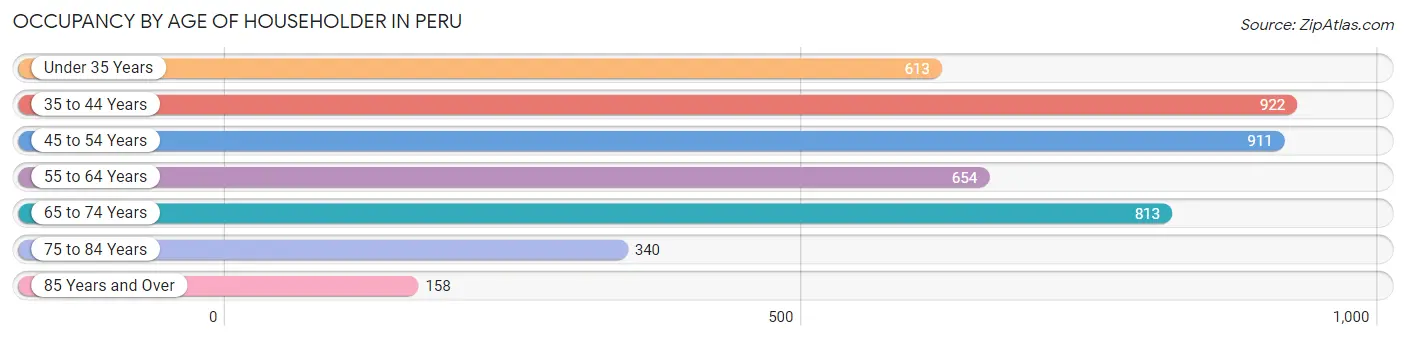
| Age Bracket | # Households | % Households |
| Under 35 Years | 613 | 13.9% |
| 35 to 44 Years | 922 | 20.9% |
| 45 to 54 Years | 911 | 20.6% |
| 55 to 64 Years | 654 | 14.8% |
| 65 to 74 Years | 813 | 18.4% |
| 75 to 84 Years | 340 | 7.7% |
| 85 Years and Over | 158 | 3.6% |
| Total | 4,411 | 100.0% |
Housing Finances in Peru
Median Income by Occupancy in Peru
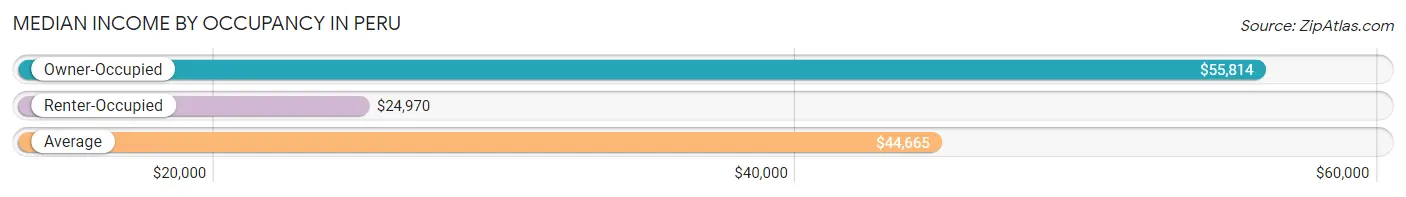
| Occupancy Type | # Households | Median Income |
| Owner-Occupied | 3,089 (70.0%) | $55,814 |
| Renter-Occupied | 1,322 (30.0%) | $24,970 |
| Average | 4,411 (100.0%) | $44,665 |
Occupancy by Householder Income Bracket in Peru
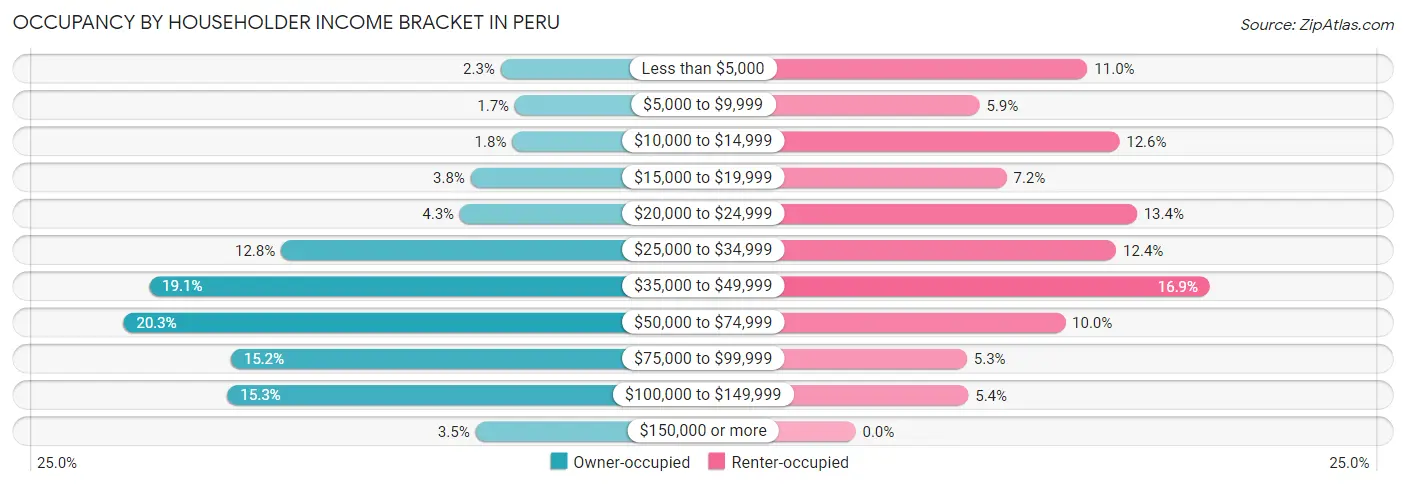
| Income Bracket | Owner-occupied | Renter-occupied |
| Less than $5,000 | 72 (2.3%) | 146 (11.0%) |
| $5,000 to $9,999 | 51 (1.7%) | 78 (5.9%) |
| $10,000 to $14,999 | 55 (1.8%) | 166 (12.6%) |
| $15,000 to $19,999 | 116 (3.8%) | 95 (7.2%) |
| $20,000 to $24,999 | 132 (4.3%) | 177 (13.4%) |
| $25,000 to $34,999 | 395 (12.8%) | 164 (12.4%) |
| $35,000 to $49,999 | 589 (19.1%) | 223 (16.9%) |
| $50,000 to $74,999 | 627 (20.3%) | 132 (10.0%) |
| $75,000 to $99,999 | 469 (15.2%) | 70 (5.3%) |
| $100,000 to $149,999 | 474 (15.3%) | 71 (5.4%) |
| $150,000 or more | 109 (3.5%) | 0 (0.0%) |
| Total | 3,089 (100.0%) | 1,322 (100.0%) |
Monthly Housing Cost Tiers in Peru
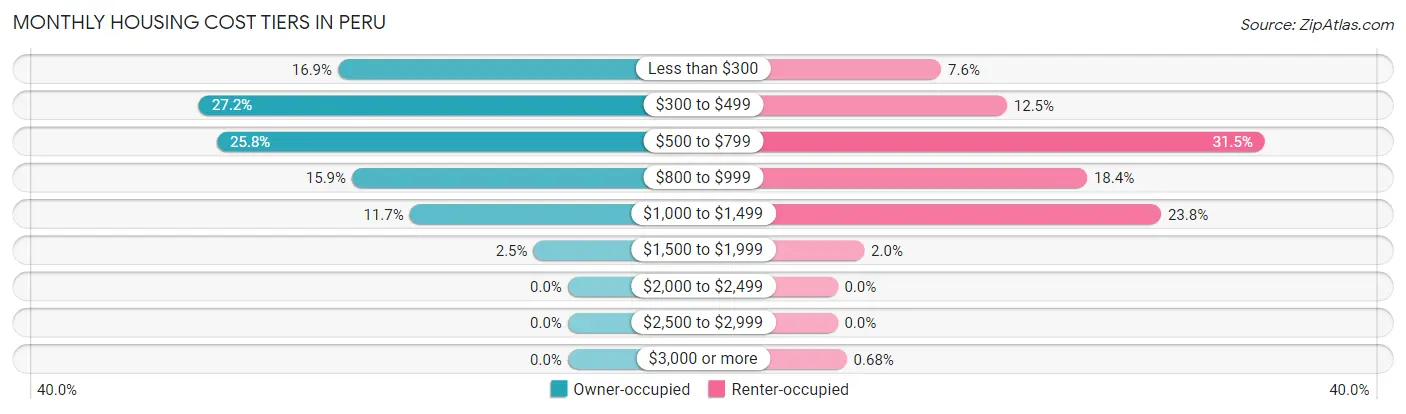
| Monthly Cost | Owner-occupied | Renter-occupied |
| Less than $300 | 523 (16.9%) | 101 (7.6%) |
| $300 to $499 | 839 (27.2%) | 165 (12.5%) |
| $500 to $799 | 798 (25.8%) | 416 (31.5%) |
| $800 to $999 | 491 (15.9%) | 243 (18.4%) |
| $1,000 to $1,499 | 360 (11.7%) | 315 (23.8%) |
| $1,500 to $1,999 | 78 (2.5%) | 26 (2.0%) |
| $2,000 to $2,499 | 0 (0.0%) | 0 (0.0%) |
| $2,500 to $2,999 | 0 (0.0%) | 0 (0.0%) |
| $3,000 or more | 0 (0.0%) | 9 (0.7%) |
| Total | 3,089 (100.0%) | 1,322 (100.0%) |
Physical Housing Characteristics in Peru
Housing Structures in Peru
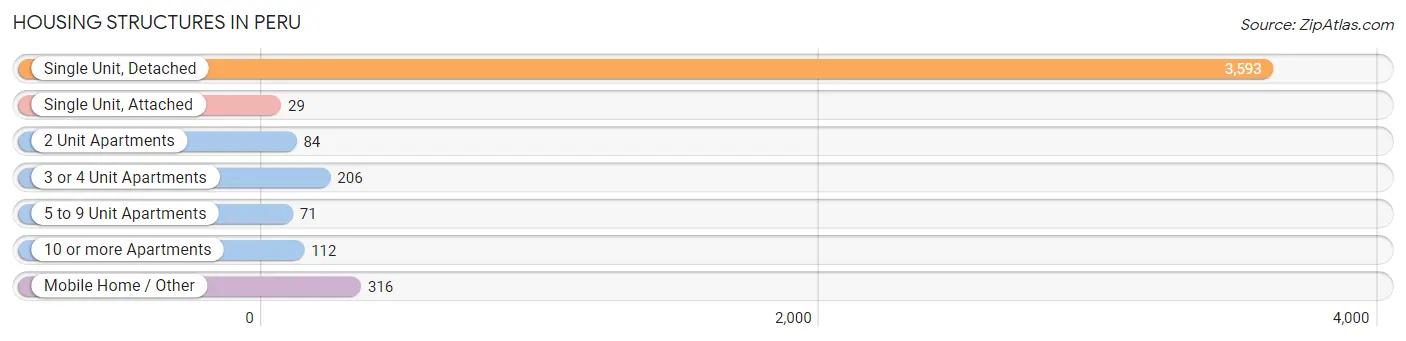
| Structure Type | # Housing Units | % Housing Units |
| Single Unit, Detached | 3,593 | 81.5% |
| Single Unit, Attached | 29 | 0.7% |
| 2 Unit Apartments | 84 | 1.9% |
| 3 or 4 Unit Apartments | 206 | 4.7% |
| 5 to 9 Unit Apartments | 71 | 1.6% |
| 10 or more Apartments | 112 | 2.5% |
| Mobile Home / Other | 316 | 7.2% |
| Total | 4,411 | 100.0% |
Housing Structures by Occupancy in Peru
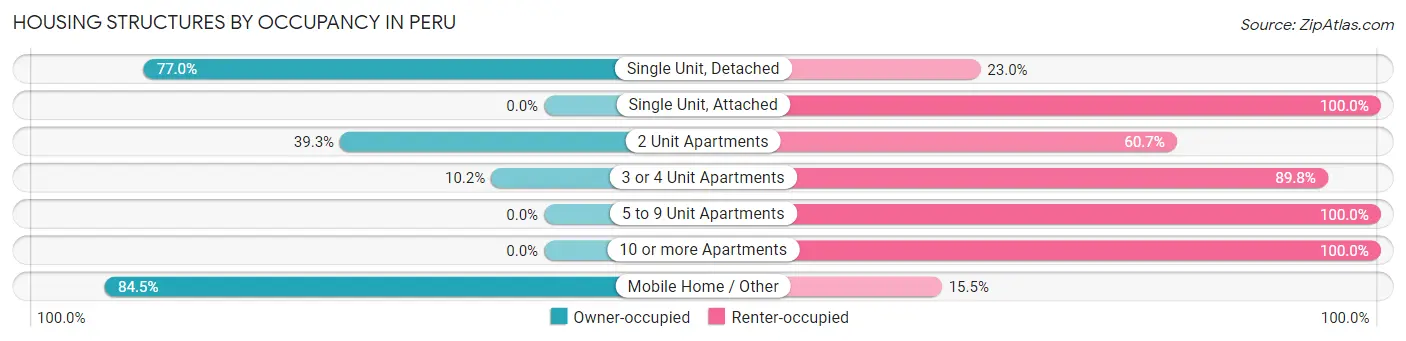
| Structure Type | Owner-occupied | Renter-occupied |
| Single Unit, Detached | 2,768 (77.0%) | 825 (23.0%) |
| Single Unit, Attached | 0 (0.0%) | 29 (100.0%) |
| 2 Unit Apartments | 33 (39.3%) | 51 (60.7%) |
| 3 or 4 Unit Apartments | 21 (10.2%) | 185 (89.8%) |
| 5 to 9 Unit Apartments | 0 (0.0%) | 71 (100.0%) |
| 10 or more Apartments | 0 (0.0%) | 112 (100.0%) |
| Mobile Home / Other | 267 (84.5%) | 49 (15.5%) |
| Total | 3,089 (70.0%) | 1,322 (30.0%) |
Housing Structures by Number of Rooms in Peru
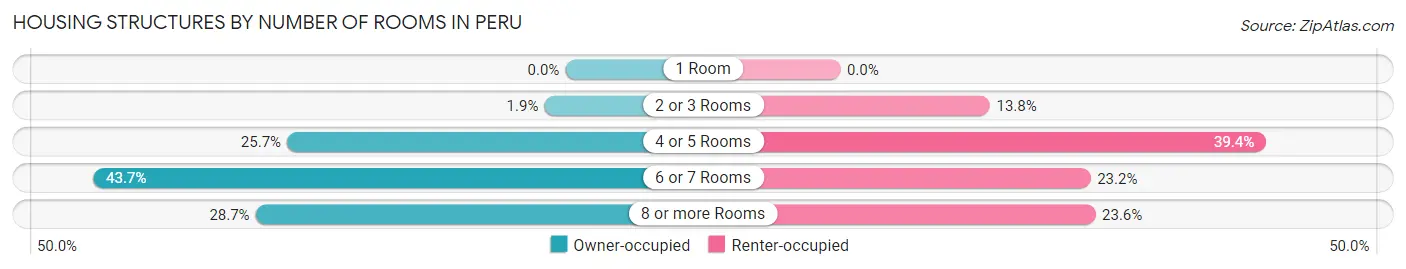
| Number of Rooms | Owner-occupied | Renter-occupied |
| 1 Room | 0 (0.0%) | 0 (0.0%) |
| 2 or 3 Rooms | 60 (1.9%) | 183 (13.8%) |
| 4 or 5 Rooms | 795 (25.7%) | 521 (39.4%) |
| 6 or 7 Rooms | 1,349 (43.7%) | 306 (23.2%) |
| 8 or more Rooms | 885 (28.6%) | 312 (23.6%) |
| Total | 3,089 (100.0%) | 1,322 (100.0%) |
Housing Structure by Heating Type in Peru
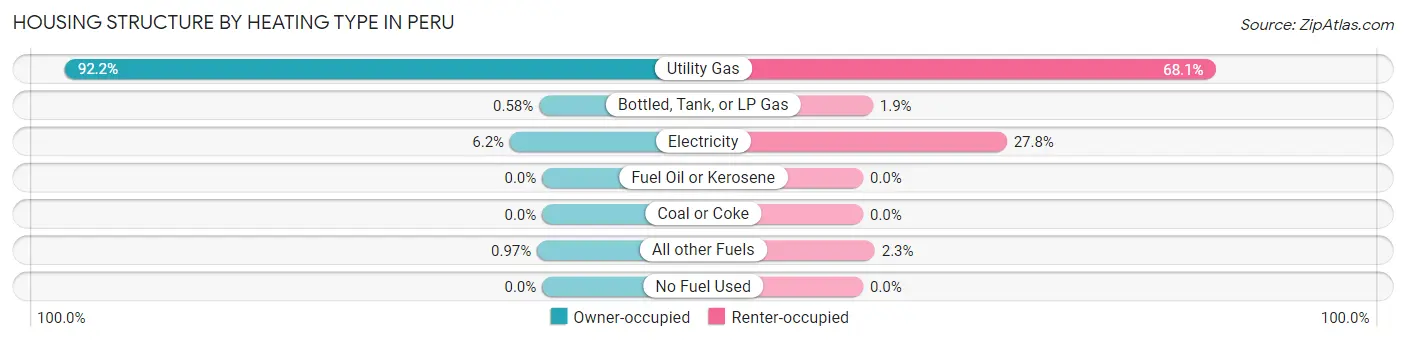
| Heating Type | Owner-occupied | Renter-occupied |
| Utility Gas | 2,849 (92.2%) | 900 (68.1%) |
| Bottled, Tank, or LP Gas | 18 (0.6%) | 25 (1.9%) |
| Electricity | 192 (6.2%) | 367 (27.8%) |
| Fuel Oil or Kerosene | 0 (0.0%) | 0 (0.0%) |
| Coal or Coke | 0 (0.0%) | 0 (0.0%) |
| All other Fuels | 30 (1.0%) | 30 (2.3%) |
| No Fuel Used | 0 (0.0%) | 0 (0.0%) |
| Total | 3,089 (100.0%) | 1,322 (100.0%) |
Household Vehicle Usage in Peru
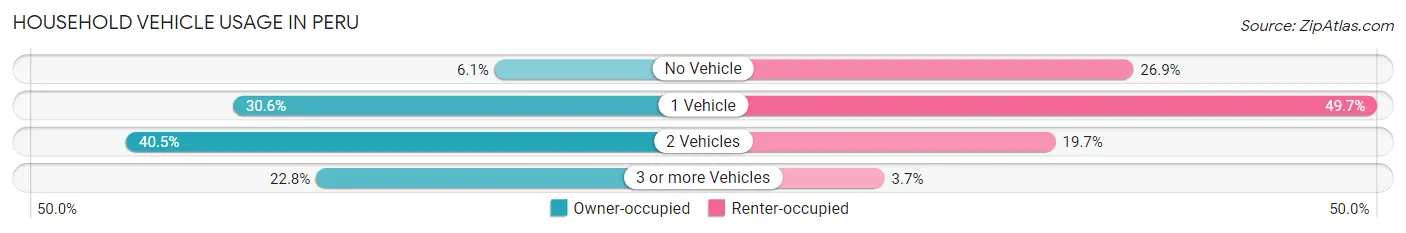
| Vehicles per Household | Owner-occupied | Renter-occupied |
| No Vehicle | 189 (6.1%) | 356 (26.9%) |
| 1 Vehicle | 944 (30.6%) | 657 (49.7%) |
| 2 Vehicles | 1,252 (40.5%) | 260 (19.7%) |
| 3 or more Vehicles | 704 (22.8%) | 49 (3.7%) |
| Total | 3,089 (100.0%) | 1,322 (100.0%) |
Real Estate & Mortgages in Peru
Real Estate and Mortgage Overview in Peru
| Characteristic | Without Mortgage | With Mortgage |
| Housing Units | 1,594 | 1,495 |
| Median Property Value | $69,000 | $89,900 |
| Median Household Income | $44,665 | $106 |
| Monthly Housing Costs | $381 | $0 |
| Real Estate Taxes | $470 | $87 |
Property Value by Mortgage Status in Peru
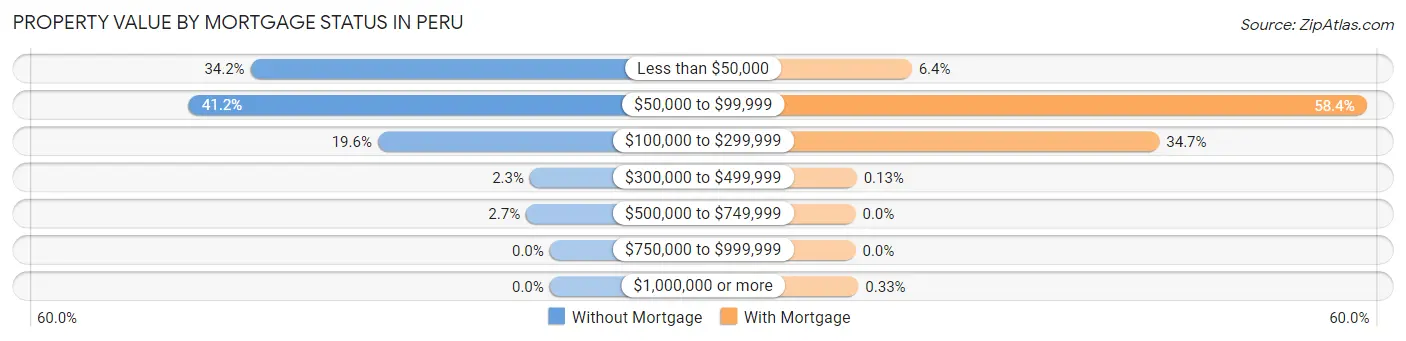
| Property Value | Without Mortgage | With Mortgage |
| Less than $50,000 | 545 (34.2%) | 96 (6.4%) |
| $50,000 to $99,999 | 657 (41.2%) | 873 (58.4%) |
| $100,000 to $299,999 | 313 (19.6%) | 519 (34.7%) |
| $300,000 to $499,999 | 36 (2.3%) | 2 (0.1%) |
| $500,000 to $749,999 | 43 (2.7%) | 0 (0.0%) |
| $750,000 to $999,999 | 0 (0.0%) | 0 (0.0%) |
| $1,000,000 or more | 0 (0.0%) | 5 (0.3%) |
| Total | 1,594 (100.0%) | 1,495 (100.0%) |
Household Income by Mortgage Status in Peru
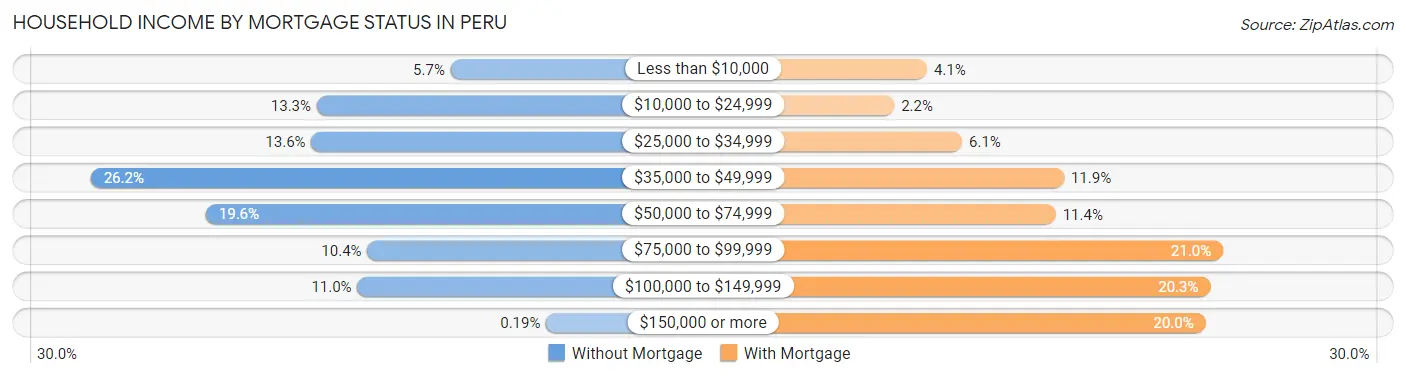
| Household Income | Without Mortgage | With Mortgage |
| Less than $10,000 | 90 (5.7%) | 61 (4.1%) |
| $10,000 to $24,999 | 212 (13.3%) | 33 (2.2%) |
| $25,000 to $34,999 | 217 (13.6%) | 91 (6.1%) |
| $35,000 to $49,999 | 418 (26.2%) | 178 (11.9%) |
| $50,000 to $74,999 | 313 (19.6%) | 171 (11.4%) |
| $75,000 to $99,999 | 166 (10.4%) | 314 (21.0%) |
| $100,000 to $149,999 | 175 (11.0%) | 303 (20.3%) |
| $150,000 or more | 3 (0.2%) | 299 (20.0%) |
| Total | 1,594 (100.0%) | 1,495 (100.0%) |
Property Value to Household Income Ratio in Peru
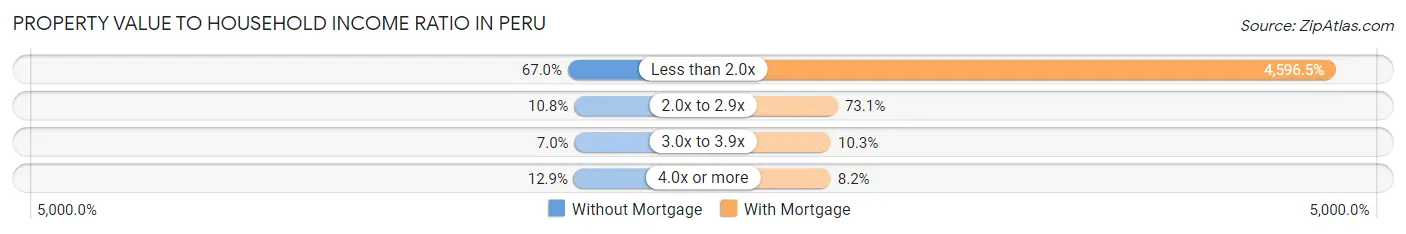
| Value-to-Income Ratio | Without Mortgage | With Mortgage |
| Less than 2.0x | 1,068 (67.0%) | 68,717 (4,596.5%) |
| 2.0x to 2.9x | 172 (10.8%) | 1,093 (73.1%) |
| 3.0x to 3.9x | 111 (7.0%) | 154 (10.3%) |
| 4.0x or more | 205 (12.9%) | 122 (8.2%) |
| Total | 1,594 (100.0%) | 1,495 (100.0%) |
Real Estate Taxes by Mortgage Status in Peru
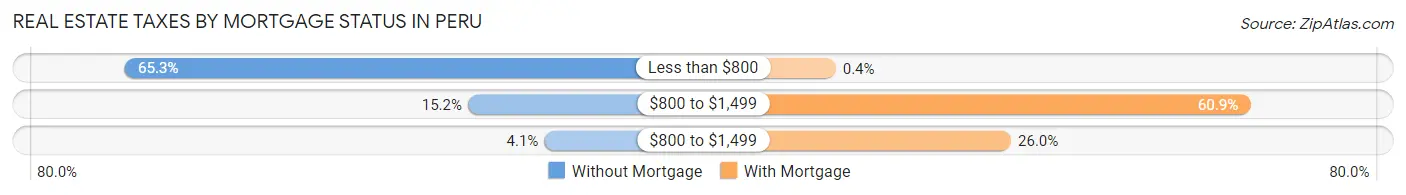
| Property Taxes | Without Mortgage | With Mortgage |
| Less than $800 | 1,041 (65.3%) | 6 (0.4%) |
| $800 to $1,499 | 243 (15.2%) | 911 (60.9%) |
| $800 to $1,499 | 65 (4.1%) | 389 (26.0%) |
| Total | 1,594 (100.0%) | 1,495 (100.0%) |
Health & Disability in Peru
Health Insurance Coverage by Age in Peru
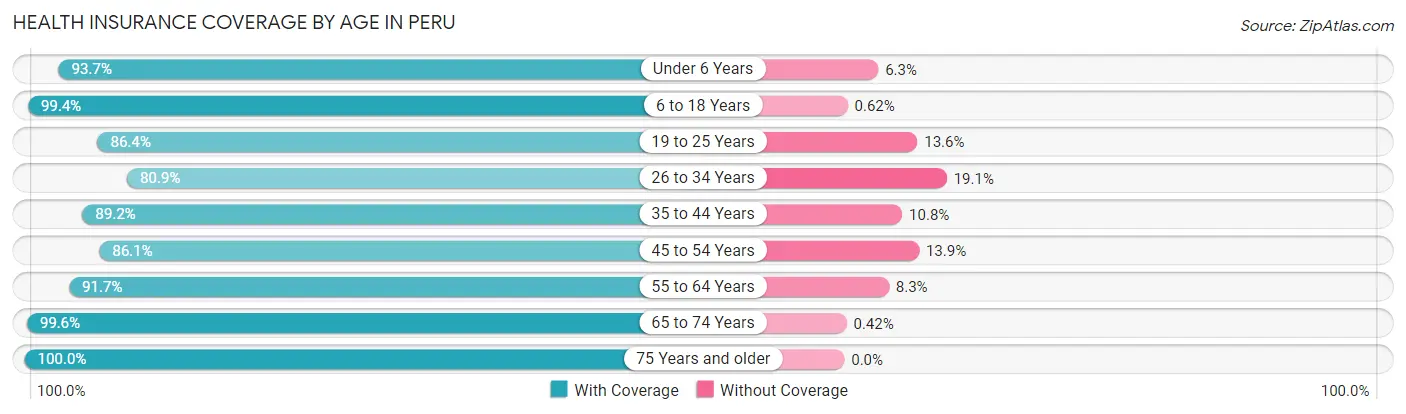
| Age Bracket | With Coverage | Without Coverage |
| Under 6 Years | 533 (93.7%) | 36 (6.3%) |
| 6 to 18 Years | 1,919 (99.4%) | 12 (0.6%) |
| 19 to 25 Years | 882 (86.4%) | 139 (13.6%) |
| 26 to 34 Years | 775 (80.9%) | 183 (19.1%) |
| 35 to 44 Years | 1,347 (89.2%) | 163 (10.8%) |
| 45 to 54 Years | 1,421 (86.1%) | 230 (13.9%) |
| 55 to 64 Years | 1,158 (91.7%) | 105 (8.3%) |
| 65 to 74 Years | 1,191 (99.6%) | 5 (0.4%) |
| 75 Years and older | 640 (100.0%) | 0 (0.0%) |
| Total | 9,866 (91.9%) | 873 (8.1%) |
Health Insurance Coverage by Citizenship Status in Peru
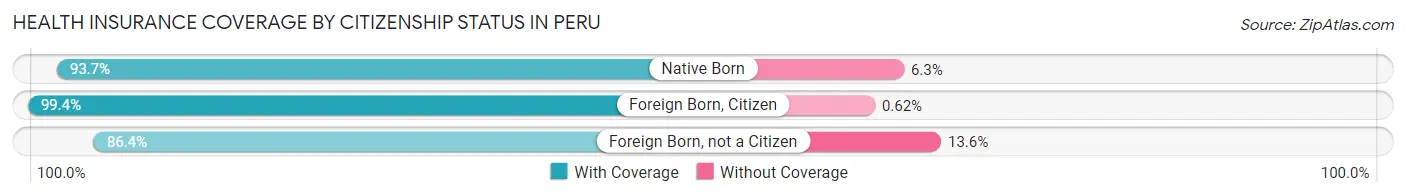
| Citizenship Status | With Coverage | Without Coverage |
| Native Born | 533 (93.7%) | 36 (6.3%) |
| Foreign Born, Citizen | 1,919 (99.4%) | 12 (0.6%) |
| Foreign Born, not a Citizen | 882 (86.4%) | 139 (13.6%) |
Health Insurance Coverage by Household Income in Peru
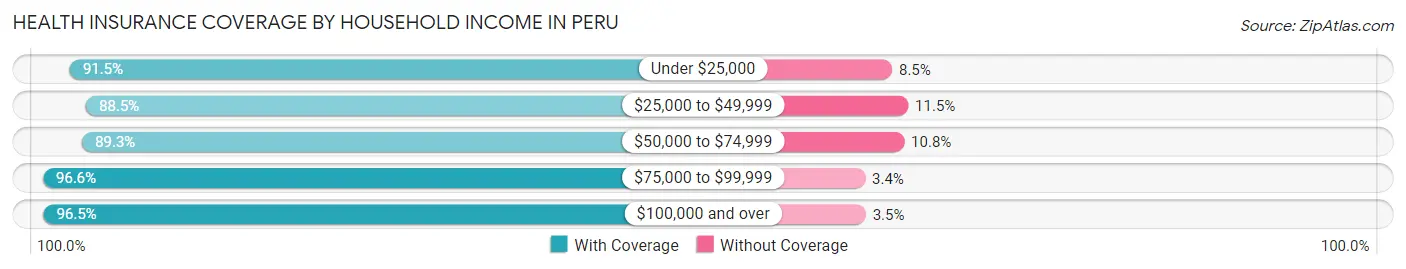
| Household Income | With Coverage | Without Coverage |
| Under $25,000 | 2,245 (91.5%) | 208 (8.5%) |
| $25,000 to $49,999 | 2,462 (88.5%) | 320 (11.5%) |
| $50,000 to $74,999 | 1,885 (89.2%) | 227 (10.7%) |
| $75,000 to $99,999 | 1,463 (96.6%) | 52 (3.4%) |
| $100,000 and over | 1,801 (96.5%) | 66 (3.5%) |
Public vs Private Health Insurance Coverage by Age in Peru
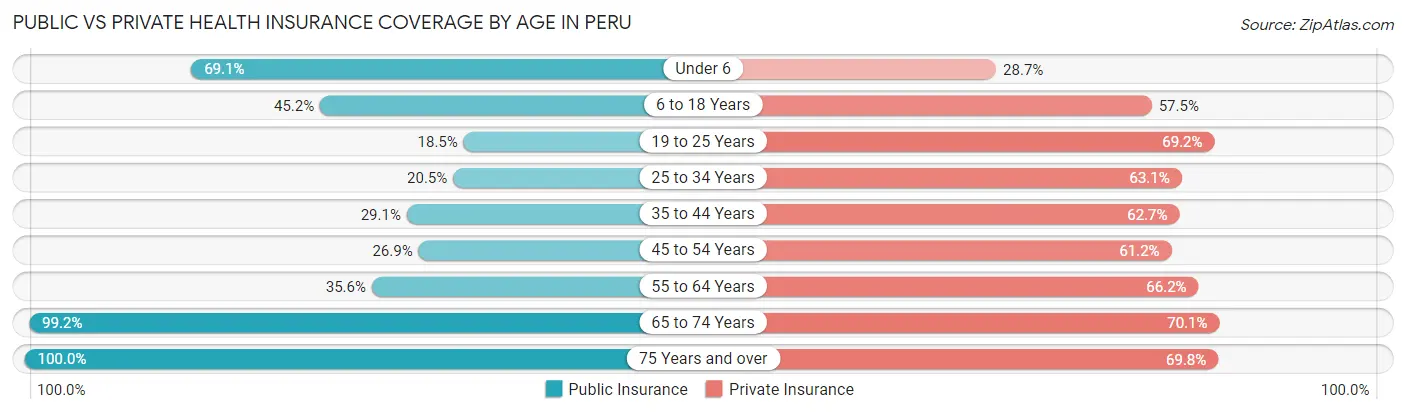
| Age Bracket | Public Insurance | Private Insurance |
| Under 6 | 393 (69.1%) | 163 (28.6%) |
| 6 to 18 Years | 872 (45.2%) | 1,111 (57.5%) |
| 19 to 25 Years | 189 (18.5%) | 706 (69.2%) |
| 25 to 34 Years | 196 (20.5%) | 604 (63.0%) |
| 35 to 44 Years | 439 (29.1%) | 946 (62.6%) |
| 45 to 54 Years | 444 (26.9%) | 1,010 (61.2%) |
| 55 to 64 Years | 449 (35.5%) | 836 (66.2%) |
| 65 to 74 Years | 1,186 (99.2%) | 838 (70.1%) |
| 75 Years and over | 640 (100.0%) | 447 (69.8%) |
| Total | 4,808 (44.8%) | 6,661 (62.0%) |
Disability Status by Sex by Age in Peru
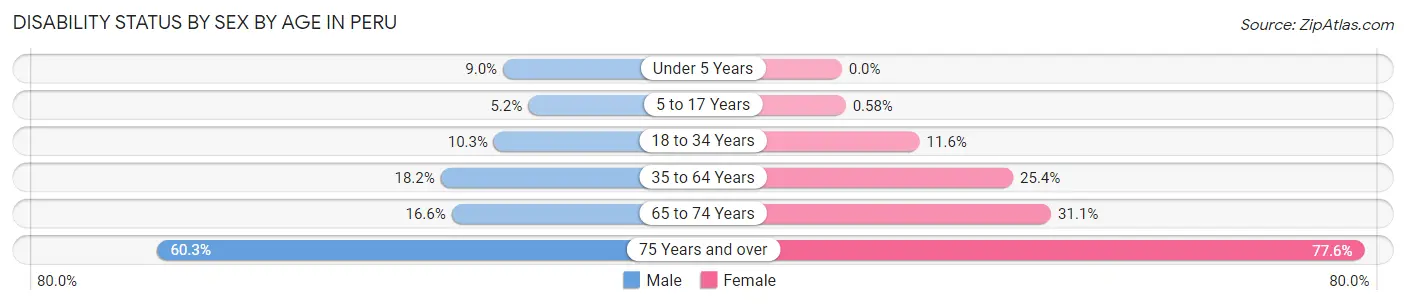
| Age Bracket | Male | Female |
| Under 5 Years | 21 (9.0%) | 0 (0.0%) |
| 5 to 17 Years | 59 (5.2%) | 5 (0.6%) |
| 18 to 34 Years | 115 (10.3%) | 108 (11.6%) |
| 35 to 64 Years | 407 (18.2%) | 558 (25.4%) |
| 65 to 74 Years | 80 (16.6%) | 222 (31.1%) |
| 75 Years and over | 141 (60.3%) | 315 (77.6%) |
Disability Class by Sex by Age in Peru
Disability Class: Hearing Difficulty
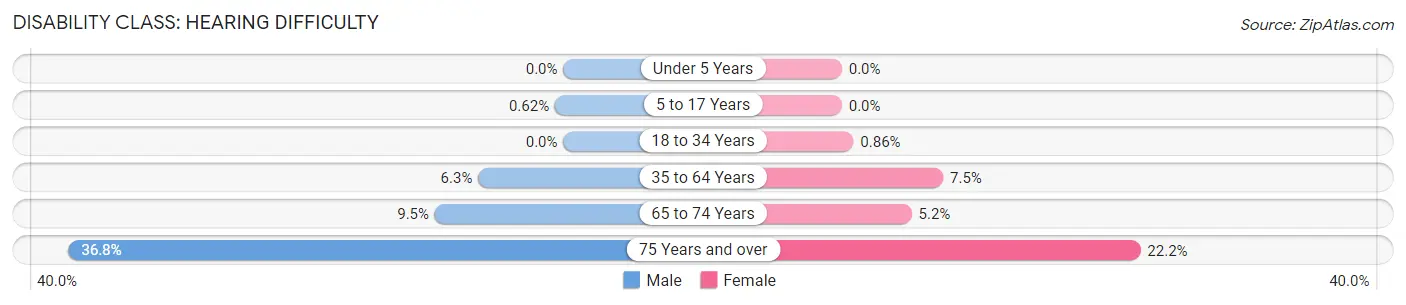
| Age Bracket | Male | Female |
| Under 5 Years | 0 (0.0%) | 0 (0.0%) |
| 5 to 17 Years | 7 (0.6%) | 0 (0.0%) |
| 18 to 34 Years | 0 (0.0%) | 8 (0.9%) |
| 35 to 64 Years | 141 (6.3%) | 165 (7.5%) |
| 65 to 74 Years | 46 (9.5%) | 37 (5.2%) |
| 75 Years and over | 86 (36.7%) | 90 (22.2%) |
Disability Class: Vision Difficulty
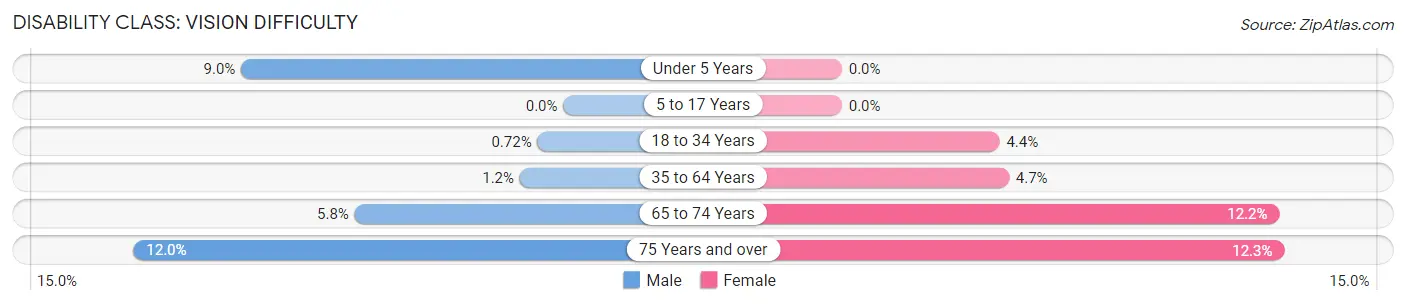
| Age Bracket | Male | Female |
| Under 5 Years | 21 (9.0%) | 0 (0.0%) |
| 5 to 17 Years | 0 (0.0%) | 0 (0.0%) |
| 18 to 34 Years | 8 (0.7%) | 41 (4.4%) |
| 35 to 64 Years | 27 (1.2%) | 102 (4.6%) |
| 65 to 74 Years | 28 (5.8%) | 87 (12.2%) |
| 75 Years and over | 28 (12.0%) | 50 (12.3%) |
Disability Class: Cognitive Difficulty
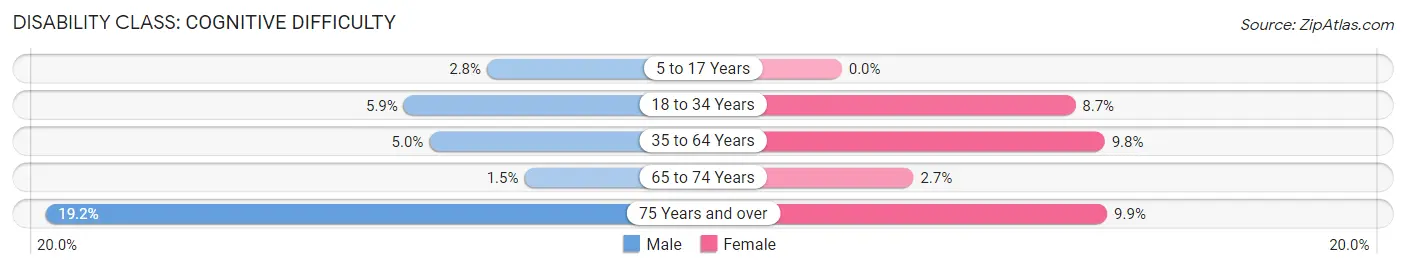
| Age Bracket | Male | Female |
| 5 to 17 Years | 32 (2.8%) | 0 (0.0%) |
| 18 to 34 Years | 66 (5.9%) | 81 (8.7%) |
| 35 to 64 Years | 111 (5.0%) | 214 (9.8%) |
| 65 to 74 Years | 7 (1.5%) | 19 (2.7%) |
| 75 Years and over | 45 (19.2%) | 40 (9.9%) |
Disability Class: Ambulatory Difficulty
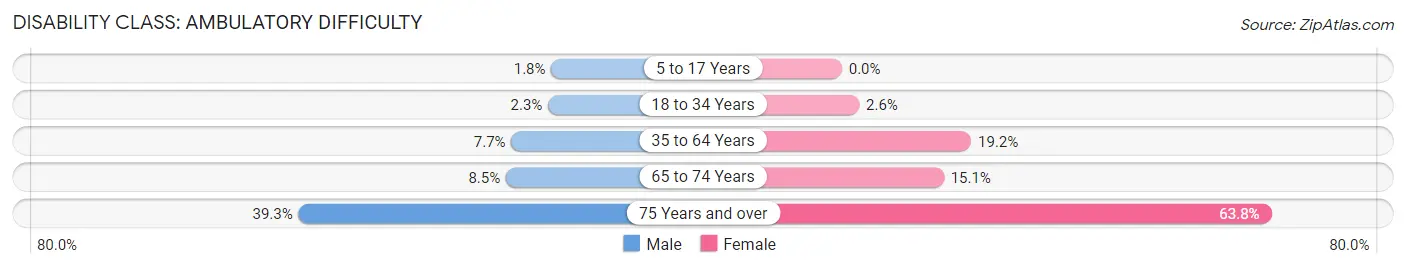
| Age Bracket | Male | Female |
| 5 to 17 Years | 20 (1.8%) | 0 (0.0%) |
| 18 to 34 Years | 25 (2.2%) | 24 (2.6%) |
| 35 to 64 Years | 172 (7.7%) | 421 (19.2%) |
| 65 to 74 Years | 41 (8.5%) | 108 (15.1%) |
| 75 Years and over | 92 (39.3%) | 259 (63.8%) |
Disability Class: Self-Care Difficulty
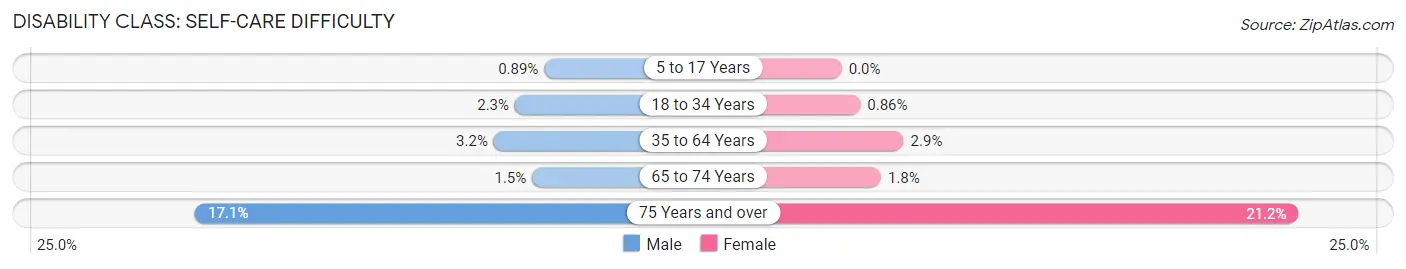
| Age Bracket | Male | Female |
| 5 to 17 Years | 10 (0.9%) | 0 (0.0%) |
| 18 to 34 Years | 25 (2.2%) | 8 (0.9%) |
| 35 to 64 Years | 72 (3.2%) | 63 (2.9%) |
| 65 to 74 Years | 7 (1.5%) | 13 (1.8%) |
| 75 Years and over | 40 (17.1%) | 86 (21.2%) |
Technology Access in Peru
Computing Device Access in Peru
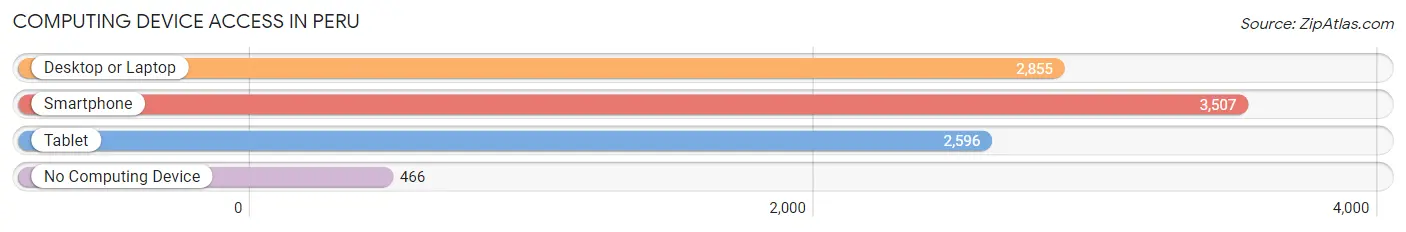
| Device Type | # Households | % Households |
| Desktop or Laptop | 2,855 | 64.7% |
| Smartphone | 3,507 | 79.5% |
| Tablet | 2,596 | 58.9% |
| No Computing Device | 466 | 10.6% |
| Total | 4,411 | 100.0% |
Internet Access in Peru
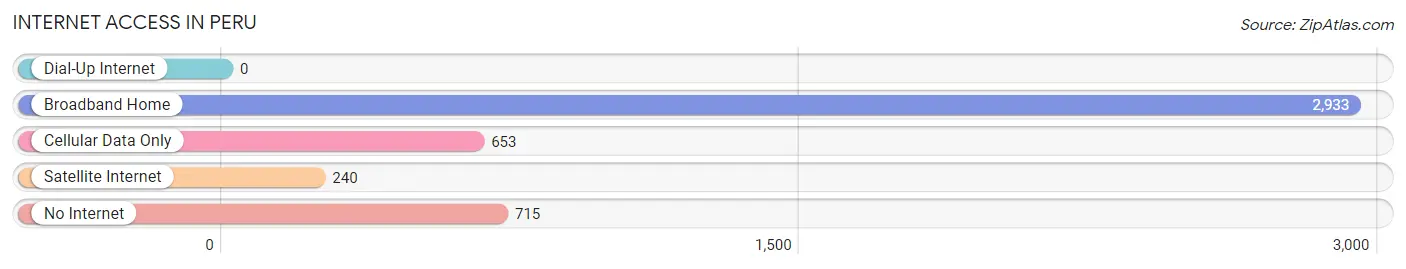
| Internet Type | # Households | % Households |
| Dial-Up Internet | 0 | 0.0% |
| Broadband Home | 2,933 | 66.5% |
| Cellular Data Only | 653 | 14.8% |
| Satellite Internet | 240 | 5.4% |
| No Internet | 715 | 16.2% |
| Total | 4,411 | 100.0% |
Peru Summary
Peru, Indiana is a city located in Miami County, Indiana, United States. It is the county seat of Miami County and is located along the Wabash River. The population was 11,417 at the 2010 census, making it the most populous city in Miami County.
Geography
Peru is located at 40°45'17" North, 86°6'15" West (40.754722, -86.104167). According to the 2010 census, Peru has a total area of 5.9 square miles (15.3 km2), of which 5.8 square miles (15.1 km2) is land and 0.1 square miles (0.2 km2) is water.
History
Peru was founded in 1834 by William N. Hood, who named it after the country of Peru in South America. The town was platted in 1835 and incorporated in 1837. The first post office in Peru was established in 1837.
The Wabash and Erie Canal was built through Peru in the 1840s, and the town became a major shipping point for agricultural products. The canal was abandoned in the 1880s, and the railroads replaced it as the main transportation route.
The Peru Circus was founded in Peru in 1884 by five local businessmen. The circus was a major success and toured the United States and Europe for many years.
Economy
Peru is a major industrial center in the region. The city is home to several large manufacturing companies, including DaimlerChrysler, which has a large truck assembly plant in the city. Other major employers include the Peru Foundry, the Peru Paper Mill, and the Peru Plastics Company.
The city is also home to several retail stores, including Walmart, Kmart, and several local businesses.
Demographics
As of the 2010 census, there were 11,417 people, 4,717 households, and 2,945 families residing in the city. The population density was 1,964.3 people per square mile (756.3/km2). There were 5,093 housing units at an average density of 872.3 per square mile (337.2/km2). The racial makeup of the city was 92.2% White, 0.7% African American, 0.4% Native American, 0.7% Asian, 0.1% Pacific Islander, 4.2% from other races, and 1.7% from two or more races. Hispanic or Latino of any race were 8.2% of the population.
There were 4,717 households, out of which 28.2% had children under the age of 18 living with them, 43.2% were married couples living together, 14.2% had a female householder with no husband present, and 37.2% were non-families. 32.2% of all households were made up of individuals, and 14.2% had someone living alone who was 65 years of age or older. The average household size was 2.37 and the average family size was 2.97.
In the city, the population was spread out, with 24.2% under the age of 18, 8.7% from 18 to 24, 27.2% from 25 to 44, 22.3% from 45 to 64, and 17.6% who were 65 years of age or older. The median age was 38 years. For every 100 females, there were 91.2 males. For every 100 females age 18 and over, there were 87.2 males.
The median income for a household in the city was $33,917, and the median income for a family was $41,917. Males had a median income of $31,917 versus $22,917 for females. The per capita income for the city was $17,917. About 9.2% of families and 11.2% of the population were below the poverty line, including 15.2% of those under age 18 and 8.2% of those age 65 or over.
Common Questions
What is the Total Population of Peru?
Total Population of Peru is 10,862.
What is the Total Male Population of Peru?
Total Male Population of Peru is 5,467.
What is the Total Female Population of Peru?
Total Female Population of Peru is 5,395.
What is the Ratio of Males per 100 Females in Peru?
There are 101.33 Males per 100 Females in Peru.
What is the Ratio of Females per 100 Males in Peru?
There are 98.68 Females per 100 Males in Peru.
What is the Median Population Age in Peru?
Median Population Age in Peru is 41.3 Years.
What is the Average Family Size in Peru
Average Family Size in Peru is 3.1 People.
What is the Average Household Size in Peru
Average Household Size in Peru is 2.4 People.
What is Per Capita Income in Peru?
Per Capita income in Peru is $23,913.
What is the Median Family Income in Peru?
Median Family Income in Peru is $54,479.
What is the Median Household income in Peru?
Median Household Income in Peru is $44,665.
What is Income or Wage Gap in Peru?
Income or Wage Gap in Peru is 2.4%.
Women in Peru earn 97.6 cents for every dollar earned by a man.
What is Family Income Deficit in Peru?
Family Income Deficit in Peru is $13,512.
Families that are below poverty line in Peru earn $13,512 less on average than the poverty threshold level.
What is Inequality or Gini Index in Peru?
Inequality or Gini Index in Peru is 0.41.
How Large is the Labor Force in Peru?
There are 5,037 People in the Labor Forcein in Peru.
What is the Percentage of People in the Labor Force in Peru?
57.6% of People are in the Labor Force in Peru.
What is the Unemployment Rate in Peru?
Unemployment Rate in Peru is 6.4%.