Hidden Valley, IN
Hidden Valley Map
Hidden Valley Overview
5,560
TOTAL POPULATION
2,649
MALE POPULATION
2,911
FEMALE POPULATION
91.00
MALES / 100 FEMALES
109.89
FEMALES / 100 MALES
39.6
MEDIAN AGE
3.2
AVG FAMILY SIZE
3.0
AVG HOUSEHOLD SIZE
$40,562
PER CAPITA INCOME
$116,094
AVG FAMILY INCOME
$112,500
AVG HOUSEHOLD INCOME
23.7%
WAGE / INCOME GAP [ % ]
76.3¢/ $1
WAGE / INCOME GAP [ $ ]
0.32
INEQUALITY / GINI INDEX
2,932
LABOR FORCE [ PEOPLE ]
66.7%
PERCENT IN LABOR FORCE
1.0%
UNEMPLOYMENT RATE
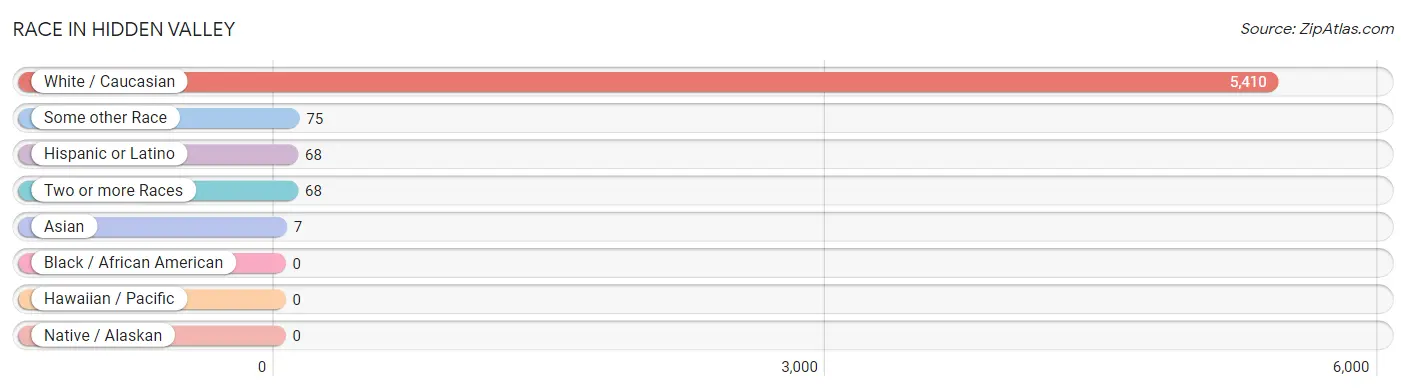
Race in Hidden Valley
The most populous races in Hidden Valley are White / Caucasian (5,410 | 97.3%), Some other Race (75 | 1.3%), and Hispanic or Latino (68 | 1.2%).
| Race | # Population | % Population |
| Asian | 7 | 0.1% |
| Black / African American | 0 | 0.0% |
| Hawaiian / Pacific | 0 | 0.0% |
| Hispanic or Latino | 68 | 1.2% |
| Native / Alaskan | 0 | 0.0% |
| White / Caucasian | 5,410 | 97.3% |
| Two or more Races | 68 | 1.2% |
| Some other Race | 75 | 1.3% |
| Total | 5,560 | 100.0% |
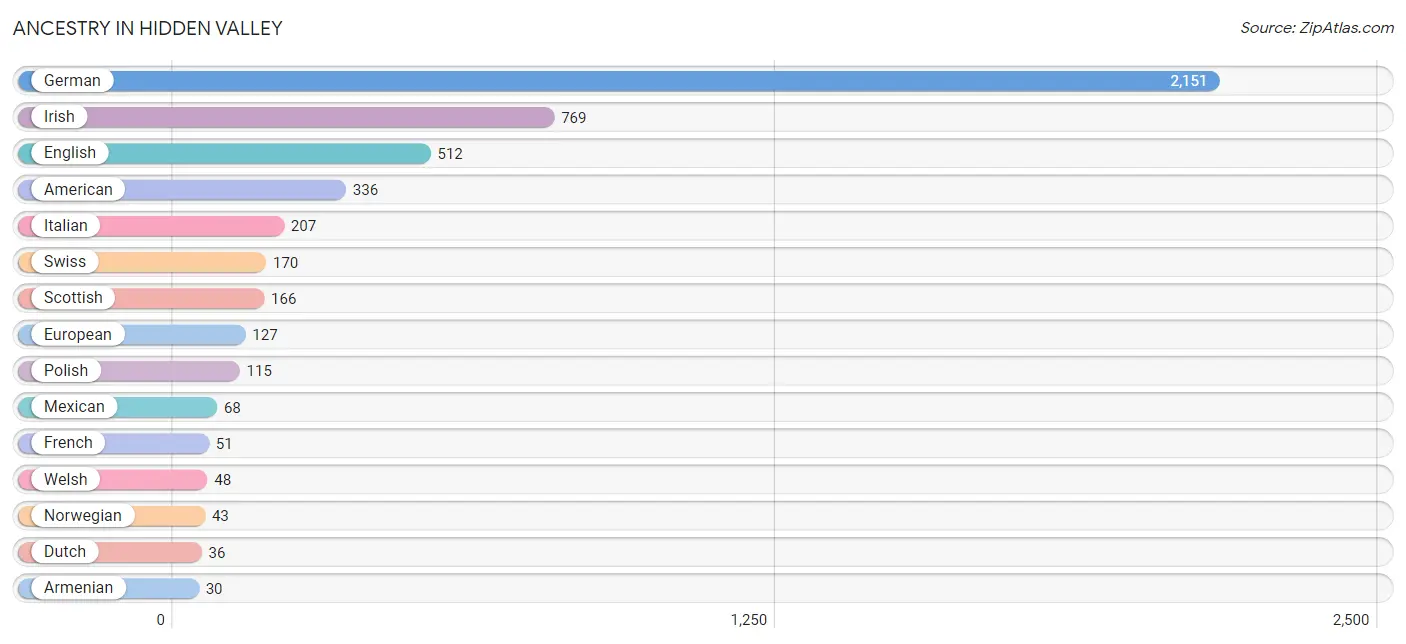
Ancestry in Hidden Valley
The most populous ancestries reported in Hidden Valley are German (2,151 | 38.7%), Irish (769 | 13.8%), English (512 | 9.2%), American (336 | 6.0%), and Italian (207 | 3.7%), together accounting for 71.5% of all Hidden Valley residents.
| Ancestry | # Population | % Population |
| American | 336 | 6.0% |
| Armenian | 30 | 0.5% |
| Czech | 6 | 0.1% |
| Dutch | 36 | 0.6% |
| English | 512 | 9.2% |
| European | 127 | 2.3% |
| French | 51 | 0.9% |
| French Canadian | 29 | 0.5% |
| German | 2,151 | 38.7% |
| Irish | 769 | 13.8% |
| Italian | 207 | 3.7% |
| Korean | 7 | 0.1% |
| Lithuanian | 13 | 0.2% |
| Mexican | 68 | 1.2% |
| Northern European | 18 | 0.3% |
| Norwegian | 43 | 0.8% |
| Polish | 115 | 2.1% |
| Scotch-Irish | 18 | 0.3% |
| Scottish | 166 | 3.0% |
| Swiss | 170 | 3.1% |
| Welsh | 48 | 0.9% | View All 21 Rows |
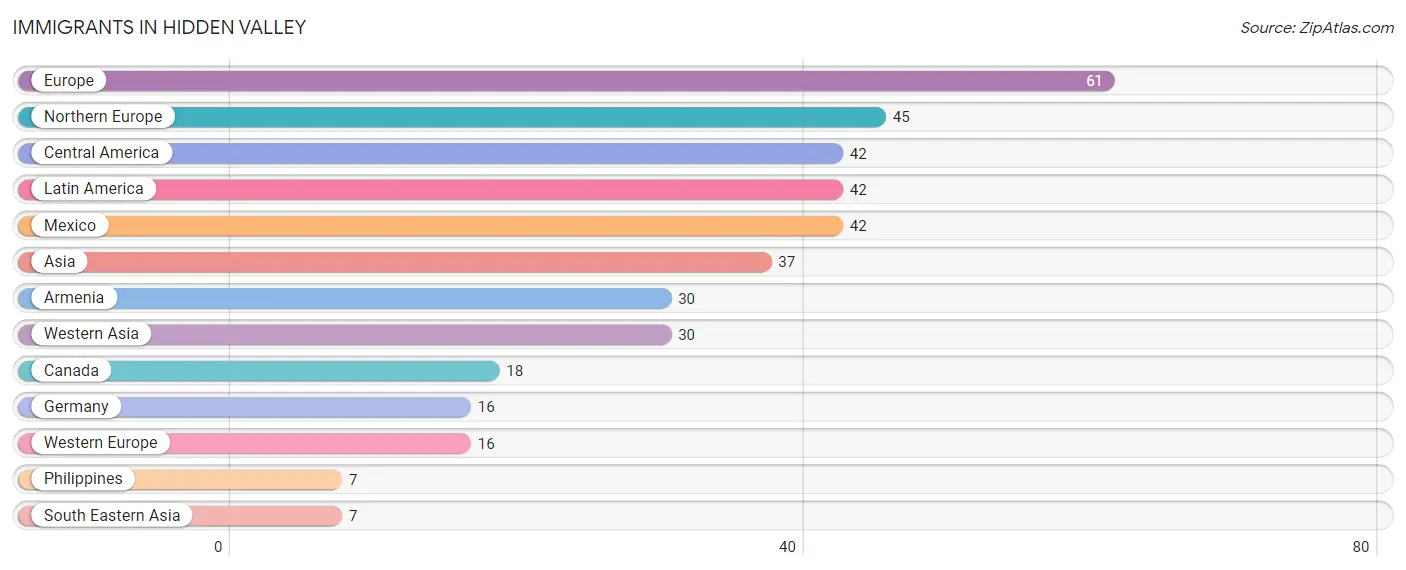
Immigrants in Hidden Valley
The most numerous immigrant groups reported in Hidden Valley came from Europe (61 | 1.1%), Northern Europe (45 | 0.8%), Central America (42 | 0.8%), Latin America (42 | 0.8%), and Mexico (42 | 0.8%), together accounting for 4.2% of all Hidden Valley residents.
| Immigration Origin | # Population | % Population |
| Armenia | 30 | 0.5% |
| Asia | 37 | 0.7% |
| Canada | 18 | 0.3% |
| Central America | 42 | 0.8% |
| Europe | 61 | 1.1% |
| Germany | 16 | 0.3% |
| Latin America | 42 | 0.8% |
| Mexico | 42 | 0.8% |
| Northern Europe | 45 | 0.8% |
| Philippines | 7 | 0.1% |
| South Eastern Asia | 7 | 0.1% |
| Western Asia | 30 | 0.5% |
| Western Europe | 16 | 0.3% | View All 13 Rows |
Sex and Age in Hidden Valley
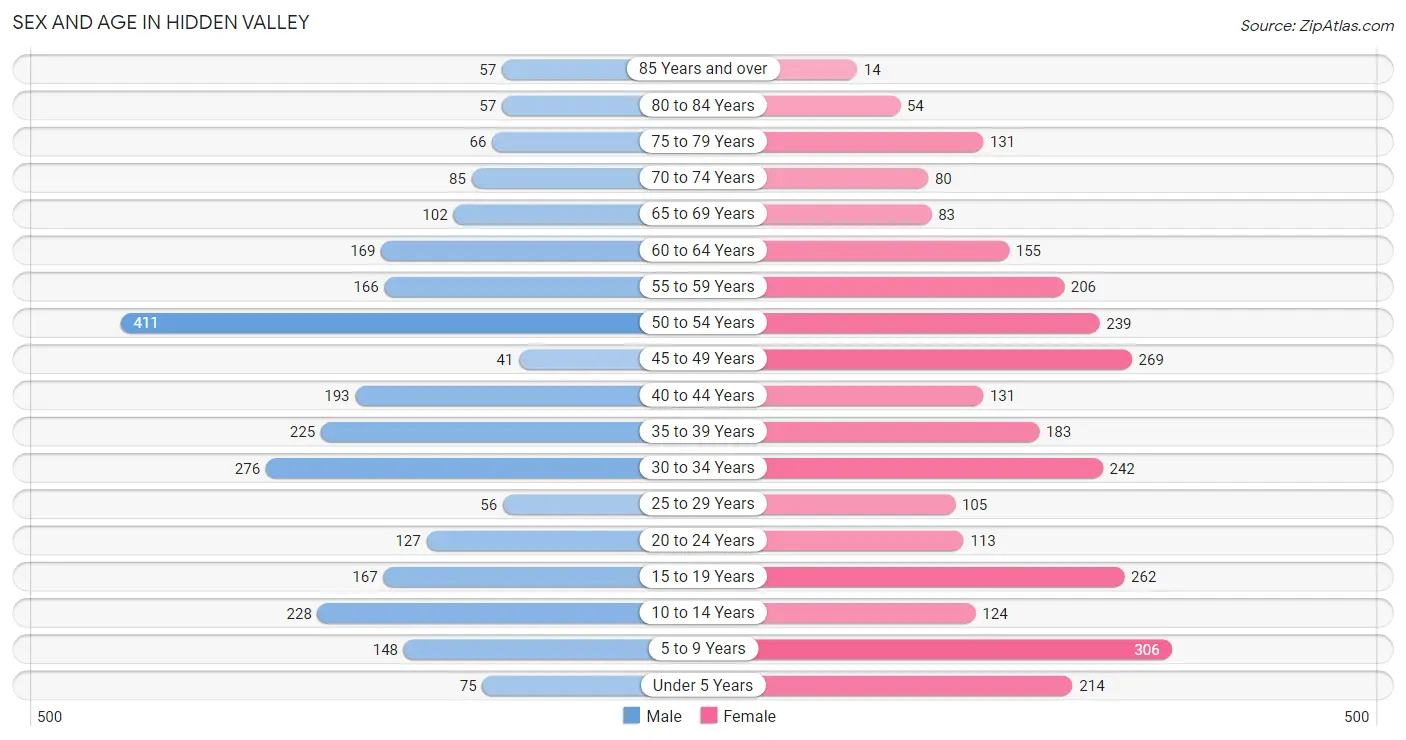
Sex and Age in Hidden Valley
The most populous age groups in Hidden Valley are 50 to 54 Years (411 | 15.5%) for men and 5 to 9 Years (306 | 10.5%) for women.
| Age Bracket | Male | Female |
| Under 5 Years | 75 (2.8%) | 214 (7.3%) |
| 5 to 9 Years | 148 (5.6%) | 306 (10.5%) |
| 10 to 14 Years | 228 (8.6%) | 124 (4.3%) |
| 15 to 19 Years | 167 (6.3%) | 262 (9.0%) |
| 20 to 24 Years | 127 (4.8%) | 113 (3.9%) |
| 25 to 29 Years | 56 (2.1%) | 105 (3.6%) |
| 30 to 34 Years | 276 (10.4%) | 242 (8.3%) |
| 35 to 39 Years | 225 (8.5%) | 183 (6.3%) |
| 40 to 44 Years | 193 (7.3%) | 131 (4.5%) |
| 45 to 49 Years | 41 (1.5%) | 269 (9.2%) |
| 50 to 54 Years | 411 (15.5%) | 239 (8.2%) |
| 55 to 59 Years | 166 (6.3%) | 206 (7.1%) |
| 60 to 64 Years | 169 (6.4%) | 155 (5.3%) |
| 65 to 69 Years | 102 (3.8%) | 83 (2.9%) |
| 70 to 74 Years | 85 (3.2%) | 80 (2.8%) |
| 75 to 79 Years | 66 (2.5%) | 131 (4.5%) |
| 80 to 84 Years | 57 (2.1%) | 54 (1.9%) |
| 85 Years and over | 57 (2.1%) | 14 (0.5%) |
| Total | 2,649 (100.0%) | 2,911 (100.0%) |
Families and Households in Hidden Valley
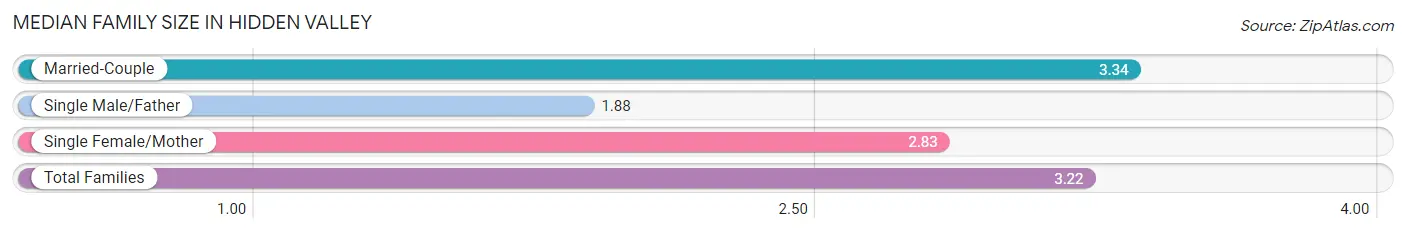
Median Family Size in Hidden Valley
The median family size in Hidden Valley is 3.22 persons per family, with married-couple families (1,298 | 84.3%) accounting for the largest median family size of 3.34 persons per family. On the other hand, single male/father families (72 | 4.7%) represent the smallest median family size with 1.88 persons per family.
| Family Type | # Families | Family Size |
| Married-Couple | 1,298 (84.3%) | 3.34 |
| Single Male/Father | 72 (4.7%) | 1.88 |
| Single Female/Mother | 170 (11.0%) | 2.83 |
| Total Families | 1,540 (100.0%) | 3.22 |
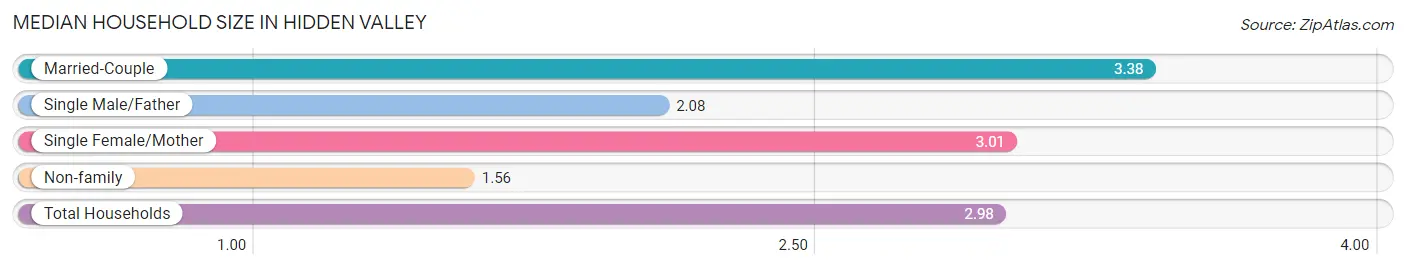
Median Household Size in Hidden Valley
The median household size in Hidden Valley is 2.98 persons per household, with married-couple households (1,298 | 69.6%) accounting for the largest median household size of 3.38 persons per household. non-family households (326 | 17.5%) represent the smallest median household size with 1.56 persons per household.
| Household Type | # Households | Household Size |
| Married-Couple | 1,298 (69.6%) | 3.38 |
| Single Male/Father | 72 (3.9%) | 2.08 |
| Single Female/Mother | 170 (9.1%) | 3.01 |
| Non-family | 326 (17.5%) | 1.56 |
| Total Households | 1,866 (100.0%) | 2.98 |
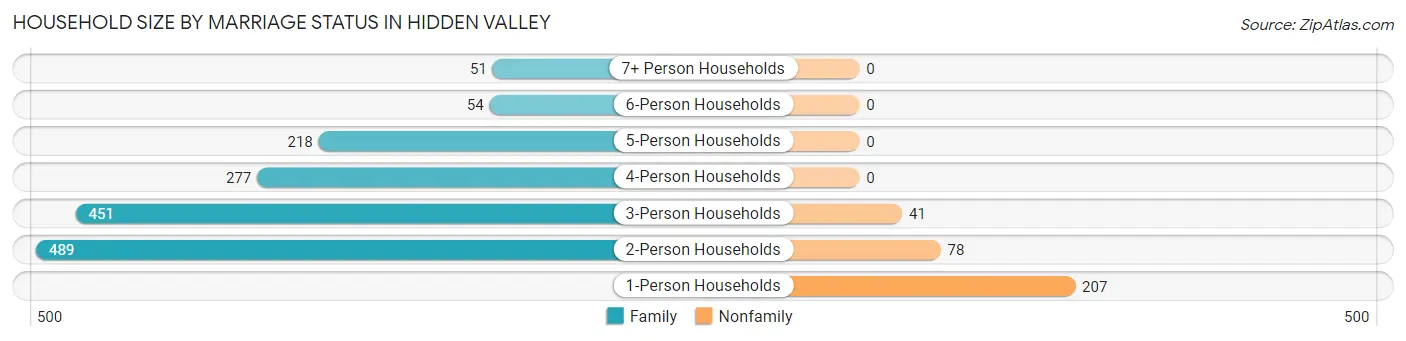
Household Size by Marriage Status in Hidden Valley
Out of a total of 1,866 households in Hidden Valley, 1,540 (82.5%) are family households, while 326 (17.5%) are nonfamily households. The most numerous type of family households are 2-person households, comprising 489, and the most common type of nonfamily households are 1-person households, comprising 207.
| Household Size | Family Households | Nonfamily Households |
| 1-Person Households | - | 207 (11.1%) |
| 2-Person Households | 489 (26.2%) | 78 (4.2%) |
| 3-Person Households | 451 (24.2%) | 41 (2.2%) |
| 4-Person Households | 277 (14.8%) | 0 (0.0%) |
| 5-Person Households | 218 (11.7%) | 0 (0.0%) |
| 6-Person Households | 54 (2.9%) | 0 (0.0%) |
| 7+ Person Households | 51 (2.7%) | 0 (0.0%) |
| Total | 1,540 (82.5%) | 326 (17.5%) |
Female Fertility in Hidden Valley
Fertility by Age in Hidden Valley
Average fertility rate in Hidden Valley is 63.0 births per 1,000 women. Women in the age bracket of 15 to 19 years have the highest fertility rate with 164.0 births per 1,000 women. Women in the age bracket of 15 to 19 years acount for 52.4% of all women with births.
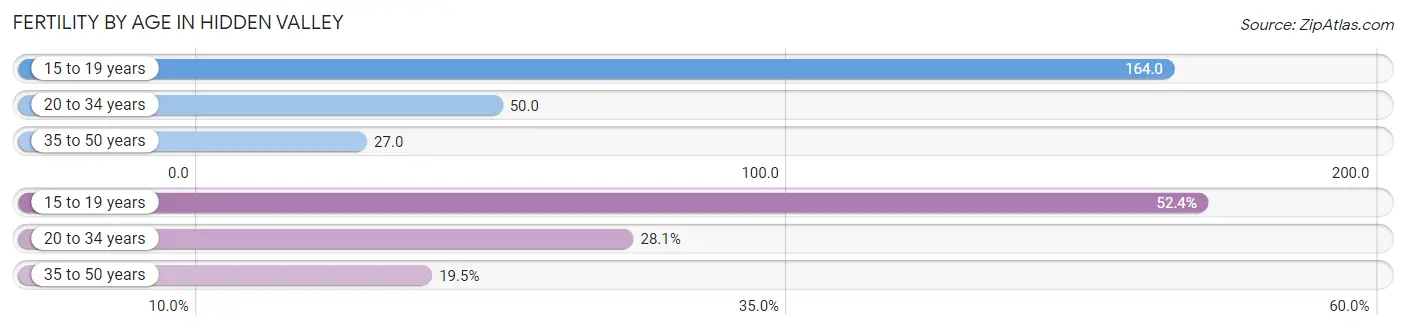
| Age Bracket | Women with Births | Births / 1,000 Women |
| 15 to 19 years | 43 (52.4%) | 164.0 |
| 20 to 34 years | 23 (28.1%) | 50.0 |
| 35 to 50 years | 16 (19.5%) | 27.0 |
| Total | 82 (100.0%) | 63.0 |
Fertility by Age by Marriage Status in Hidden Valley
13.4% of women with births (82) in Hidden Valley are married. The highest percentage of unmarried women with births falls into 15 to 19 years age bracket with 100.0% of them unmarried at the time of birth, while the lowest percentage of unmarried women with births belong to 20 to 34 years age bracket with 52.2% of them unmarried.
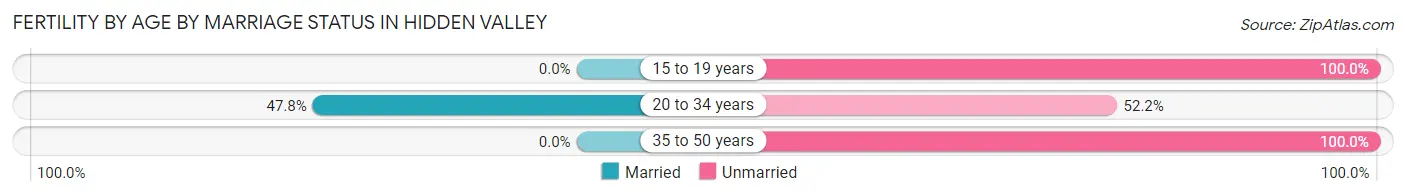
| Age Bracket | Married | Unmarried |
| 15 to 19 years | 0 (0.0%) | 43 (100.0%) |
| 20 to 34 years | 11 (47.8%) | 12 (52.2%) |
| 35 to 50 years | 0 (0.0%) | 16 (100.0%) |
| Total | 11 (13.4%) | 71 (86.6%) |
Fertility by Education in Hidden Valley
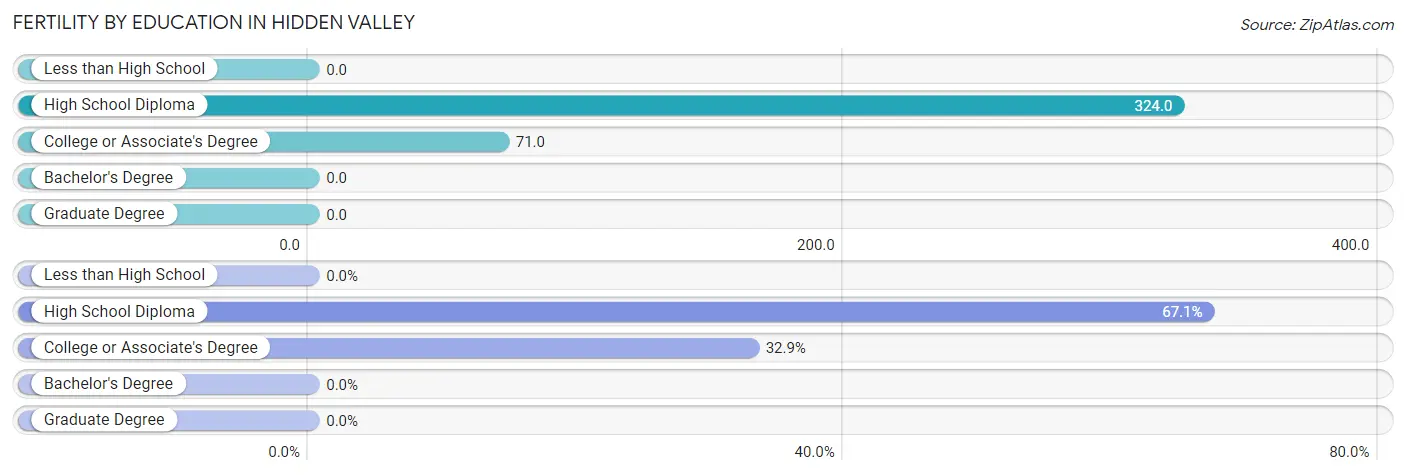
| Educational Attainment | Women with Births | Births / 1,000 Women |
| Less than High School | 0 (0.0%) | 0.0 |
| High School Diploma | 55 (67.1%) | 324.0 |
| College or Associate's Degree | 27 (32.9%) | 71.0 |
| Bachelor's Degree | 0 (0.0%) | 0.0 |
| Graduate Degree | 0 (0.0%) | 0.0 |
| Total | 82 (100.0%) | 63.0 |
Fertility by Education by Marriage Status in Hidden Valley
86.6% of women with births in Hidden Valley are unmarried. Women with the educational attainment of college or associate's degree are most likely to be married with 40.7% of them married at childbirth, while women with the educational attainment of high school diploma are least likely to be married with 100.0% of them unmarried at childbirth.
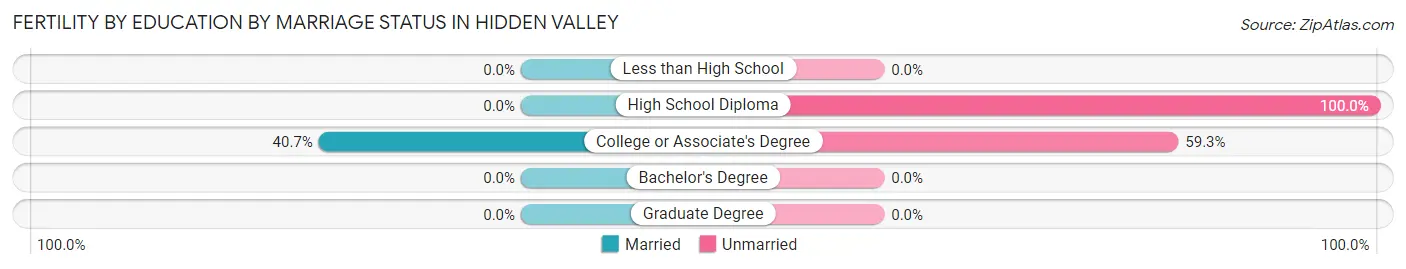
| Educational Attainment | Married | Unmarried |
| Less than High School | 0 (0.0%) | 0 (0.0%) |
| High School Diploma | 0 (0.0%) | 55 (100.0%) |
| College or Associate's Degree | 11 (40.7%) | 16 (59.3%) |
| Bachelor's Degree | 0 (0.0%) | 0 (0.0%) |
| Graduate Degree | 0 (0.0%) | 0 (0.0%) |
| Total | 11 (13.4%) | 71 (86.6%) |
Income in Hidden Valley
Income Overview in Hidden Valley
Per Capita Income in Hidden Valley is $40,562, while median incomes of families and households are $116,094 and $112,500 respectively.
| Characteristic | Number | Measure |
| Per Capita Income | 5,560 | $40,562 |
| Median Family Income | 1,540 | $116,094 |
| Mean Family Income | 1,540 | $127,845 |
| Median Household Income | 1,866 | $112,500 |
| Mean Household Income | 1,866 | $122,870 |
| Income Deficit | 1,540 | $0 |
| Wage / Income Gap (%) | 5,560 | 23.70% |
| Wage / Income Gap ($) | 5,560 | 76.30¢ per $1 |
| Gini / Inequality Index | 5,560 | 0.32 |
Earnings by Sex in Hidden Valley
Average Earnings in Hidden Valley are $50,394, $59,706 for men and $45,558 for women, a difference of 23.7%.
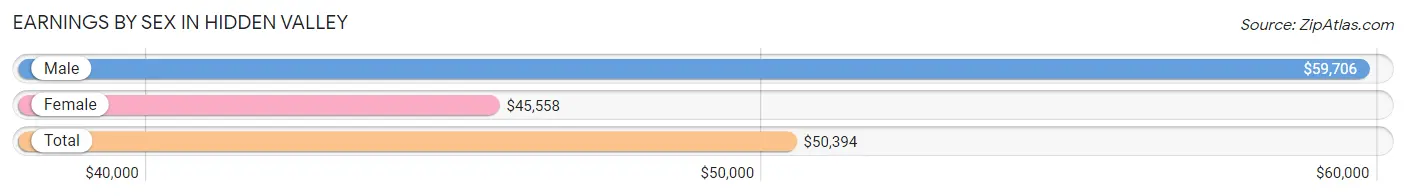
| Sex | Number | Average Earnings |
| Male | 1,628 (50.5%) | $59,706 |
| Female | 1,597 (49.5%) | $45,558 |
| Total | 3,225 (100.0%) | $50,394 |
Earnings by Sex by Income Bracket in Hidden Valley
The most common earnings brackets in Hidden Valley are $100,000+ for men (320 | 19.7%) and $75,000 to $99,999 for women (211 | 13.2%).
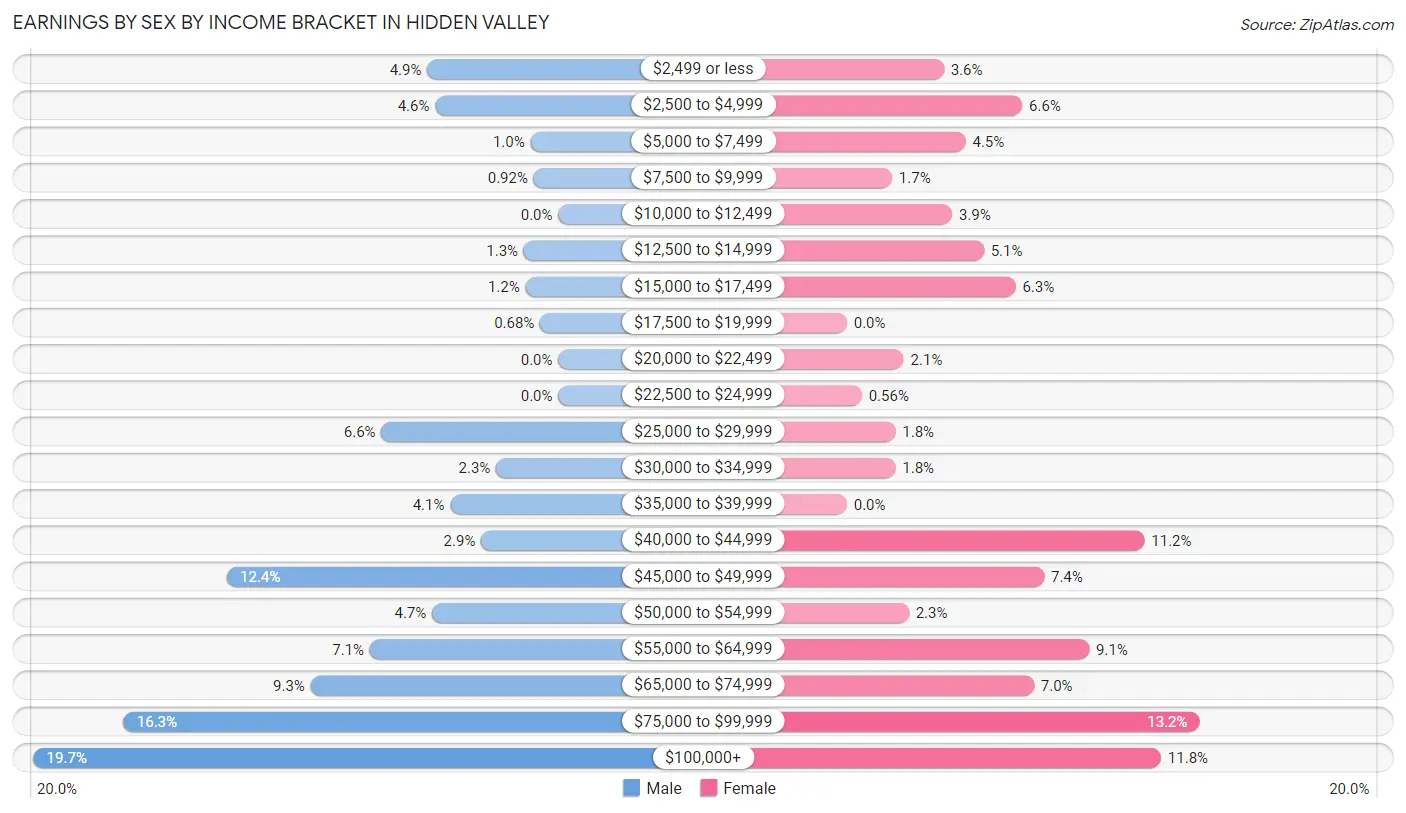
| Income | Male | Female |
| $2,499 or less | 80 (4.9%) | 58 (3.6%) |
| $2,500 to $4,999 | 75 (4.6%) | 105 (6.6%) |
| $5,000 to $7,499 | 17 (1.0%) | 71 (4.4%) |
| $7,500 to $9,999 | 15 (0.9%) | 27 (1.7%) |
| $10,000 to $12,499 | 0 (0.0%) | 63 (3.9%) |
| $12,500 to $14,999 | 21 (1.3%) | 82 (5.1%) |
| $15,000 to $17,499 | 20 (1.2%) | 101 (6.3%) |
| $17,500 to $19,999 | 11 (0.7%) | 0 (0.0%) |
| $20,000 to $22,499 | 0 (0.0%) | 34 (2.1%) |
| $22,500 to $24,999 | 0 (0.0%) | 9 (0.6%) |
| $25,000 to $29,999 | 108 (6.6%) | 29 (1.8%) |
| $30,000 to $34,999 | 38 (2.3%) | 29 (1.8%) |
| $35,000 to $39,999 | 66 (4.1%) | 0 (0.0%) |
| $40,000 to $44,999 | 47 (2.9%) | 178 (11.2%) |
| $45,000 to $49,999 | 202 (12.4%) | 118 (7.4%) |
| $50,000 to $54,999 | 77 (4.7%) | 37 (2.3%) |
| $55,000 to $64,999 | 115 (7.1%) | 145 (9.1%) |
| $65,000 to $74,999 | 151 (9.3%) | 112 (7.0%) |
| $75,000 to $99,999 | 265 (16.3%) | 211 (13.2%) |
| $100,000+ | 320 (19.7%) | 188 (11.8%) |
| Total | 1,628 (100.0%) | 1,597 (100.0%) |
Earnings by Sex by Educational Attainment in Hidden Valley
Average earnings in Hidden Valley are $70,080 for men and $56,131 for women, a difference of 19.9%. Men with an educational attainment of bachelor's degree enjoy the highest average annual earnings of $87,413, while those with less than high school education earn the least with $46,581. Women with an educational attainment of graduate degree earn the most with the average annual earnings of $92,273, while those with high school diploma education have the smallest earnings of $46,815.
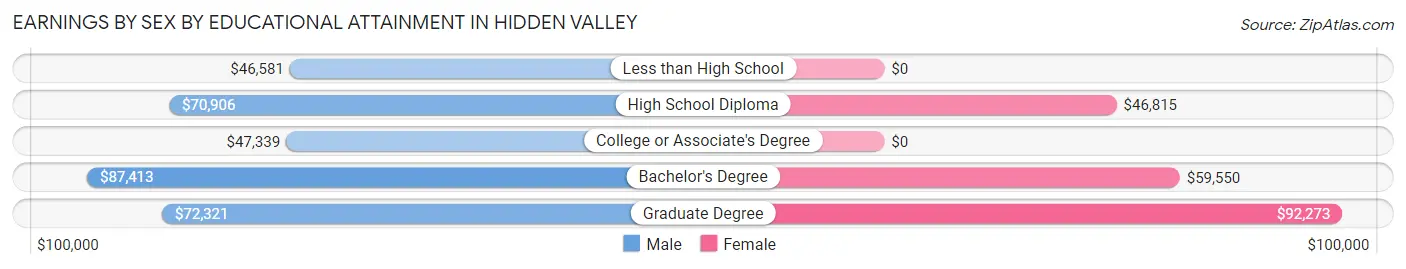
| Educational Attainment | Male Income | Female Income |
| Less than High School | $46,581 | $0 |
| High School Diploma | $70,906 | $46,815 |
| College or Associate's Degree | $47,339 | $0 |
| Bachelor's Degree | $87,413 | $59,550 |
| Graduate Degree | $72,321 | $92,273 |
| Total | $70,080 | $56,131 |
Family Income in Hidden Valley
Family Income Brackets in Hidden Valley
According to the Hidden Valley family income data, there are 447 families falling into the $100,000 to $149,999 income range, which is the most common income bracket and makes up 29.0% of all families.
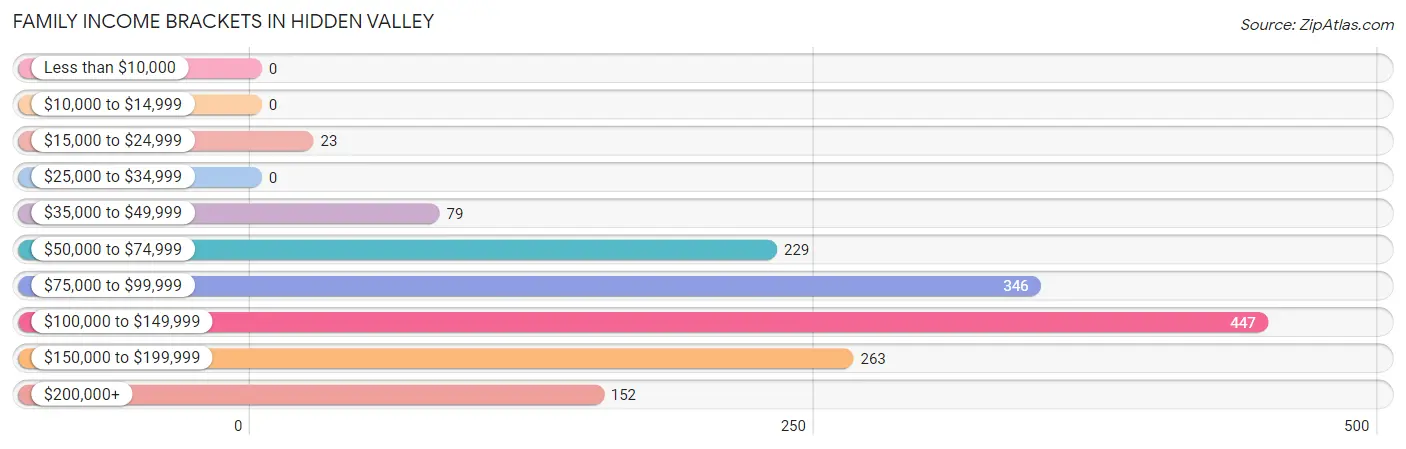
| Income Bracket | # Families | % Families |
| Less than $10,000 | 0 | 0.0% |
| $10,000 to $14,999 | 0 | 0.0% |
| $15,000 to $24,999 | 23 | 1.5% |
| $25,000 to $34,999 | 0 | 0.0% |
| $35,000 to $49,999 | 79 | 5.1% |
| $50,000 to $74,999 | 229 | 14.9% |
| $75,000 to $99,999 | 346 | 22.5% |
| $100,000 to $149,999 | 447 | 29.0% |
| $150,000 to $199,999 | 263 | 17.1% |
| $200,000+ | 152 | 9.9% |
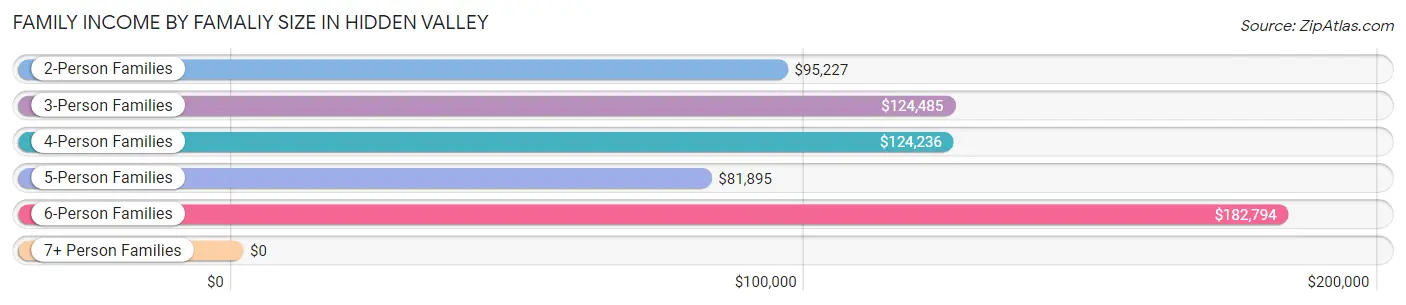
Family Income by Famaliy Size in Hidden Valley
6-person families (60 | 3.9%) account for the highest median family income in Hidden Valley with $182,794 per family, while 2-person families (516 | 33.5%) have the highest median income of $47,614 per family member.
| Income Bracket | # Families | Median Income |
| 2-Person Families | 516 (33.5%) | $95,227 |
| 3-Person Families | 467 (30.3%) | $124,485 |
| 4-Person Families | 245 (15.9%) | $124,236 |
| 5-Person Families | 218 (14.2%) | $81,895 |
| 6-Person Families | 60 (3.9%) | $182,794 |
| 7+ Person Families | 34 (2.2%) | $0 |
| Total | 1,540 (100.0%) | $116,094 |
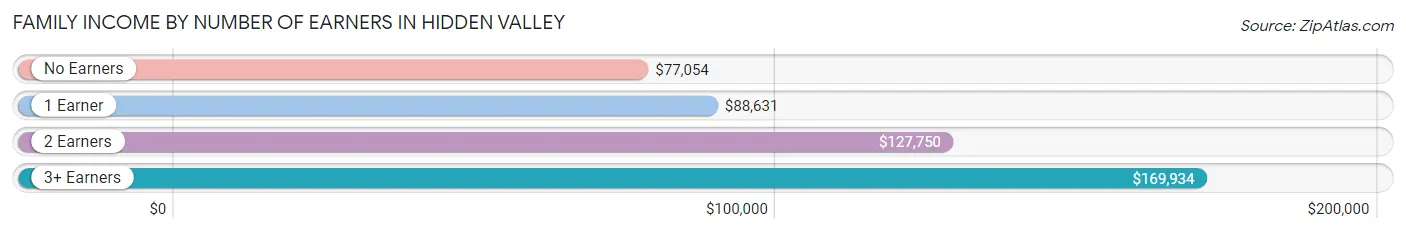
Family Income by Number of Earners in Hidden Valley
The median family income in Hidden Valley is $116,094, with families comprising 3+ earners (233) having the highest median family income of $169,934, while families with no earners (125) have the lowest median family income of $77,054, accounting for 15.1% and 8.1% of families, respectively.
| Number of Earners | # Families | Median Income |
| No Earners | 125 (8.1%) | $77,054 |
| 1 Earner | 442 (28.7%) | $88,631 |
| 2 Earners | 740 (48.0%) | $127,750 |
| 3+ Earners | 233 (15.1%) | $169,934 |
| Total | 1,540 (100.0%) | $116,094 |
Household Income in Hidden Valley
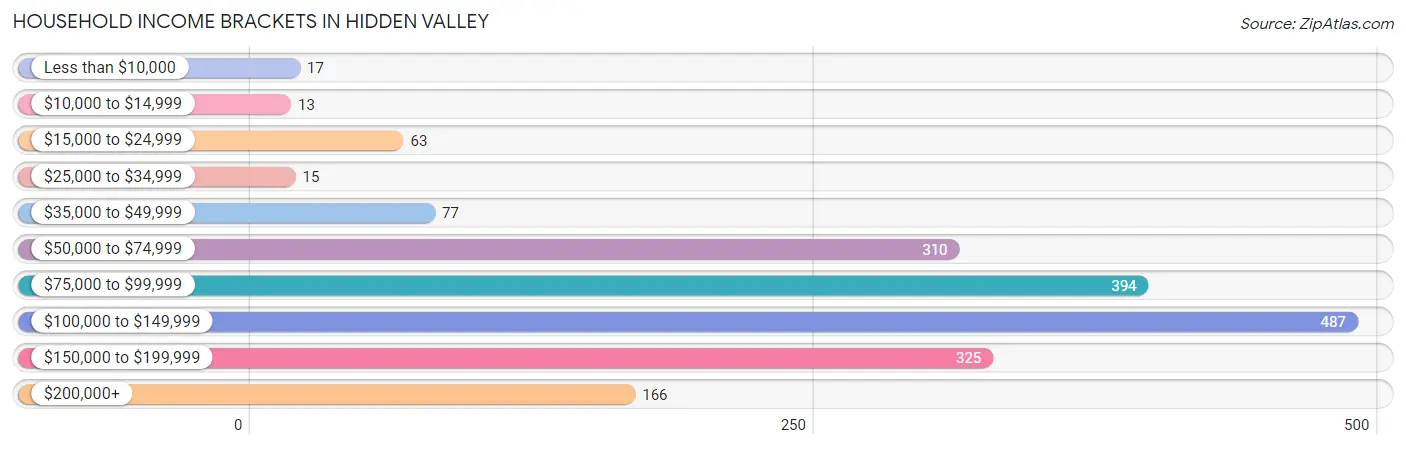
Household Income Brackets in Hidden Valley
With 487 households falling in the category, the $100,000 to $149,999 income range is the most frequent in Hidden Valley, accounting for 26.1% of all households. In contrast, only 13 households (0.7%) fall into the $10,000 to $14,999 income bracket, making it the least populous group.
| Income Bracket | # Households | % Households |
| Less than $10,000 | 17 | 0.9% |
| $10,000 to $14,999 | 13 | 0.7% |
| $15,000 to $24,999 | 63 | 3.4% |
| $25,000 to $34,999 | 15 | 0.8% |
| $35,000 to $49,999 | 77 | 4.1% |
| $50,000 to $74,999 | 310 | 16.6% |
| $75,000 to $99,999 | 394 | 21.1% |
| $100,000 to $149,999 | 487 | 26.1% |
| $150,000 to $199,999 | 325 | 17.4% |
| $200,000+ | 166 | 8.9% |
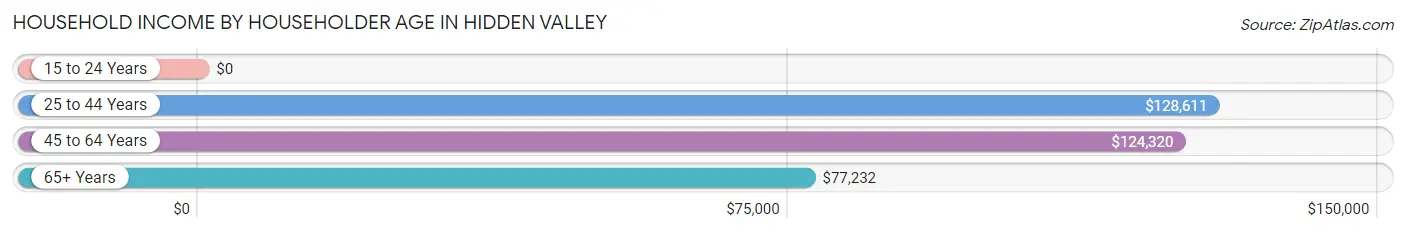
Household Income by Householder Age in Hidden Valley
The median household income in Hidden Valley is $112,500, with the highest median household income of $128,611 found in the 25 to 44 years age bracket for the primary householder. A total of 586 households (31.4%) fall into this category. Meanwhile, the 15 to 24 years age bracket for the primary householder has the lowest median household income of $0, with 27 households (1.5%) in this group.
| Income Bracket | # Households | Median Income |
| 15 to 24 Years | 27 (1.5%) | $0 |
| 25 to 44 Years | 586 (31.4%) | $128,611 |
| 45 to 64 Years | 842 (45.1%) | $124,320 |
| 65+ Years | 411 (22.0%) | $77,232 |
| Total | 1,866 (100.0%) | $112,500 |
Poverty in Hidden Valley
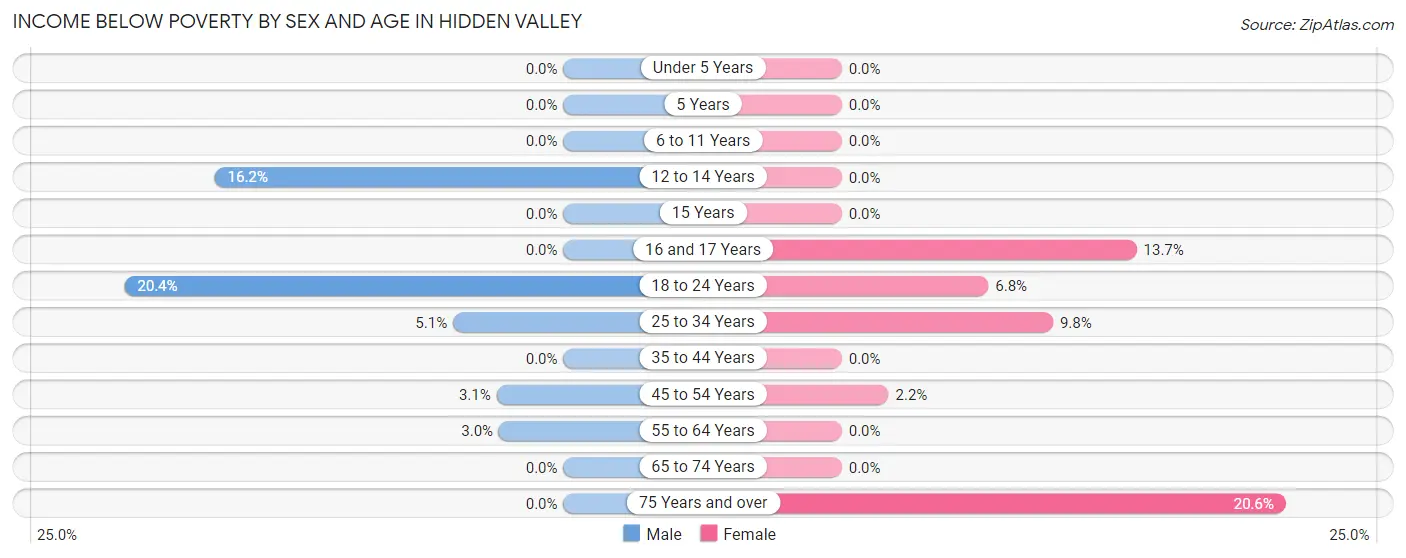
Income Below Poverty by Sex and Age in Hidden Valley
With 4.0% poverty level for males and 4.0% for females among the residents of Hidden Valley, 18 to 24 year old males and 75 year old and over females are the most vulnerable to poverty, with 44 males (20.4%) and 41 females (20.6%) in their respective age groups living below the poverty level.
| Age Bracket | Male | Female |
| Under 5 Years | 0 (0.0%) | 0 (0.0%) |
| 5 Years | 0 (0.0%) | 0 (0.0%) |
| 6 to 11 Years | 0 (0.0%) | 0 (0.0%) |
| 12 to 14 Years | 22 (16.2%) | 0 (0.0%) |
| 15 Years | 0 (0.0%) | 0 (0.0%) |
| 16 and 17 Years | 0 (0.0%) | 13 (13.7%) |
| 18 to 24 Years | 44 (20.4%) | 17 (6.8%) |
| 25 to 34 Years | 17 (5.1%) | 34 (9.8%) |
| 35 to 44 Years | 0 (0.0%) | 0 (0.0%) |
| 45 to 54 Years | 14 (3.1%) | 11 (2.2%) |
| 55 to 64 Years | 10 (3.0%) | 0 (0.0%) |
| 65 to 74 Years | 0 (0.0%) | 0 (0.0%) |
| 75 Years and over | 0 (0.0%) | 41 (20.6%) |
| Total | 107 (4.0%) | 116 (4.0%) |
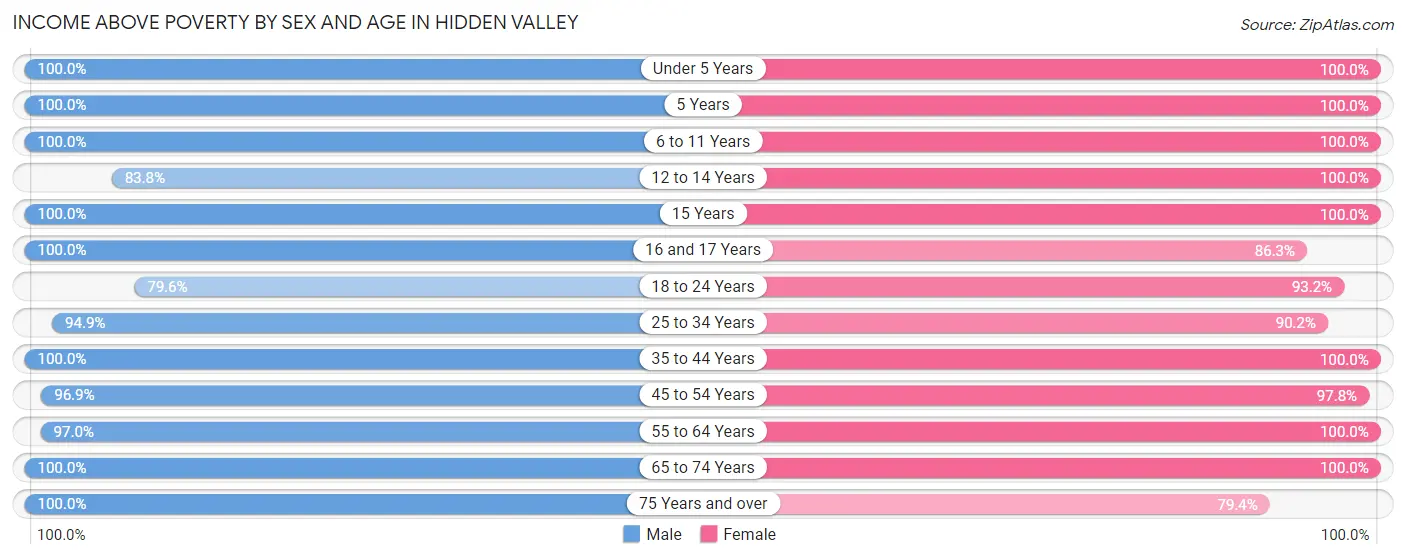
Income Above Poverty by Sex and Age in Hidden Valley
According to the poverty statistics in Hidden Valley, males aged under 5 years and females aged under 5 years are the age groups that are most secure financially, with 100.0% of males and 100.0% of females in these age groups living above the poverty line.
| Age Bracket | Male | Female |
| Under 5 Years | 75 (100.0%) | 214 (100.0%) |
| 5 Years | 31 (100.0%) | 120 (100.0%) |
| 6 to 11 Years | 209 (100.0%) | 263 (100.0%) |
| 12 to 14 Years | 114 (83.8%) | 35 (100.0%) |
| 15 Years | 39 (100.0%) | 30 (100.0%) |
| 16 and 17 Years | 39 (100.0%) | 82 (86.3%) |
| 18 to 24 Years | 172 (79.6%) | 233 (93.2%) |
| 25 to 34 Years | 315 (94.9%) | 313 (90.2%) |
| 35 to 44 Years | 418 (100.0%) | 314 (100.0%) |
| 45 to 54 Years | 438 (96.9%) | 497 (97.8%) |
| 55 to 64 Years | 325 (97.0%) | 361 (100.0%) |
| 65 to 74 Years | 187 (100.0%) | 163 (100.0%) |
| 75 Years and over | 180 (100.0%) | 158 (79.4%) |
| Total | 2,542 (96.0%) | 2,783 (96.0%) |
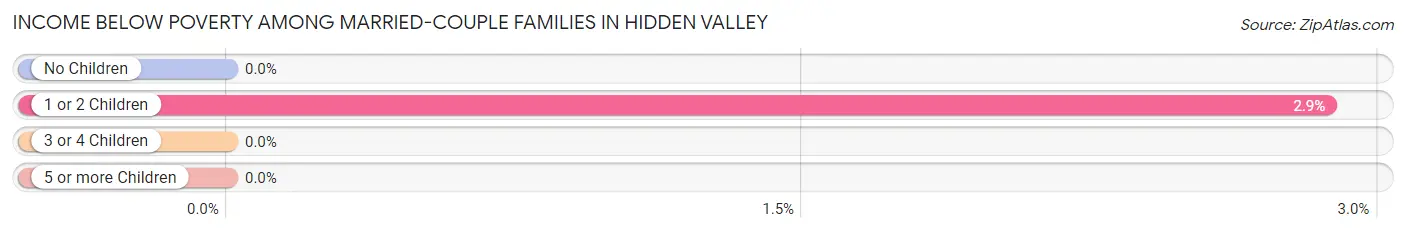
Income Below Poverty Among Married-Couple Families in Hidden Valley
The poverty statistics for married-couple families in Hidden Valley show that 0.9% or 11 of the total 1,298 families live below the poverty line. Families with 1 or 2 children have the highest poverty rate of 2.9%, comprising of 11 families. On the other hand, families with no children have the lowest poverty rate of 0.0%, which includes 0 families.
| Children | Above Poverty | Below Poverty |
| No Children | 782 (100.0%) | 0 (0.0%) |
| 1 or 2 Children | 372 (97.1%) | 11 (2.9%) |
| 3 or 4 Children | 133 (100.0%) | 0 (0.0%) |
| 5 or more Children | 0 (0.0%) | 0 (0.0%) |
| Total | 1,287 (99.2%) | 11 (0.9%) |
Income Below Poverty Among Single-Parent Households in Hidden Valley
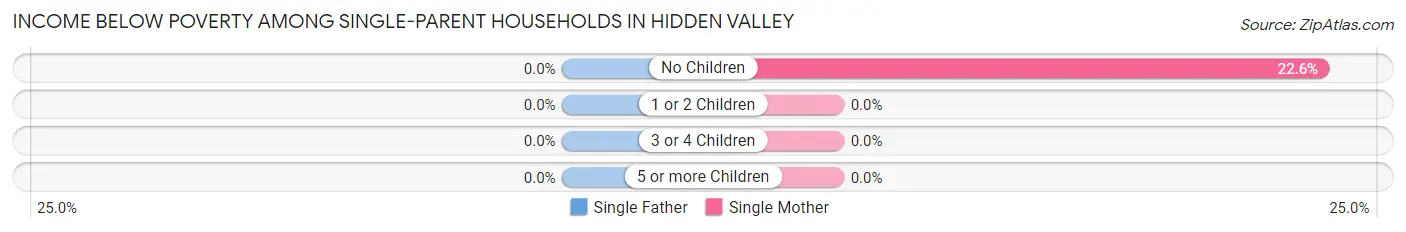
| Children | Single Father | Single Mother |
| No Children | 0 (0.0%) | 12 (22.6%) |
| 1 or 2 Children | 0 (0.0%) | 0 (0.0%) |
| 3 or 4 Children | 0 (0.0%) | 0 (0.0%) |
| 5 or more Children | 0 (0.0%) | 0 (0.0%) |
| Total | 0 (0.0%) | 12 (7.1%) |
Income Below Poverty Among Married-Couple vs Single-Parent Households in Hidden Valley
The poverty data for Hidden Valley shows that 11 of the married-couple family households (0.9%) and 12 of the single-parent households (5.0%) are living below the poverty level. Within the married-couple family households, those with 1 or 2 children have the highest poverty rate, with 11 households (2.9%) falling below the poverty line. Among the single-parent households, those with no children have the highest poverty rate, with 12 household (15.8%) living below poverty.
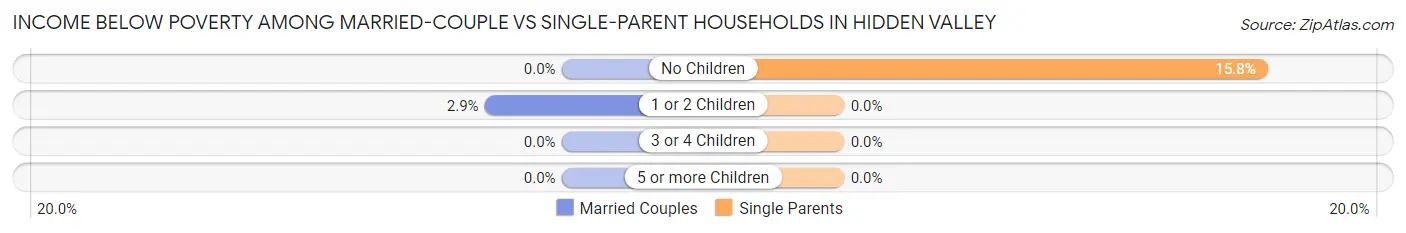
| Children | Married-Couple Families | Single-Parent Households |
| No Children | 0 (0.0%) | 12 (15.8%) |
| 1 or 2 Children | 11 (2.9%) | 0 (0.0%) |
| 3 or 4 Children | 0 (0.0%) | 0 (0.0%) |
| 5 or more Children | 0 (0.0%) | 0 (0.0%) |
| Total | 11 (0.9%) | 12 (5.0%) |
Employment Characteristics in Hidden Valley
Employment by Class of Employer in Hidden Valley
Among the 2,893 employed individuals in Hidden Valley, private company employees (2,160 | 74.7%), local government employees (258 | 8.9%), and self-employed (not incorporated) (148 | 5.1%) make up the most common classes of employment.
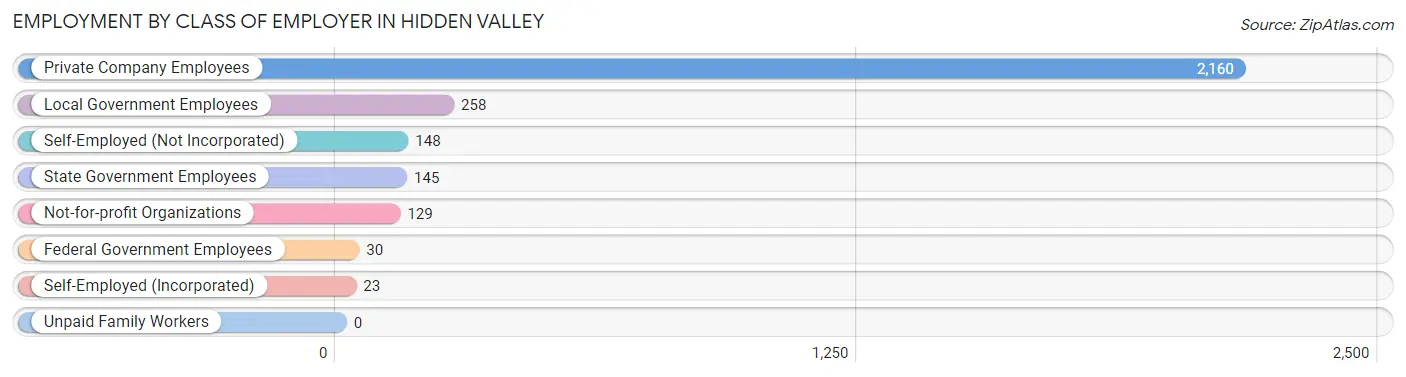
| Employer Class | # Employees | % Employees |
| Private Company Employees | 2,160 | 74.7% |
| Self-Employed (Incorporated) | 23 | 0.8% |
| Self-Employed (Not Incorporated) | 148 | 5.1% |
| Not-for-profit Organizations | 129 | 4.5% |
| Local Government Employees | 258 | 8.9% |
| State Government Employees | 145 | 5.0% |
| Federal Government Employees | 30 | 1.0% |
| Unpaid Family Workers | 0 | 0.0% |
| Total | 2,893 | 100.0% |
Employment Status by Age in Hidden Valley
According to the labor force statistics for Hidden Valley, out of the total population over 16 years of age (4,396), 66.7% or 2,932 individuals are in the labor force, with 1.0% or 29 of them unemployed. The age group with the highest labor force participation rate is 20 to 24 years, with 95.0% or 228 individuals in the labor force. Within the labor force, the 25 to 29 years age range has the highest percentage of unemployed individuals, with 11.4% or 17 of them being unemployed.
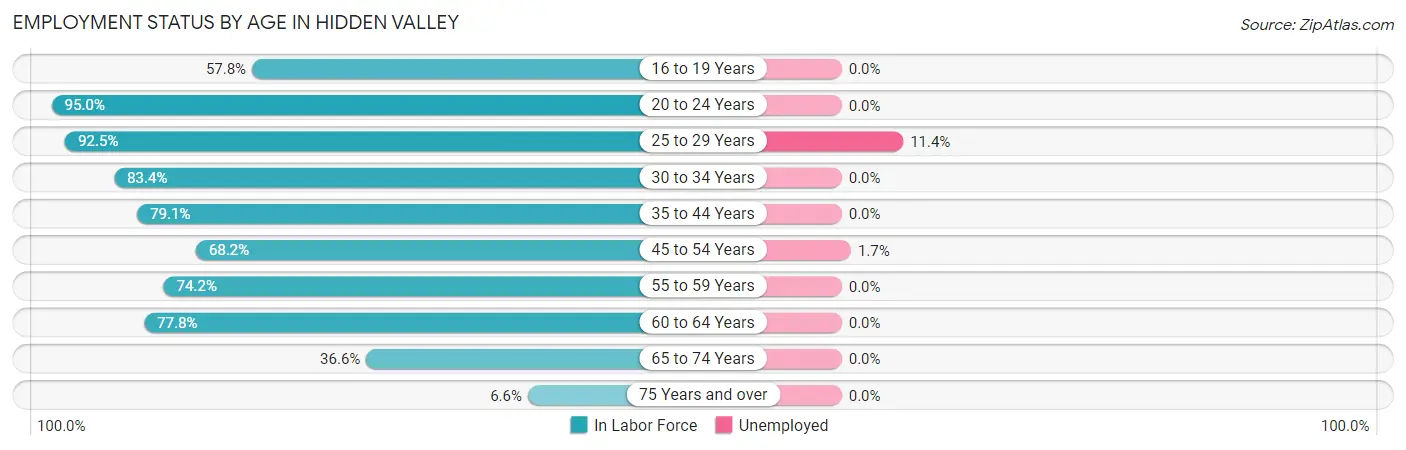
| Age Bracket | In Labor Force | Unemployed |
| 16 to 19 Years | 208 (57.8%) | 0 (0.0%) |
| 20 to 24 Years | 228 (95.0%) | 0 (0.0%) |
| 25 to 29 Years | 149 (92.5%) | 17 (11.4%) |
| 30 to 34 Years | 432 (83.4%) | 0 (0.0%) |
| 35 to 44 Years | 579 (79.1%) | 0 (0.0%) |
| 45 to 54 Years | 655 (68.2%) | 11 (1.7%) |
| 55 to 59 Years | 276 (74.2%) | 0 (0.0%) |
| 60 to 64 Years | 252 (77.8%) | 0 (0.0%) |
| 65 to 74 Years | 128 (36.6%) | 0 (0.0%) |
| 75 Years and over | 25 (6.6%) | 0 (0.0%) |
| Total | 2,932 (66.7%) | 29 (1.0%) |
Employment Status by Educational Attainment in Hidden Valley
According to labor force statistics for Hidden Valley, 76.4% of individuals (2,343) out of the total population between 25 and 64 years of age (3,067) are in the labor force, with 1.2% or 28 of them being unemployed. The group with the highest labor force participation rate are those with the educational attainment of bachelor's degree or higher, with 93.9% or 1,100 individuals in the labor force. Within the labor force, individuals with college / associate degree education have the highest percentage of unemployment, with 4.8% or 28 of them being unemployed.
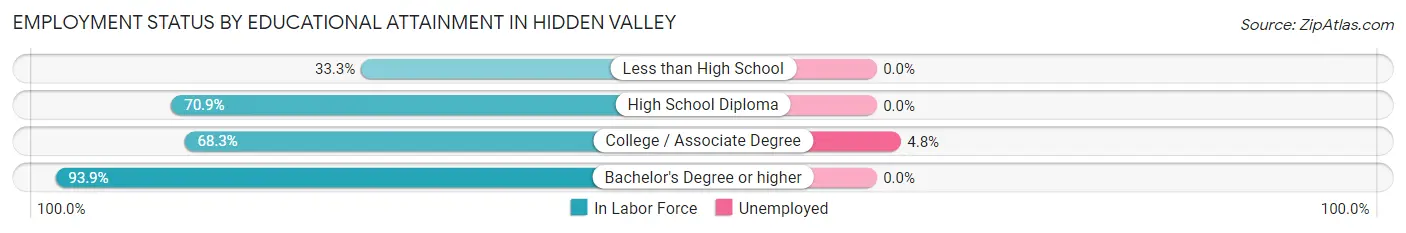
| Educational Attainment | In Labor Force | Unemployed |
| Less than High School | 70 (33.3%) | 0 (0.0%) |
| High School Diploma | 591 (70.9%) | 0 (0.0%) |
| College / Associate Degree | 583 (68.3%) | 41 (4.8%) |
| Bachelor's Degree or higher | 1,100 (93.9%) | 0 (0.0%) |
| Total | 2,343 (76.4%) | 37 (1.2%) |
Employment Occupations by Sex in Hidden Valley
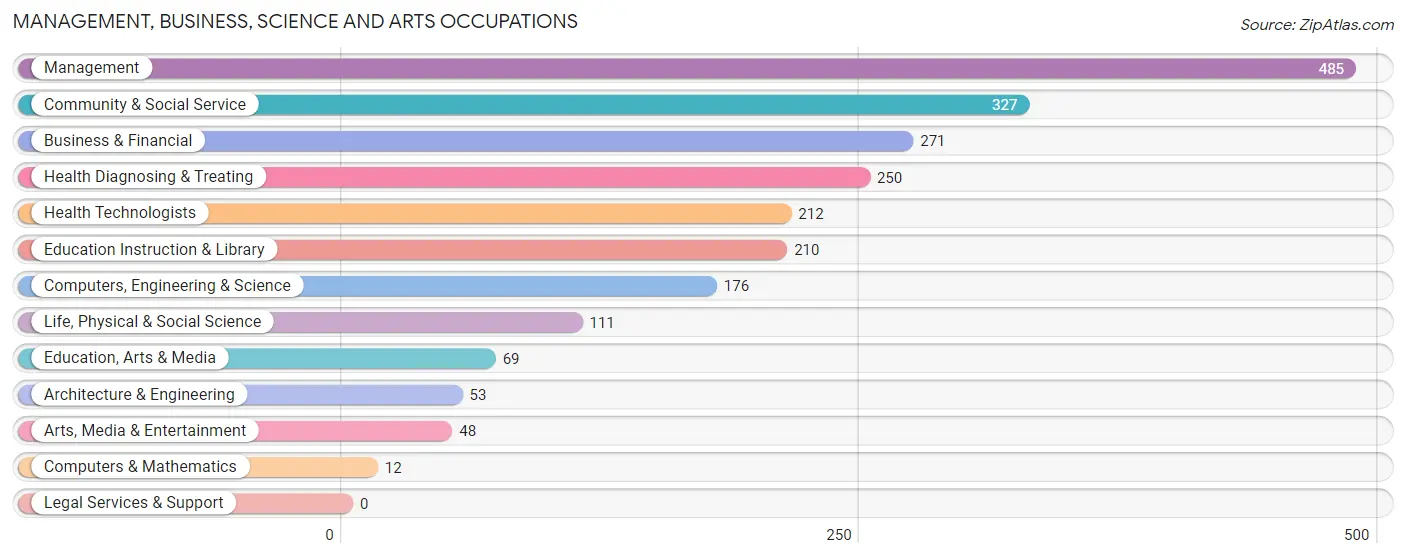
Management, Business, Science and Arts Occupations
The most common Management, Business, Science and Arts occupations in Hidden Valley are Management (485 | 16.7%), Community & Social Service (327 | 11.3%), Business & Financial (271 | 9.3%), Health Diagnosing & Treating (250 | 8.6%), and Health Technologists (212 | 7.3%).
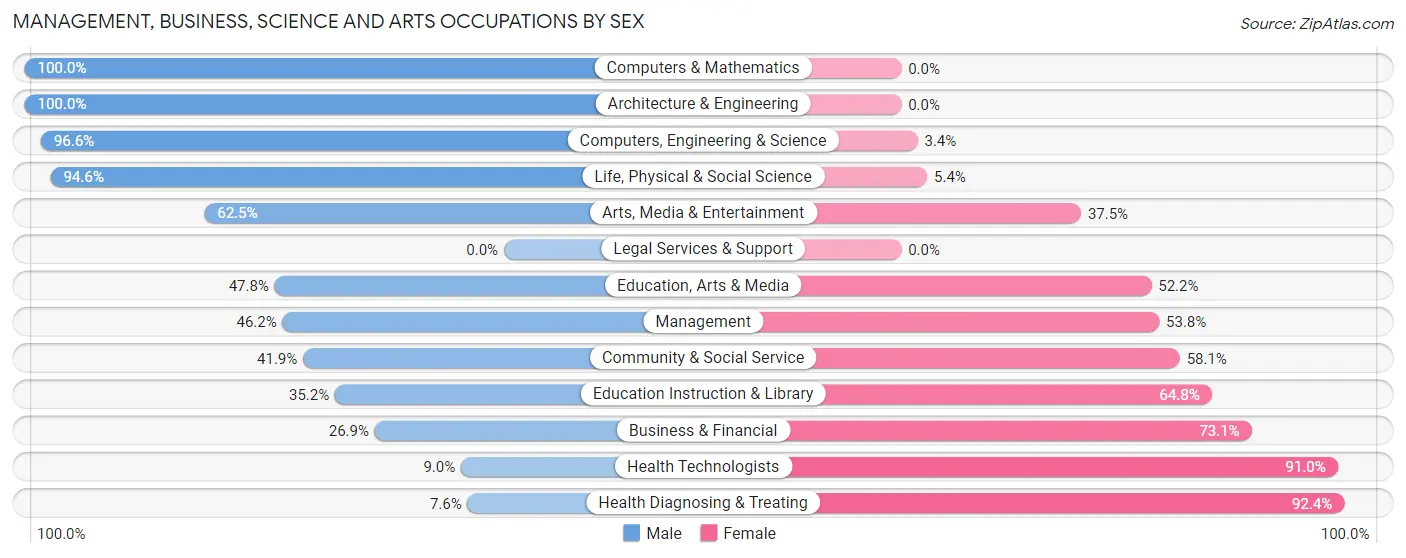
Management, Business, Science and Arts Occupations by Sex
Within the Management, Business, Science and Arts occupations in Hidden Valley, the most male-oriented occupations are Computers & Mathematics (100.0%), Architecture & Engineering (100.0%), and Computers, Engineering & Science (96.6%), while the most female-oriented occupations are Health Diagnosing & Treating (92.4%), Health Technologists (91.0%), and Business & Financial (73.1%).
| Occupation | Male | Female |
| Management | 224 (46.2%) | 261 (53.8%) |
| Business & Financial | 73 (26.9%) | 198 (73.1%) |
| Computers, Engineering & Science | 170 (96.6%) | 6 (3.4%) |
| Computers & Mathematics | 12 (100.0%) | 0 (0.0%) |
| Architecture & Engineering | 53 (100.0%) | 0 (0.0%) |
| Life, Physical & Social Science | 105 (94.6%) | 6 (5.4%) |
| Community & Social Service | 137 (41.9%) | 190 (58.1%) |
| Education, Arts & Media | 33 (47.8%) | 36 (52.2%) |
| Legal Services & Support | 0 (0.0%) | 0 (0.0%) |
| Education Instruction & Library | 74 (35.2%) | 136 (64.8%) |
| Arts, Media & Entertainment | 30 (62.5%) | 18 (37.5%) |
| Health Diagnosing & Treating | 19 (7.6%) | 231 (92.4%) |
| Health Technologists | 19 (9.0%) | 193 (91.0%) |
| Total (Category) | 623 (41.3%) | 886 (58.7%) |
| Total (Overall) | 1,524 (52.5%) | 1,380 (47.5%) |
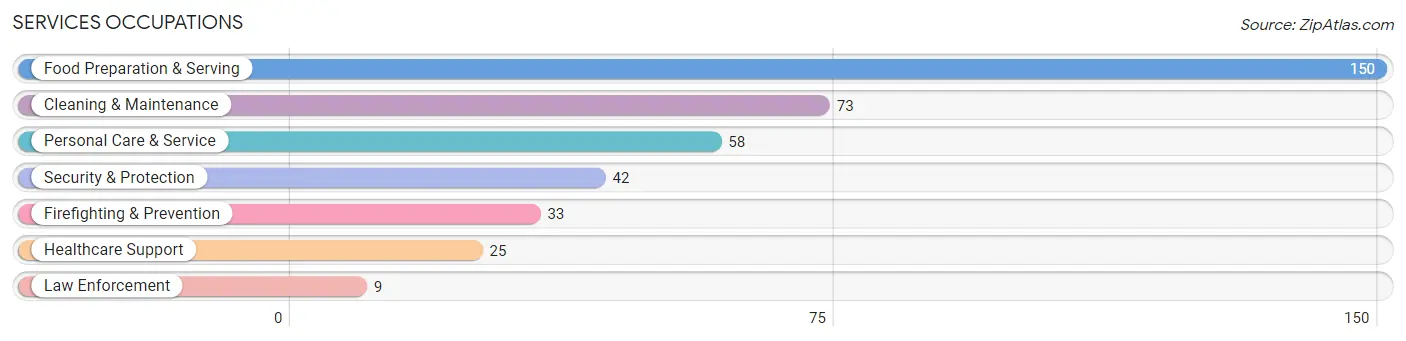
Services Occupations
The most common Services occupations in Hidden Valley are Food Preparation & Serving (150 | 5.2%), Cleaning & Maintenance (73 | 2.5%), Personal Care & Service (58 | 2.0%), Security & Protection (42 | 1.5%), and Firefighting & Prevention (33 | 1.1%).
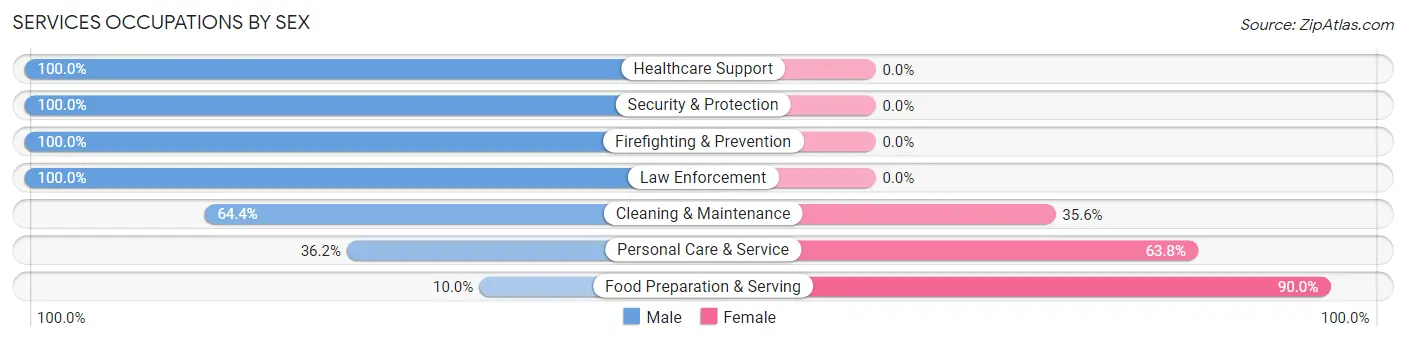
Services Occupations by Sex
Within the Services occupations in Hidden Valley, the most male-oriented occupations are Healthcare Support (100.0%), Security & Protection (100.0%), and Firefighting & Prevention (100.0%), while the most female-oriented occupations are Food Preparation & Serving (90.0%), Personal Care & Service (63.8%), and Cleaning & Maintenance (35.6%).
| Occupation | Male | Female |
| Healthcare Support | 25 (100.0%) | 0 (0.0%) |
| Security & Protection | 42 (100.0%) | 0 (0.0%) |
| Firefighting & Prevention | 33 (100.0%) | 0 (0.0%) |
| Law Enforcement | 9 (100.0%) | 0 (0.0%) |
| Food Preparation & Serving | 15 (10.0%) | 135 (90.0%) |
| Cleaning & Maintenance | 47 (64.4%) | 26 (35.6%) |
| Personal Care & Service | 21 (36.2%) | 37 (63.8%) |
| Total (Category) | 150 (43.1%) | 198 (56.9%) |
| Total (Overall) | 1,524 (52.5%) | 1,380 (47.5%) |
Sales and Office Occupations
The most common Sales and Office occupations in Hidden Valley are Sales & Related (264 | 9.1%), and Office & Administration (173 | 6.0%).
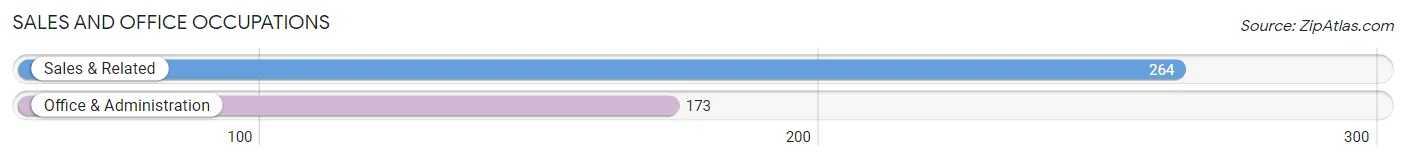
Sales and Office Occupations by Sex
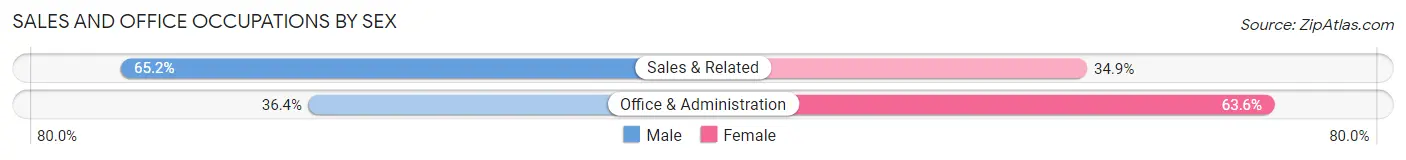
| Occupation | Male | Female |
| Sales & Related | 172 (65.1%) | 92 (34.8%) |
| Office & Administration | 63 (36.4%) | 110 (63.6%) |
| Total (Category) | 235 (53.8%) | 202 (46.2%) |
| Total (Overall) | 1,524 (52.5%) | 1,380 (47.5%) |
Natural Resources, Construction and Maintenance Occupations
The most common Natural Resources, Construction and Maintenance occupations in Hidden Valley are Construction & Extraction (109 | 3.7%), and Installation, Maintenance & Repair (101 | 3.5%).
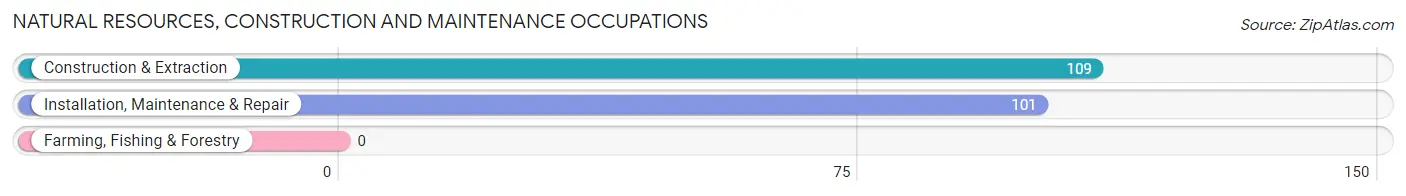
Natural Resources, Construction and Maintenance Occupations by Sex
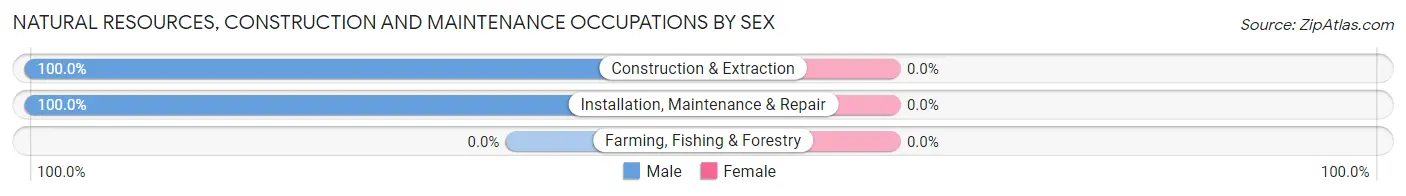
| Occupation | Male | Female |
| Farming, Fishing & Forestry | 0 (0.0%) | 0 (0.0%) |
| Construction & Extraction | 109 (100.0%) | 0 (0.0%) |
| Installation, Maintenance & Repair | 101 (100.0%) | 0 (0.0%) |
| Total (Category) | 210 (100.0%) | 0 (0.0%) |
| Total (Overall) | 1,524 (52.5%) | 1,380 (47.5%) |
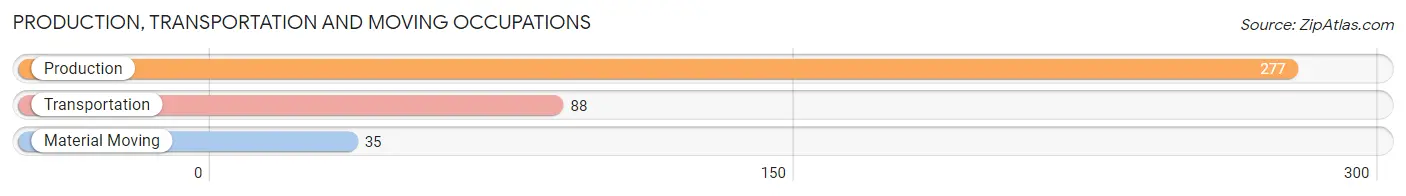
Production, Transportation and Moving Occupations
The most common Production, Transportation and Moving occupations in Hidden Valley are Production (277 | 9.5%), Transportation (88 | 3.0%), and Material Moving (35 | 1.2%).
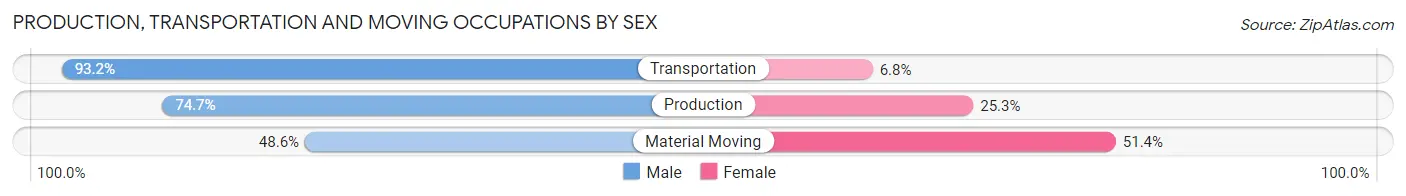
Production, Transportation and Moving Occupations by Sex
| Occupation | Male | Female |
| Production | 207 (74.7%) | 70 (25.3%) |
| Transportation | 82 (93.2%) | 6 (6.8%) |
| Material Moving | 17 (48.6%) | 18 (51.4%) |
| Total (Category) | 306 (76.5%) | 94 (23.5%) |
| Total (Overall) | 1,524 (52.5%) | 1,380 (47.5%) |
Employment Industries by Sex in Hidden Valley
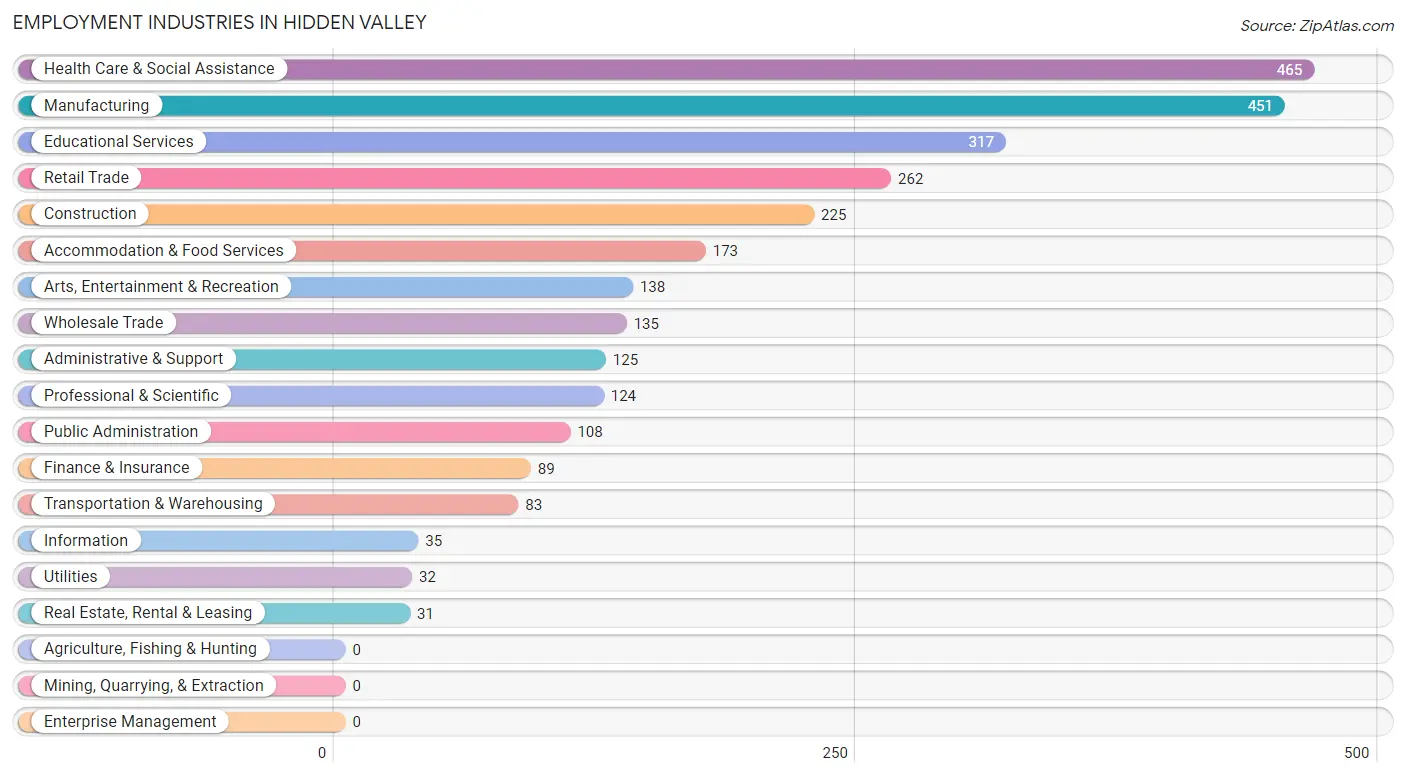
Employment Industries in Hidden Valley
The major employment industries in Hidden Valley include Health Care & Social Assistance (465 | 16.0%), Manufacturing (451 | 15.5%), Educational Services (317 | 10.9%), Retail Trade (262 | 9.0%), and Construction (225 | 7.7%).
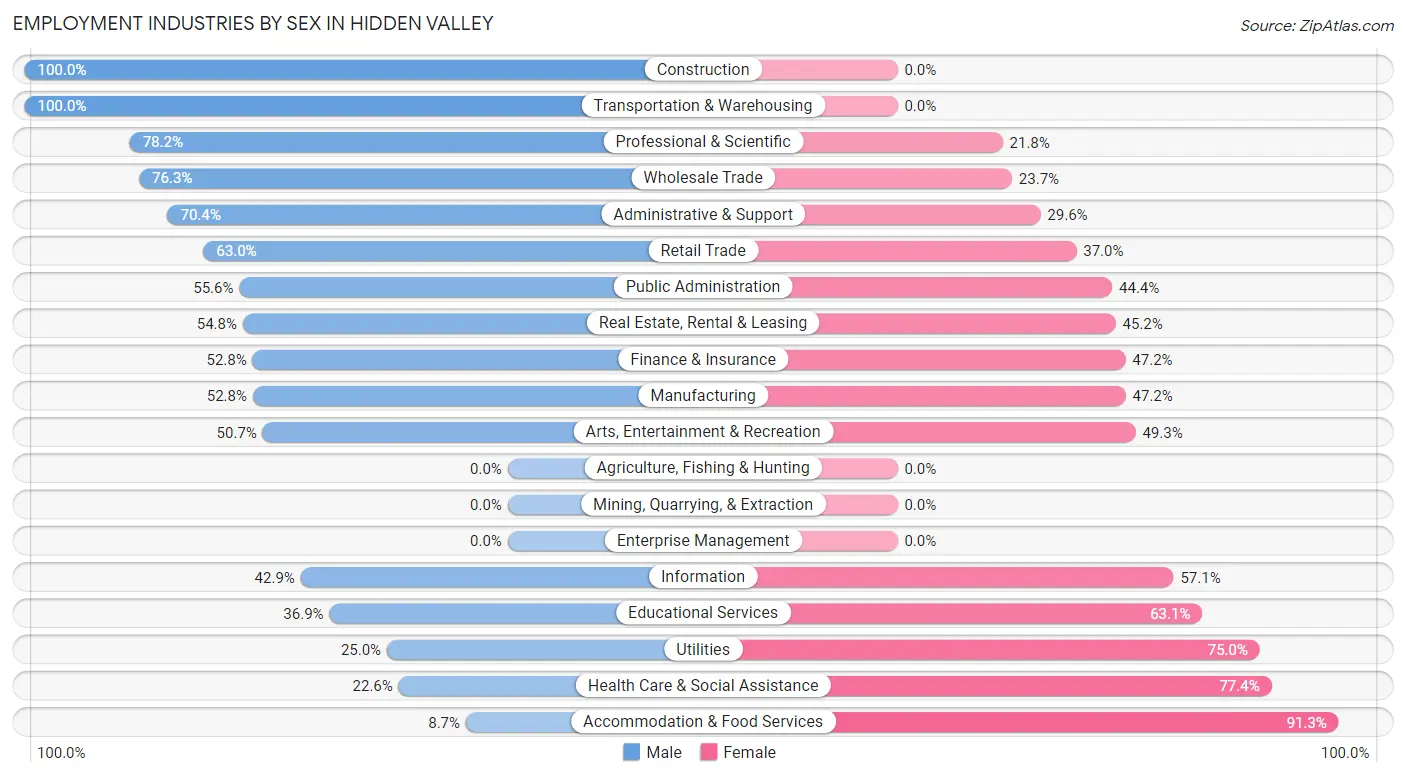
Employment Industries by Sex in Hidden Valley
The Hidden Valley industries that see more men than women are Construction (100.0%), Transportation & Warehousing (100.0%), and Professional & Scientific (78.2%), whereas the industries that tend to have a higher number of women are Accommodation & Food Services (91.3%), Health Care & Social Assistance (77.4%), and Utilities (75.0%).
| Industry | Male | Female |
| Agriculture, Fishing & Hunting | 0 (0.0%) | 0 (0.0%) |
| Mining, Quarrying, & Extraction | 0 (0.0%) | 0 (0.0%) |
| Construction | 225 (100.0%) | 0 (0.0%) |
| Manufacturing | 238 (52.8%) | 213 (47.2%) |
| Wholesale Trade | 103 (76.3%) | 32 (23.7%) |
| Retail Trade | 165 (63.0%) | 97 (37.0%) |
| Transportation & Warehousing | 83 (100.0%) | 0 (0.0%) |
| Utilities | 8 (25.0%) | 24 (75.0%) |
| Information | 15 (42.9%) | 20 (57.1%) |
| Finance & Insurance | 47 (52.8%) | 42 (47.2%) |
| Real Estate, Rental & Leasing | 17 (54.8%) | 14 (45.2%) |
| Professional & Scientific | 97 (78.2%) | 27 (21.8%) |
| Enterprise Management | 0 (0.0%) | 0 (0.0%) |
| Administrative & Support | 88 (70.4%) | 37 (29.6%) |
| Educational Services | 117 (36.9%) | 200 (63.1%) |
| Health Care & Social Assistance | 105 (22.6%) | 360 (77.4%) |
| Arts, Entertainment & Recreation | 70 (50.7%) | 68 (49.3%) |
| Accommodation & Food Services | 15 (8.7%) | 158 (91.3%) |
| Public Administration | 60 (55.6%) | 48 (44.4%) |
| Total | 1,524 (52.5%) | 1,380 (47.5%) |
Education in Hidden Valley
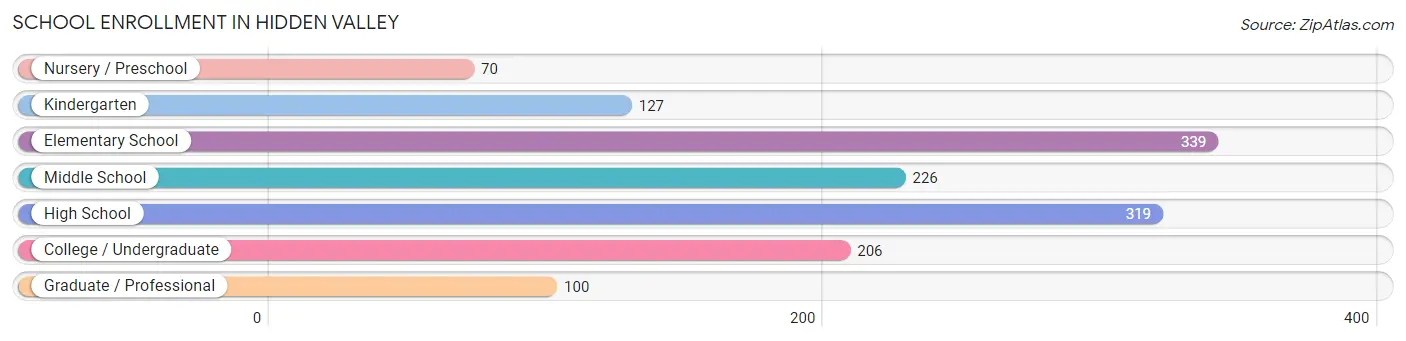
School Enrollment in Hidden Valley
The most common levels of schooling among the 1,387 students in Hidden Valley are elementary school (339 | 24.4%), high school (319 | 23.0%), and middle school (226 | 16.3%).
| School Level | # Students | % Students |
| Nursery / Preschool | 70 | 5.1% |
| Kindergarten | 127 | 9.2% |
| Elementary School | 339 | 24.4% |
| Middle School | 226 | 16.3% |
| High School | 319 | 23.0% |
| College / Undergraduate | 206 | 14.8% |
| Graduate / Professional | 100 | 7.2% |
| Total | 1,387 | 100.0% |
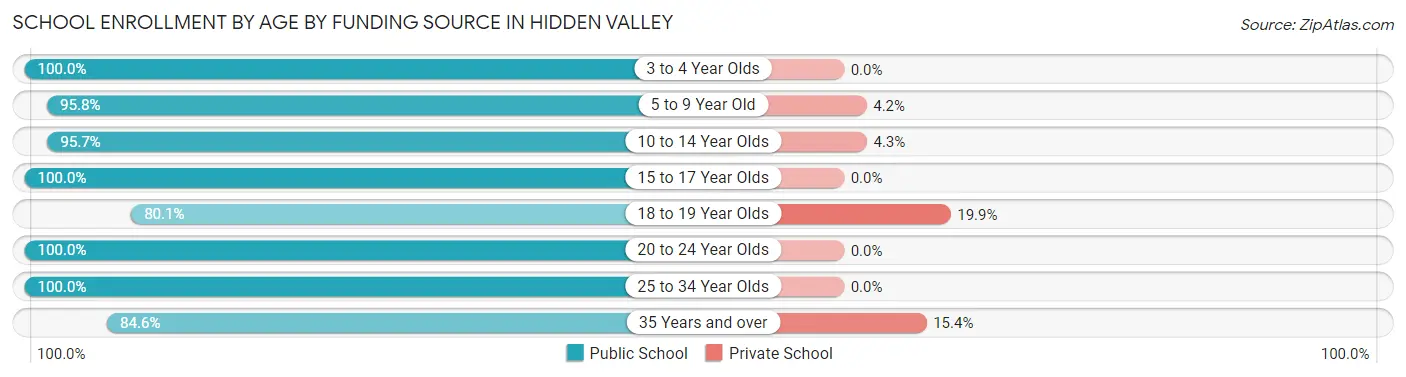
School Enrollment by Age by Funding Source in Hidden Valley
Out of a total of 1,387 students who are enrolled in schools in Hidden Valley, 74 (5.3%) attend a private institution, while the remaining 1,313 (94.7%) are enrolled in public schools. The age group of 18 to 19 year olds has the highest likelihood of being enrolled in private schools, with 29 (19.9% in the age bracket) enrolled. Conversely, the age group of 3 to 4 year olds has the lowest likelihood of being enrolled in a private school, with 39 (100.0% in the age bracket) attending a public institution.
| Age Bracket | Public School | Private School |
| 3 to 4 Year Olds | 39 (100.0%) | 0 (0.0%) |
| 5 to 9 Year Old | 387 (95.8%) | 17 (4.2%) |
| 10 to 14 Year Olds | 337 (95.7%) | 15 (4.3%) |
| 15 to 17 Year Olds | 203 (100.0%) | 0 (0.0%) |
| 18 to 19 Year Olds | 117 (80.1%) | 29 (19.9%) |
| 20 to 24 Year Olds | 67 (100.0%) | 0 (0.0%) |
| 25 to 34 Year Olds | 98 (100.0%) | 0 (0.0%) |
| 35 Years and over | 66 (84.6%) | 12 (15.4%) |
| Total | 1,313 (94.7%) | 74 (5.3%) |
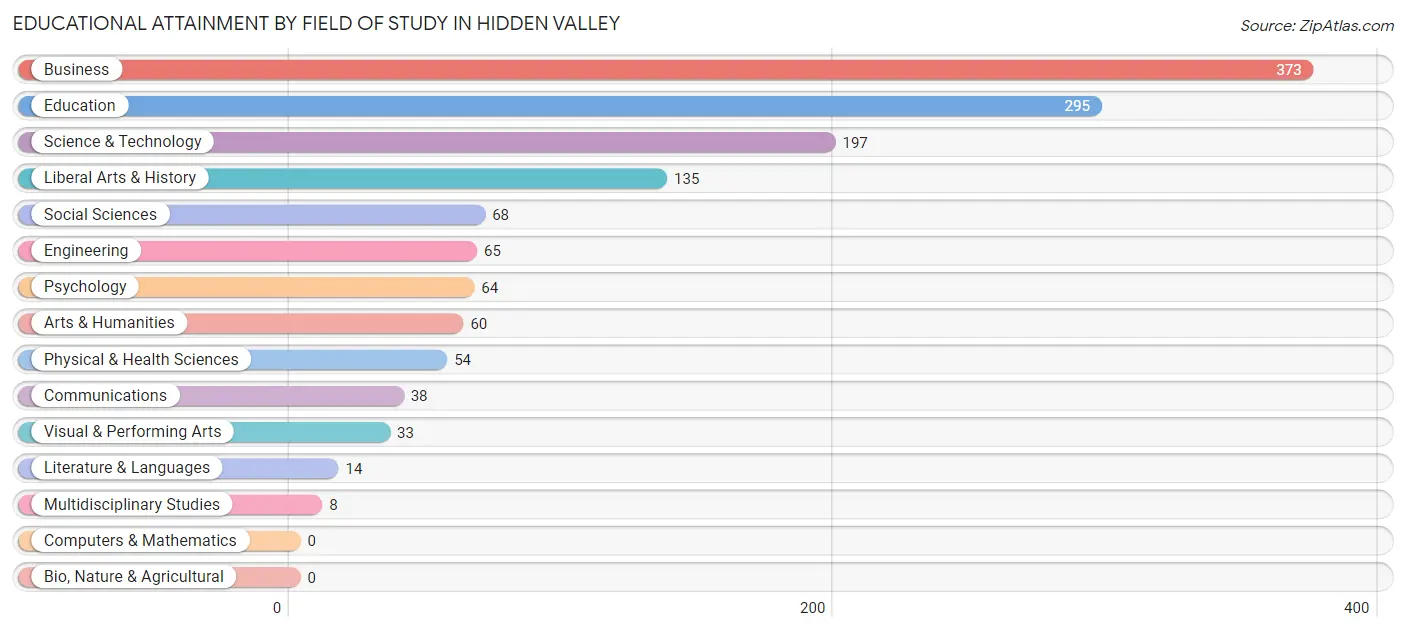
Educational Attainment by Field of Study in Hidden Valley
Business (373 | 26.6%), education (295 | 21.0%), science & technology (197 | 14.0%), liberal arts & history (135 | 9.6%), and social sciences (68 | 4.8%) are the most common fields of study among 1,404 individuals in Hidden Valley who have obtained a bachelor's degree or higher.
| Field of Study | # Graduates | % Graduates |
| Computers & Mathematics | 0 | 0.0% |
| Bio, Nature & Agricultural | 0 | 0.0% |
| Physical & Health Sciences | 54 | 3.8% |
| Psychology | 64 | 4.6% |
| Social Sciences | 68 | 4.8% |
| Engineering | 65 | 4.6% |
| Multidisciplinary Studies | 8 | 0.6% |
| Science & Technology | 197 | 14.0% |
| Business | 373 | 26.6% |
| Education | 295 | 21.0% |
| Literature & Languages | 14 | 1.0% |
| Liberal Arts & History | 135 | 9.6% |
| Visual & Performing Arts | 33 | 2.4% |
| Communications | 38 | 2.7% |
| Arts & Humanities | 60 | 4.3% |
| Total | 1,404 | 100.0% |
Transportation & Commute in Hidden Valley
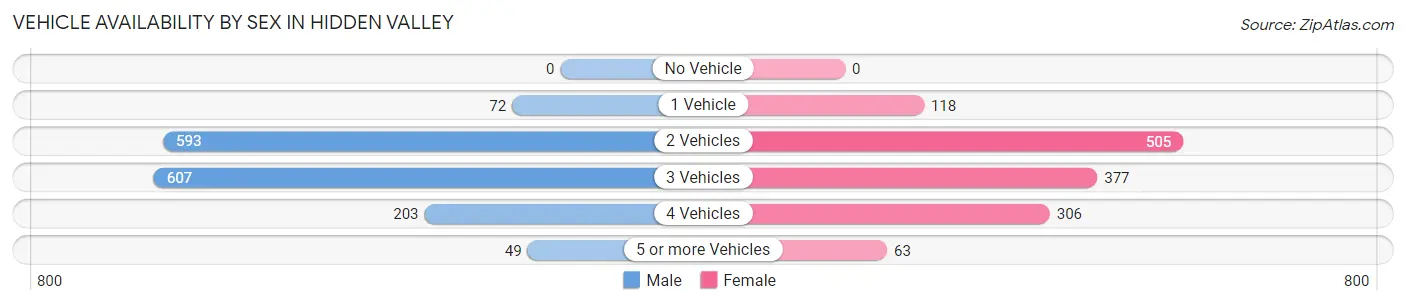
Vehicle Availability by Sex in Hidden Valley
The most prevalent vehicle ownership categories in Hidden Valley are males with 3 vehicles (607, accounting for 39.8%) and females with 3 vehicles (377, making up 44.3%).
| Vehicles Available | Male | Female |
| No Vehicle | 0 (0.0%) | 0 (0.0%) |
| 1 Vehicle | 72 (4.7%) | 118 (8.6%) |
| 2 Vehicles | 593 (38.9%) | 505 (36.9%) |
| 3 Vehicles | 607 (39.8%) | 377 (27.5%) |
| 4 Vehicles | 203 (13.3%) | 306 (22.4%) |
| 5 or more Vehicles | 49 (3.2%) | 63 (4.6%) |
| Total | 1,524 (100.0%) | 1,369 (100.0%) |
Commute Time in Hidden Valley
The most frequently occuring commute durations in Hidden Valley are 30 to 34 minutes (621 commuters, 23.5%), 45 to 59 minutes (340 commuters, 12.9%), and 20 to 24 minutes (312 commuters, 11.8%).
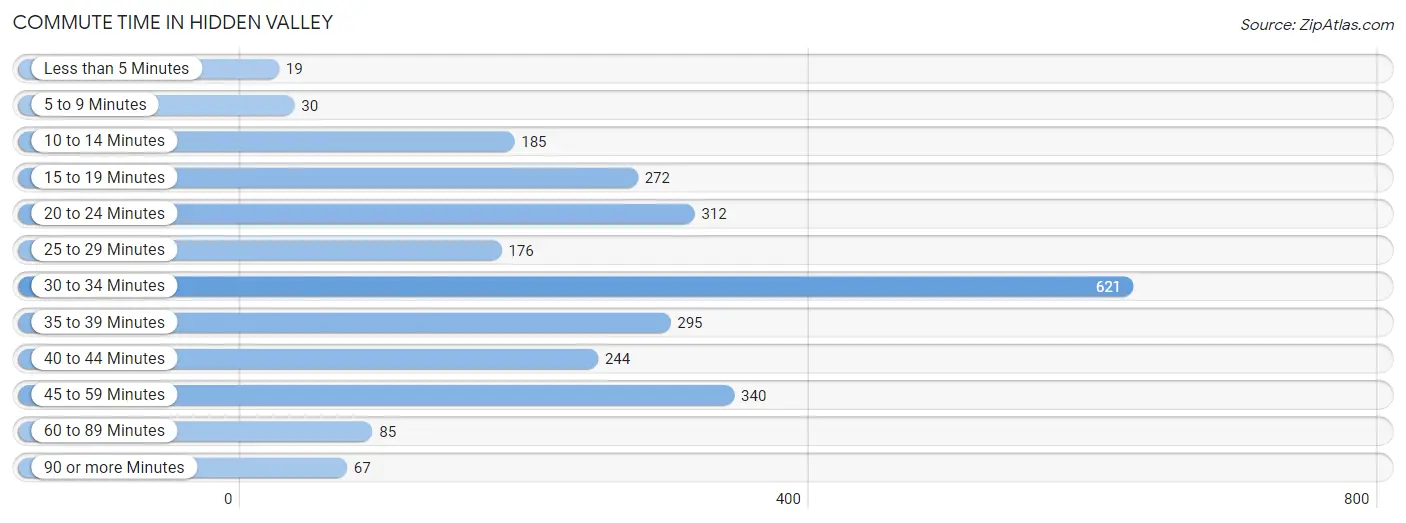
| Commute Time | # Commuters | % Commuters |
| Less than 5 Minutes | 19 | 0.7% |
| 5 to 9 Minutes | 30 | 1.1% |
| 10 to 14 Minutes | 185 | 7.0% |
| 15 to 19 Minutes | 272 | 10.3% |
| 20 to 24 Minutes | 312 | 11.8% |
| 25 to 29 Minutes | 176 | 6.7% |
| 30 to 34 Minutes | 621 | 23.5% |
| 35 to 39 Minutes | 295 | 11.2% |
| 40 to 44 Minutes | 244 | 9.2% |
| 45 to 59 Minutes | 340 | 12.9% |
| 60 to 89 Minutes | 85 | 3.2% |
| 90 or more Minutes | 67 | 2.5% |
Commute Time by Sex in Hidden Valley
The most common commute times in Hidden Valley are 30 to 34 minutes (371 commuters, 27.9%) for males and 30 to 34 minutes (250 commuters, 19.0%) for females.
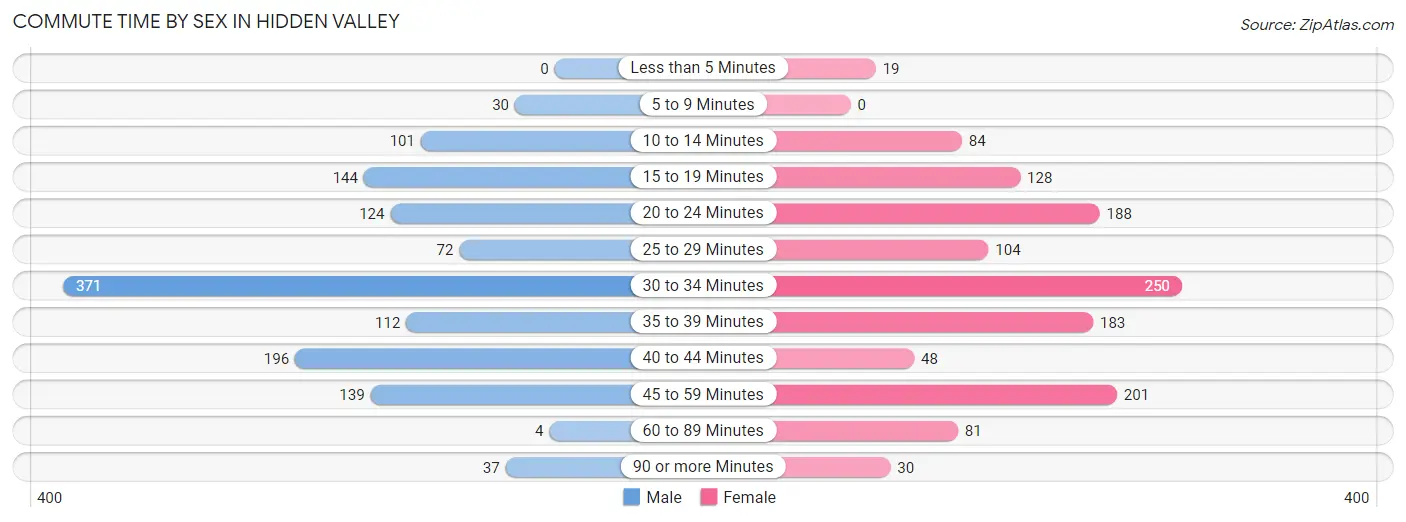
| Commute Time | Male | Female |
| Less than 5 Minutes | 0 (0.0%) | 19 (1.4%) |
| 5 to 9 Minutes | 30 (2.3%) | 0 (0.0%) |
| 10 to 14 Minutes | 101 (7.6%) | 84 (6.4%) |
| 15 to 19 Minutes | 144 (10.8%) | 128 (9.7%) |
| 20 to 24 Minutes | 124 (9.3%) | 188 (14.3%) |
| 25 to 29 Minutes | 72 (5.4%) | 104 (7.9%) |
| 30 to 34 Minutes | 371 (27.9%) | 250 (19.0%) |
| 35 to 39 Minutes | 112 (8.4%) | 183 (13.9%) |
| 40 to 44 Minutes | 196 (14.7%) | 48 (3.6%) |
| 45 to 59 Minutes | 139 (10.4%) | 201 (15.3%) |
| 60 to 89 Minutes | 4 (0.3%) | 81 (6.2%) |
| 90 or more Minutes | 37 (2.8%) | 30 (2.3%) |
Time of Departure to Work by Sex in Hidden Valley
The most frequent times of departure to work in Hidden Valley are 6:00 AM to 6:29 AM (222, 16.7%) for males and 7:30 AM to 7:59 AM (315, 23.9%) for females.
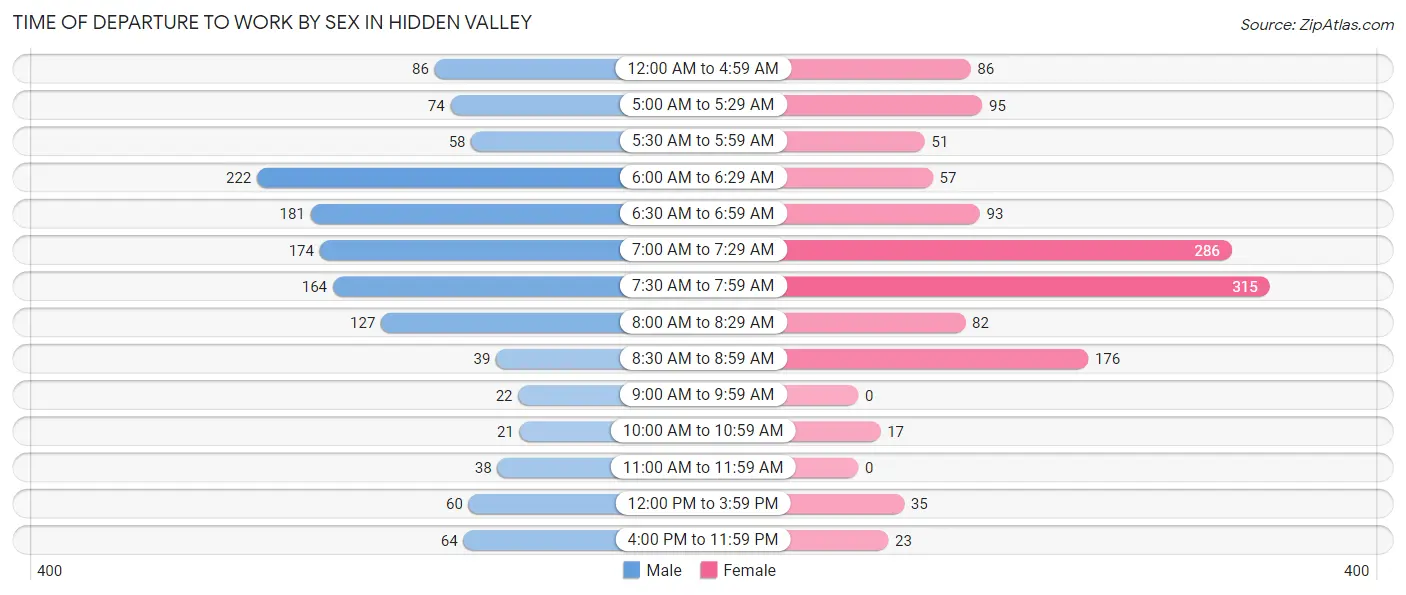
| Time of Departure | Male | Female |
| 12:00 AM to 4:59 AM | 86 (6.5%) | 86 (6.5%) |
| 5:00 AM to 5:29 AM | 74 (5.6%) | 95 (7.2%) |
| 5:30 AM to 5:59 AM | 58 (4.4%) | 51 (3.9%) |
| 6:00 AM to 6:29 AM | 222 (16.7%) | 57 (4.3%) |
| 6:30 AM to 6:59 AM | 181 (13.6%) | 93 (7.1%) |
| 7:00 AM to 7:29 AM | 174 (13.1%) | 286 (21.7%) |
| 7:30 AM to 7:59 AM | 164 (12.3%) | 315 (23.9%) |
| 8:00 AM to 8:29 AM | 127 (9.6%) | 82 (6.2%) |
| 8:30 AM to 8:59 AM | 39 (2.9%) | 176 (13.4%) |
| 9:00 AM to 9:59 AM | 22 (1.7%) | 0 (0.0%) |
| 10:00 AM to 10:59 AM | 21 (1.6%) | 17 (1.3%) |
| 11:00 AM to 11:59 AM | 38 (2.9%) | 0 (0.0%) |
| 12:00 PM to 3:59 PM | 60 (4.5%) | 35 (2.7%) |
| 4:00 PM to 11:59 PM | 64 (4.8%) | 23 (1.8%) |
| Total | 1,330 (100.0%) | 1,316 (100.0%) |
Housing Occupancy in Hidden Valley
Occupancy by Ownership in Hidden Valley
Of the total 1,866 dwellings in Hidden Valley, owner-occupied units account for 1,793 (96.1%), while renter-occupied units make up 73 (3.9%).
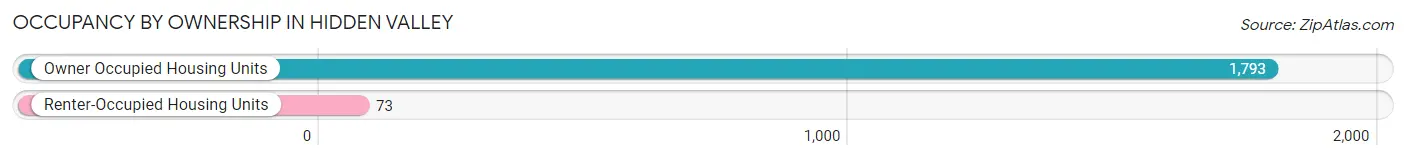
| Occupancy | # Housing Units | % Housing Units |
| Owner Occupied Housing Units | 1,793 | 96.1% |
| Renter-Occupied Housing Units | 73 | 3.9% |
| Total Occupied Housing Units | 1,866 | 100.0% |
Occupancy by Household Size in Hidden Valley
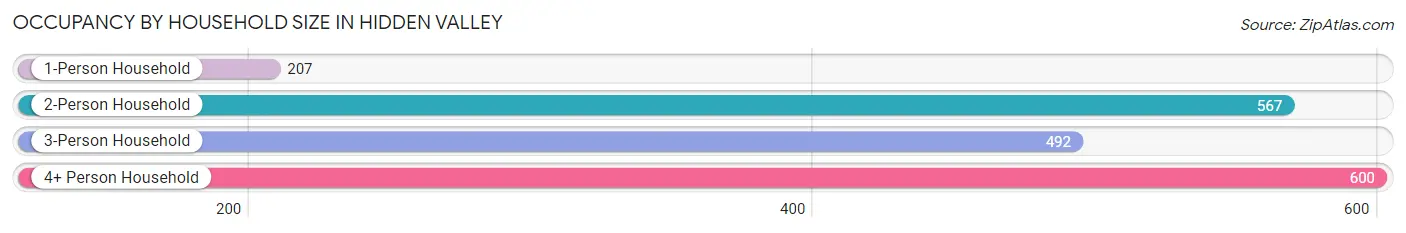
| Household Size | # Housing Units | % Housing Units |
| 1-Person Household | 207 | 11.1% |
| 2-Person Household | 567 | 30.4% |
| 3-Person Household | 492 | 26.4% |
| 4+ Person Household | 600 | 32.2% |
| Total Housing Units | 1,866 | 100.0% |
Occupancy by Ownership by Household Size in Hidden Valley
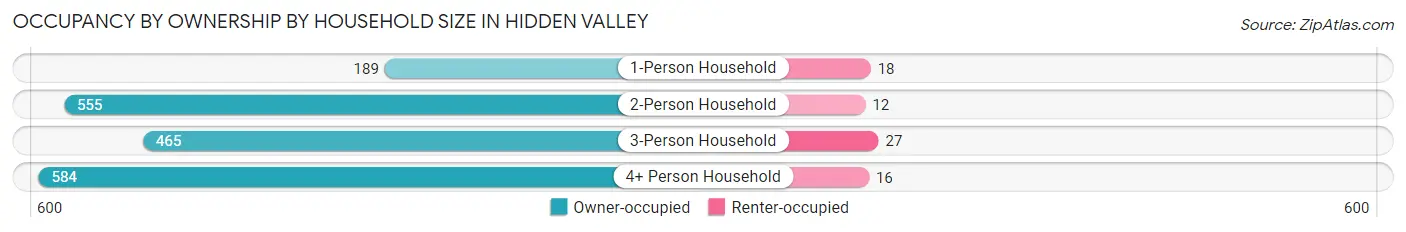
| Household Size | Owner-occupied | Renter-occupied |
| 1-Person Household | 189 (91.3%) | 18 (8.7%) |
| 2-Person Household | 555 (97.9%) | 12 (2.1%) |
| 3-Person Household | 465 (94.5%) | 27 (5.5%) |
| 4+ Person Household | 584 (97.3%) | 16 (2.7%) |
| Total Housing Units | 1,793 (96.1%) | 73 (3.9%) |
Occupancy by Educational Attainment in Hidden Valley
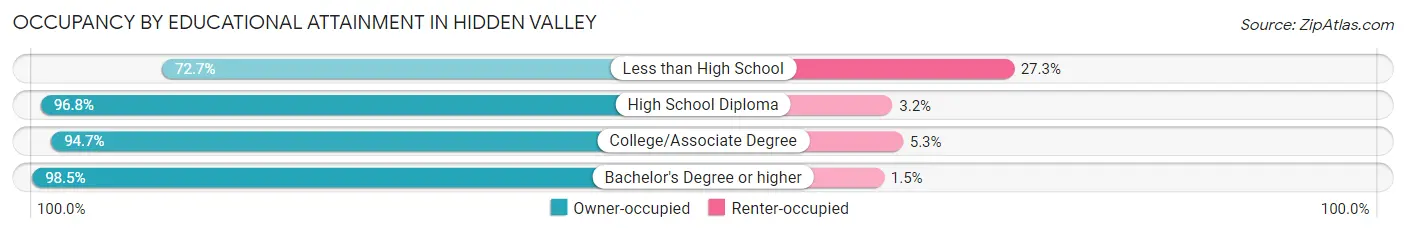
| Household Size | Owner-occupied | Renter-occupied |
| Less than High School | 48 (72.7%) | 18 (27.3%) |
| High School Diploma | 484 (96.8%) | 16 (3.2%) |
| College/Associate Degree | 484 (94.7%) | 27 (5.3%) |
| Bachelor's Degree or higher | 777 (98.5%) | 12 (1.5%) |
Occupancy by Age of Householder in Hidden Valley
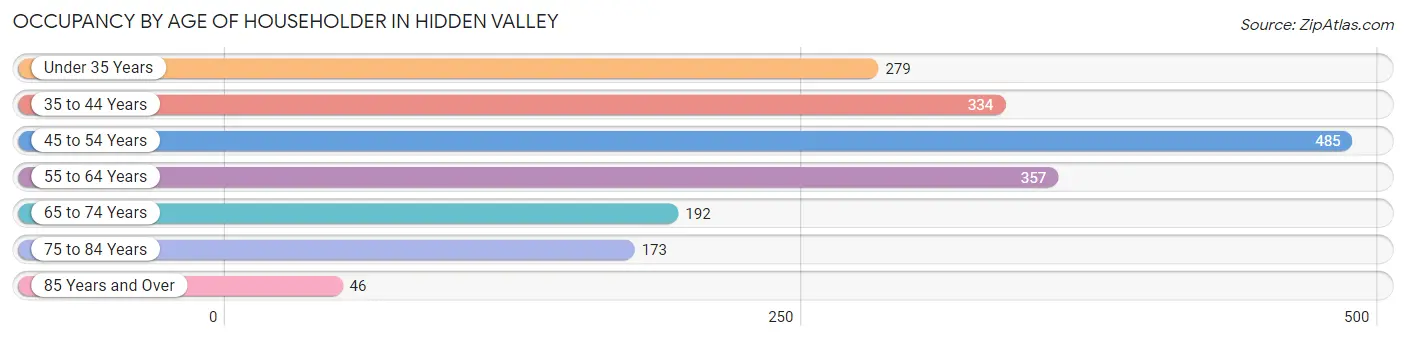
| Age Bracket | # Households | % Households |
| Under 35 Years | 279 | 14.9% |
| 35 to 44 Years | 334 | 17.9% |
| 45 to 54 Years | 485 | 26.0% |
| 55 to 64 Years | 357 | 19.1% |
| 65 to 74 Years | 192 | 10.3% |
| 75 to 84 Years | 173 | 9.3% |
| 85 Years and Over | 46 | 2.5% |
| Total | 1,866 | 100.0% |
Housing Finances in Hidden Valley
Median Income by Occupancy in Hidden Valley
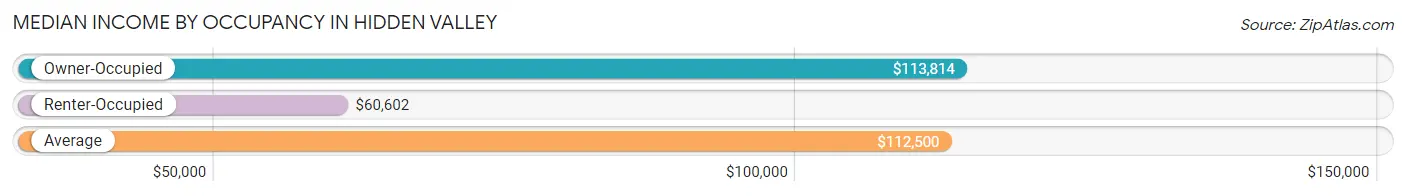
| Occupancy Type | # Households | Median Income |
| Owner-Occupied | 1,793 (96.1%) | $113,814 |
| Renter-Occupied | 73 (3.9%) | $60,602 |
| Average | 1,866 (100.0%) | $112,500 |
Occupancy by Householder Income Bracket in Hidden Valley
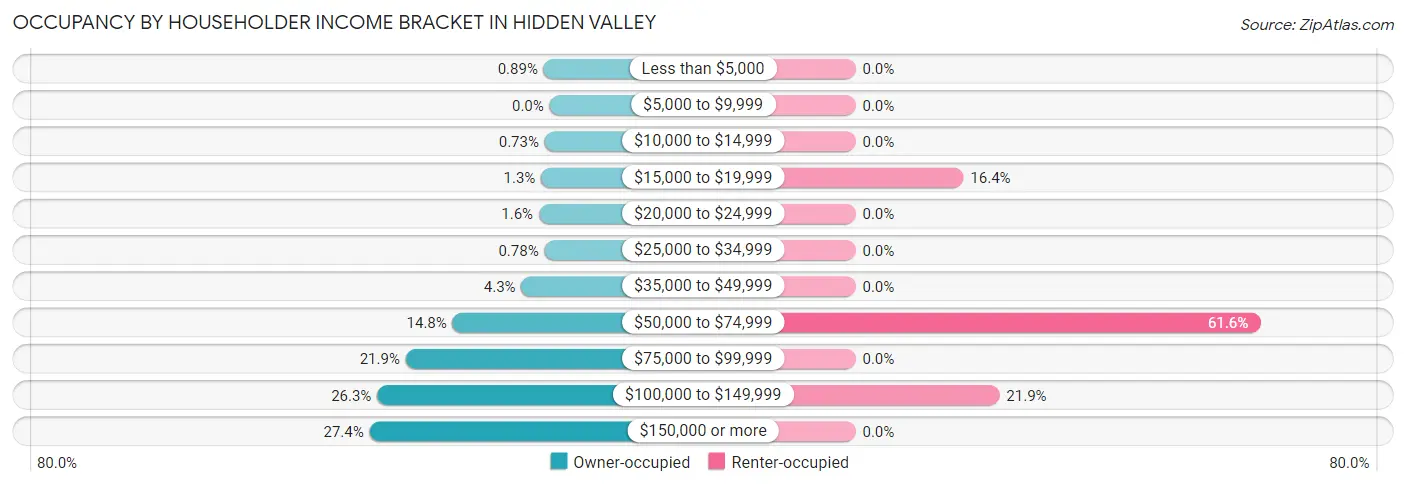
| Income Bracket | Owner-occupied | Renter-occupied |
| Less than $5,000 | 16 (0.9%) | 0 (0.0%) |
| $5,000 to $9,999 | 0 (0.0%) | 0 (0.0%) |
| $10,000 to $14,999 | 13 (0.7%) | 0 (0.0%) |
| $15,000 to $19,999 | 23 (1.3%) | 12 (16.4%) |
| $20,000 to $24,999 | 29 (1.6%) | 0 (0.0%) |
| $25,000 to $34,999 | 14 (0.8%) | 0 (0.0%) |
| $35,000 to $49,999 | 77 (4.3%) | 0 (0.0%) |
| $50,000 to $74,999 | 265 (14.8%) | 45 (61.6%) |
| $75,000 to $99,999 | 393 (21.9%) | 0 (0.0%) |
| $100,000 to $149,999 | 471 (26.3%) | 16 (21.9%) |
| $150,000 or more | 492 (27.4%) | 0 (0.0%) |
| Total | 1,793 (100.0%) | 73 (100.0%) |
Monthly Housing Cost Tiers in Hidden Valley
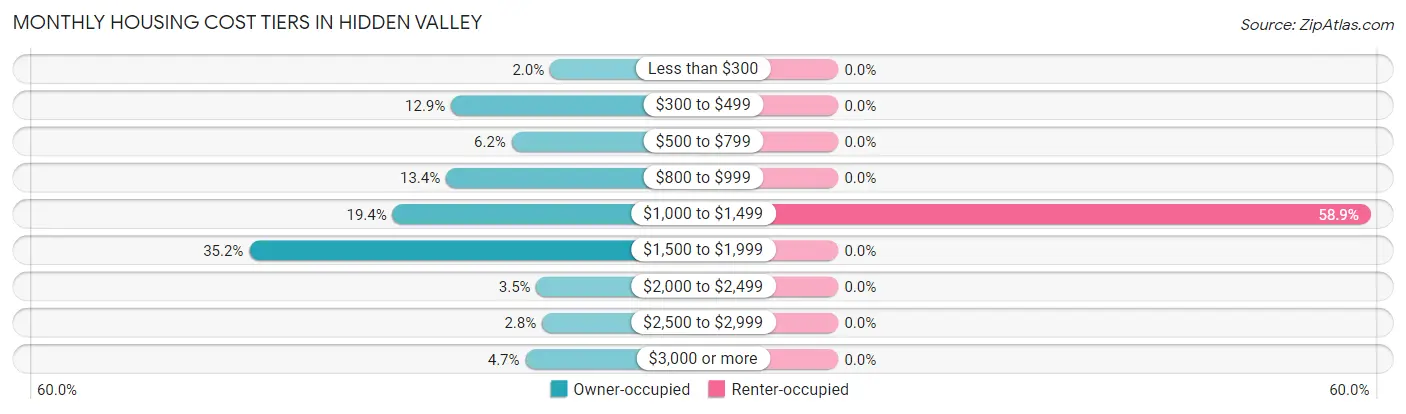
| Monthly Cost | Owner-occupied | Renter-occupied |
| Less than $300 | 35 (1.9%) | 0 (0.0%) |
| $300 to $499 | 231 (12.9%) | 0 (0.0%) |
| $500 to $799 | 111 (6.2%) | 0 (0.0%) |
| $800 to $999 | 241 (13.4%) | 0 (0.0%) |
| $1,000 to $1,499 | 347 (19.4%) | 43 (58.9%) |
| $1,500 to $1,999 | 631 (35.2%) | 0 (0.0%) |
| $2,000 to $2,499 | 62 (3.5%) | 0 (0.0%) |
| $2,500 to $2,999 | 51 (2.8%) | 0 (0.0%) |
| $3,000 or more | 84 (4.7%) | 0 (0.0%) |
| Total | 1,793 (100.0%) | 73 (100.0%) |
Physical Housing Characteristics in Hidden Valley
Housing Structures in Hidden Valley
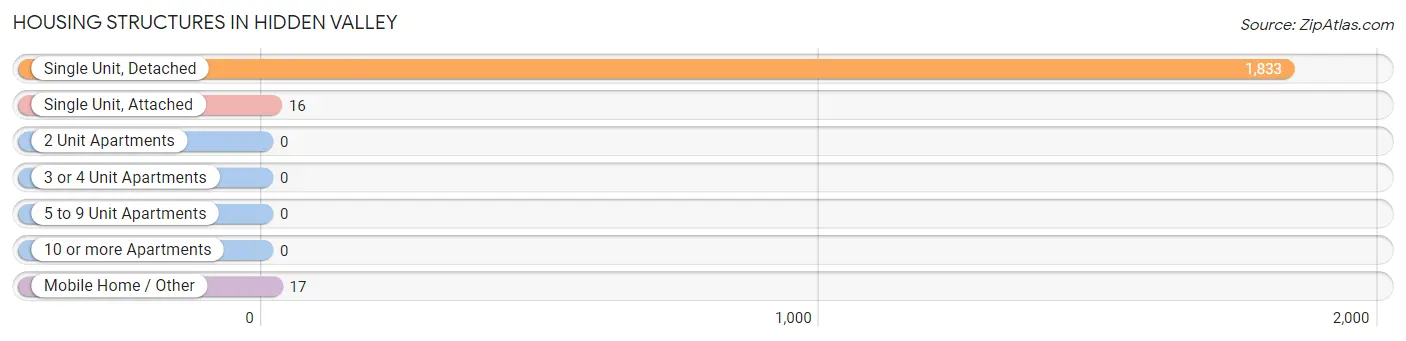
| Structure Type | # Housing Units | % Housing Units |
| Single Unit, Detached | 1,833 | 98.2% |
| Single Unit, Attached | 16 | 0.9% |
| 2 Unit Apartments | 0 | 0.0% |
| 3 or 4 Unit Apartments | 0 | 0.0% |
| 5 to 9 Unit Apartments | 0 | 0.0% |
| 10 or more Apartments | 0 | 0.0% |
| Mobile Home / Other | 17 | 0.9% |
| Total | 1,866 | 100.0% |
Housing Structures by Occupancy in Hidden Valley
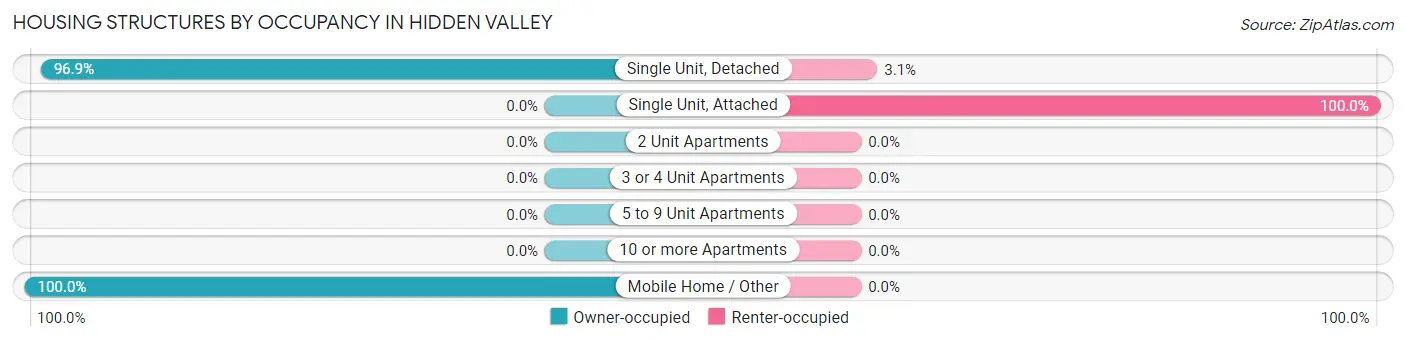
| Structure Type | Owner-occupied | Renter-occupied |
| Single Unit, Detached | 1,776 (96.9%) | 57 (3.1%) |
| Single Unit, Attached | 0 (0.0%) | 16 (100.0%) |
| 2 Unit Apartments | 0 (0.0%) | 0 (0.0%) |
| 3 or 4 Unit Apartments | 0 (0.0%) | 0 (0.0%) |
| 5 to 9 Unit Apartments | 0 (0.0%) | 0 (0.0%) |
| 10 or more Apartments | 0 (0.0%) | 0 (0.0%) |
| Mobile Home / Other | 17 (100.0%) | 0 (0.0%) |
| Total | 1,793 (96.1%) | 73 (3.9%) |
Housing Structures by Number of Rooms in Hidden Valley
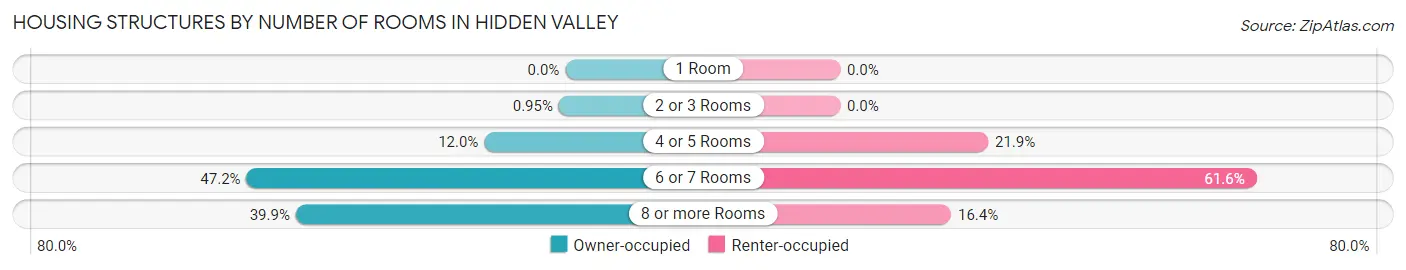
| Number of Rooms | Owner-occupied | Renter-occupied |
| 1 Room | 0 (0.0%) | 0 (0.0%) |
| 2 or 3 Rooms | 17 (0.9%) | 0 (0.0%) |
| 4 or 5 Rooms | 215 (12.0%) | 16 (21.9%) |
| 6 or 7 Rooms | 846 (47.2%) | 45 (61.6%) |
| 8 or more Rooms | 715 (39.9%) | 12 (16.4%) |
| Total | 1,793 (100.0%) | 73 (100.0%) |
Housing Structure by Heating Type in Hidden Valley
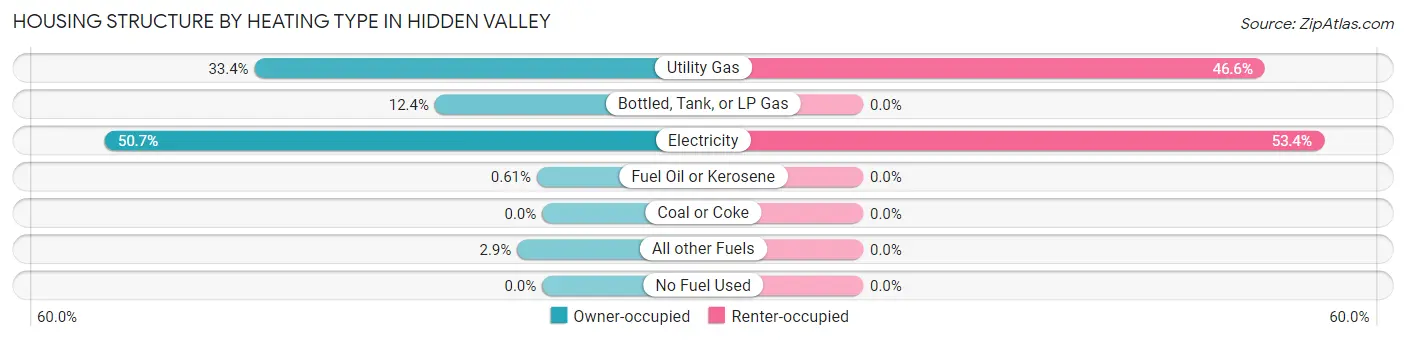
| Heating Type | Owner-occupied | Renter-occupied |
| Utility Gas | 598 (33.4%) | 34 (46.6%) |
| Bottled, Tank, or LP Gas | 223 (12.4%) | 0 (0.0%) |
| Electricity | 909 (50.7%) | 39 (53.4%) |
| Fuel Oil or Kerosene | 11 (0.6%) | 0 (0.0%) |
| Coal or Coke | 0 (0.0%) | 0 (0.0%) |
| All other Fuels | 52 (2.9%) | 0 (0.0%) |
| No Fuel Used | 0 (0.0%) | 0 (0.0%) |
| Total | 1,793 (100.0%) | 73 (100.0%) |
Household Vehicle Usage in Hidden Valley
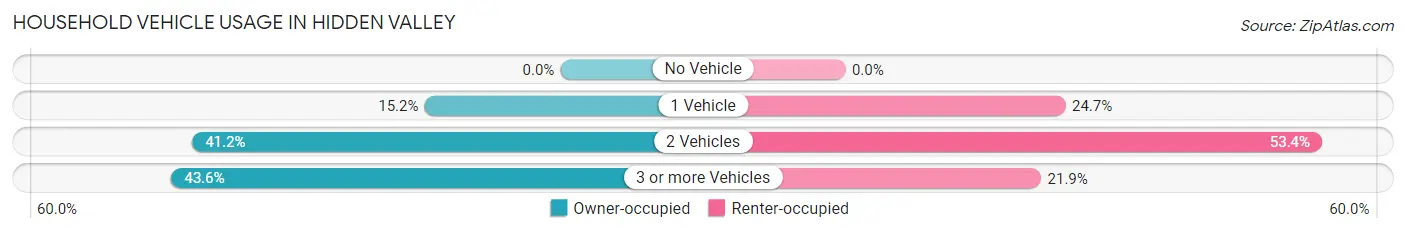
| Vehicles per Household | Owner-occupied | Renter-occupied |
| No Vehicle | 0 (0.0%) | 0 (0.0%) |
| 1 Vehicle | 273 (15.2%) | 18 (24.7%) |
| 2 Vehicles | 739 (41.2%) | 39 (53.4%) |
| 3 or more Vehicles | 781 (43.6%) | 16 (21.9%) |
| Total | 1,793 (100.0%) | 73 (100.0%) |
Real Estate & Mortgages in Hidden Valley
Real Estate and Mortgage Overview in Hidden Valley
| Characteristic | Without Mortgage | With Mortgage |
| Housing Units | 378 | 1,415 |
| Median Property Value | $187,500 | $243,600 |
| Median Household Income | $81,008 | $469 |
| Monthly Housing Costs | $405 | $84 |
| Real Estate Taxes | $1,436 | $0 |
Property Value by Mortgage Status in Hidden Valley
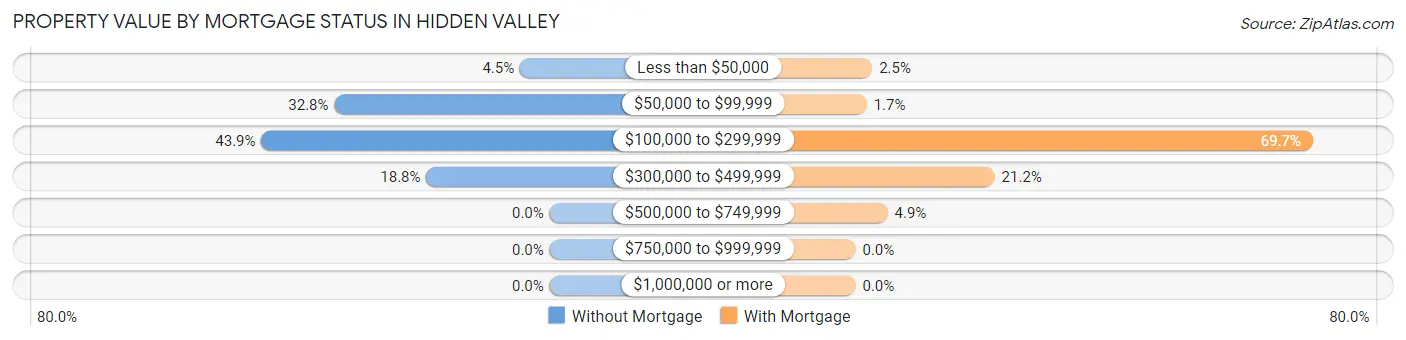
| Property Value | Without Mortgage | With Mortgage |
| Less than $50,000 | 17 (4.5%) | 36 (2.5%) |
| $50,000 to $99,999 | 124 (32.8%) | 24 (1.7%) |
| $100,000 to $299,999 | 166 (43.9%) | 986 (69.7%) |
| $300,000 to $499,999 | 71 (18.8%) | 300 (21.2%) |
| $500,000 to $749,999 | 0 (0.0%) | 69 (4.9%) |
| $750,000 to $999,999 | 0 (0.0%) | 0 (0.0%) |
| $1,000,000 or more | 0 (0.0%) | 0 (0.0%) |
| Total | 378 (100.0%) | 1,415 (100.0%) |
Household Income by Mortgage Status in Hidden Valley
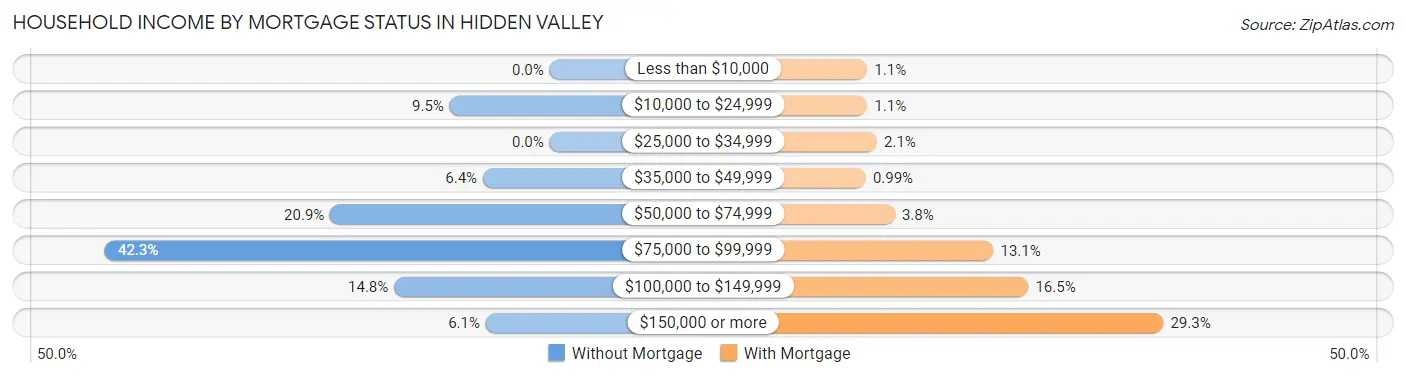
| Household Income | Without Mortgage | With Mortgage |
| Less than $10,000 | 0 (0.0%) | 16 (1.1%) |
| $10,000 to $24,999 | 36 (9.5%) | 16 (1.1%) |
| $25,000 to $34,999 | 0 (0.0%) | 29 (2.1%) |
| $35,000 to $49,999 | 24 (6.4%) | 14 (1.0%) |
| $50,000 to $74,999 | 79 (20.9%) | 53 (3.7%) |
| $75,000 to $99,999 | 160 (42.3%) | 186 (13.1%) |
| $100,000 to $149,999 | 56 (14.8%) | 233 (16.5%) |
| $150,000 or more | 23 (6.1%) | 415 (29.3%) |
| Total | 378 (100.0%) | 1,415 (100.0%) |
Property Value to Household Income Ratio in Hidden Valley
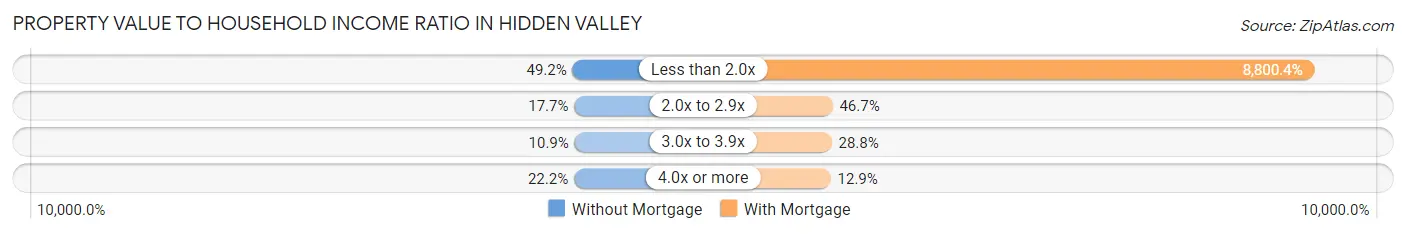
| Value-to-Income Ratio | Without Mortgage | With Mortgage |
| Less than 2.0x | 186 (49.2%) | 124,526 (8,800.4%) |
| 2.0x to 2.9x | 67 (17.7%) | 661 (46.7%) |
| 3.0x to 3.9x | 41 (10.8%) | 407 (28.8%) |
| 4.0x or more | 84 (22.2%) | 183 (12.9%) |
| Total | 378 (100.0%) | 1,415 (100.0%) |
Real Estate Taxes by Mortgage Status in Hidden Valley
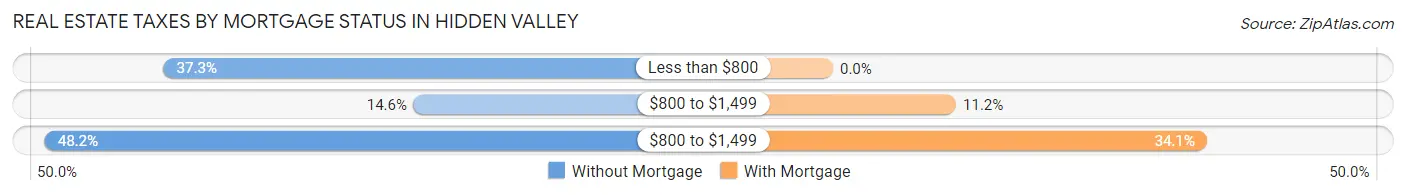
| Property Taxes | Without Mortgage | With Mortgage |
| Less than $800 | 141 (37.3%) | 0 (0.0%) |
| $800 to $1,499 | 55 (14.5%) | 159 (11.2%) |
| $800 to $1,499 | 182 (48.1%) | 483 (34.1%) |
| Total | 378 (100.0%) | 1,415 (100.0%) |
Health & Disability in Hidden Valley
Health Insurance Coverage by Age in Hidden Valley
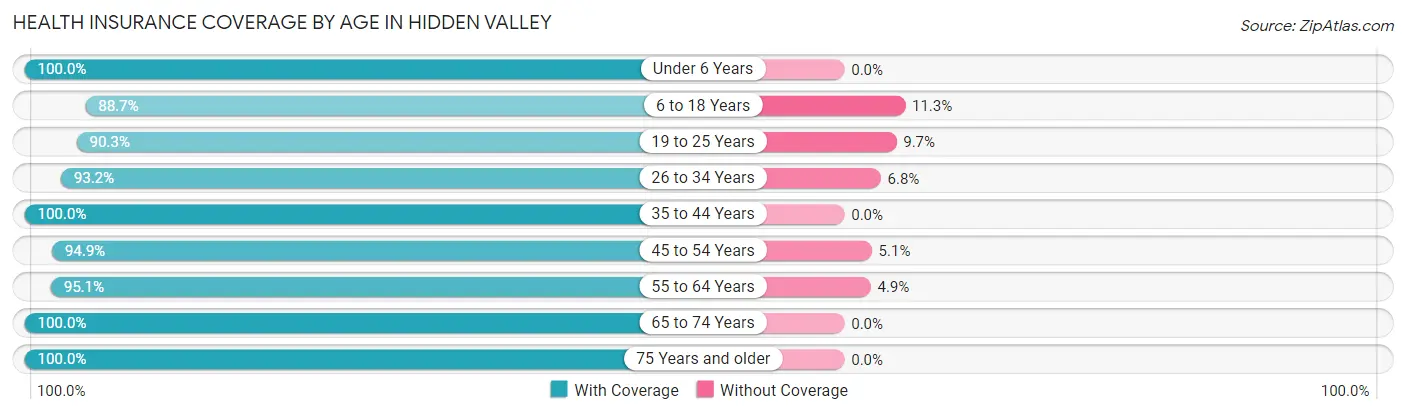
| Age Bracket | With Coverage | Without Coverage |
| Under 6 Years | 440 (100.0%) | 0 (0.0%) |
| 6 to 18 Years | 838 (88.7%) | 107 (11.3%) |
| 19 to 25 Years | 382 (90.3%) | 41 (9.7%) |
| 26 to 34 Years | 592 (93.2%) | 43 (6.8%) |
| 35 to 44 Years | 732 (100.0%) | 0 (0.0%) |
| 45 to 54 Years | 911 (94.9%) | 49 (5.1%) |
| 55 to 64 Years | 662 (95.1%) | 34 (4.9%) |
| 65 to 74 Years | 350 (100.0%) | 0 (0.0%) |
| 75 Years and older | 379 (100.0%) | 0 (0.0%) |
| Total | 5,286 (95.1%) | 274 (4.9%) |
Health Insurance Coverage by Citizenship Status in Hidden Valley
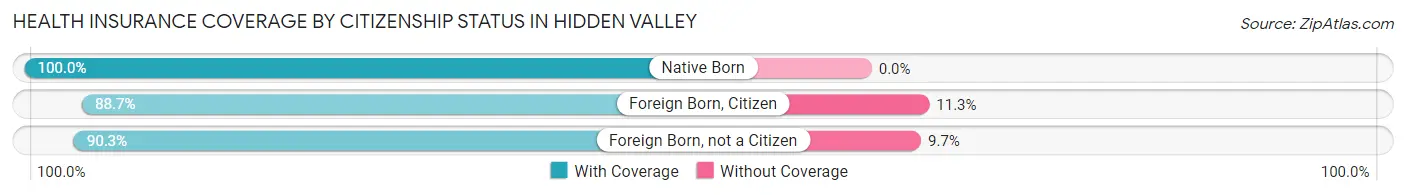
| Citizenship Status | With Coverage | Without Coverage |
| Native Born | 440 (100.0%) | 0 (0.0%) |
| Foreign Born, Citizen | 838 (88.7%) | 107 (11.3%) |
| Foreign Born, not a Citizen | 382 (90.3%) | 41 (9.7%) |
Health Insurance Coverage by Household Income in Hidden Valley
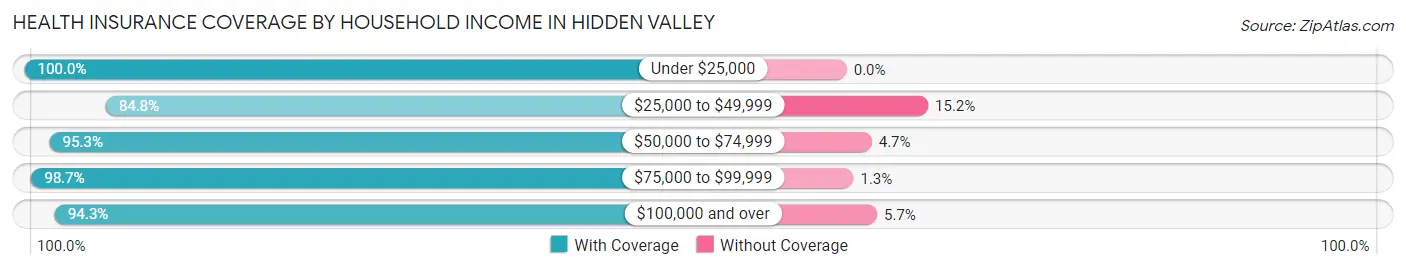
| Household Income | With Coverage | Without Coverage |
| Under $25,000 | 103 (100.0%) | 0 (0.0%) |
| $25,000 to $49,999 | 217 (84.8%) | 39 (15.2%) |
| $50,000 to $74,999 | 774 (95.3%) | 38 (4.7%) |
| $75,000 to $99,999 | 1,171 (98.7%) | 15 (1.3%) |
| $100,000 and over | 3,021 (94.3%) | 182 (5.7%) |
Public vs Private Health Insurance Coverage by Age in Hidden Valley
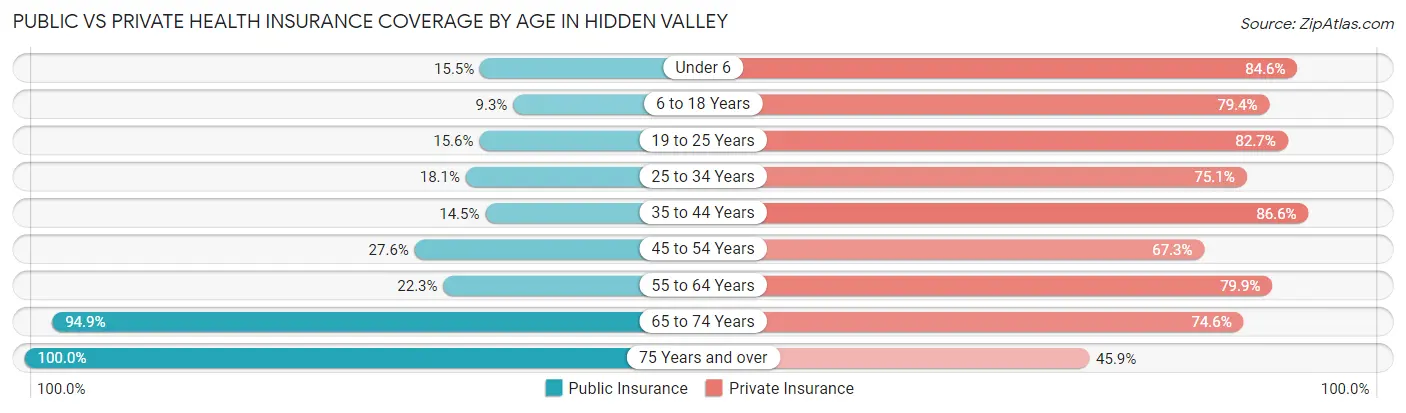
| Age Bracket | Public Insurance | Private Insurance |
| Under 6 | 68 (15.4%) | 372 (84.6%) |
| 6 to 18 Years | 88 (9.3%) | 750 (79.4%) |
| 19 to 25 Years | 66 (15.6%) | 350 (82.7%) |
| 25 to 34 Years | 115 (18.1%) | 477 (75.1%) |
| 35 to 44 Years | 106 (14.5%) | 634 (86.6%) |
| 45 to 54 Years | 265 (27.6%) | 646 (67.3%) |
| 55 to 64 Years | 155 (22.3%) | 556 (79.9%) |
| 65 to 74 Years | 332 (94.9%) | 261 (74.6%) |
| 75 Years and over | 379 (100.0%) | 174 (45.9%) |
| Total | 1,574 (28.3%) | 4,220 (75.9%) |
Disability Status by Sex by Age in Hidden Valley
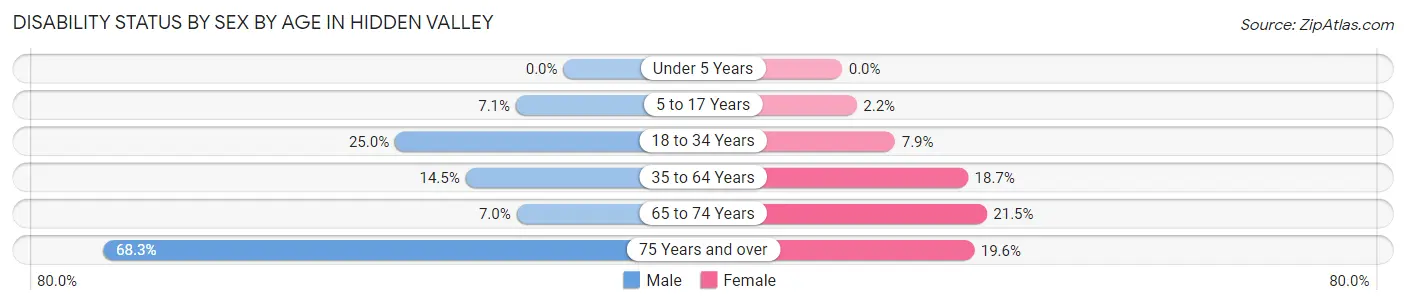
| Age Bracket | Male | Female |
| Under 5 Years | 0 (0.0%) | 0 (0.0%) |
| 5 to 17 Years | 32 (7.0%) | 12 (2.2%) |
| 18 to 34 Years | 137 (25.0%) | 47 (7.9%) |
| 35 to 64 Years | 175 (14.5%) | 221 (18.7%) |
| 65 to 74 Years | 13 (7.0%) | 35 (21.5%) |
| 75 Years and over | 123 (68.3%) | 39 (19.6%) |
Disability Class by Sex by Age in Hidden Valley
Disability Class: Hearing Difficulty
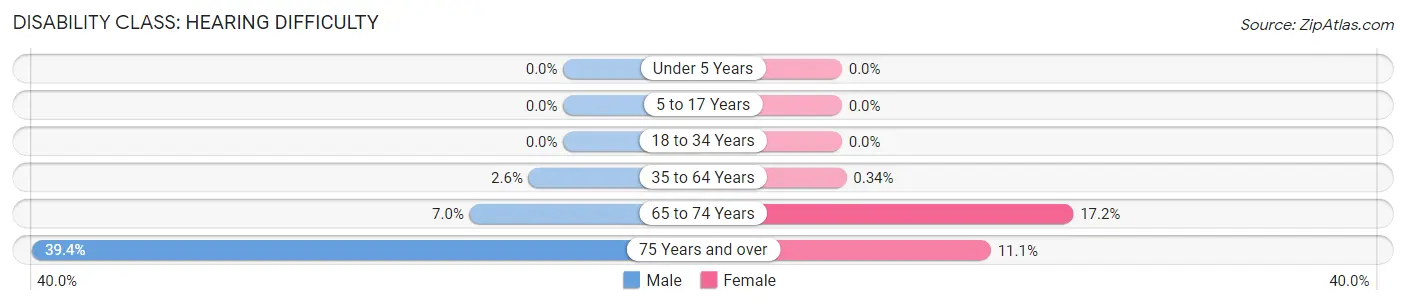
| Age Bracket | Male | Female |
| Under 5 Years | 0 (0.0%) | 0 (0.0%) |
| 5 to 17 Years | 0 (0.0%) | 0 (0.0%) |
| 18 to 34 Years | 0 (0.0%) | 0 (0.0%) |
| 35 to 64 Years | 31 (2.6%) | 4 (0.3%) |
| 65 to 74 Years | 13 (7.0%) | 28 (17.2%) |
| 75 Years and over | 71 (39.4%) | 22 (11.1%) |
Disability Class: Vision Difficulty
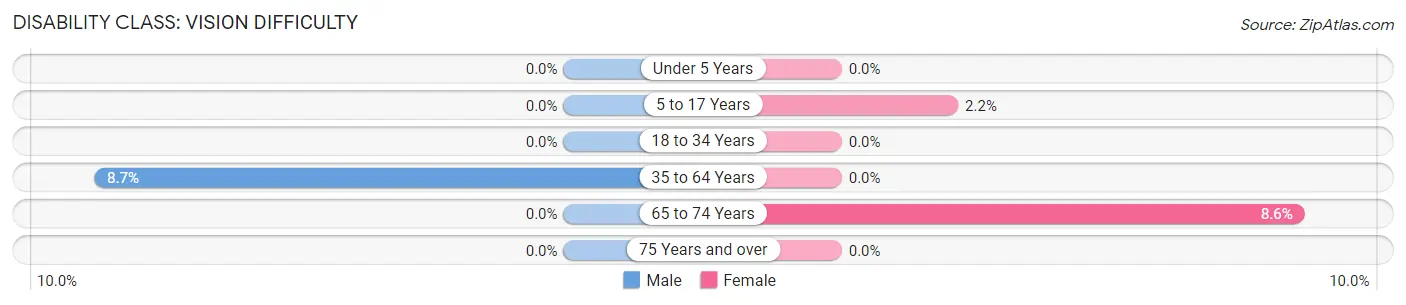
| Age Bracket | Male | Female |
| Under 5 Years | 0 (0.0%) | 0 (0.0%) |
| 5 to 17 Years | 0 (0.0%) | 12 (2.2%) |
| 18 to 34 Years | 0 (0.0%) | 0 (0.0%) |
| 35 to 64 Years | 105 (8.7%) | 0 (0.0%) |
| 65 to 74 Years | 0 (0.0%) | 14 (8.6%) |
| 75 Years and over | 0 (0.0%) | 0 (0.0%) |
Disability Class: Cognitive Difficulty
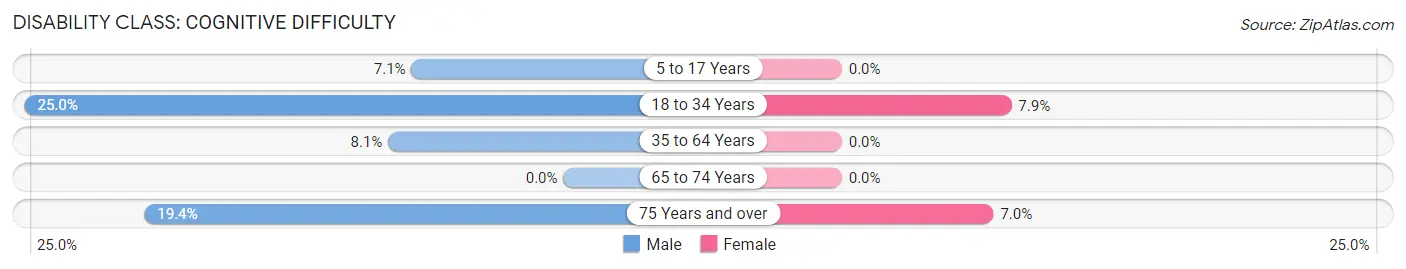
| Age Bracket | Male | Female |
| 5 to 17 Years | 32 (7.0%) | 0 (0.0%) |
| 18 to 34 Years | 137 (25.0%) | 47 (7.9%) |
| 35 to 64 Years | 98 (8.1%) | 0 (0.0%) |
| 65 to 74 Years | 0 (0.0%) | 0 (0.0%) |
| 75 Years and over | 35 (19.4%) | 14 (7.0%) |
Disability Class: Ambulatory Difficulty
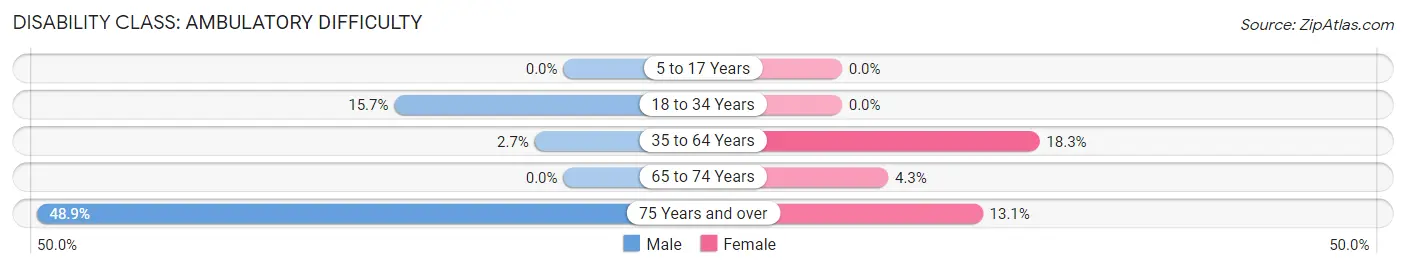
| Age Bracket | Male | Female |
| 5 to 17 Years | 0 (0.0%) | 0 (0.0%) |
| 18 to 34 Years | 86 (15.7%) | 0 (0.0%) |
| 35 to 64 Years | 32 (2.7%) | 217 (18.3%) |
| 65 to 74 Years | 0 (0.0%) | 7 (4.3%) |
| 75 Years and over | 88 (48.9%) | 26 (13.1%) |
Disability Class: Self-Care Difficulty
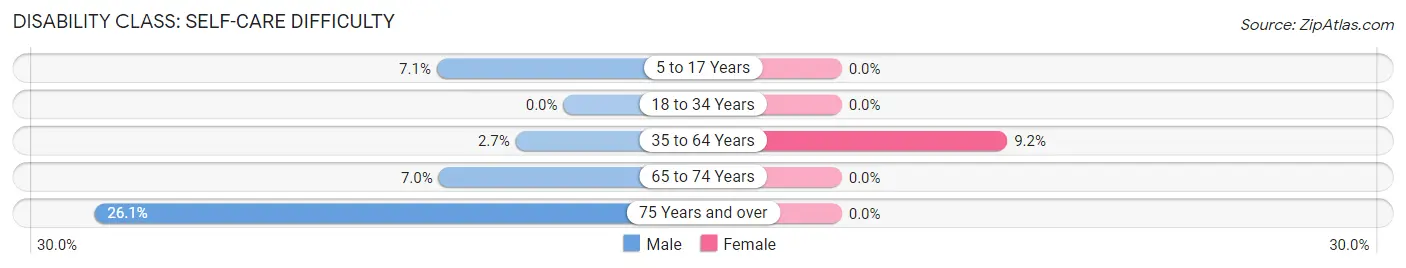
| Age Bracket | Male | Female |
| 5 to 17 Years | 32 (7.0%) | 0 (0.0%) |
| 18 to 34 Years | 0 (0.0%) | 0 (0.0%) |
| 35 to 64 Years | 32 (2.7%) | 109 (9.2%) |
| 65 to 74 Years | 13 (7.0%) | 0 (0.0%) |
| 75 Years and over | 47 (26.1%) | 0 (0.0%) |
Technology Access in Hidden Valley
Computing Device Access in Hidden Valley
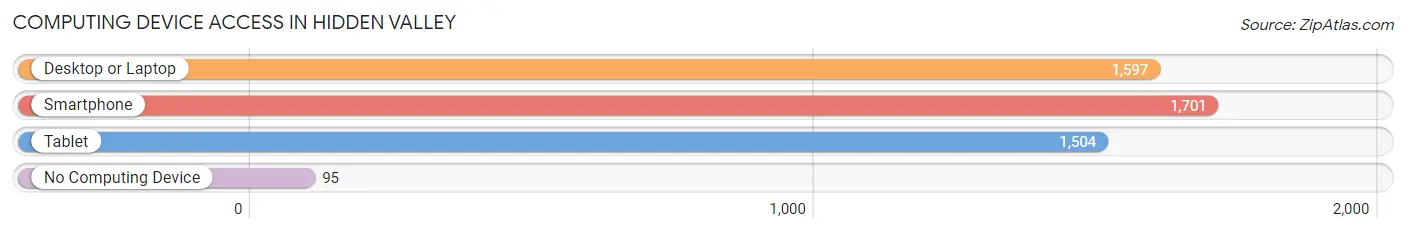
| Device Type | # Households | % Households |
| Desktop or Laptop | 1,597 | 85.6% |
| Smartphone | 1,701 | 91.2% |
| Tablet | 1,504 | 80.6% |
| No Computing Device | 95 | 5.1% |
| Total | 1,866 | 100.0% |
Internet Access in Hidden Valley
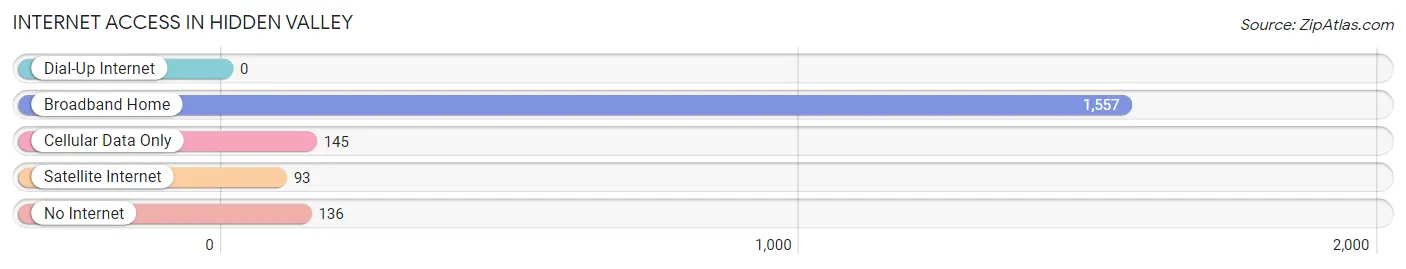
| Internet Type | # Households | % Households |
| Dial-Up Internet | 0 | 0.0% |
| Broadband Home | 1,557 | 83.4% |
| Cellular Data Only | 145 | 7.8% |
| Satellite Internet | 93 | 5.0% |
| No Internet | 136 | 7.3% |
| Total | 1,866 | 100.0% |
Hidden Valley Summary
Valley Hidden is a small town located in the state of Indiana, in the United States. It is situated in the southwestern part of the state, in the county of Porter. The town has a population of approximately 1,000 people, and is located in a rural area.
History
The area that is now known as Hidden Valley was first settled in the early 1800s by a group of settlers from Ohio. The settlers were attracted to the area due to its fertile soil and abundant natural resources. The town was originally known as “Hickory Grove”, and was later renamed “Hidden Valley” in 1837.
The town was originally a farming community, and the main crops grown were corn, wheat, and oats. The town also had a few small businesses, such as a general store, a blacksmith, and a sawmill.
In the late 1800s, the town began to grow and develop. The railroad was built through the town in 1883, and this allowed for the transportation of goods and people to and from the town. This helped to spur the growth of the town, and by the early 1900s, the population had grown to over 1,000 people.
Geography
Hidden Valley is located in the southwestern part of the state of Indiana, in the county of Porter. The town is situated in a rural area, and is surrounded by rolling hills and farmland. The town is located near the Kankakee River, and is approximately 30 miles from the city of Chicago.
The town has a total area of 1.2 square miles, and has an elevation of 645 feet. The climate in the area is classified as humid continental, and the average temperature in the summer is around 75 degrees Fahrenheit.
Economy
The economy of Hidden Valley is largely based on agriculture. The town is home to several farms, and the main crops grown are corn, wheat, and oats. The town also has a few small businesses, such as a general store, a blacksmith, and a sawmill.
The town is also home to a few manufacturing companies, such as a furniture factory and a plastics factory. The town also has a few restaurants and bars, as well as a few small shops.
Demographics
As of the 2010 census, the population of Hidden Valley was 1,000 people. The racial makeup of the town was 97.2% White, 0.7% African American, 0.3% Native American, 0.2% Asian, and 1.6% from other races. The median household income in the town was $41,250, and the median age was 40 years.
Conclusion
Hidden Valley is a small town located in the state of Indiana, in the United States. The town has a population of approximately 1,000 people, and is located in a rural area. The town is largely based on agriculture, and the main crops grown are corn, wheat, and oats. The town also has a few small businesses, such as a general store, a blacksmith, and a sawmill. The town is also home to a few manufacturing companies, such as a furniture factory and a plastics factory. The racial makeup of the town is 97.2% White, 0.7% African American, 0.3% Native American, 0.2% Asian, and 1.6% from other races. The median household income in the town was $41,250, and the median age was 40 years.
Common Questions
What is the Total Population of Hidden Valley?
Total Population of Hidden Valley is 5,560.
What is the Total Male Population of Hidden Valley?
Total Male Population of Hidden Valley is 2,649.
What is the Total Female Population of Hidden Valley?
Total Female Population of Hidden Valley is 2,911.
What is the Ratio of Males per 100 Females in Hidden Valley?
There are 91.00 Males per 100 Females in Hidden Valley.
What is the Ratio of Females per 100 Males in Hidden Valley?
There are 109.89 Females per 100 Males in Hidden Valley.
What is the Median Population Age in Hidden Valley?
Median Population Age in Hidden Valley is 39.6 Years.
What is the Average Family Size in Hidden Valley
Average Family Size in Hidden Valley is 3.2 People.
What is the Average Household Size in Hidden Valley
Average Household Size in Hidden Valley is 3.0 People.
What is Per Capita Income in Hidden Valley?
Per Capita income in Hidden Valley is $40,562.
What is the Median Family Income in Hidden Valley?
Median Family Income in Hidden Valley is $116,094.
What is the Median Household income in Hidden Valley?
Median Household Income in Hidden Valley is $112,500.
What is Income or Wage Gap in Hidden Valley?
Income or Wage Gap in Hidden Valley is 23.7%.
Women in Hidden Valley earn 76.3 cents for every dollar earned by a man.
What is Inequality or Gini Index in Hidden Valley?
Inequality or Gini Index in Hidden Valley is 0.32.
How Large is the Labor Force in Hidden Valley?
There are 2,932 People in the Labor Forcein in Hidden Valley.
What is the Percentage of People in the Labor Force in Hidden Valley?
66.7% of People are in the Labor Force in Hidden Valley.
What is the Unemployment Rate in Hidden Valley?
Unemployment Rate in Hidden Valley is 1.0%.