Leo Cedarville, IN
Leo Cedarville Map
Leo Cedarville Overview
3,649
TOTAL POPULATION
1,777
MALE POPULATION
1,872
FEMALE POPULATION
94.93
MALES / 100 FEMALES
105.35
FEMALES / 100 MALES
34.0
MEDIAN AGE
3.2
AVG FAMILY SIZE
3.0
AVG HOUSEHOLD SIZE
$44,205
PER CAPITA INCOME
$125,305
AVG FAMILY INCOME
$101,042
AVG HOUSEHOLD INCOME
30.3%
WAGE / INCOME GAP [ % ]
69.7¢/ $1
WAGE / INCOME GAP [ $ ]
0.38
INEQUALITY / GINI INDEX
1,912
LABOR FORCE [ PEOPLE ]
69.5%
PERCENT IN LABOR FORCE
2.8%
UNEMPLOYMENT RATE
Leo Cedarville Area Codes
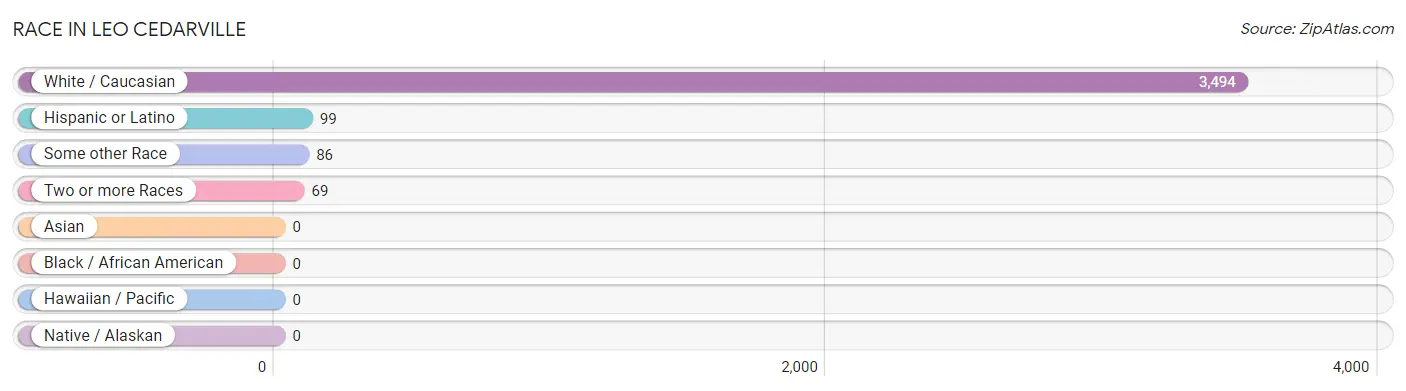
Race in Leo Cedarville
The most populous races in Leo Cedarville are White / Caucasian (3,494 | 95.8%), Hispanic or Latino (99 | 2.7%), and Some other Race (86 | 2.4%).
| Race | # Population | % Population |
| Asian | 0 | 0.0% |
| Black / African American | 0 | 0.0% |
| Hawaiian / Pacific | 0 | 0.0% |
| Hispanic or Latino | 99 | 2.7% |
| Native / Alaskan | 0 | 0.0% |
| White / Caucasian | 3,494 | 95.8% |
| Two or more Races | 69 | 1.9% |
| Some other Race | 86 | 2.4% |
| Total | 3,649 | 100.0% |
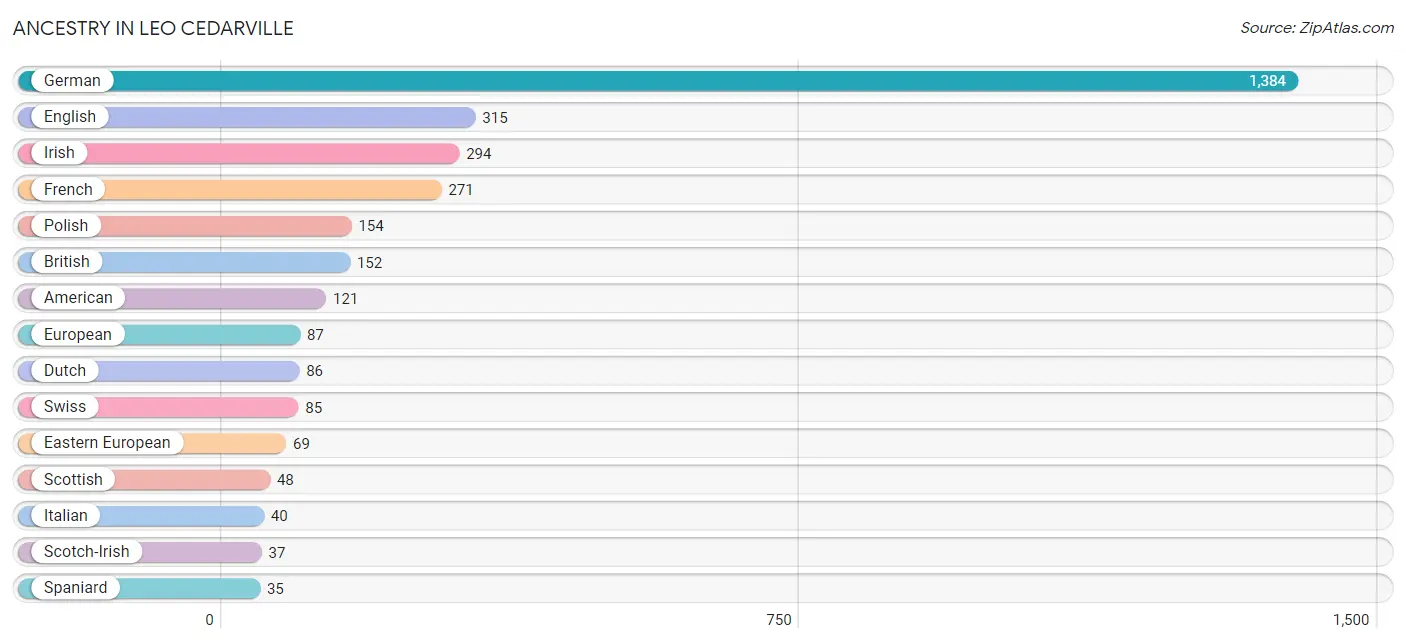
Ancestry in Leo Cedarville
The most populous ancestries reported in Leo Cedarville are German (1,384 | 37.9%), English (315 | 8.6%), Irish (294 | 8.1%), French (271 | 7.4%), and Polish (154 | 4.2%), together accounting for 66.3% of all Leo Cedarville residents.
| Ancestry | # Population | % Population |
| American | 121 | 3.3% |
| Brazilian | 30 | 0.8% |
| British | 152 | 4.2% |
| Cherokee | 28 | 0.8% |
| Colombian | 34 | 0.9% |
| Cuban | 11 | 0.3% |
| Dutch | 86 | 2.4% |
| Dutch West Indian | 17 | 0.5% |
| Eastern European | 69 | 1.9% |
| English | 315 | 8.6% |
| European | 87 | 2.4% |
| French | 271 | 7.4% |
| German | 1,384 | 37.9% |
| Hungarian | 11 | 0.3% |
| Irish | 294 | 8.1% |
| Italian | 40 | 1.1% |
| Polish | 154 | 4.2% |
| Puerto Rican | 19 | 0.5% |
| Russian | 14 | 0.4% |
| Scotch-Irish | 37 | 1.0% |
| Scottish | 48 | 1.3% |
| South American | 34 | 0.9% |
| Spaniard | 35 | 1.0% |
| Swedish | 20 | 0.5% |
| Swiss | 85 | 2.3% | View All 25 Rows |
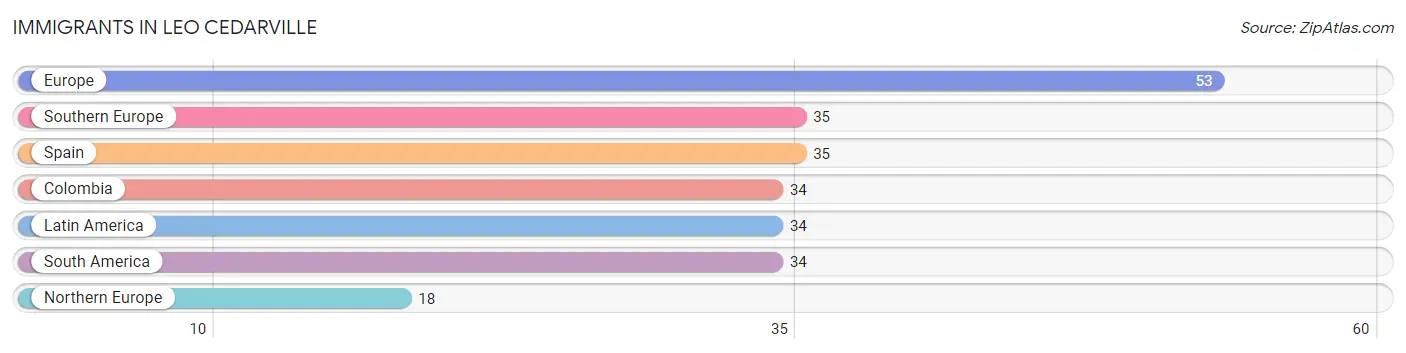
Immigrants in Leo Cedarville
The most numerous immigrant groups reported in Leo Cedarville came from Europe (53 | 1.5%), Southern Europe (35 | 1.0%), Spain (35 | 1.0%), Colombia (34 | 0.9%), and Latin America (34 | 0.9%), together accounting for 5.2% of all Leo Cedarville residents.
| Immigration Origin | # Population | % Population |
| Colombia | 34 | 0.9% |
| Europe | 53 | 1.5% |
| Latin America | 34 | 0.9% |
| Northern Europe | 18 | 0.5% |
| South America | 34 | 0.9% |
| Southern Europe | 35 | 1.0% |
| Spain | 35 | 1.0% | View All 7 Rows |
Sex and Age in Leo Cedarville
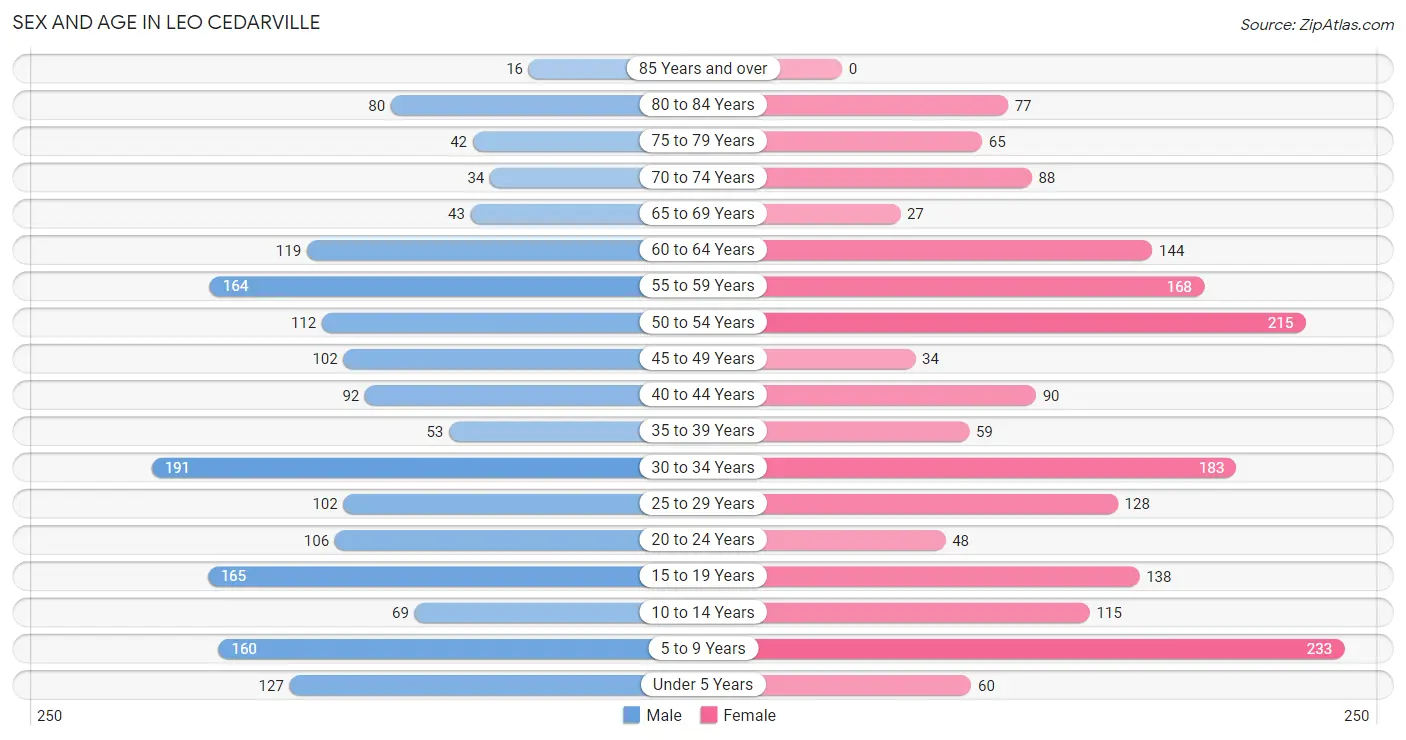
Sex and Age in Leo Cedarville
The most populous age groups in Leo Cedarville are 30 to 34 Years (191 | 10.7%) for men and 5 to 9 Years (233 | 12.4%) for women.
| Age Bracket | Male | Female |
| Under 5 Years | 127 (7.1%) | 60 (3.2%) |
| 5 to 9 Years | 160 (9.0%) | 233 (12.4%) |
| 10 to 14 Years | 69 (3.9%) | 115 (6.1%) |
| 15 to 19 Years | 165 (9.3%) | 138 (7.4%) |
| 20 to 24 Years | 106 (6.0%) | 48 (2.6%) |
| 25 to 29 Years | 102 (5.7%) | 128 (6.8%) |
| 30 to 34 Years | 191 (10.7%) | 183 (9.8%) |
| 35 to 39 Years | 53 (3.0%) | 59 (3.2%) |
| 40 to 44 Years | 92 (5.2%) | 90 (4.8%) |
| 45 to 49 Years | 102 (5.7%) | 34 (1.8%) |
| 50 to 54 Years | 112 (6.3%) | 215 (11.5%) |
| 55 to 59 Years | 164 (9.2%) | 168 (9.0%) |
| 60 to 64 Years | 119 (6.7%) | 144 (7.7%) |
| 65 to 69 Years | 43 (2.4%) | 27 (1.4%) |
| 70 to 74 Years | 34 (1.9%) | 88 (4.7%) |
| 75 to 79 Years | 42 (2.4%) | 65 (3.5%) |
| 80 to 84 Years | 80 (4.5%) | 77 (4.1%) |
| 85 Years and over | 16 (0.9%) | 0 (0.0%) |
| Total | 1,777 (100.0%) | 1,872 (100.0%) |
Families and Households in Leo Cedarville
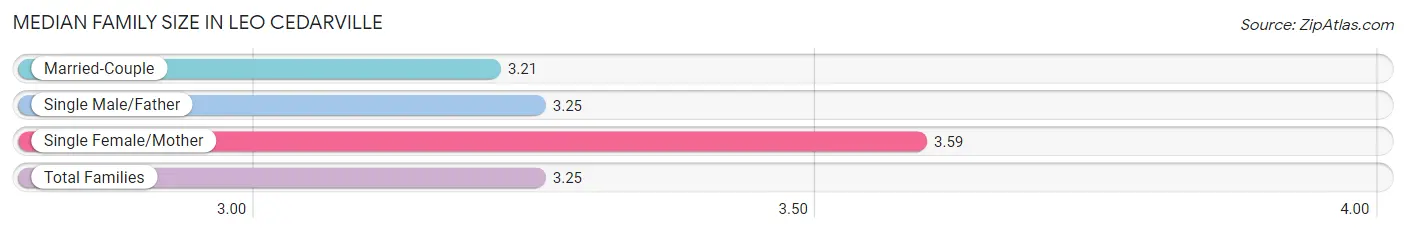
Median Family Size in Leo Cedarville
The median family size in Leo Cedarville is 3.25 persons per family, with single female/mother families (110 | 10.4%) accounting for the largest median family size of 3.59 persons per family. On the other hand, married-couple families (930 | 88.1%) represent the smallest median family size with 3.21 persons per family.
| Family Type | # Families | Family Size |
| Married-Couple | 930 (88.1%) | 3.21 |
| Single Male/Father | 16 (1.5%) | 3.25 |
| Single Female/Mother | 110 (10.4%) | 3.59 |
| Total Families | 1,056 (100.0%) | 3.25 |
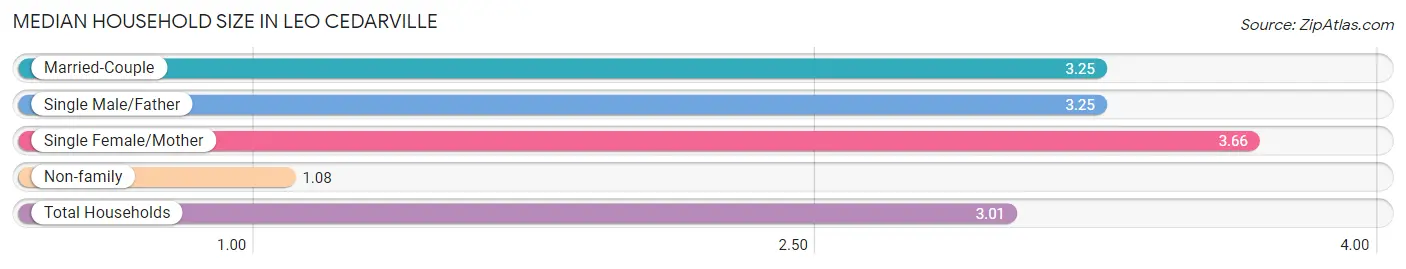
Median Household Size in Leo Cedarville
The median household size in Leo Cedarville is 3.01 persons per household, with single female/mother households (110 | 9.1%) accounting for the largest median household size of 3.66 persons per household. non-family households (158 | 13.0%) represent the smallest median household size with 1.08 persons per household.
| Household Type | # Households | Household Size |
| Married-Couple | 930 (76.6%) | 3.25 |
| Single Male/Father | 16 (1.3%) | 3.25 |
| Single Female/Mother | 110 (9.1%) | 3.66 |
| Non-family | 158 (13.0%) | 1.08 |
| Total Households | 1,214 (100.0%) | 3.01 |
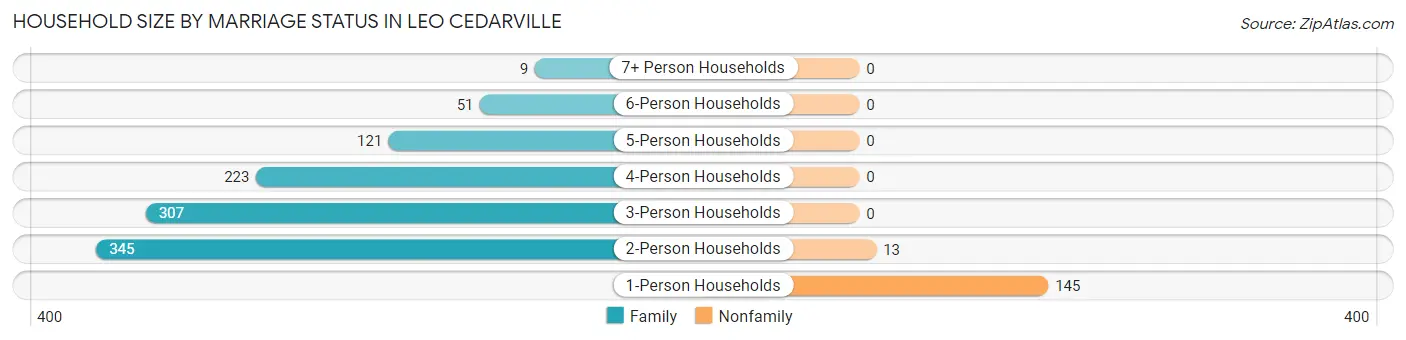
Household Size by Marriage Status in Leo Cedarville
Out of a total of 1,214 households in Leo Cedarville, 1,056 (87.0%) are family households, while 158 (13.0%) are nonfamily households. The most numerous type of family households are 2-person households, comprising 345, and the most common type of nonfamily households are 1-person households, comprising 145.
| Household Size | Family Households | Nonfamily Households |
| 1-Person Households | - | 145 (11.9%) |
| 2-Person Households | 345 (28.4%) | 13 (1.1%) |
| 3-Person Households | 307 (25.3%) | 0 (0.0%) |
| 4-Person Households | 223 (18.4%) | 0 (0.0%) |
| 5-Person Households | 121 (10.0%) | 0 (0.0%) |
| 6-Person Households | 51 (4.2%) | 0 (0.0%) |
| 7+ Person Households | 9 (0.7%) | 0 (0.0%) |
| Total | 1,056 (87.0%) | 158 (13.0%) |
Female Fertility in Leo Cedarville
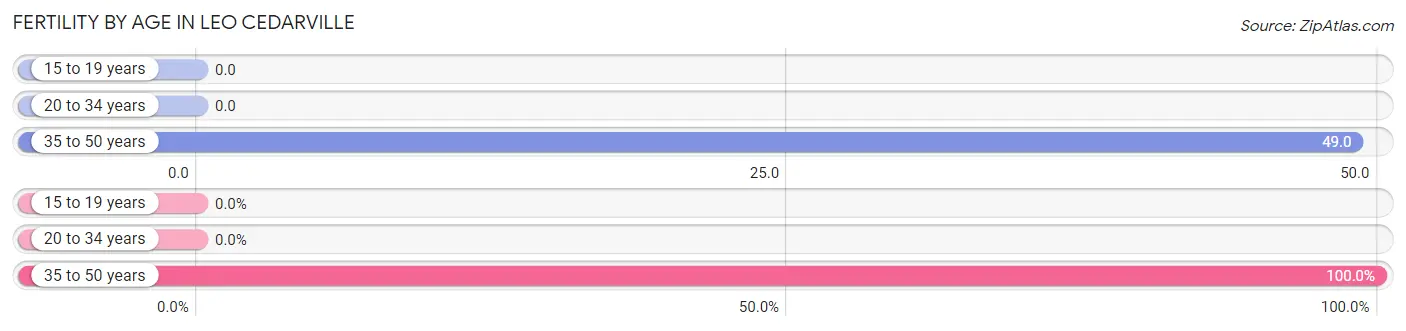
Fertility by Age in Leo Cedarville
Average fertility rate in Leo Cedarville is 17.0 births per 1,000 women. Women in the age bracket of 35 to 50 years have the highest fertility rate with 49.0 births per 1,000 women. Women in the age bracket of 35 to 50 years acount for 100.0% of all women with births.
| Age Bracket | Women with Births | Births / 1,000 Women |
| 15 to 19 years | 0 (0.0%) | 0.0 |
| 20 to 34 years | 0 (0.0%) | 0.0 |
| 35 to 50 years | 13 (100.0%) | 49.0 |
| Total | 13 (100.0%) | 17.0 |
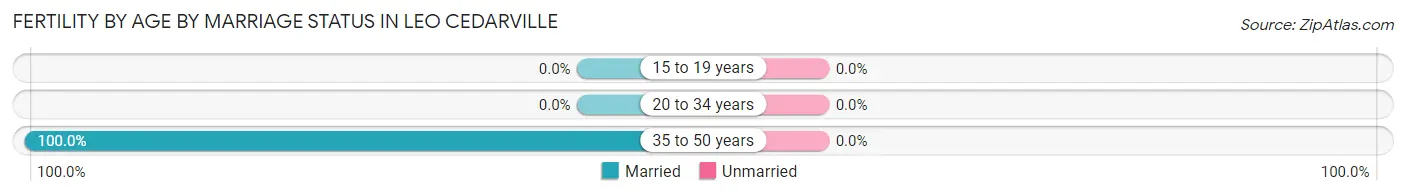
Fertility by Age by Marriage Status in Leo Cedarville
| Age Bracket | Married | Unmarried |
| 15 to 19 years | 0 (0.0%) | 0 (0.0%) |
| 20 to 34 years | 0 (0.0%) | 0 (0.0%) |
| 35 to 50 years | 13 (100.0%) | 0 (0.0%) |
| Total | 13 (100.0%) | 0 (0.0%) |
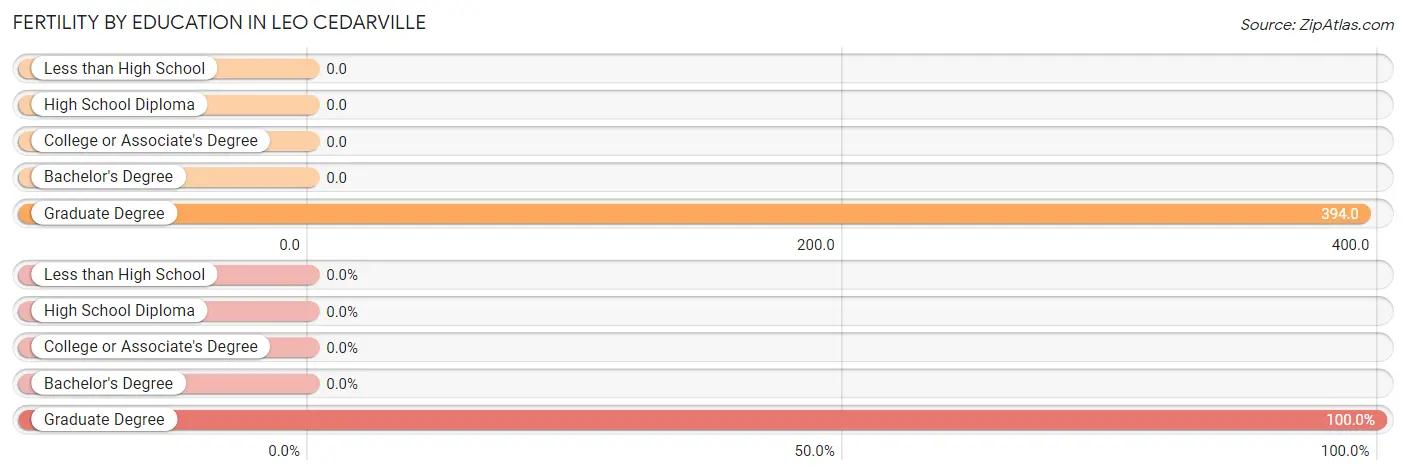
Fertility by Education in Leo Cedarville
| Educational Attainment | Women with Births | Births / 1,000 Women |
| Less than High School | 0 (0.0%) | 0.0 |
| High School Diploma | 0 (0.0%) | 0.0 |
| College or Associate's Degree | 0 (0.0%) | 0.0 |
| Bachelor's Degree | 0 (0.0%) | 0.0 |
| Graduate Degree | 13 (100.0%) | 394.0 |
| Total | 13 (100.0%) | 17.0 |
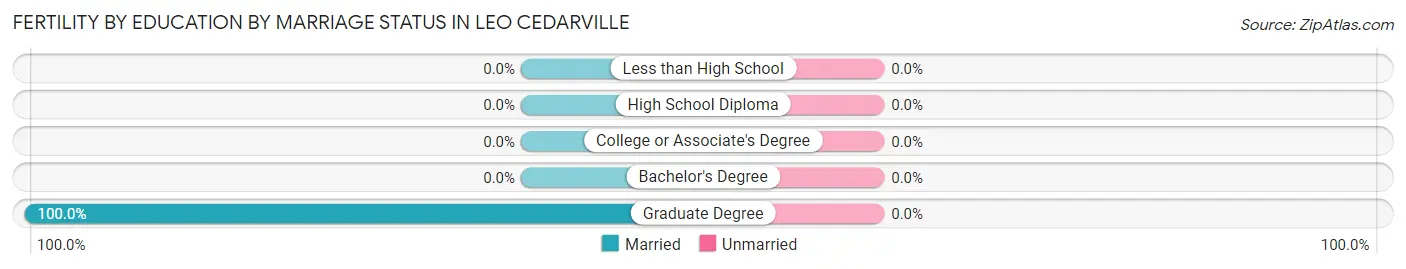
Fertility by Education by Marriage Status in Leo Cedarville
| Educational Attainment | Married | Unmarried |
| Less than High School | 0 (0.0%) | 0 (0.0%) |
| High School Diploma | 0 (0.0%) | 0 (0.0%) |
| College or Associate's Degree | 0 (0.0%) | 0 (0.0%) |
| Bachelor's Degree | 0 (0.0%) | 0 (0.0%) |
| Graduate Degree | 13 (100.0%) | 0 (0.0%) |
| Total | 13 (100.0%) | 0 (0.0%) |
Income in Leo Cedarville
Income Overview in Leo Cedarville
Per Capita Income in Leo Cedarville is $44,205, while median incomes of families and households are $125,305 and $101,042 respectively.
| Characteristic | Number | Measure |
| Per Capita Income | 3,649 | $44,205 |
| Median Family Income | 1,056 | $125,305 |
| Mean Family Income | 1,056 | $142,357 |
| Median Household Income | 1,214 | $101,042 |
| Mean Household Income | 1,214 | $131,704 |
| Income Deficit | 1,056 | $0 |
| Wage / Income Gap (%) | 3,649 | 30.31% |
| Wage / Income Gap ($) | 3,649 | 69.69¢ per $1 |
| Gini / Inequality Index | 3,649 | 0.38 |
Earnings by Sex in Leo Cedarville
Average Earnings in Leo Cedarville are $56,971, $63,972 for men and $44,583 for women, a difference of 30.3%.
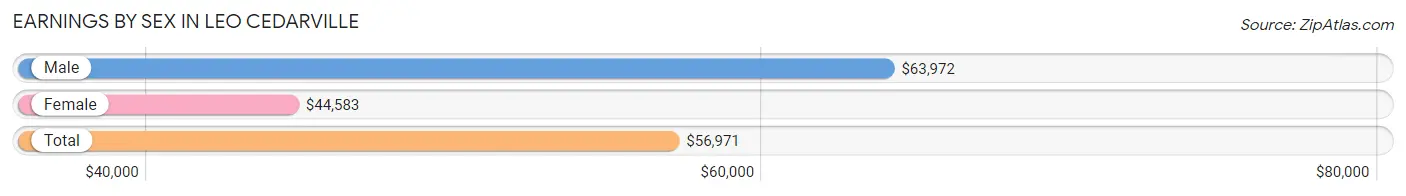
| Sex | Number | Average Earnings |
| Male | 1,079 (54.3%) | $63,972 |
| Female | 909 (45.7%) | $44,583 |
| Total | 1,988 (100.0%) | $56,971 |
Earnings by Sex by Income Bracket in Leo Cedarville
The most common earnings brackets in Leo Cedarville are $100,000+ for men (304 | 28.2%) and $55,000 to $64,999 for women (156 | 17.2%).
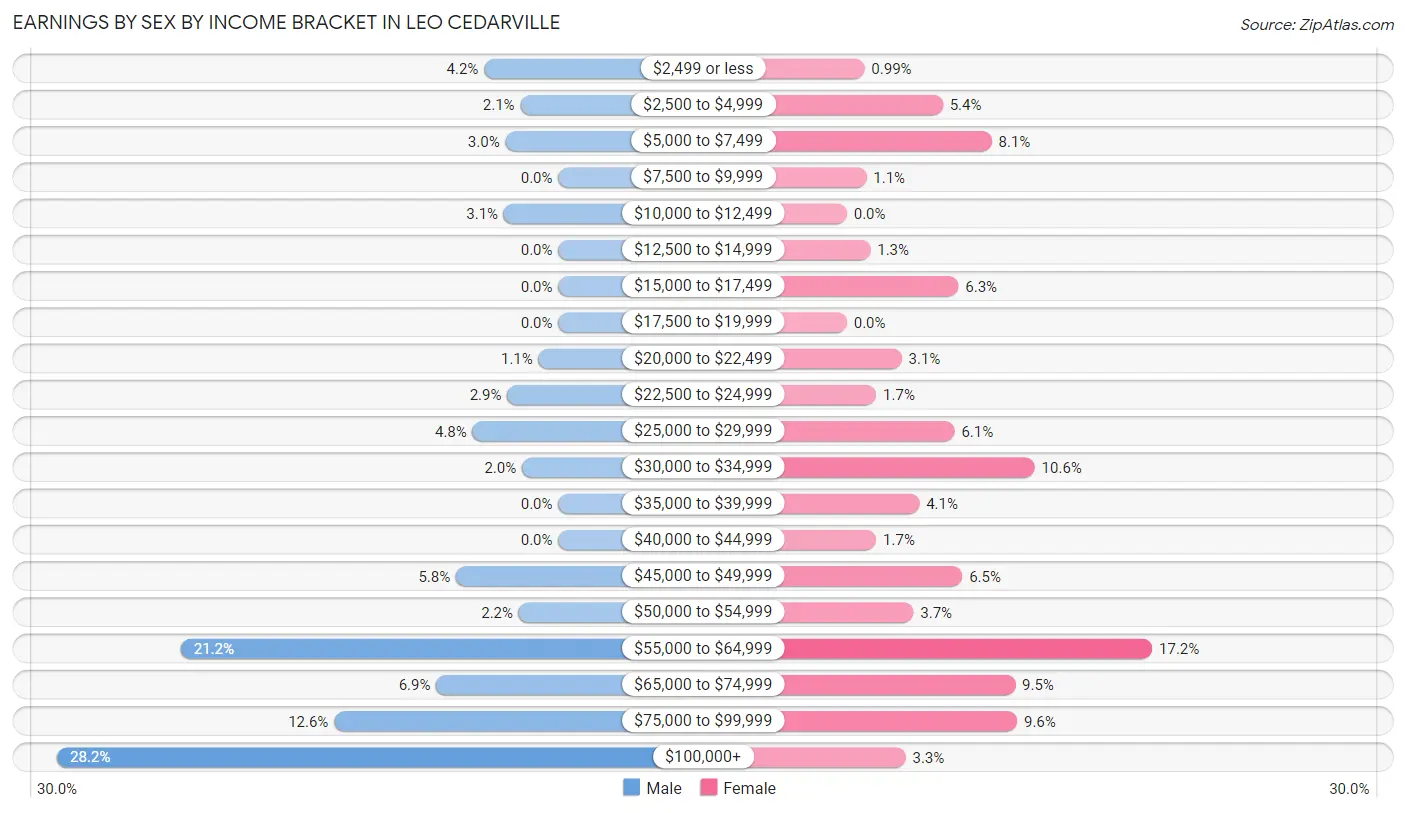
| Income | Male | Female |
| $2,499 or less | 45 (4.2%) | 9 (1.0%) |
| $2,500 to $4,999 | 23 (2.1%) | 49 (5.4%) |
| $5,000 to $7,499 | 32 (3.0%) | 74 (8.1%) |
| $7,500 to $9,999 | 0 (0.0%) | 10 (1.1%) |
| $10,000 to $12,499 | 33 (3.1%) | 0 (0.0%) |
| $12,500 to $14,999 | 0 (0.0%) | 12 (1.3%) |
| $15,000 to $17,499 | 0 (0.0%) | 57 (6.3%) |
| $17,500 to $19,999 | 0 (0.0%) | 0 (0.0%) |
| $20,000 to $22,499 | 12 (1.1%) | 28 (3.1%) |
| $22,500 to $24,999 | 31 (2.9%) | 15 (1.7%) |
| $25,000 to $29,999 | 52 (4.8%) | 55 (6.0%) |
| $30,000 to $34,999 | 22 (2.0%) | 96 (10.6%) |
| $35,000 to $39,999 | 0 (0.0%) | 37 (4.1%) |
| $40,000 to $44,999 | 0 (0.0%) | 15 (1.7%) |
| $45,000 to $49,999 | 62 (5.8%) | 59 (6.5%) |
| $50,000 to $54,999 | 24 (2.2%) | 34 (3.7%) |
| $55,000 to $64,999 | 229 (21.2%) | 156 (17.2%) |
| $65,000 to $74,999 | 74 (6.9%) | 86 (9.5%) |
| $75,000 to $99,999 | 136 (12.6%) | 87 (9.6%) |
| $100,000+ | 304 (28.2%) | 30 (3.3%) |
| Total | 1,079 (100.0%) | 909 (100.0%) |
Earnings by Sex by Educational Attainment in Leo Cedarville
Average earnings in Leo Cedarville are $69,519 for men and $46,907 for women, a difference of 32.5%. Men with an educational attainment of graduate degree enjoy the highest average annual earnings of $106,719, while those with college or associate's degree education earn the least with $57,463. Women with an educational attainment of bachelor's degree earn the most with the average annual earnings of $63,214, while those with high school diploma education have the smallest earnings of $31,250.
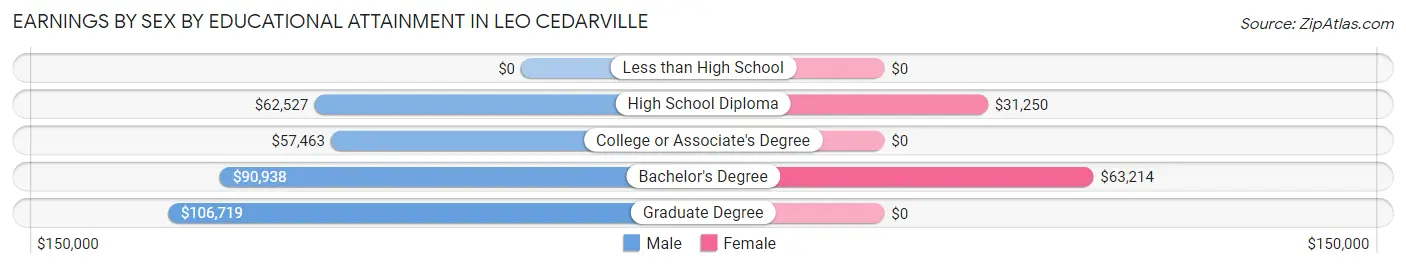
| Educational Attainment | Male Income | Female Income |
| Less than High School | - | - |
| High School Diploma | $62,527 | $31,250 |
| College or Associate's Degree | $57,463 | $0 |
| Bachelor's Degree | $90,938 | $63,214 |
| Graduate Degree | $106,719 | $0 |
| Total | $69,519 | $46,907 |
Family Income in Leo Cedarville
Family Income Brackets in Leo Cedarville
According to the Leo Cedarville family income data, there are 228 families falling into the $100,000 to $149,999 income range, which is the most common income bracket and makes up 21.6% of all families.
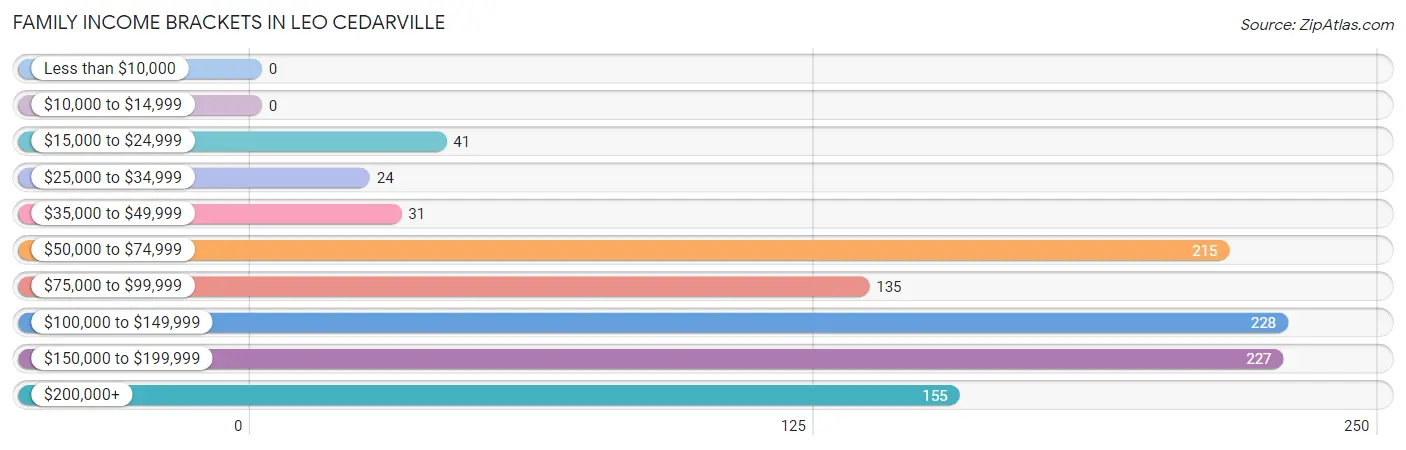
| Income Bracket | # Families | % Families |
| Less than $10,000 | 0 | 0.0% |
| $10,000 to $14,999 | 0 | 0.0% |
| $15,000 to $24,999 | 41 | 3.9% |
| $25,000 to $34,999 | 24 | 2.3% |
| $35,000 to $49,999 | 31 | 2.9% |
| $50,000 to $74,999 | 215 | 20.4% |
| $75,000 to $99,999 | 135 | 12.8% |
| $100,000 to $149,999 | 228 | 21.6% |
| $150,000 to $199,999 | 227 | 21.5% |
| $200,000+ | 155 | 14.7% |
Family Income by Famaliy Size in Leo Cedarville
4-person families (165 | 15.6%) account for the highest median family income in Leo Cedarville with $158,021 per family, while 3-person families (365 | 34.6%) have the highest median income of $49,475 per family member.
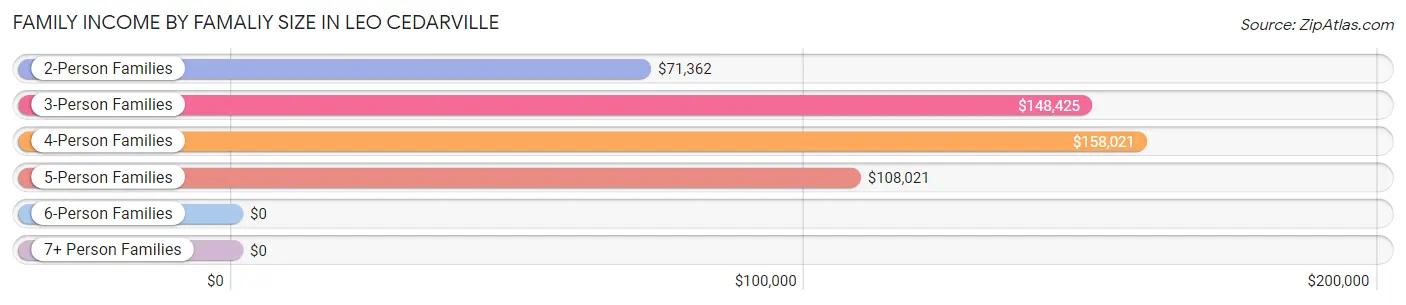
| Income Bracket | # Families | Median Income |
| 2-Person Families | 345 (32.7%) | $71,362 |
| 3-Person Families | 365 (34.6%) | $148,425 |
| 4-Person Families | 165 (15.6%) | $158,021 |
| 5-Person Families | 121 (11.5%) | $108,021 |
| 6-Person Families | 51 (4.8%) | $0 |
| 7+ Person Families | 9 (0.9%) | $0 |
| Total | 1,056 (100.0%) | $125,305 |
Family Income by Number of Earners in Leo Cedarville
The median family income in Leo Cedarville is $125,305, with families comprising 2 earners (517) having the highest median family income of $158,207, while families with no earners (164) have the lowest median family income of $49,063, accounting for 49.0% and 15.5% of families, respectively.
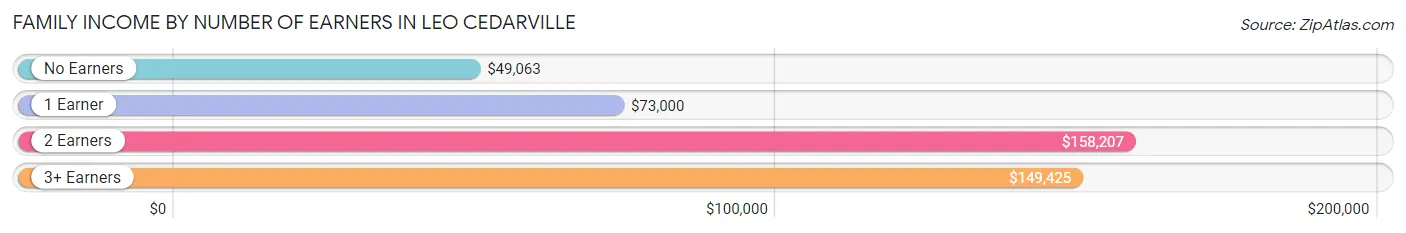
| Number of Earners | # Families | Median Income |
| No Earners | 164 (15.5%) | $49,063 |
| 1 Earner | 176 (16.7%) | $73,000 |
| 2 Earners | 517 (49.0%) | $158,207 |
| 3+ Earners | 199 (18.8%) | $149,425 |
| Total | 1,056 (100.0%) | $125,305 |
Household Income in Leo Cedarville
Household Income Brackets in Leo Cedarville
With 245 households falling in the category, the $100,000 to $149,999 income range is the most frequent in Leo Cedarville, accounting for 20.2% of all households.
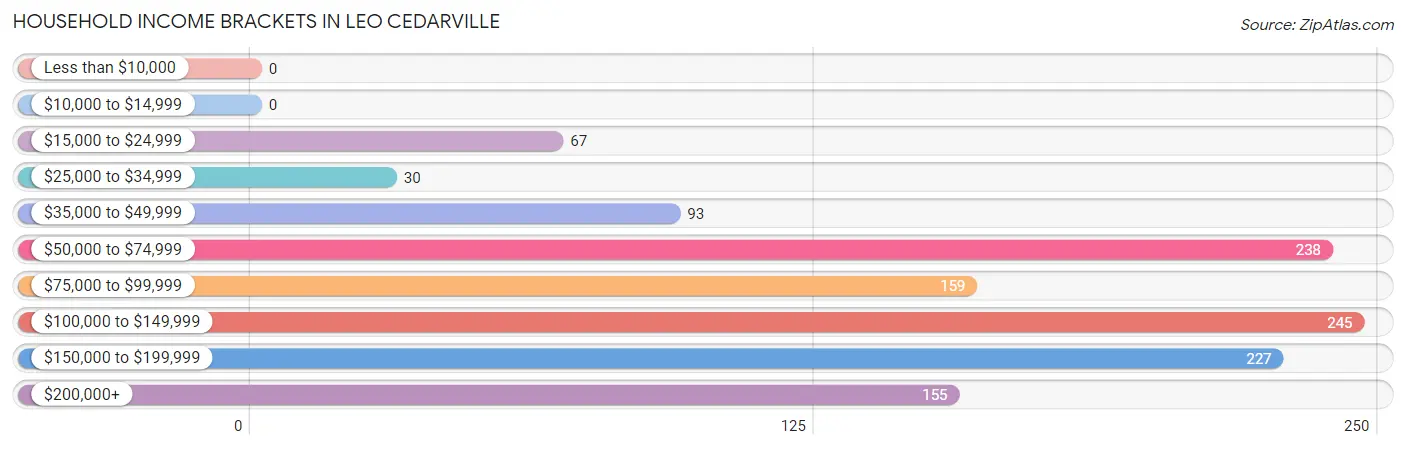
| Income Bracket | # Households | % Households |
| Less than $10,000 | 0 | 0.0% |
| $10,000 to $14,999 | 0 | 0.0% |
| $15,000 to $24,999 | 67 | 5.5% |
| $25,000 to $34,999 | 30 | 2.5% |
| $35,000 to $49,999 | 93 | 7.7% |
| $50,000 to $74,999 | 238 | 19.6% |
| $75,000 to $99,999 | 159 | 13.1% |
| $100,000 to $149,999 | 245 | 20.2% |
| $150,000 to $199,999 | 227 | 18.7% |
| $200,000+ | 155 | 12.8% |
Household Income by Householder Age in Leo Cedarville
The median household income in Leo Cedarville is $101,042, with the highest median household income of $147,900 found in the 45 to 64 years age bracket for the primary householder. A total of 564 households (46.5%) fall into this category. Meanwhile, the 15 to 24 years age bracket for the primary householder has the lowest median household income of $0, with 15 households (1.2%) in this group.
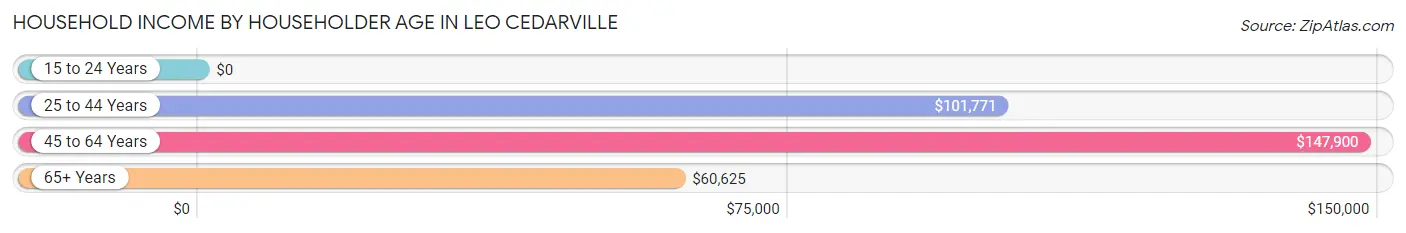
| Income Bracket | # Households | Median Income |
| 15 to 24 Years | 15 (1.2%) | $0 |
| 25 to 44 Years | 376 (31.0%) | $101,771 |
| 45 to 64 Years | 564 (46.5%) | $147,900 |
| 65+ Years | 259 (21.3%) | $60,625 |
| Total | 1,214 (100.0%) | $101,042 |
Poverty in Leo Cedarville
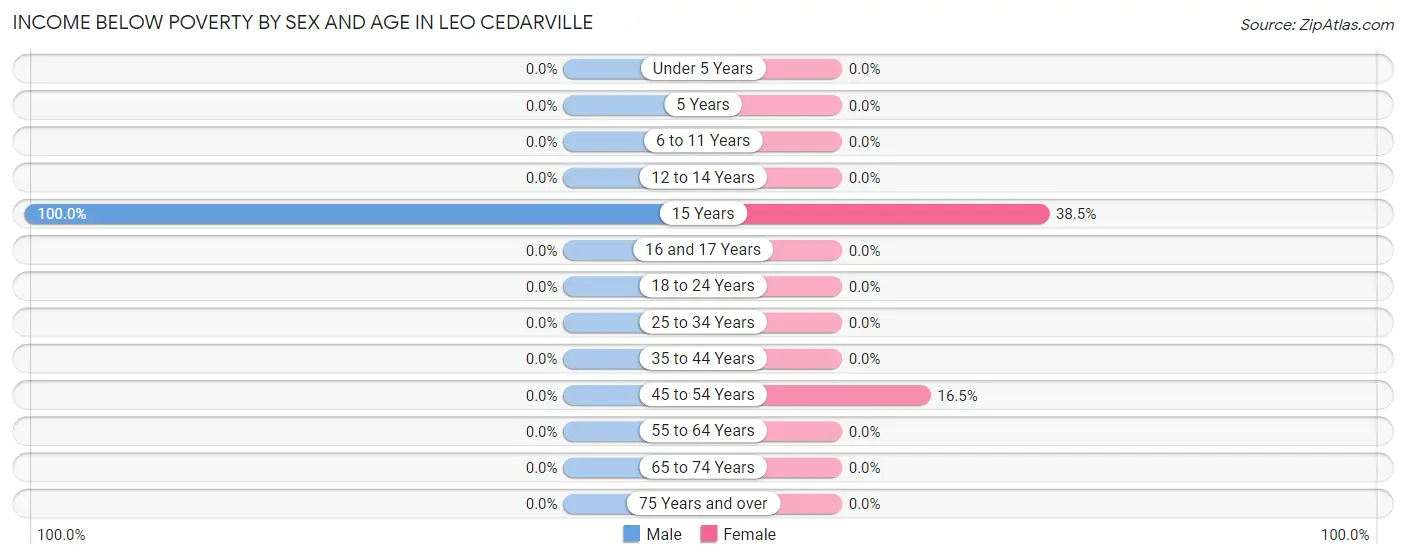
Income Below Poverty by Sex and Age in Leo Cedarville
With 2.4% poverty level for males and 4.1% for females among the residents of Leo Cedarville, 15 year old males and 15 year old females are the most vulnerable to poverty, with 43 males (100.0%) and 35 females (38.5%) in their respective age groups living below the poverty level.
| Age Bracket | Male | Female |
| Under 5 Years | 0 (0.0%) | 0 (0.0%) |
| 5 Years | 0 (0.0%) | 0 (0.0%) |
| 6 to 11 Years | 0 (0.0%) | 0 (0.0%) |
| 12 to 14 Years | 0 (0.0%) | 0 (0.0%) |
| 15 Years | 43 (100.0%) | 35 (38.5%) |
| 16 and 17 Years | 0 (0.0%) | 0 (0.0%) |
| 18 to 24 Years | 0 (0.0%) | 0 (0.0%) |
| 25 to 34 Years | 0 (0.0%) | 0 (0.0%) |
| 35 to 44 Years | 0 (0.0%) | 0 (0.0%) |
| 45 to 54 Years | 0 (0.0%) | 41 (16.5%) |
| 55 to 64 Years | 0 (0.0%) | 0 (0.0%) |
| 65 to 74 Years | 0 (0.0%) | 0 (0.0%) |
| 75 Years and over | 0 (0.0%) | 0 (0.0%) |
| Total | 43 (2.4%) | 76 (4.1%) |
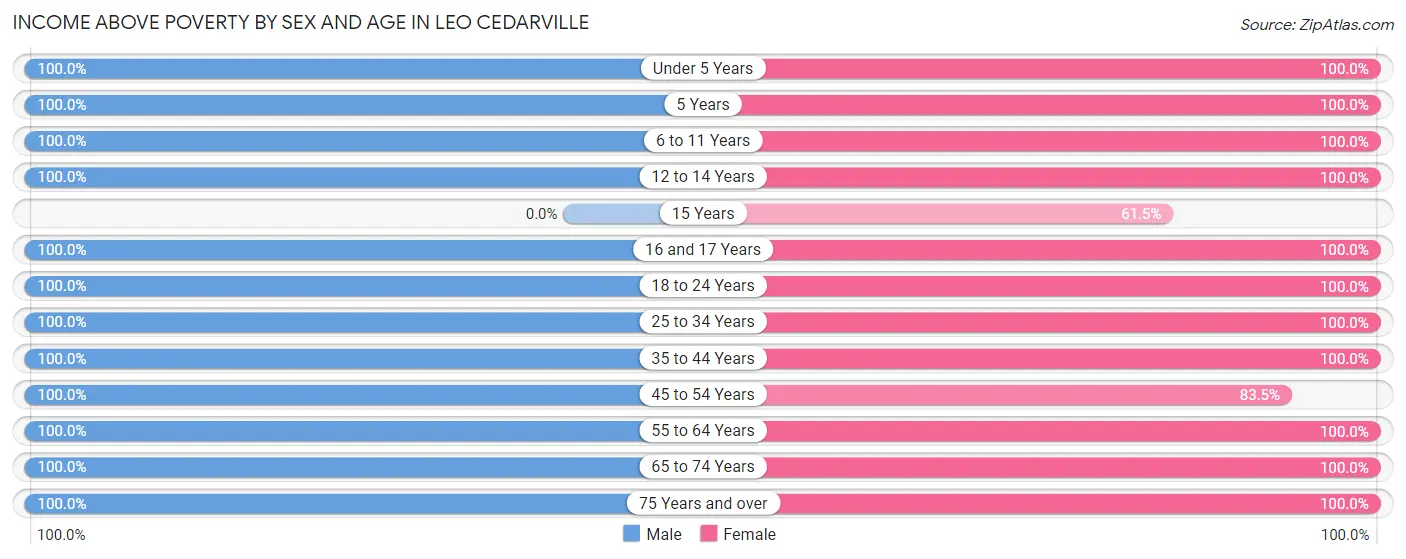
Income Above Poverty by Sex and Age in Leo Cedarville
According to the poverty statistics in Leo Cedarville, males aged under 5 years and females aged under 5 years are the age groups that are most secure financially, with 100.0% of males and 100.0% of females in these age groups living above the poverty line.
| Age Bracket | Male | Female |
| Under 5 Years | 127 (100.0%) | 60 (100.0%) |
| 5 Years | 44 (100.0%) | 78 (100.0%) |
| 6 to 11 Years | 140 (100.0%) | 207 (100.0%) |
| 12 to 14 Years | 45 (100.0%) | 63 (100.0%) |
| 15 Years | 0 (0.0%) | 56 (61.5%) |
| 16 and 17 Years | 82 (100.0%) | 34 (100.0%) |
| 18 to 24 Years | 146 (100.0%) | 61 (100.0%) |
| 25 to 34 Years | 293 (100.0%) | 311 (100.0%) |
| 35 to 44 Years | 145 (100.0%) | 149 (100.0%) |
| 45 to 54 Years | 214 (100.0%) | 208 (83.5%) |
| 55 to 64 Years | 283 (100.0%) | 312 (100.0%) |
| 65 to 74 Years | 77 (100.0%) | 115 (100.0%) |
| 75 Years and over | 138 (100.0%) | 142 (100.0%) |
| Total | 1,734 (97.6%) | 1,796 (95.9%) |
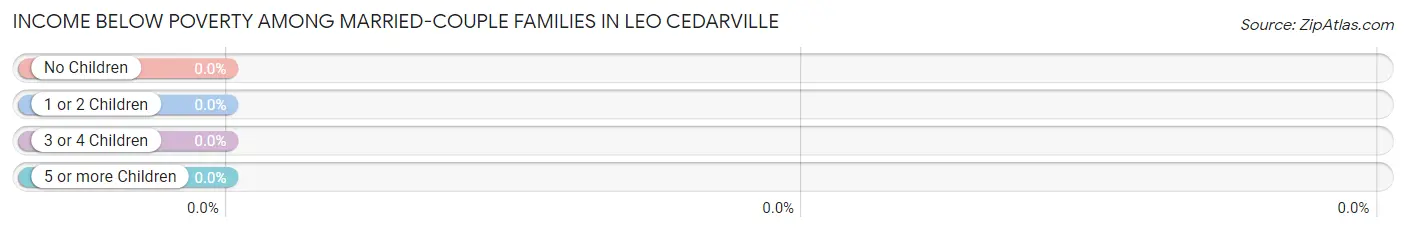
Income Below Poverty Among Married-Couple Families in Leo Cedarville
| Children | Above Poverty | Below Poverty |
| No Children | 453 (100.0%) | 0 (0.0%) |
| 1 or 2 Children | 393 (100.0%) | 0 (0.0%) |
| 3 or 4 Children | 84 (100.0%) | 0 (0.0%) |
| 5 or more Children | 0 (0.0%) | 0 (0.0%) |
| Total | 930 (100.0%) | 0 (0.0%) |
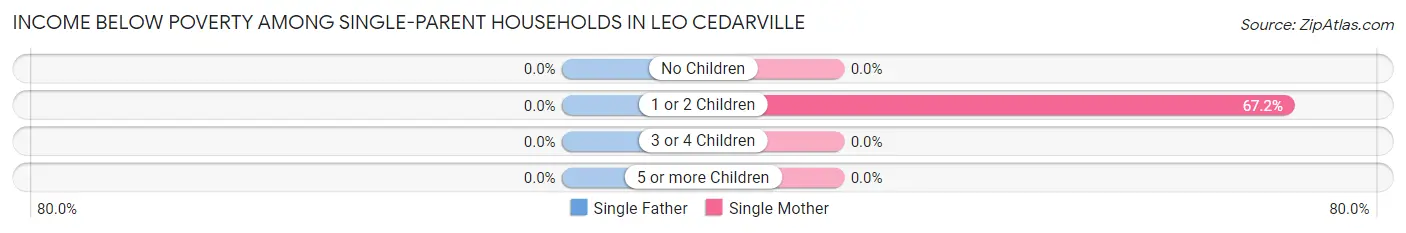
Income Below Poverty Among Single-Parent Households in Leo Cedarville
| Children | Single Father | Single Mother |
| No Children | 0 (0.0%) | 0 (0.0%) |
| 1 or 2 Children | 0 (0.0%) | 41 (67.2%) |
| 3 or 4 Children | 0 (0.0%) | 0 (0.0%) |
| 5 or more Children | 0 (0.0%) | 0 (0.0%) |
| Total | 0 (0.0%) | 41 (37.3%) |
Income Below Poverty Among Married-Couple vs Single-Parent Households in Leo Cedarville
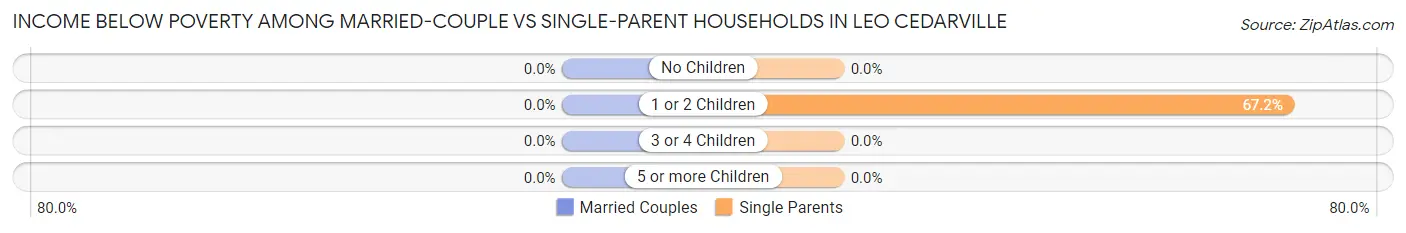
| Children | Married-Couple Families | Single-Parent Households |
| No Children | 0 (0.0%) | 0 (0.0%) |
| 1 or 2 Children | 0 (0.0%) | 41 (67.2%) |
| 3 or 4 Children | 0 (0.0%) | 0 (0.0%) |
| 5 or more Children | 0 (0.0%) | 0 (0.0%) |
| Total | 0 (0.0%) | 41 (32.5%) |
Employment Characteristics in Leo Cedarville
Employment by Class of Employer in Leo Cedarville
Among the 1,846 employed individuals in Leo Cedarville, private company employees (1,376 | 74.5%), not-for-profit organizations (203 | 11.0%), and local government employees (128 | 6.9%) make up the most common classes of employment.
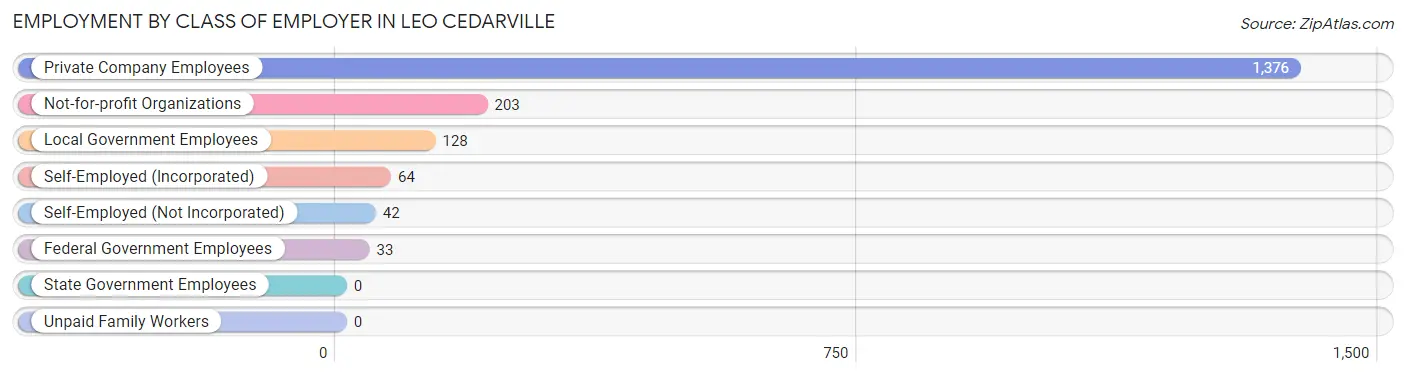
| Employer Class | # Employees | % Employees |
| Private Company Employees | 1,376 | 74.5% |
| Self-Employed (Incorporated) | 64 | 3.5% |
| Self-Employed (Not Incorporated) | 42 | 2.3% |
| Not-for-profit Organizations | 203 | 11.0% |
| Local Government Employees | 128 | 6.9% |
| State Government Employees | 0 | 0.0% |
| Federal Government Employees | 33 | 1.8% |
| Unpaid Family Workers | 0 | 0.0% |
| Total | 1,846 | 100.0% |
Employment Status by Age in Leo Cedarville
According to the labor force statistics for Leo Cedarville, out of the total population over 16 years of age (2,751), 69.5% or 1,912 individuals are in the labor force, with 2.8% or 54 of them unemployed. The age group with the highest labor force participation rate is 30 to 34 years, with 96.8% or 362 individuals in the labor force. Within the labor force, the 25 to 29 years age range has the highest percentage of unemployed individuals, with 10.8% or 22 of them being unemployed.
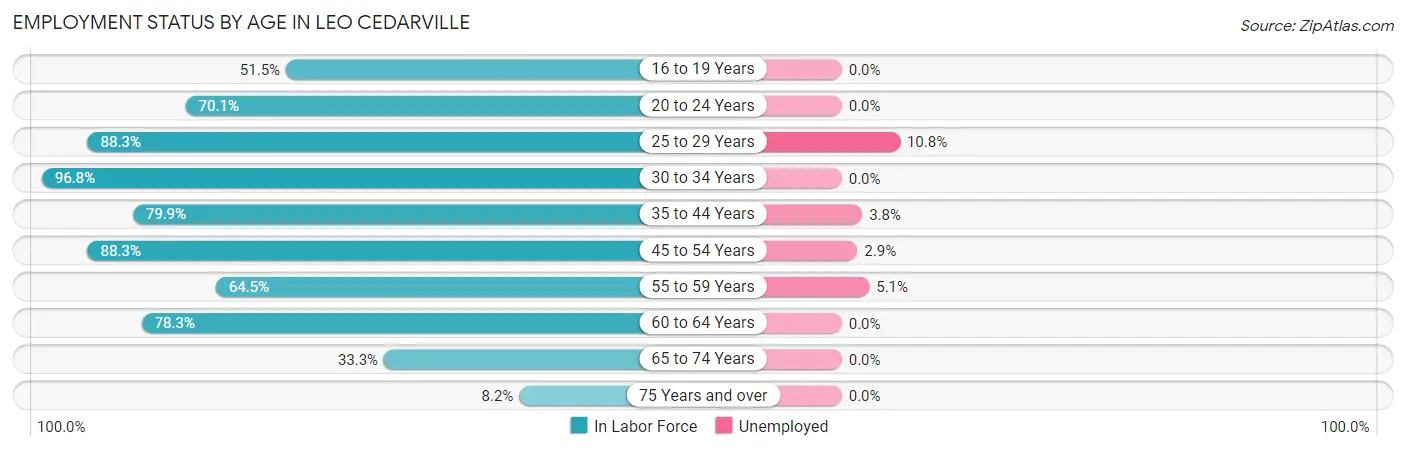
| Age Bracket | In Labor Force | Unemployed |
| 16 to 19 Years | 87 (51.5%) | 0 (0.0%) |
| 20 to 24 Years | 108 (70.1%) | 0 (0.0%) |
| 25 to 29 Years | 203 (88.3%) | 22 (10.8%) |
| 30 to 34 Years | 362 (96.8%) | 0 (0.0%) |
| 35 to 44 Years | 235 (79.9%) | 9 (3.8%) |
| 45 to 54 Years | 409 (88.3%) | 12 (2.9%) |
| 55 to 59 Years | 214 (64.5%) | 11 (5.1%) |
| 60 to 64 Years | 206 (78.3%) | 0 (0.0%) |
| 65 to 74 Years | 64 (33.3%) | 0 (0.0%) |
| 75 Years and over | 23 (8.2%) | 0 (0.0%) |
| Total | 1,912 (69.5%) | 54 (2.8%) |
Employment Status by Educational Attainment in Leo Cedarville
According to labor force statistics for Leo Cedarville, 83.3% of individuals (1,629) out of the total population between 25 and 64 years of age (1,956) are in the labor force, with 3.3% or 54 of them being unemployed. The group with the highest labor force participation rate are those with the educational attainment of bachelor's degree or higher, with 87.0% or 771 individuals in the labor force. Within the labor force, individuals with bachelor's degree or higher education have the highest percentage of unemployment, with 4.3% or 33 of them being unemployed.
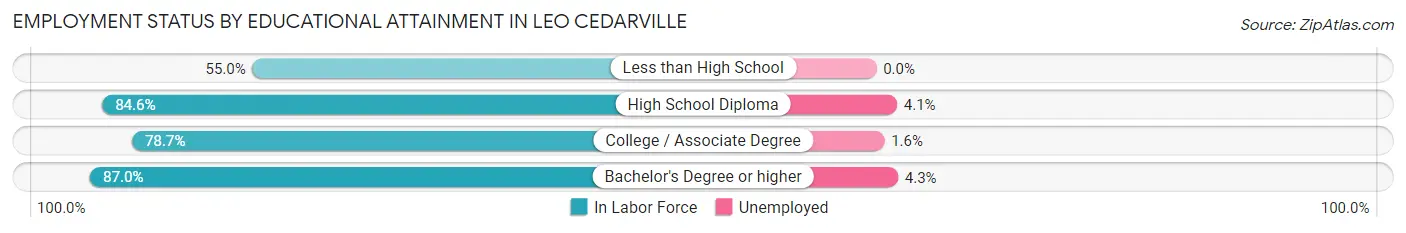
| Educational Attainment | In Labor Force | Unemployed |
| Less than High School | 11 (55.0%) | 0 (0.0%) |
| High School Diploma | 296 (84.6%) | 14 (4.1%) |
| College / Associate Degree | 551 (78.7%) | 11 (1.6%) |
| Bachelor's Degree or higher | 771 (87.0%) | 38 (4.3%) |
| Total | 1,629 (83.3%) | 65 (3.3%) |
Employment Occupations by Sex in Leo Cedarville
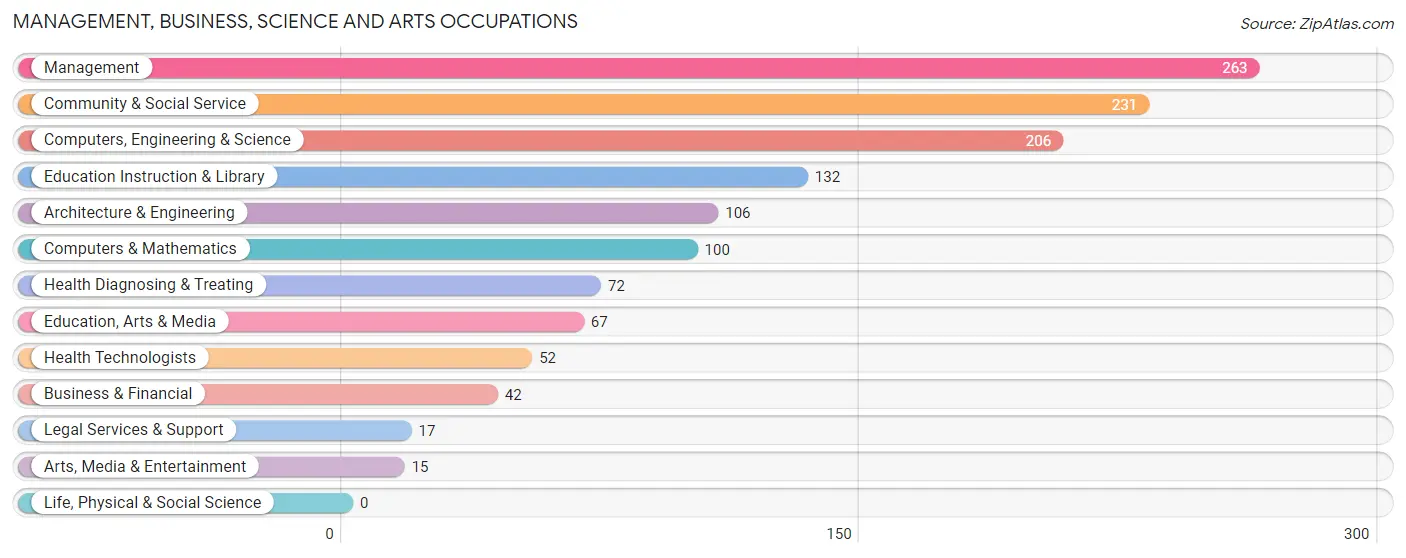
Management, Business, Science and Arts Occupations
The most common Management, Business, Science and Arts occupations in Leo Cedarville are Management (263 | 14.2%), Community & Social Service (231 | 12.4%), Computers, Engineering & Science (206 | 11.1%), Education Instruction & Library (132 | 7.1%), and Architecture & Engineering (106 | 5.7%).
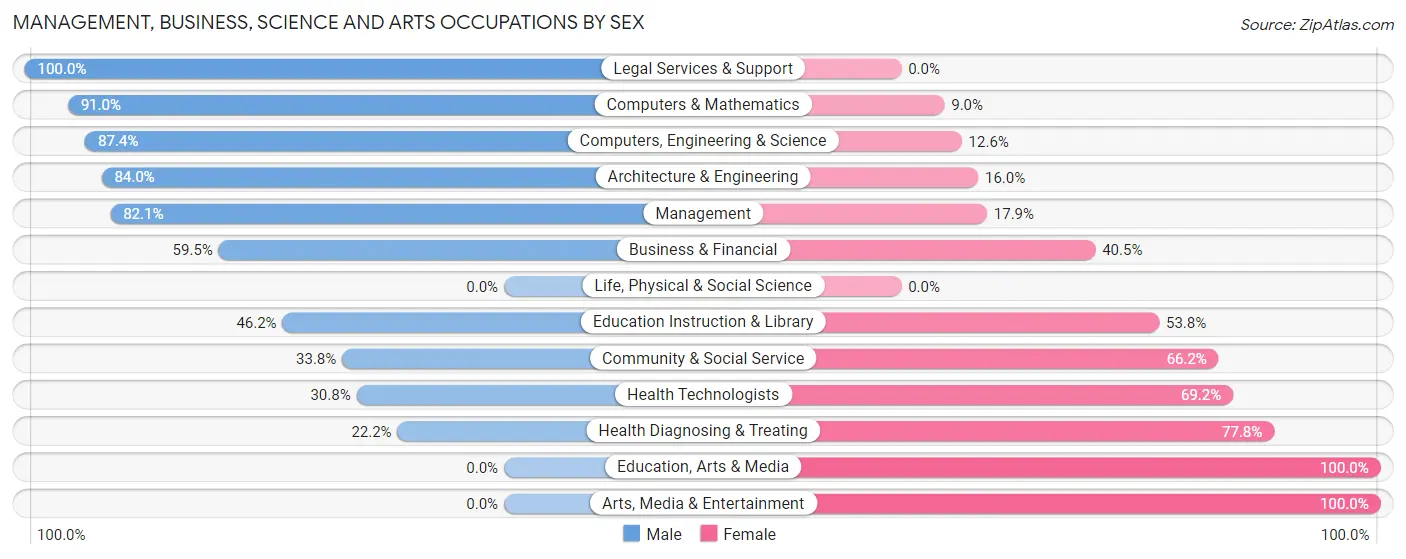
Management, Business, Science and Arts Occupations by Sex
Within the Management, Business, Science and Arts occupations in Leo Cedarville, the most male-oriented occupations are Legal Services & Support (100.0%), Computers & Mathematics (91.0%), and Computers, Engineering & Science (87.4%), while the most female-oriented occupations are Education, Arts & Media (100.0%), Arts, Media & Entertainment (100.0%), and Health Diagnosing & Treating (77.8%).
| Occupation | Male | Female |
| Management | 216 (82.1%) | 47 (17.9%) |
| Business & Financial | 25 (59.5%) | 17 (40.5%) |
| Computers, Engineering & Science | 180 (87.4%) | 26 (12.6%) |
| Computers & Mathematics | 91 (91.0%) | 9 (9.0%) |
| Architecture & Engineering | 89 (84.0%) | 17 (16.0%) |
| Life, Physical & Social Science | 0 (0.0%) | 0 (0.0%) |
| Community & Social Service | 78 (33.8%) | 153 (66.2%) |
| Education, Arts & Media | 0 (0.0%) | 67 (100.0%) |
| Legal Services & Support | 17 (100.0%) | 0 (0.0%) |
| Education Instruction & Library | 61 (46.2%) | 71 (53.8%) |
| Arts, Media & Entertainment | 0 (0.0%) | 15 (100.0%) |
| Health Diagnosing & Treating | 16 (22.2%) | 56 (77.8%) |
| Health Technologists | 16 (30.8%) | 36 (69.2%) |
| Total (Category) | 515 (63.3%) | 299 (36.7%) |
| Total (Overall) | 987 (53.1%) | 870 (46.9%) |
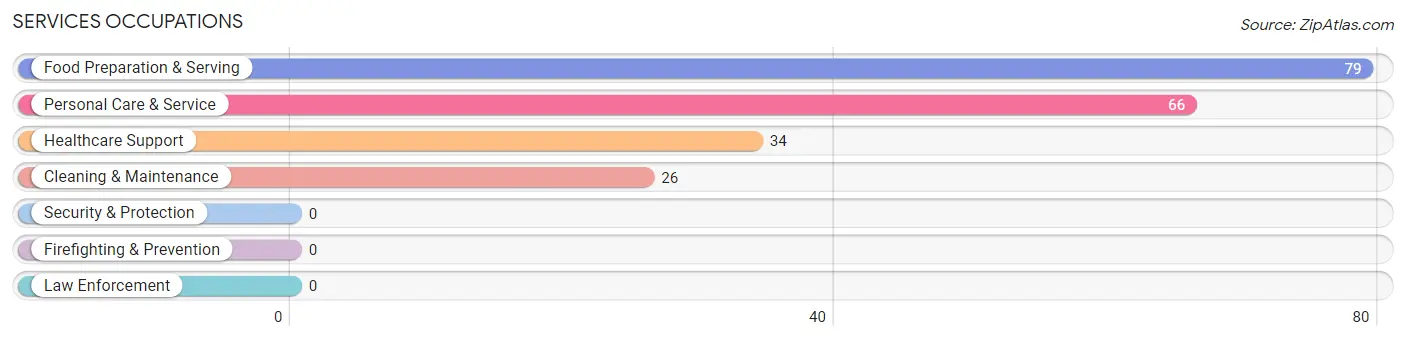
Services Occupations
The most common Services occupations in Leo Cedarville are Food Preparation & Serving (79 | 4.3%), Personal Care & Service (66 | 3.5%), Healthcare Support (34 | 1.8%), and Cleaning & Maintenance (26 | 1.4%).
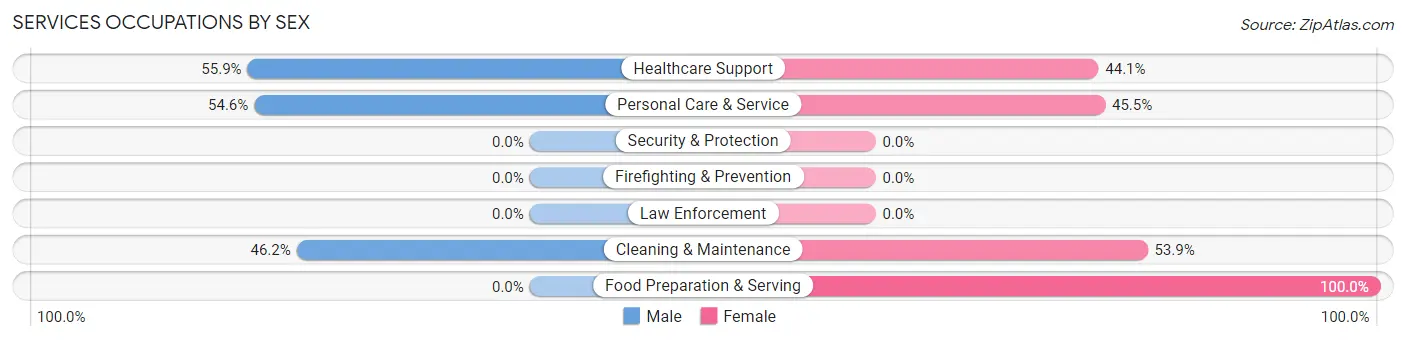
Services Occupations by Sex
Within the Services occupations in Leo Cedarville, the most male-oriented occupations are Healthcare Support (55.9%), Personal Care & Service (54.5%), and Cleaning & Maintenance (46.2%), while the most female-oriented occupations are Food Preparation & Serving (100.0%), Cleaning & Maintenance (53.8%), and Personal Care & Service (45.5%).
| Occupation | Male | Female |
| Healthcare Support | 19 (55.9%) | 15 (44.1%) |
| Security & Protection | 0 (0.0%) | 0 (0.0%) |
| Firefighting & Prevention | 0 (0.0%) | 0 (0.0%) |
| Law Enforcement | 0 (0.0%) | 0 (0.0%) |
| Food Preparation & Serving | 0 (0.0%) | 79 (100.0%) |
| Cleaning & Maintenance | 12 (46.2%) | 14 (53.8%) |
| Personal Care & Service | 36 (54.5%) | 30 (45.5%) |
| Total (Category) | 67 (32.7%) | 138 (67.3%) |
| Total (Overall) | 987 (53.1%) | 870 (46.9%) |
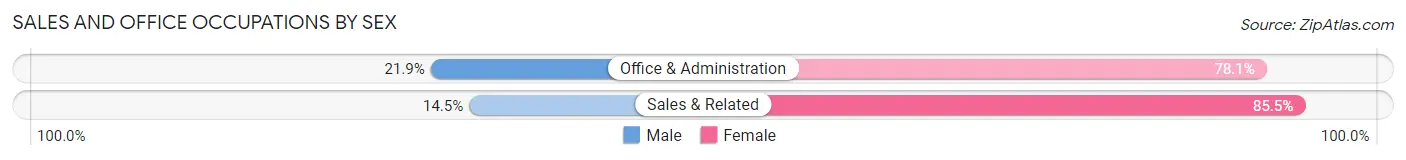
Sales and Office Occupations
The most common Sales and Office occupations in Leo Cedarville are Office & Administration (269 | 14.5%), and Sales & Related (179 | 9.6%).

Sales and Office Occupations by Sex
| Occupation | Male | Female |
| Sales & Related | 26 (14.5%) | 153 (85.5%) |
| Office & Administration | 59 (21.9%) | 210 (78.1%) |
| Total (Category) | 85 (19.0%) | 363 (81.0%) |
| Total (Overall) | 987 (53.1%) | 870 (46.9%) |
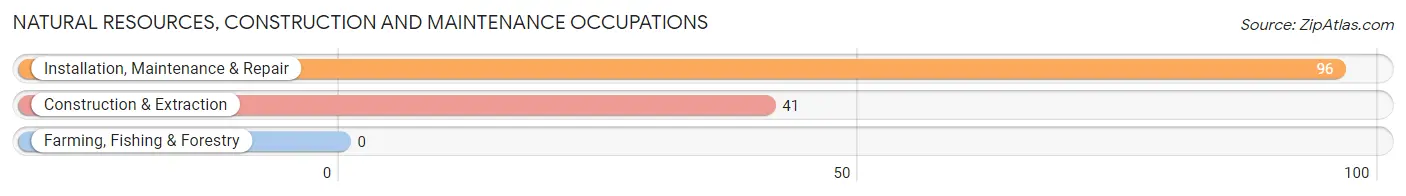
Natural Resources, Construction and Maintenance Occupations
The most common Natural Resources, Construction and Maintenance occupations in Leo Cedarville are Installation, Maintenance & Repair (96 | 5.2%), and Construction & Extraction (41 | 2.2%).
Natural Resources, Construction and Maintenance Occupations by Sex
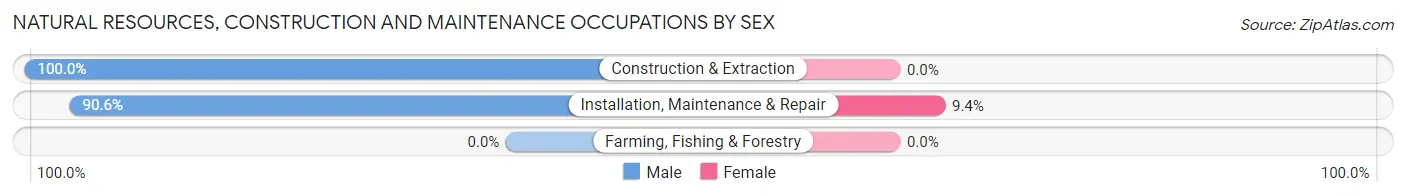
| Occupation | Male | Female |
| Farming, Fishing & Forestry | 0 (0.0%) | 0 (0.0%) |
| Construction & Extraction | 41 (100.0%) | 0 (0.0%) |
| Installation, Maintenance & Repair | 87 (90.6%) | 9 (9.4%) |
| Total (Category) | 128 (93.4%) | 9 (6.6%) |
| Total (Overall) | 987 (53.1%) | 870 (46.9%) |
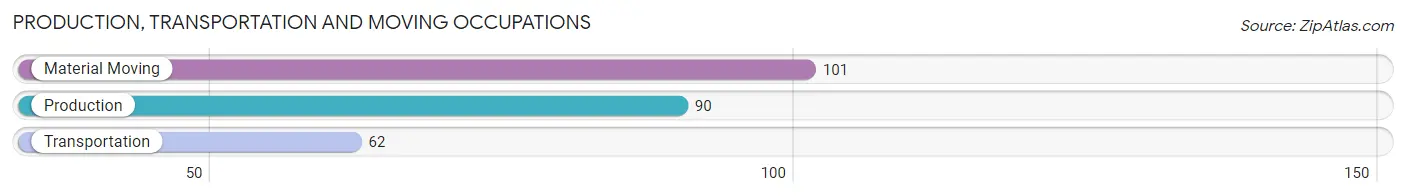
Production, Transportation and Moving Occupations
The most common Production, Transportation and Moving occupations in Leo Cedarville are Material Moving (101 | 5.4%), Production (90 | 4.9%), and Transportation (62 | 3.3%).
Production, Transportation and Moving Occupations by Sex
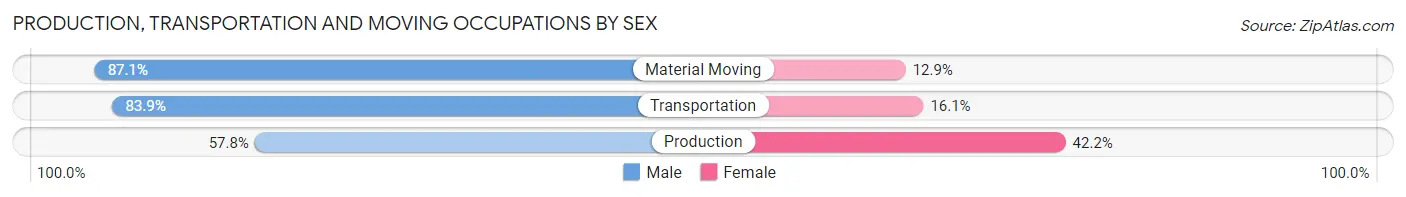
| Occupation | Male | Female |
| Production | 52 (57.8%) | 38 (42.2%) |
| Transportation | 52 (83.9%) | 10 (16.1%) |
| Material Moving | 88 (87.1%) | 13 (12.9%) |
| Total (Category) | 192 (75.9%) | 61 (24.1%) |
| Total (Overall) | 987 (53.1%) | 870 (46.9%) |
Employment Industries by Sex in Leo Cedarville
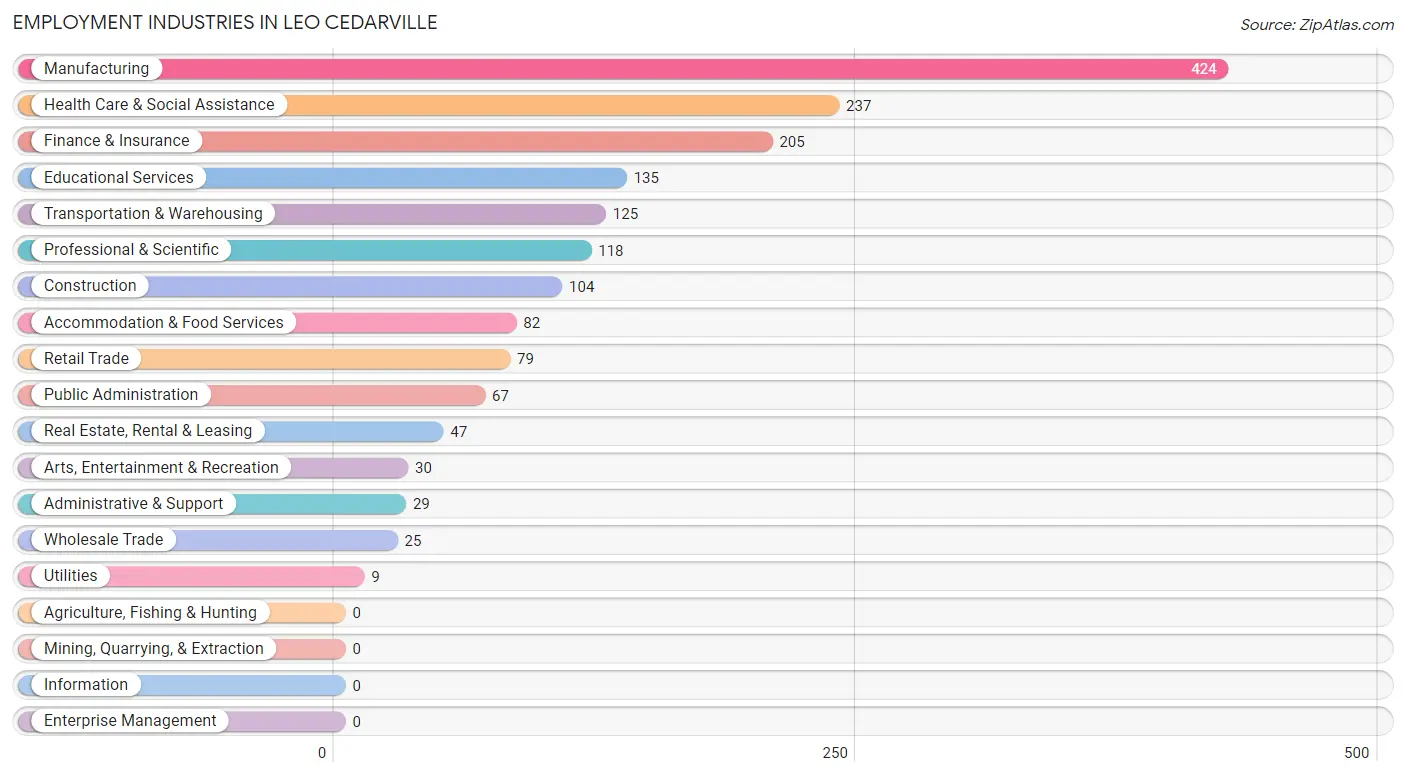
Employment Industries in Leo Cedarville
The major employment industries in Leo Cedarville include Manufacturing (424 | 22.8%), Health Care & Social Assistance (237 | 12.8%), Finance & Insurance (205 | 11.0%), Educational Services (135 | 7.3%), and Transportation & Warehousing (125 | 6.7%).
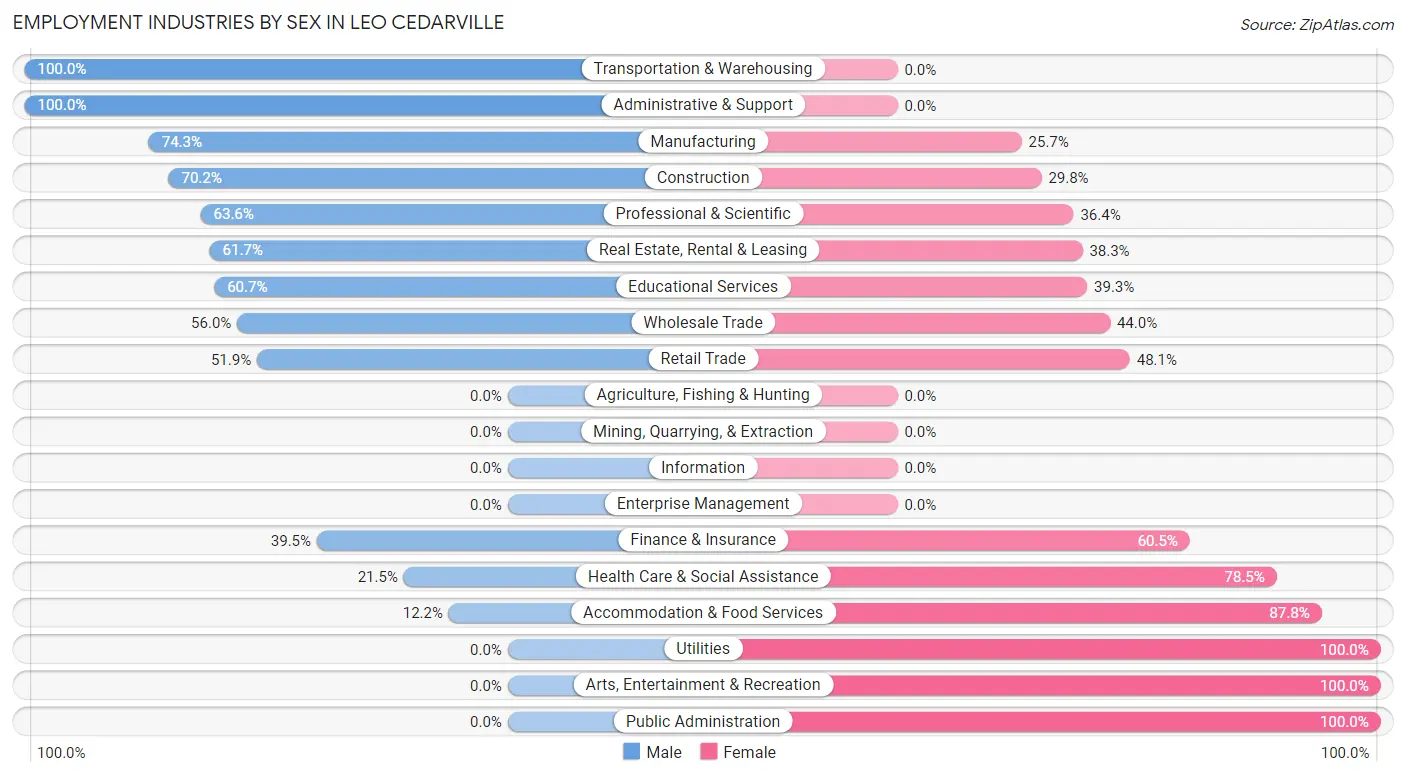
Employment Industries by Sex in Leo Cedarville
The Leo Cedarville industries that see more men than women are Transportation & Warehousing (100.0%), Administrative & Support (100.0%), and Manufacturing (74.3%), whereas the industries that tend to have a higher number of women are Utilities (100.0%), Arts, Entertainment & Recreation (100.0%), and Public Administration (100.0%).
| Industry | Male | Female |
| Agriculture, Fishing & Hunting | 0 (0.0%) | 0 (0.0%) |
| Mining, Quarrying, & Extraction | 0 (0.0%) | 0 (0.0%) |
| Construction | 73 (70.2%) | 31 (29.8%) |
| Manufacturing | 315 (74.3%) | 109 (25.7%) |
| Wholesale Trade | 14 (56.0%) | 11 (44.0%) |
| Retail Trade | 41 (51.9%) | 38 (48.1%) |
| Transportation & Warehousing | 125 (100.0%) | 0 (0.0%) |
| Utilities | 0 (0.0%) | 9 (100.0%) |
| Information | 0 (0.0%) | 0 (0.0%) |
| Finance & Insurance | 81 (39.5%) | 124 (60.5%) |
| Real Estate, Rental & Leasing | 29 (61.7%) | 18 (38.3%) |
| Professional & Scientific | 75 (63.6%) | 43 (36.4%) |
| Enterprise Management | 0 (0.0%) | 0 (0.0%) |
| Administrative & Support | 29 (100.0%) | 0 (0.0%) |
| Educational Services | 82 (60.7%) | 53 (39.3%) |
| Health Care & Social Assistance | 51 (21.5%) | 186 (78.5%) |
| Arts, Entertainment & Recreation | 0 (0.0%) | 30 (100.0%) |
| Accommodation & Food Services | 10 (12.2%) | 72 (87.8%) |
| Public Administration | 0 (0.0%) | 67 (100.0%) |
| Total | 987 (53.1%) | 870 (46.9%) |
Education in Leo Cedarville
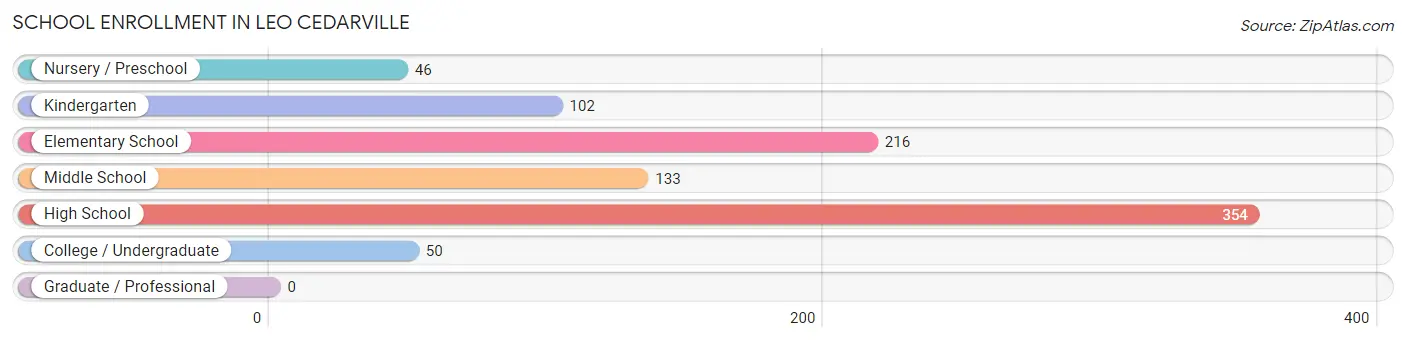
School Enrollment in Leo Cedarville
The most common levels of schooling among the 901 students in Leo Cedarville are high school (354 | 39.3%), elementary school (216 | 24.0%), and middle school (133 | 14.8%).
| School Level | # Students | % Students |
| Nursery / Preschool | 46 | 5.1% |
| Kindergarten | 102 | 11.3% |
| Elementary School | 216 | 24.0% |
| Middle School | 133 | 14.8% |
| High School | 354 | 39.3% |
| College / Undergraduate | 50 | 5.6% |
| Graduate / Professional | 0 | 0.0% |
| Total | 901 | 100.0% |
School Enrollment by Age by Funding Source in Leo Cedarville
Out of a total of 901 students who are enrolled in schools in Leo Cedarville, 201 (22.3%) attend a private institution, while the remaining 700 (77.7%) are enrolled in public schools. The age group of 3 to 4 year olds has the highest likelihood of being enrolled in private schools, with 46 (100.0% in the age bracket) enrolled. Conversely, the age group of 20 to 24 year olds has the lowest likelihood of being enrolled in a private school, with 22 (100.0% in the age bracket) attending a public institution.
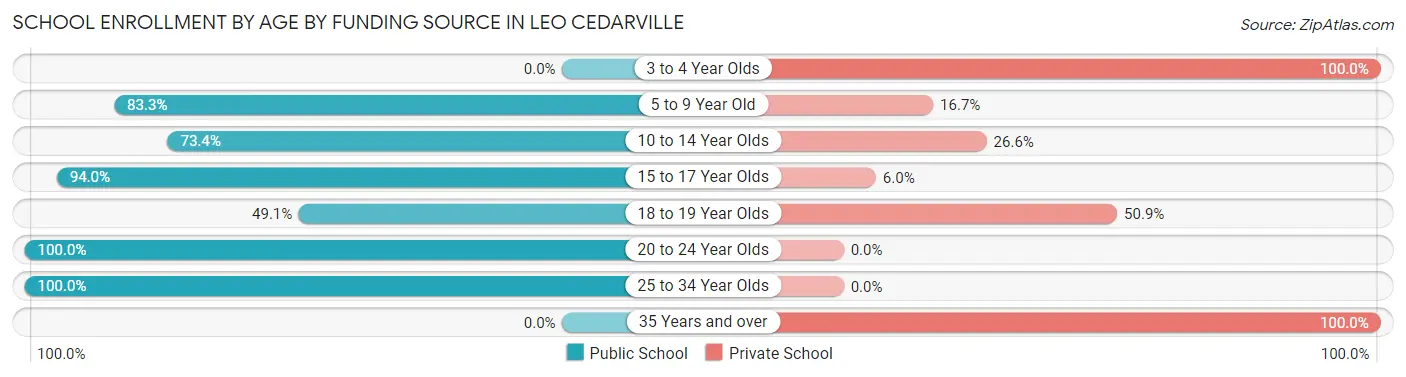
| Age Bracket | Public School | Private School |
| 3 to 4 Year Olds | 0 (0.0%) | 46 (100.0%) |
| 5 to 9 Year Old | 265 (83.3%) | 53 (16.7%) |
| 10 to 14 Year Olds | 135 (73.4%) | 49 (26.6%) |
| 15 to 17 Year Olds | 235 (94.0%) | 15 (6.0%) |
| 18 to 19 Year Olds | 26 (49.1%) | 27 (50.9%) |
| 20 to 24 Year Olds | 22 (100.0%) | 0 (0.0%) |
| 25 to 34 Year Olds | 17 (100.0%) | 0 (0.0%) |
| 35 Years and over | 0 (0.0%) | 11 (100.0%) |
| Total | 700 (77.7%) | 201 (22.3%) |
Educational Attainment by Field of Study in Leo Cedarville
Business (278 | 26.1%), science & technology (194 | 18.2%), liberal arts & history (154 | 14.5%), psychology (88 | 8.3%), and engineering (78 | 7.3%) are the most common fields of study among 1,064 individuals in Leo Cedarville who have obtained a bachelor's degree or higher.
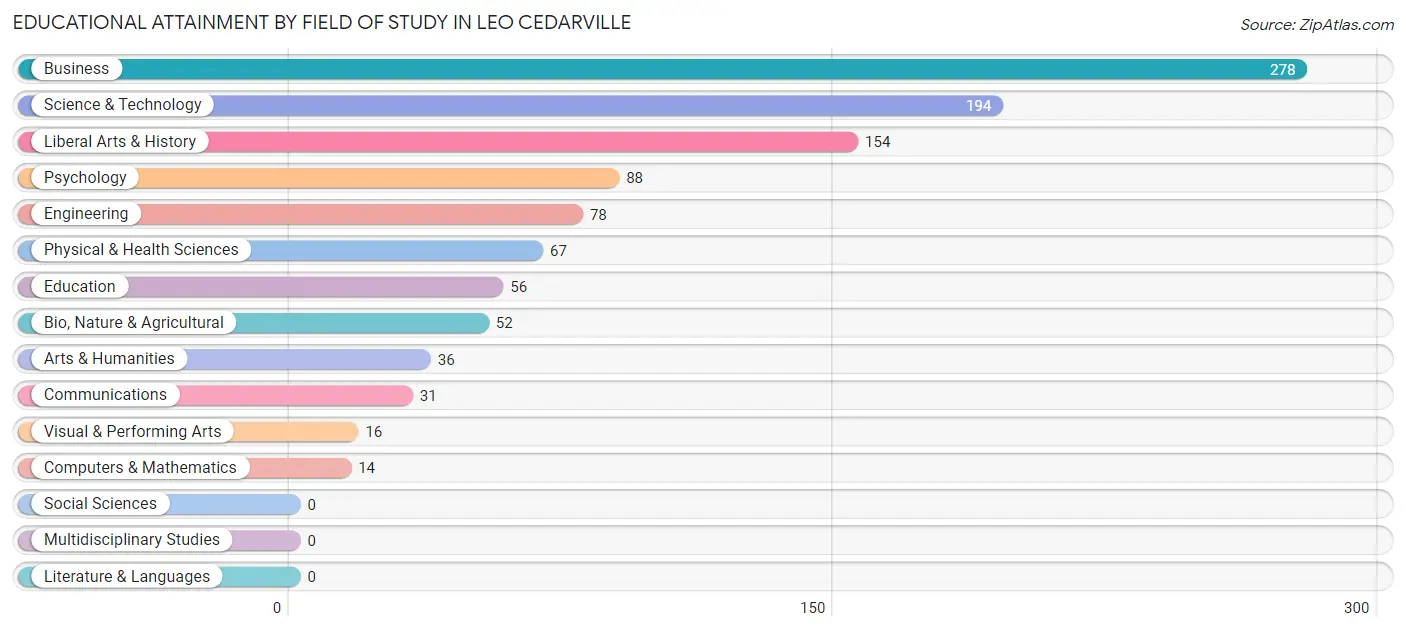
| Field of Study | # Graduates | % Graduates |
| Computers & Mathematics | 14 | 1.3% |
| Bio, Nature & Agricultural | 52 | 4.9% |
| Physical & Health Sciences | 67 | 6.3% |
| Psychology | 88 | 8.3% |
| Social Sciences | 0 | 0.0% |
| Engineering | 78 | 7.3% |
| Multidisciplinary Studies | 0 | 0.0% |
| Science & Technology | 194 | 18.2% |
| Business | 278 | 26.1% |
| Education | 56 | 5.3% |
| Literature & Languages | 0 | 0.0% |
| Liberal Arts & History | 154 | 14.5% |
| Visual & Performing Arts | 16 | 1.5% |
| Communications | 31 | 2.9% |
| Arts & Humanities | 36 | 3.4% |
| Total | 1,064 | 100.0% |
Transportation & Commute in Leo Cedarville
Vehicle Availability by Sex in Leo Cedarville
The most prevalent vehicle ownership categories in Leo Cedarville are males with 3 vehicles (388, accounting for 39.3%) and females with 3 vehicles (386, making up 45.2%).
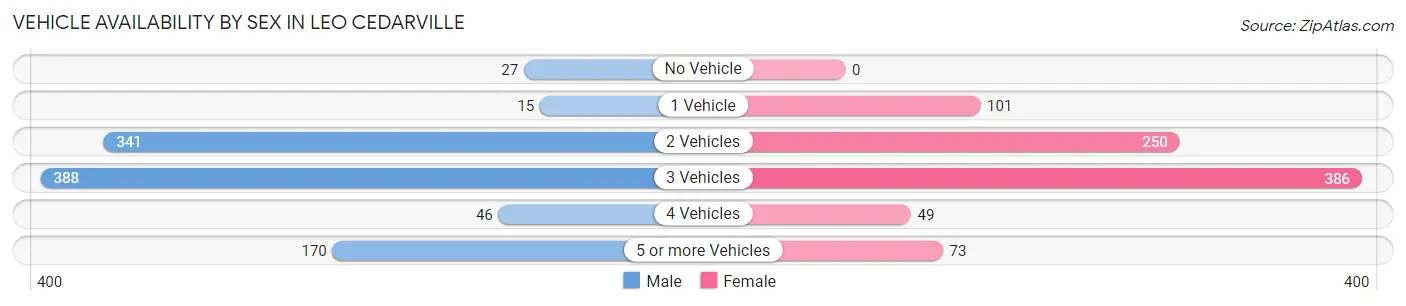
| Vehicles Available | Male | Female |
| No Vehicle | 27 (2.7%) | 0 (0.0%) |
| 1 Vehicle | 15 (1.5%) | 101 (11.8%) |
| 2 Vehicles | 341 (34.5%) | 250 (29.1%) |
| 3 Vehicles | 388 (39.3%) | 386 (44.9%) |
| 4 Vehicles | 46 (4.7%) | 49 (5.7%) |
| 5 or more Vehicles | 170 (17.2%) | 73 (8.5%) |
| Total | 987 (100.0%) | 859 (100.0%) |
Commute Time in Leo Cedarville
The most frequently occuring commute durations in Leo Cedarville are 20 to 24 minutes (450 commuters, 26.3%), 15 to 19 minutes (369 commuters, 21.5%), and 25 to 29 minutes (318 commuters, 18.5%).
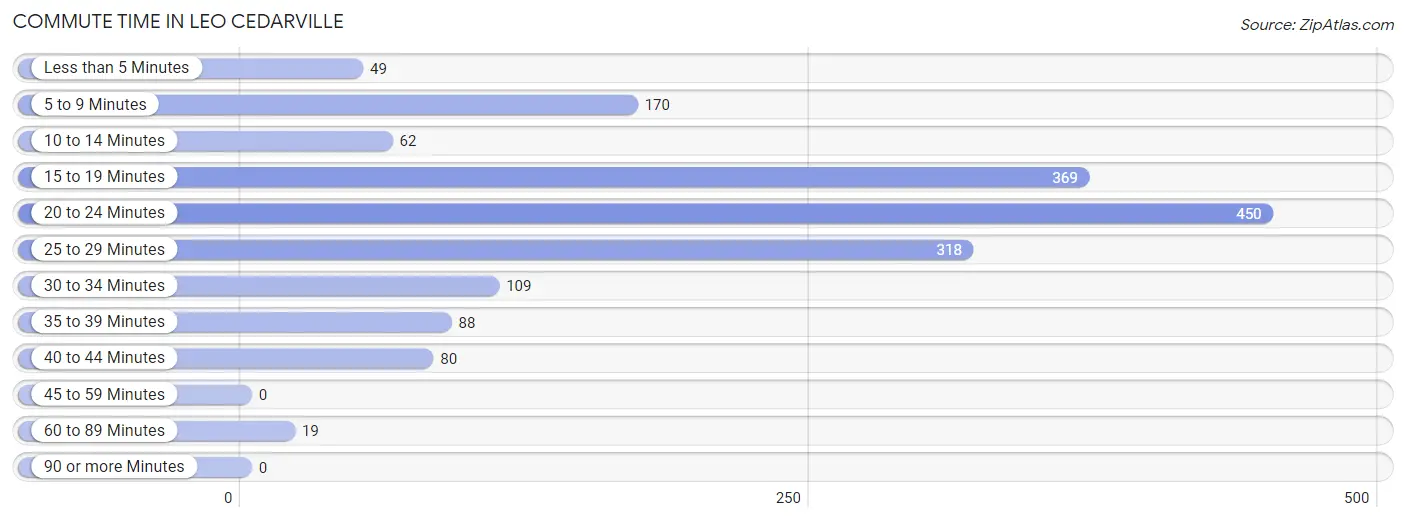
| Commute Time | # Commuters | % Commuters |
| Less than 5 Minutes | 49 | 2.9% |
| 5 to 9 Minutes | 170 | 9.9% |
| 10 to 14 Minutes | 62 | 3.6% |
| 15 to 19 Minutes | 369 | 21.5% |
| 20 to 24 Minutes | 450 | 26.3% |
| 25 to 29 Minutes | 318 | 18.5% |
| 30 to 34 Minutes | 109 | 6.4% |
| 35 to 39 Minutes | 88 | 5.1% |
| 40 to 44 Minutes | 80 | 4.7% |
| 45 to 59 Minutes | 0 | 0.0% |
| 60 to 89 Minutes | 19 | 1.1% |
| 90 or more Minutes | 0 | 0.0% |
Commute Time by Sex in Leo Cedarville
The most common commute times in Leo Cedarville are 20 to 24 minutes (340 commuters, 35.7%) for males and 15 to 19 minutes (208 commuters, 27.3%) for females.
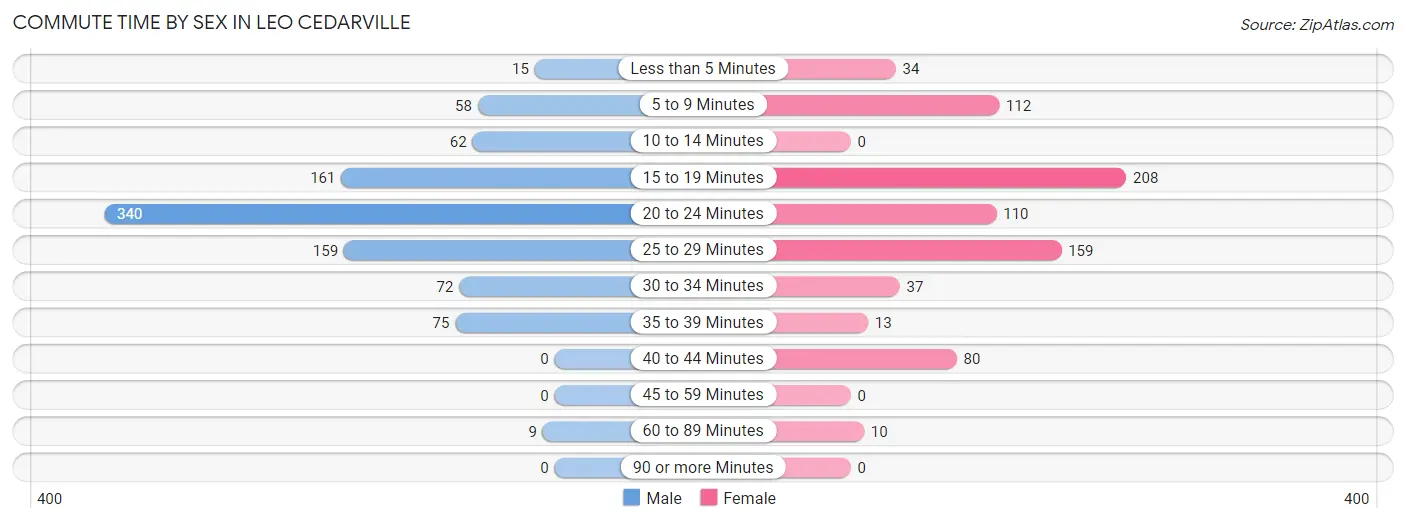
| Commute Time | Male | Female |
| Less than 5 Minutes | 15 (1.6%) | 34 (4.5%) |
| 5 to 9 Minutes | 58 (6.1%) | 112 (14.7%) |
| 10 to 14 Minutes | 62 (6.5%) | 0 (0.0%) |
| 15 to 19 Minutes | 161 (16.9%) | 208 (27.3%) |
| 20 to 24 Minutes | 340 (35.7%) | 110 (14.4%) |
| 25 to 29 Minutes | 159 (16.7%) | 159 (20.8%) |
| 30 to 34 Minutes | 72 (7.6%) | 37 (4.9%) |
| 35 to 39 Minutes | 75 (7.9%) | 13 (1.7%) |
| 40 to 44 Minutes | 0 (0.0%) | 80 (10.5%) |
| 45 to 59 Minutes | 0 (0.0%) | 0 (0.0%) |
| 60 to 89 Minutes | 9 (0.9%) | 10 (1.3%) |
| 90 or more Minutes | 0 (0.0%) | 0 (0.0%) |
Time of Departure to Work by Sex in Leo Cedarville
The most frequent times of departure to work in Leo Cedarville are 5:00 AM to 5:29 AM (206, 21.7%) for males and 7:30 AM to 7:59 AM (214, 28.1%) for females.
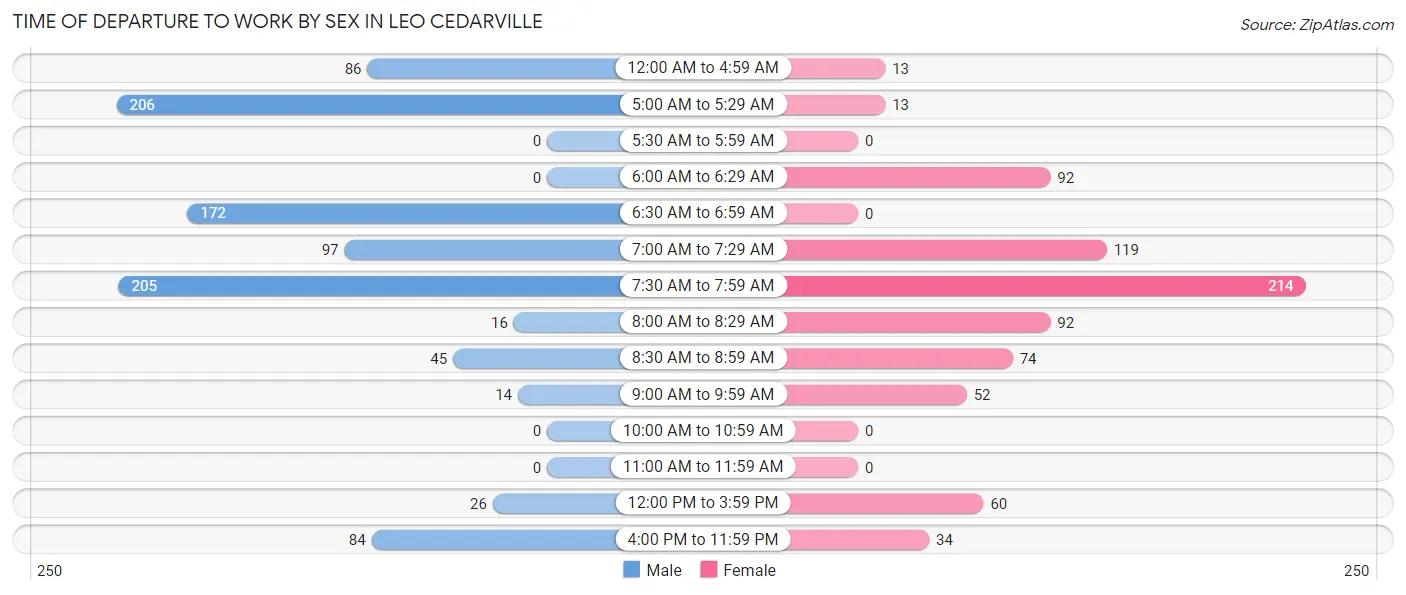
| Time of Departure | Male | Female |
| 12:00 AM to 4:59 AM | 86 (9.0%) | 13 (1.7%) |
| 5:00 AM to 5:29 AM | 206 (21.7%) | 13 (1.7%) |
| 5:30 AM to 5:59 AM | 0 (0.0%) | 0 (0.0%) |
| 6:00 AM to 6:29 AM | 0 (0.0%) | 92 (12.1%) |
| 6:30 AM to 6:59 AM | 172 (18.1%) | 0 (0.0%) |
| 7:00 AM to 7:29 AM | 97 (10.2%) | 119 (15.6%) |
| 7:30 AM to 7:59 AM | 205 (21.6%) | 214 (28.1%) |
| 8:00 AM to 8:29 AM | 16 (1.7%) | 92 (12.1%) |
| 8:30 AM to 8:59 AM | 45 (4.7%) | 74 (9.7%) |
| 9:00 AM to 9:59 AM | 14 (1.5%) | 52 (6.8%) |
| 10:00 AM to 10:59 AM | 0 (0.0%) | 0 (0.0%) |
| 11:00 AM to 11:59 AM | 0 (0.0%) | 0 (0.0%) |
| 12:00 PM to 3:59 PM | 26 (2.7%) | 60 (7.9%) |
| 4:00 PM to 11:59 PM | 84 (8.8%) | 34 (4.5%) |
| Total | 951 (100.0%) | 763 (100.0%) |
Housing Occupancy in Leo Cedarville
Occupancy by Ownership in Leo Cedarville
Of the total 1,214 dwellings in Leo Cedarville, owner-occupied units account for 1,150 (94.7%), while renter-occupied units make up 64 (5.3%).
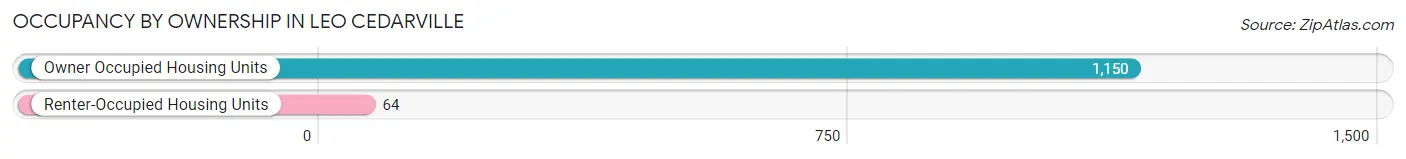
| Occupancy | # Housing Units | % Housing Units |
| Owner Occupied Housing Units | 1,150 | 94.7% |
| Renter-Occupied Housing Units | 64 | 5.3% |
| Total Occupied Housing Units | 1,214 | 100.0% |
Occupancy by Household Size in Leo Cedarville
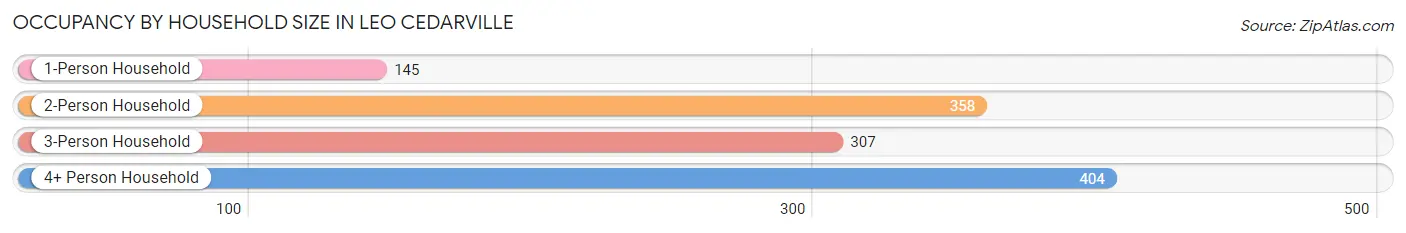
| Household Size | # Housing Units | % Housing Units |
| 1-Person Household | 145 | 11.9% |
| 2-Person Household | 358 | 29.5% |
| 3-Person Household | 307 | 25.3% |
| 4+ Person Household | 404 | 33.3% |
| Total Housing Units | 1,214 | 100.0% |
Occupancy by Ownership by Household Size in Leo Cedarville
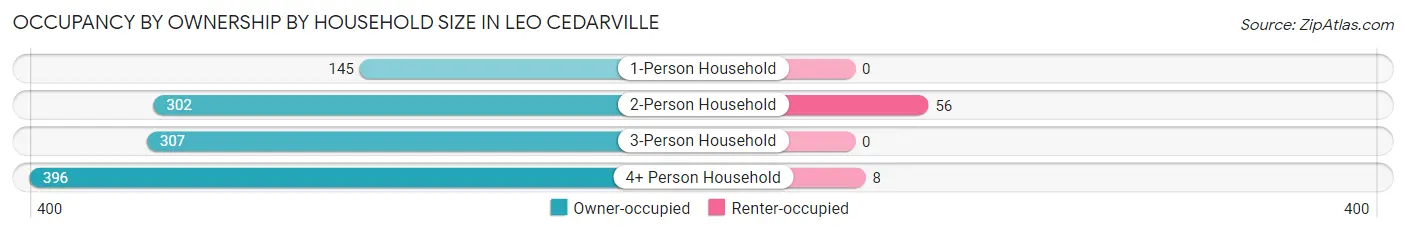
| Household Size | Owner-occupied | Renter-occupied |
| 1-Person Household | 145 (100.0%) | 0 (0.0%) |
| 2-Person Household | 302 (84.4%) | 56 (15.6%) |
| 3-Person Household | 307 (100.0%) | 0 (0.0%) |
| 4+ Person Household | 396 (98.0%) | 8 (2.0%) |
| Total Housing Units | 1,150 (94.7%) | 64 (5.3%) |
Occupancy by Educational Attainment in Leo Cedarville
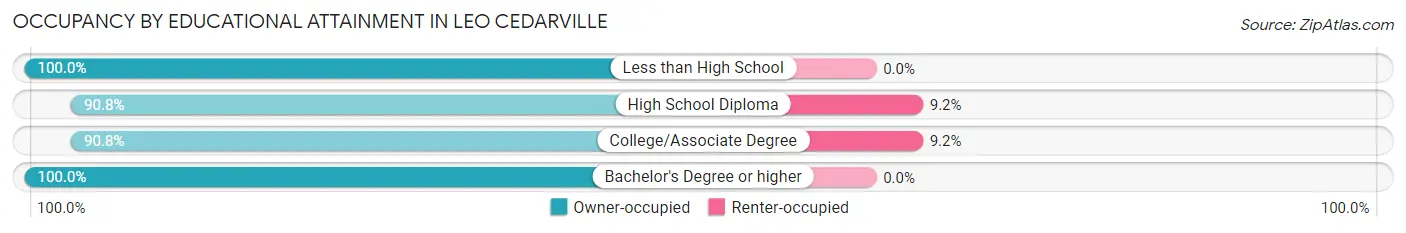
| Household Size | Owner-occupied | Renter-occupied |
| Less than High School | 15 (100.0%) | 0 (0.0%) |
| High School Diploma | 226 (90.8%) | 23 (9.2%) |
| College/Associate Degree | 403 (90.8%) | 41 (9.2%) |
| Bachelor's Degree or higher | 506 (100.0%) | 0 (0.0%) |
Occupancy by Age of Householder in Leo Cedarville
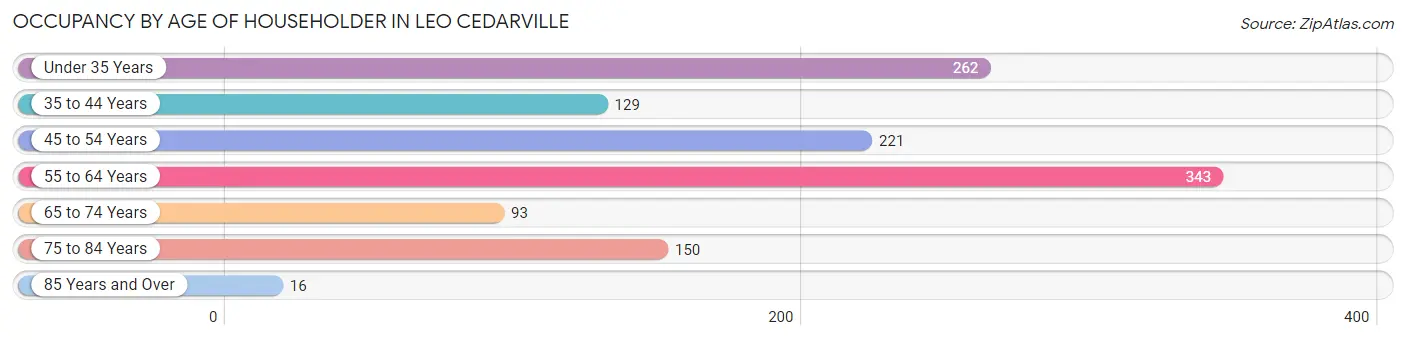
| Age Bracket | # Households | % Households |
| Under 35 Years | 262 | 21.6% |
| 35 to 44 Years | 129 | 10.6% |
| 45 to 54 Years | 221 | 18.2% |
| 55 to 64 Years | 343 | 28.2% |
| 65 to 74 Years | 93 | 7.7% |
| 75 to 84 Years | 150 | 12.4% |
| 85 Years and Over | 16 | 1.3% |
| Total | 1,214 | 100.0% |
Housing Finances in Leo Cedarville
Median Income by Occupancy in Leo Cedarville
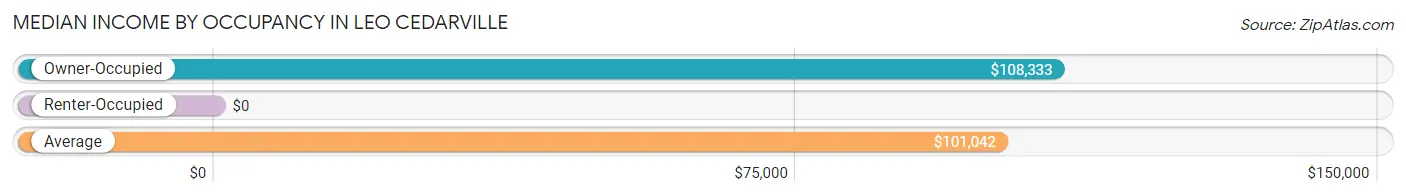
| Occupancy Type | # Households | Median Income |
| Owner-Occupied | 1,150 (94.7%) | $108,333 |
| Renter-Occupied | 64 (5.3%) | $0 |
| Average | 1,214 (100.0%) | $101,042 |
Occupancy by Householder Income Bracket in Leo Cedarville
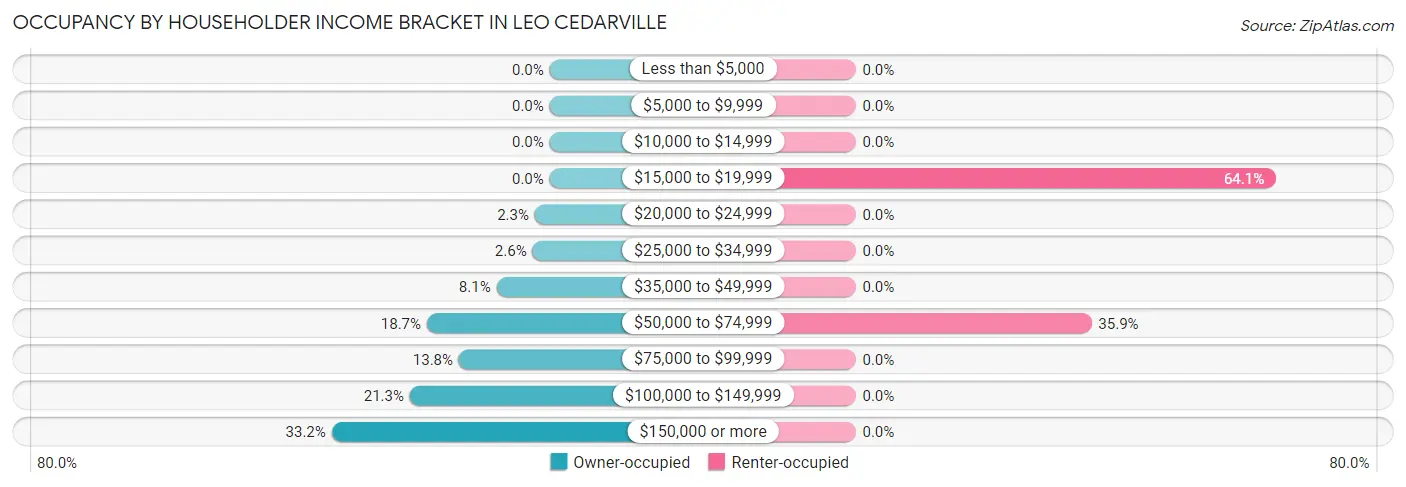
| Income Bracket | Owner-occupied | Renter-occupied |
| Less than $5,000 | 0 (0.0%) | 0 (0.0%) |
| $5,000 to $9,999 | 0 (0.0%) | 0 (0.0%) |
| $10,000 to $14,999 | 0 (0.0%) | 0 (0.0%) |
| $15,000 to $19,999 | 0 (0.0%) | 41 (64.1%) |
| $20,000 to $24,999 | 26 (2.3%) | 0 (0.0%) |
| $25,000 to $34,999 | 30 (2.6%) | 0 (0.0%) |
| $35,000 to $49,999 | 93 (8.1%) | 0 (0.0%) |
| $50,000 to $74,999 | 215 (18.7%) | 23 (35.9%) |
| $75,000 to $99,999 | 159 (13.8%) | 0 (0.0%) |
| $100,000 to $149,999 | 245 (21.3%) | 0 (0.0%) |
| $150,000 or more | 382 (33.2%) | 0 (0.0%) |
| Total | 1,150 (100.0%) | 64 (100.0%) |
Monthly Housing Cost Tiers in Leo Cedarville
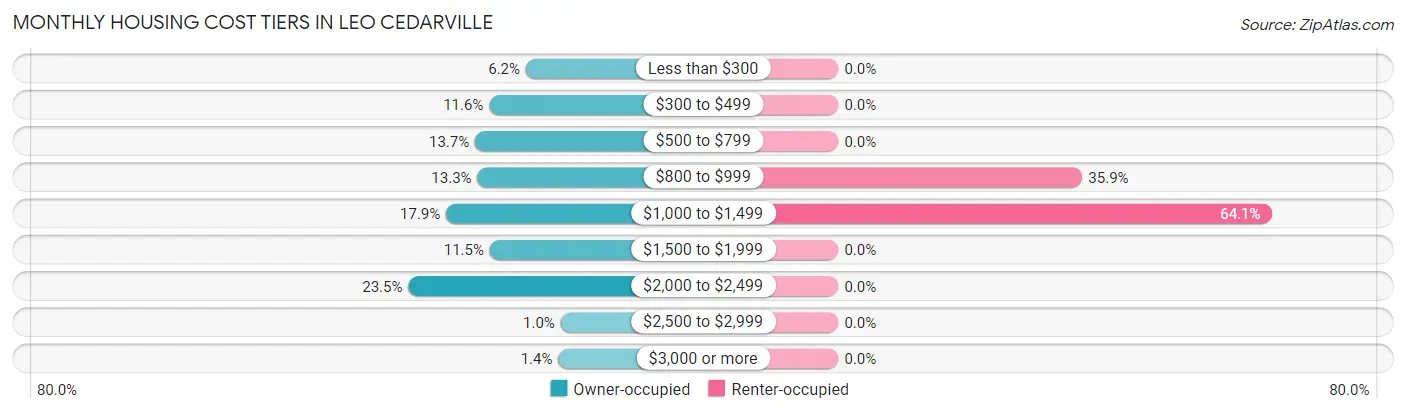
| Monthly Cost | Owner-occupied | Renter-occupied |
| Less than $300 | 71 (6.2%) | 0 (0.0%) |
| $300 to $499 | 133 (11.6%) | 0 (0.0%) |
| $500 to $799 | 157 (13.7%) | 0 (0.0%) |
| $800 to $999 | 153 (13.3%) | 23 (35.9%) |
| $1,000 to $1,499 | 206 (17.9%) | 41 (64.1%) |
| $1,500 to $1,999 | 132 (11.5%) | 0 (0.0%) |
| $2,000 to $2,499 | 270 (23.5%) | 0 (0.0%) |
| $2,500 to $2,999 | 12 (1.0%) | 0 (0.0%) |
| $3,000 or more | 16 (1.4%) | 0 (0.0%) |
| Total | 1,150 (100.0%) | 64 (100.0%) |
Physical Housing Characteristics in Leo Cedarville
Housing Structures in Leo Cedarville
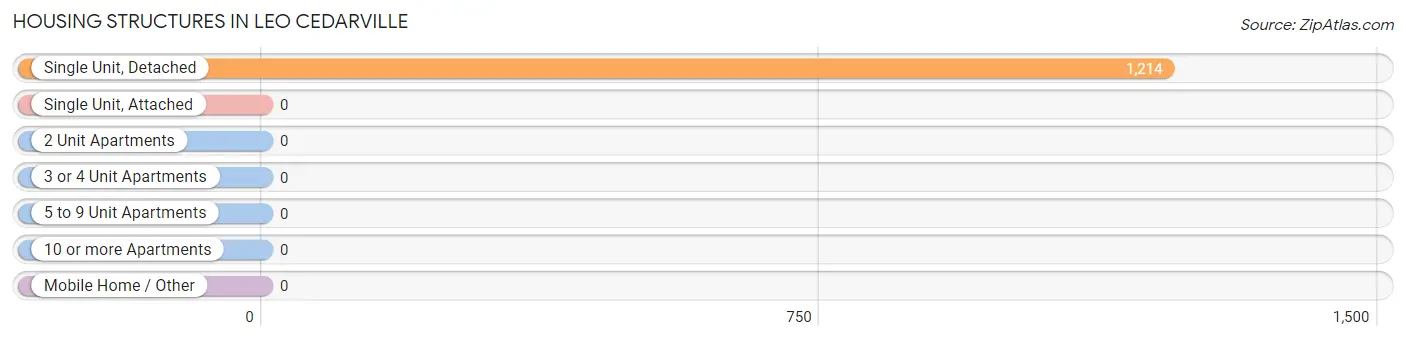
| Structure Type | # Housing Units | % Housing Units |
| Single Unit, Detached | 1,214 | 100.0% |
| Single Unit, Attached | 0 | 0.0% |
| 2 Unit Apartments | 0 | 0.0% |
| 3 or 4 Unit Apartments | 0 | 0.0% |
| 5 to 9 Unit Apartments | 0 | 0.0% |
| 10 or more Apartments | 0 | 0.0% |
| Mobile Home / Other | 0 | 0.0% |
| Total | 1,214 | 100.0% |
Housing Structures by Occupancy in Leo Cedarville
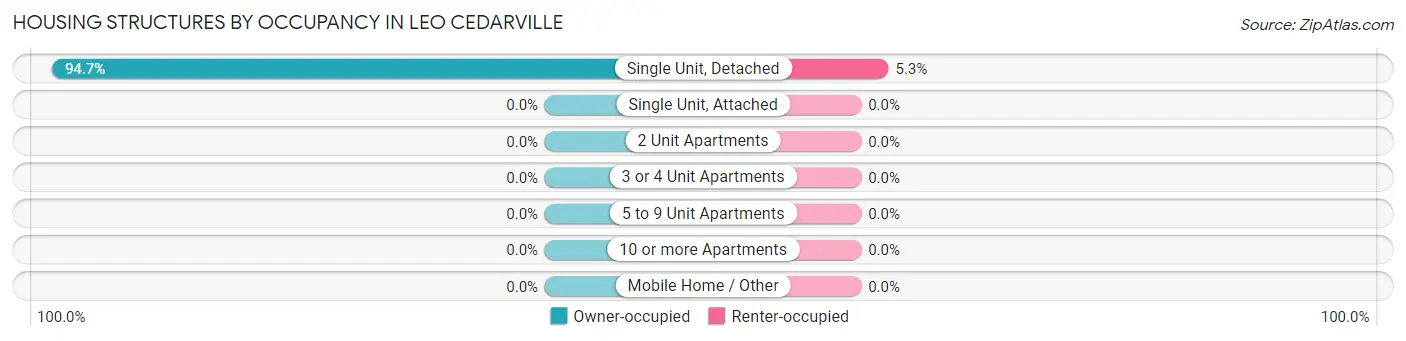
| Structure Type | Owner-occupied | Renter-occupied |
| Single Unit, Detached | 1,150 (94.7%) | 64 (5.3%) |
| Single Unit, Attached | 0 (0.0%) | 0 (0.0%) |
| 2 Unit Apartments | 0 (0.0%) | 0 (0.0%) |
| 3 or 4 Unit Apartments | 0 (0.0%) | 0 (0.0%) |
| 5 to 9 Unit Apartments | 0 (0.0%) | 0 (0.0%) |
| 10 or more Apartments | 0 (0.0%) | 0 (0.0%) |
| Mobile Home / Other | 0 (0.0%) | 0 (0.0%) |
| Total | 1,150 (94.7%) | 64 (5.3%) |
Housing Structures by Number of Rooms in Leo Cedarville
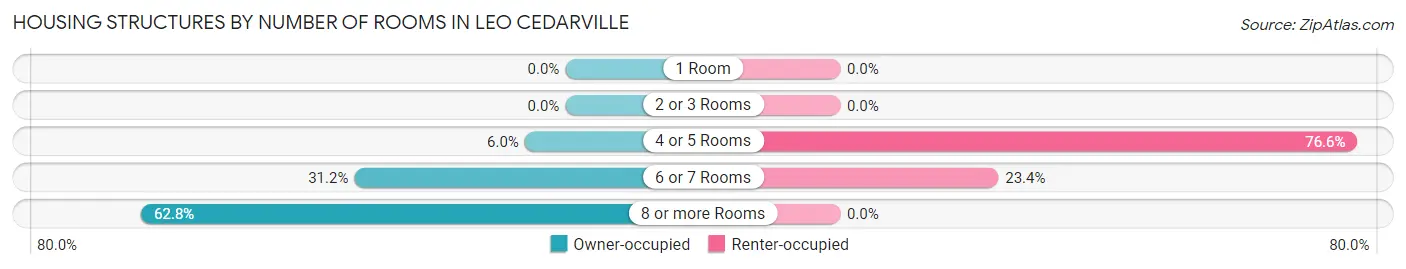
| Number of Rooms | Owner-occupied | Renter-occupied |
| 1 Room | 0 (0.0%) | 0 (0.0%) |
| 2 or 3 Rooms | 0 (0.0%) | 0 (0.0%) |
| 4 or 5 Rooms | 69 (6.0%) | 49 (76.6%) |
| 6 or 7 Rooms | 359 (31.2%) | 15 (23.4%) |
| 8 or more Rooms | 722 (62.8%) | 0 (0.0%) |
| Total | 1,150 (100.0%) | 64 (100.0%) |
Housing Structure by Heating Type in Leo Cedarville
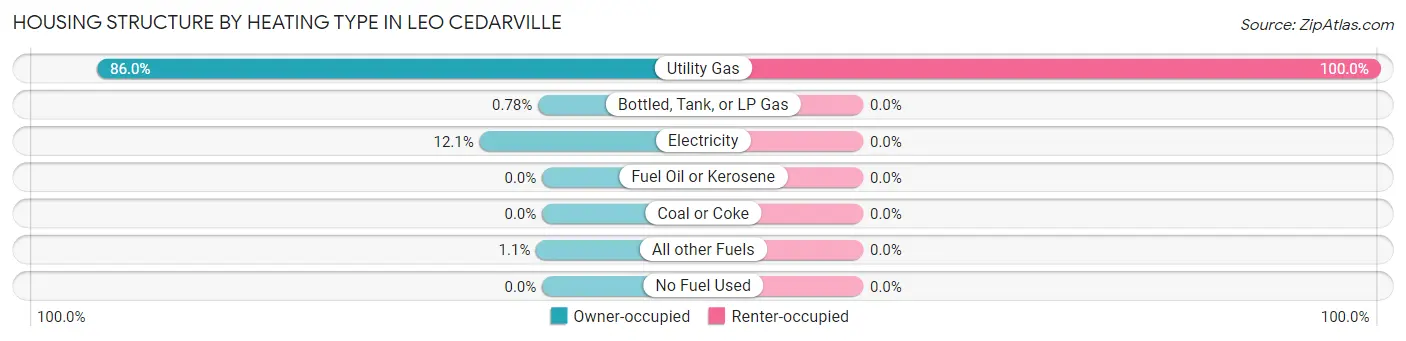
| Heating Type | Owner-occupied | Renter-occupied |
| Utility Gas | 989 (86.0%) | 64 (100.0%) |
| Bottled, Tank, or LP Gas | 9 (0.8%) | 0 (0.0%) |
| Electricity | 139 (12.1%) | 0 (0.0%) |
| Fuel Oil or Kerosene | 0 (0.0%) | 0 (0.0%) |
| Coal or Coke | 0 (0.0%) | 0 (0.0%) |
| All other Fuels | 13 (1.1%) | 0 (0.0%) |
| No Fuel Used | 0 (0.0%) | 0 (0.0%) |
| Total | 1,150 (100.0%) | 64 (100.0%) |
Household Vehicle Usage in Leo Cedarville
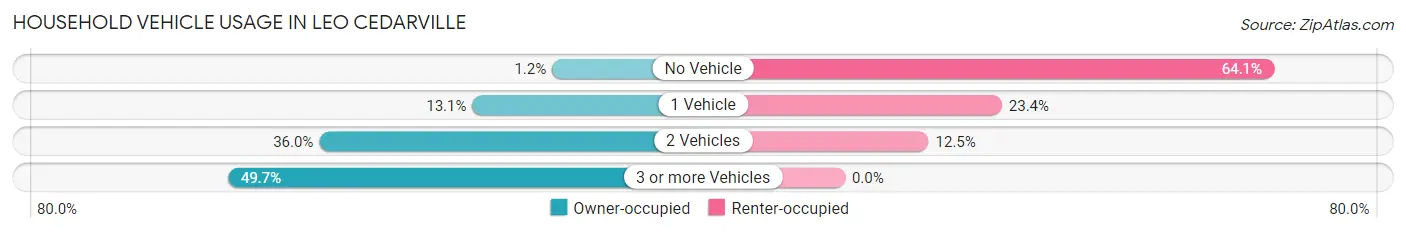
| Vehicles per Household | Owner-occupied | Renter-occupied |
| No Vehicle | 14 (1.2%) | 41 (64.1%) |
| 1 Vehicle | 151 (13.1%) | 15 (23.4%) |
| 2 Vehicles | 414 (36.0%) | 8 (12.5%) |
| 3 or more Vehicles | 571 (49.6%) | 0 (0.0%) |
| Total | 1,150 (100.0%) | 64 (100.0%) |
Real Estate & Mortgages in Leo Cedarville
Real Estate and Mortgage Overview in Leo Cedarville
| Characteristic | Without Mortgage | With Mortgage |
| Housing Units | 378 | 772 |
| Median Property Value | $210,300 | $276,200 |
| Median Household Income | $87,250 | $294 |
| Monthly Housing Costs | $481 | $16 |
| Real Estate Taxes | $1,585 | $0 |
Property Value by Mortgage Status in Leo Cedarville
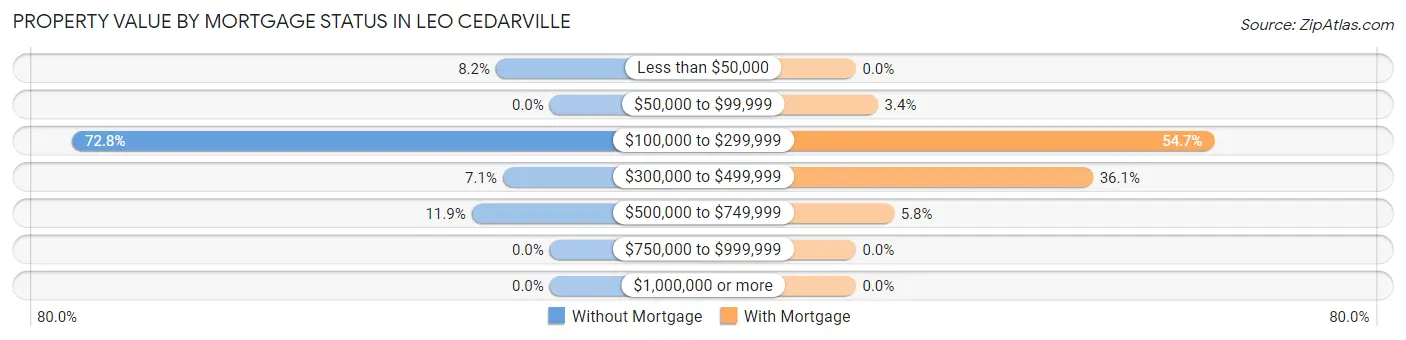
| Property Value | Without Mortgage | With Mortgage |
| Less than $50,000 | 31 (8.2%) | 0 (0.0%) |
| $50,000 to $99,999 | 0 (0.0%) | 26 (3.4%) |
| $100,000 to $299,999 | 275 (72.8%) | 422 (54.7%) |
| $300,000 to $499,999 | 27 (7.1%) | 279 (36.1%) |
| $500,000 to $749,999 | 45 (11.9%) | 45 (5.8%) |
| $750,000 to $999,999 | 0 (0.0%) | 0 (0.0%) |
| $1,000,000 or more | 0 (0.0%) | 0 (0.0%) |
| Total | 378 (100.0%) | 772 (100.0%) |
Household Income by Mortgage Status in Leo Cedarville
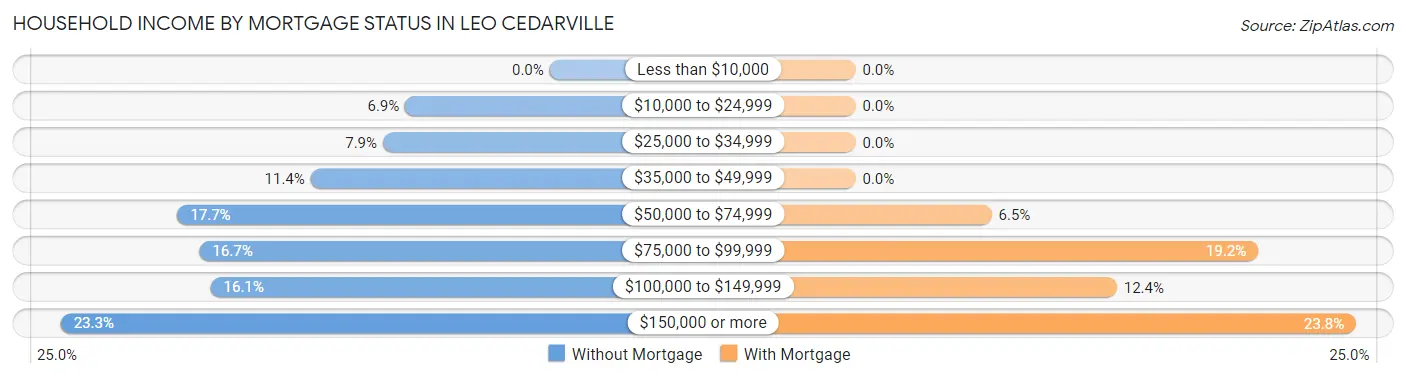
| Household Income | Without Mortgage | With Mortgage |
| Less than $10,000 | 0 (0.0%) | 0 (0.0%) |
| $10,000 to $24,999 | 26 (6.9%) | 0 (0.0%) |
| $25,000 to $34,999 | 30 (7.9%) | 0 (0.0%) |
| $35,000 to $49,999 | 43 (11.4%) | 0 (0.0%) |
| $50,000 to $74,999 | 67 (17.7%) | 50 (6.5%) |
| $75,000 to $99,999 | 63 (16.7%) | 148 (19.2%) |
| $100,000 to $149,999 | 61 (16.1%) | 96 (12.4%) |
| $150,000 or more | 88 (23.3%) | 184 (23.8%) |
| Total | 378 (100.0%) | 772 (100.0%) |
Property Value to Household Income Ratio in Leo Cedarville
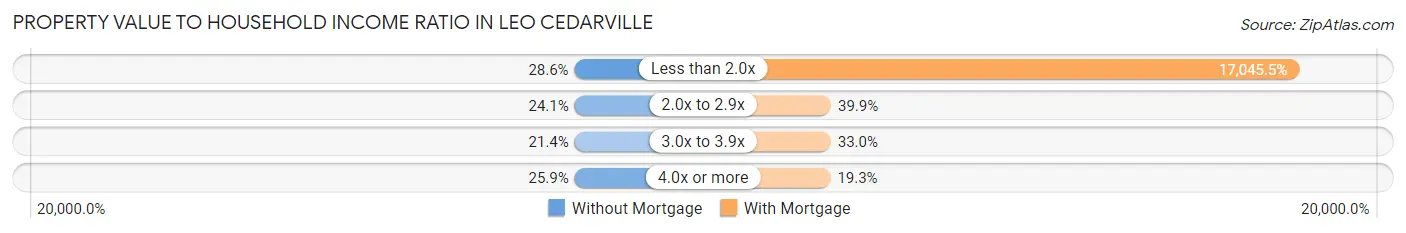
| Value-to-Income Ratio | Without Mortgage | With Mortgage |
| Less than 2.0x | 108 (28.6%) | 131,591 (17,045.5%) |
| 2.0x to 2.9x | 91 (24.1%) | 308 (39.9%) |
| 3.0x to 3.9x | 81 (21.4%) | 255 (33.0%) |
| 4.0x or more | 98 (25.9%) | 149 (19.3%) |
| Total | 378 (100.0%) | 772 (100.0%) |
Real Estate Taxes by Mortgage Status in Leo Cedarville
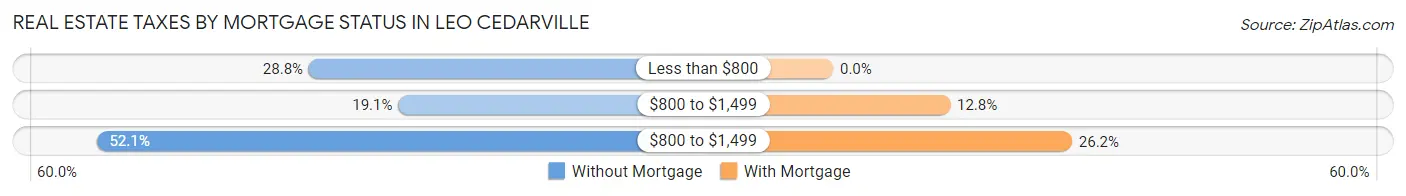
| Property Taxes | Without Mortgage | With Mortgage |
| Less than $800 | 109 (28.8%) | 0 (0.0%) |
| $800 to $1,499 | 72 (19.1%) | 99 (12.8%) |
| $800 to $1,499 | 197 (52.1%) | 202 (26.2%) |
| Total | 378 (100.0%) | 772 (100.0%) |
Health & Disability in Leo Cedarville
Health Insurance Coverage by Age in Leo Cedarville
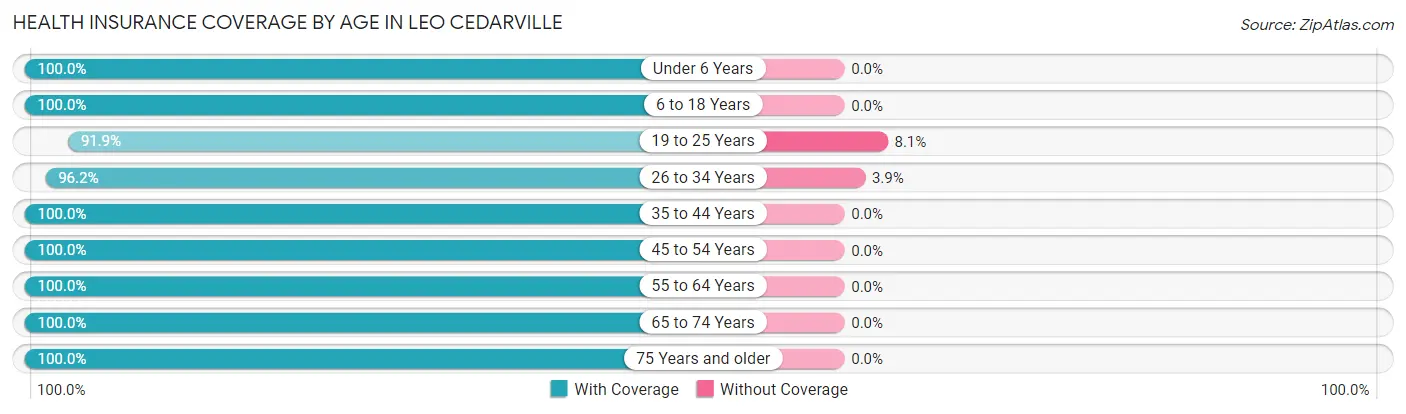
| Age Bracket | With Coverage | Without Coverage |
| Under 6 Years | 309 (100.0%) | 0 (0.0%) |
| 6 to 18 Years | 758 (100.0%) | 0 (0.0%) |
| 19 to 25 Years | 171 (91.9%) | 15 (8.1%) |
| 26 to 34 Years | 550 (96.2%) | 22 (3.8%) |
| 35 to 44 Years | 294 (100.0%) | 0 (0.0%) |
| 45 to 54 Years | 463 (100.0%) | 0 (0.0%) |
| 55 to 64 Years | 595 (100.0%) | 0 (0.0%) |
| 65 to 74 Years | 192 (100.0%) | 0 (0.0%) |
| 75 Years and older | 280 (100.0%) | 0 (0.0%) |
| Total | 3,612 (99.0%) | 37 (1.0%) |
Health Insurance Coverage by Citizenship Status in Leo Cedarville
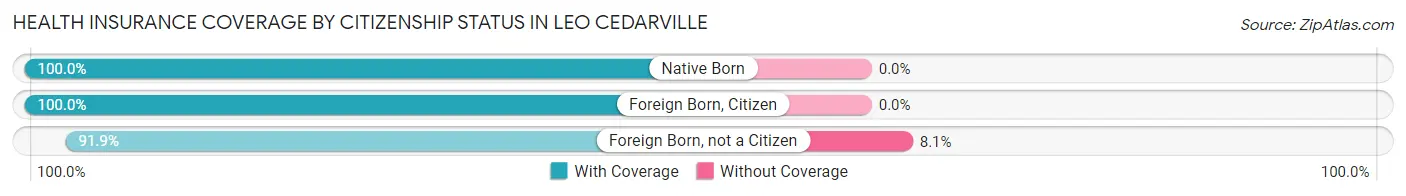
| Citizenship Status | With Coverage | Without Coverage |
| Native Born | 309 (100.0%) | 0 (0.0%) |
| Foreign Born, Citizen | 758 (100.0%) | 0 (0.0%) |
| Foreign Born, not a Citizen | 171 (91.9%) | 15 (8.1%) |
Health Insurance Coverage by Household Income in Leo Cedarville
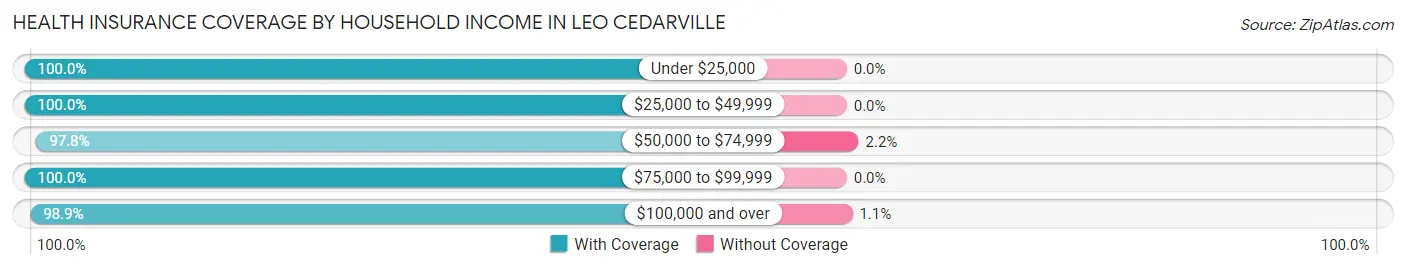
| Household Income | With Coverage | Without Coverage |
| Under $25,000 | 110 (100.0%) | 0 (0.0%) |
| $25,000 to $49,999 | 192 (100.0%) | 0 (0.0%) |
| $50,000 to $74,999 | 665 (97.8%) | 15 (2.2%) |
| $75,000 to $99,999 | 586 (100.0%) | 0 (0.0%) |
| $100,000 and over | 2,059 (98.9%) | 22 (1.1%) |
Public vs Private Health Insurance Coverage by Age in Leo Cedarville
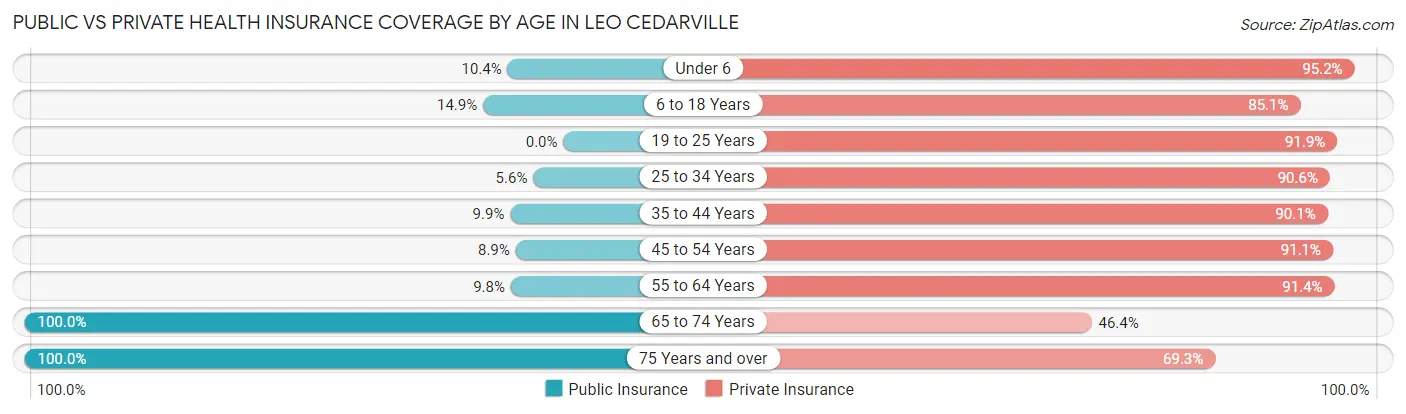
| Age Bracket | Public Insurance | Private Insurance |
| Under 6 | 32 (10.4%) | 294 (95.2%) |
| 6 to 18 Years | 113 (14.9%) | 645 (85.1%) |
| 19 to 25 Years | 0 (0.0%) | 171 (91.9%) |
| 25 to 34 Years | 32 (5.6%) | 518 (90.6%) |
| 35 to 44 Years | 29 (9.9%) | 265 (90.1%) |
| 45 to 54 Years | 41 (8.9%) | 422 (91.1%) |
| 55 to 64 Years | 58 (9.8%) | 544 (91.4%) |
| 65 to 74 Years | 192 (100.0%) | 89 (46.4%) |
| 75 Years and over | 280 (100.0%) | 194 (69.3%) |
| Total | 777 (21.3%) | 3,142 (86.1%) |
Disability Status by Sex by Age in Leo Cedarville
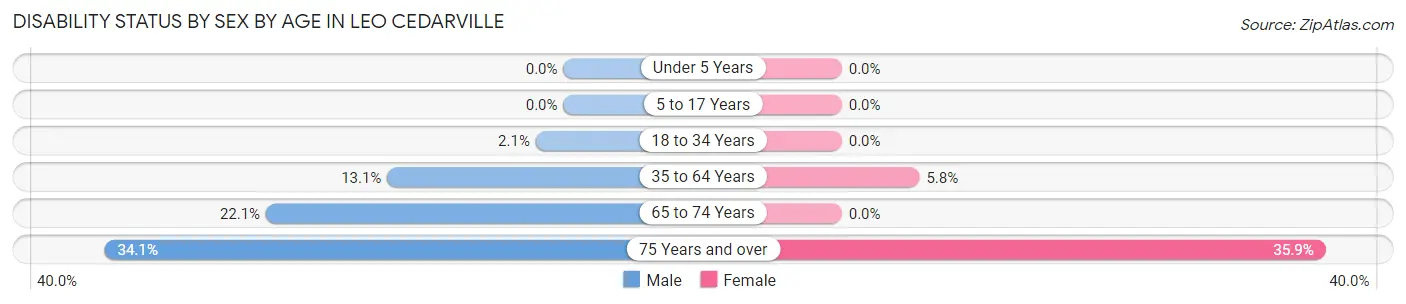
| Age Bracket | Male | Female |
| Under 5 Years | 0 (0.0%) | 0 (0.0%) |
| 5 to 17 Years | 0 (0.0%) | 0 (0.0%) |
| 18 to 34 Years | 9 (2.1%) | 0 (0.0%) |
| 35 to 64 Years | 84 (13.1%) | 41 (5.8%) |
| 65 to 74 Years | 17 (22.1%) | 0 (0.0%) |
| 75 Years and over | 47 (34.1%) | 51 (35.9%) |
Disability Class by Sex by Age in Leo Cedarville
Disability Class: Hearing Difficulty
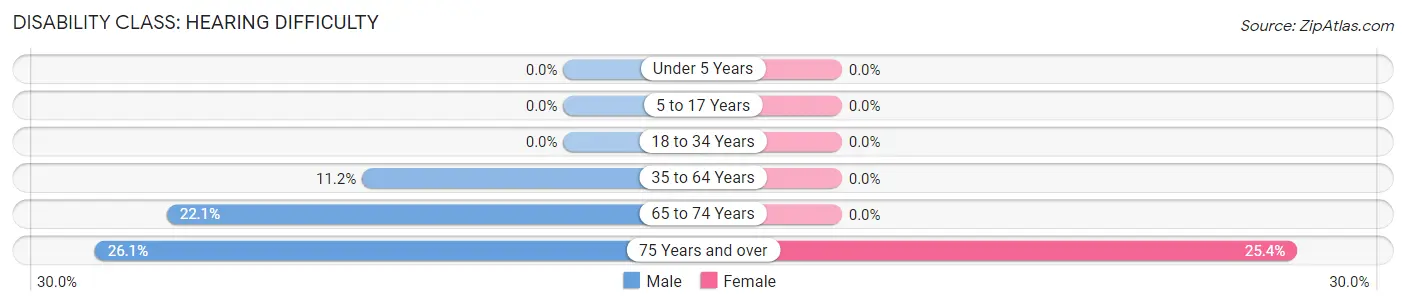
| Age Bracket | Male | Female |
| Under 5 Years | 0 (0.0%) | 0 (0.0%) |
| 5 to 17 Years | 0 (0.0%) | 0 (0.0%) |
| 18 to 34 Years | 0 (0.0%) | 0 (0.0%) |
| 35 to 64 Years | 72 (11.2%) | 0 (0.0%) |
| 65 to 74 Years | 17 (22.1%) | 0 (0.0%) |
| 75 Years and over | 36 (26.1%) | 36 (25.4%) |
Disability Class: Vision Difficulty
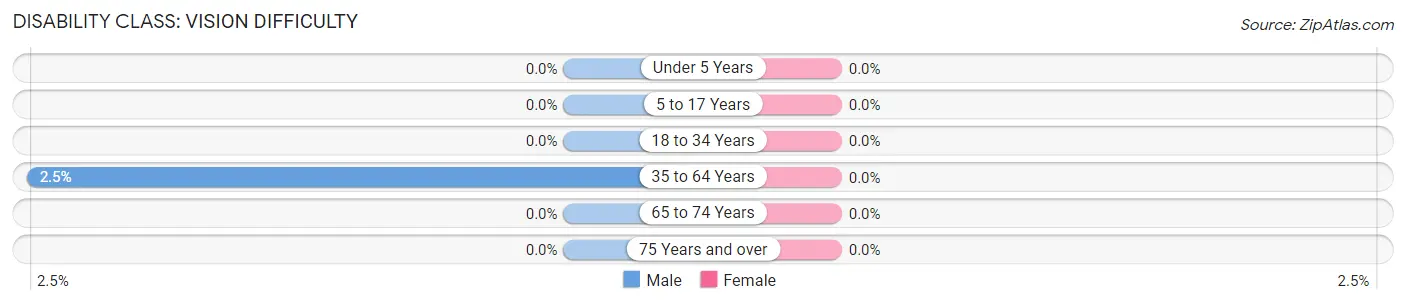
| Age Bracket | Male | Female |
| Under 5 Years | 0 (0.0%) | 0 (0.0%) |
| 5 to 17 Years | 0 (0.0%) | 0 (0.0%) |
| 18 to 34 Years | 0 (0.0%) | 0 (0.0%) |
| 35 to 64 Years | 16 (2.5%) | 0 (0.0%) |
| 65 to 74 Years | 0 (0.0%) | 0 (0.0%) |
| 75 Years and over | 0 (0.0%) | 0 (0.0%) |
Disability Class: Cognitive Difficulty
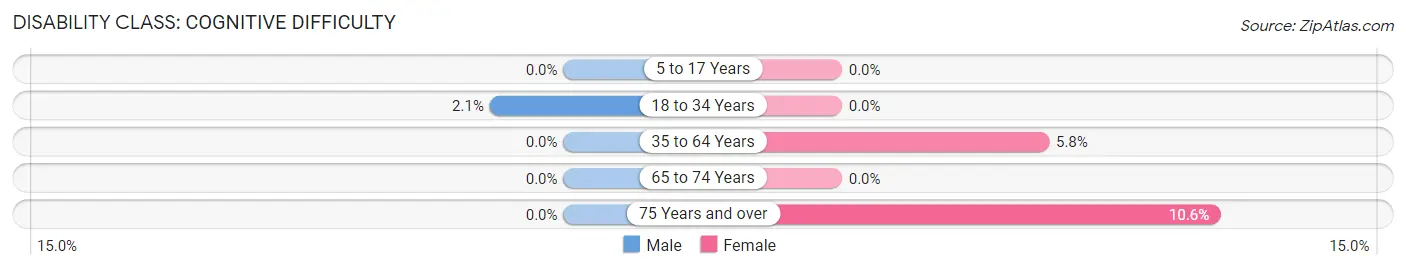
| Age Bracket | Male | Female |
| 5 to 17 Years | 0 (0.0%) | 0 (0.0%) |
| 18 to 34 Years | 9 (2.1%) | 0 (0.0%) |
| 35 to 64 Years | 0 (0.0%) | 41 (5.8%) |
| 65 to 74 Years | 0 (0.0%) | 0 (0.0%) |
| 75 Years and over | 0 (0.0%) | 15 (10.6%) |
Disability Class: Ambulatory Difficulty
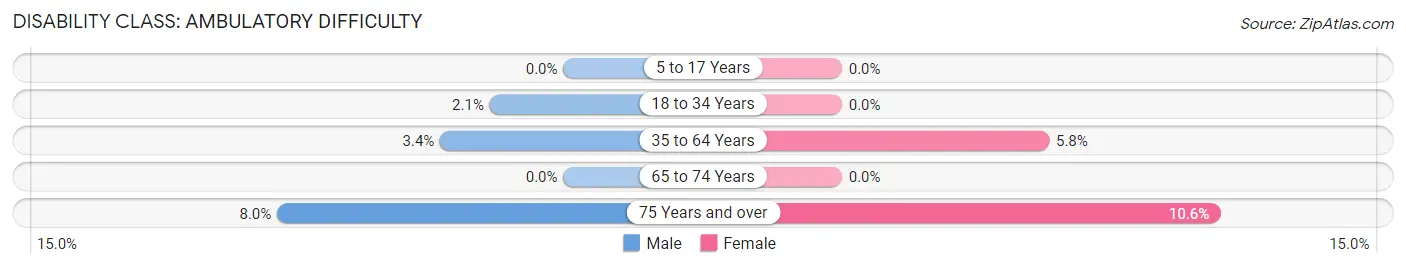
| Age Bracket | Male | Female |
| 5 to 17 Years | 0 (0.0%) | 0 (0.0%) |
| 18 to 34 Years | 9 (2.1%) | 0 (0.0%) |
| 35 to 64 Years | 22 (3.4%) | 41 (5.8%) |
| 65 to 74 Years | 0 (0.0%) | 0 (0.0%) |
| 75 Years and over | 11 (8.0%) | 15 (10.6%) |
Disability Class: Self-Care Difficulty
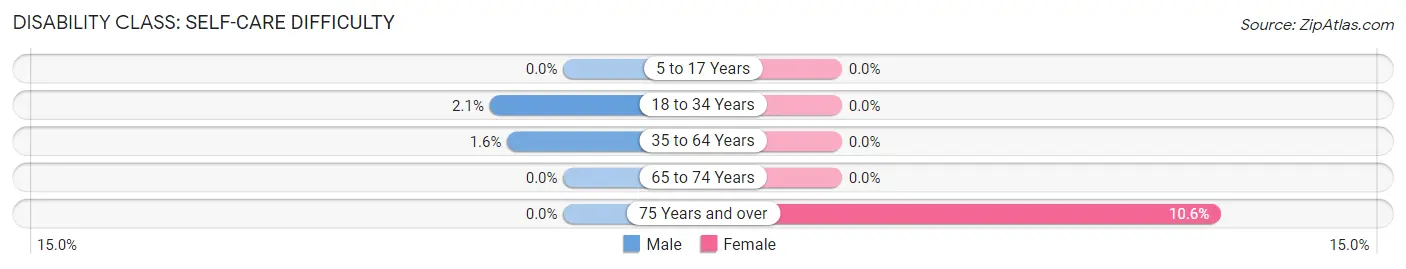
| Age Bracket | Male | Female |
| 5 to 17 Years | 0 (0.0%) | 0 (0.0%) |
| 18 to 34 Years | 9 (2.1%) | 0 (0.0%) |
| 35 to 64 Years | 10 (1.6%) | 0 (0.0%) |
| 65 to 74 Years | 0 (0.0%) | 0 (0.0%) |
| 75 Years and over | 0 (0.0%) | 15 (10.6%) |
Technology Access in Leo Cedarville
Computing Device Access in Leo Cedarville
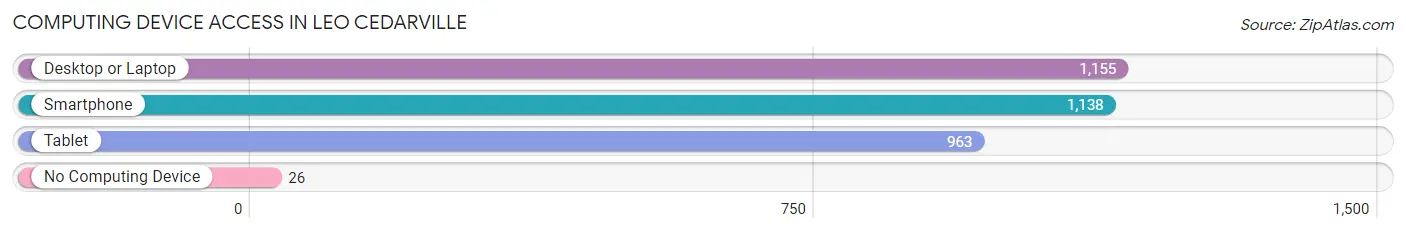
| Device Type | # Households | % Households |
| Desktop or Laptop | 1,155 | 95.1% |
| Smartphone | 1,138 | 93.7% |
| Tablet | 963 | 79.3% |
| No Computing Device | 26 | 2.1% |
| Total | 1,214 | 100.0% |
Internet Access in Leo Cedarville
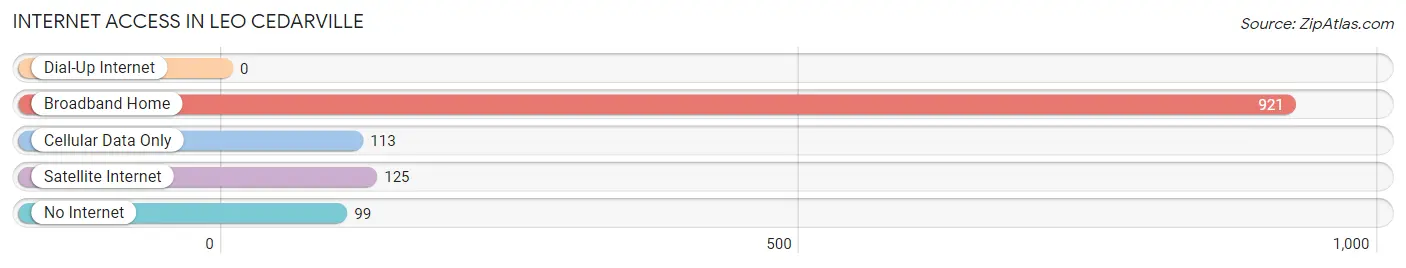
| Internet Type | # Households | % Households |
| Dial-Up Internet | 0 | 0.0% |
| Broadband Home | 921 | 75.9% |
| Cellular Data Only | 113 | 9.3% |
| Satellite Internet | 125 | 10.3% |
| No Internet | 99 | 8.2% |
| Total | 1,214 | 100.0% |
Leo Cedarville Summary
Leo Cedarville is a small town located in Allen County, Indiana. It is situated in the northeastern part of the state, about 10 miles south of Fort Wayne. The town has a population of approximately 1,500 people and is part of the Fort Wayne metropolitan area.
Geography
Leo Cedarville is located in the northeastern part of Allen County, Indiana. It is situated on the banks of the Cedar Creek, which flows through the town. The town is surrounded by farmland and is located about 10 miles south of Fort Wayne. The town is located at an elevation of 830 feet above sea level.
The climate in Leo Cedarville is classified as humid continental, with hot summers and cold winters. The average annual temperature is around 50 degrees Fahrenheit. The average annual precipitation is around 40 inches.
History
Leo Cedarville was founded in 1837 by a group of settlers from Ohio. The town was named after the Cedar Creek, which flows through the town. The town was originally a farming community, but it soon developed into a small industrial center.
In the late 19th century, Leo Cedarville was home to several factories, including a flour mill, a sawmill, and a brickyard. The town also had a railroad station, which connected it to the larger cities of Fort Wayne and Indianapolis.
In the early 20th century, Leo Cedarville experienced a period of growth and prosperity. The town was home to several businesses, including a bank, a hotel, and a movie theater. The town also had a public library and a high school.
Economy
Leo Cedarville is a small town with a limited economy. The town is home to several small businesses, including a grocery store, a hardware store, and a few restaurants. The town also has a few manufacturing companies, including a plastics factory and a metal fabrication plant.
The town is also home to a few farms, which produce corn, soybeans, and other crops. The town also has a few small businesses, such as a gas station and a car dealership.
Demographics
As of the 2010 census, the population of Leo Cedarville was 1,500 people. The racial makeup of the town was 97.3% White, 0.7% African American, 0.3% Native American, 0.3% Asian, and 1.3% from other races. The median household income was $45,000, and the median family income was $50,000.
Conclusion
Leo Cedarville is a small town located in Allen County, Indiana. It is situated on the banks of the Cedar Creek and is surrounded by farmland. The town has a population of approximately 1,500 people and is part of the Fort Wayne metropolitan area. The town has a limited economy, with a few small businesses and manufacturing companies. The racial makeup of the town is predominantly White, with a small percentage of African American, Native American, and Asian residents. The median household income is $45,000, and the median family income is $50,000.
Common Questions
What is the Total Population of Leo Cedarville?
Total Population of Leo Cedarville is 3,649.
What is the Total Male Population of Leo Cedarville?
Total Male Population of Leo Cedarville is 1,777.
What is the Total Female Population of Leo Cedarville?
Total Female Population of Leo Cedarville is 1,872.
What is the Ratio of Males per 100 Females in Leo Cedarville?
There are 94.93 Males per 100 Females in Leo Cedarville.
What is the Ratio of Females per 100 Males in Leo Cedarville?
There are 105.35 Females per 100 Males in Leo Cedarville.
What is the Median Population Age in Leo Cedarville?
Median Population Age in Leo Cedarville is 34.0 Years.
What is the Average Family Size in Leo Cedarville
Average Family Size in Leo Cedarville is 3.2 People.
What is the Average Household Size in Leo Cedarville
Average Household Size in Leo Cedarville is 3.0 People.
What is Per Capita Income in Leo Cedarville?
Per Capita income in Leo Cedarville is $44,205.
What is the Median Family Income in Leo Cedarville?
Median Family Income in Leo Cedarville is $125,305.
What is the Median Household income in Leo Cedarville?
Median Household Income in Leo Cedarville is $101,042.
What is Income or Wage Gap in Leo Cedarville?
Income or Wage Gap in Leo Cedarville is 30.3%.
Women in Leo Cedarville earn 69.7 cents for every dollar earned by a man.
What is Inequality or Gini Index in Leo Cedarville?
Inequality or Gini Index in Leo Cedarville is 0.38.
How Large is the Labor Force in Leo Cedarville?
There are 1,912 People in the Labor Forcein in Leo Cedarville.
What is the Percentage of People in the Labor Force in Leo Cedarville?
69.5% of People are in the Labor Force in Leo Cedarville.
What is the Unemployment Rate in Leo Cedarville?
Unemployment Rate in Leo Cedarville is 2.8%.