Cities with the Highest Percentage of Eastern European Population in Indiana
RELATED REPORTS & OPTIONS
Eastern European
Indiana
Compare Cities
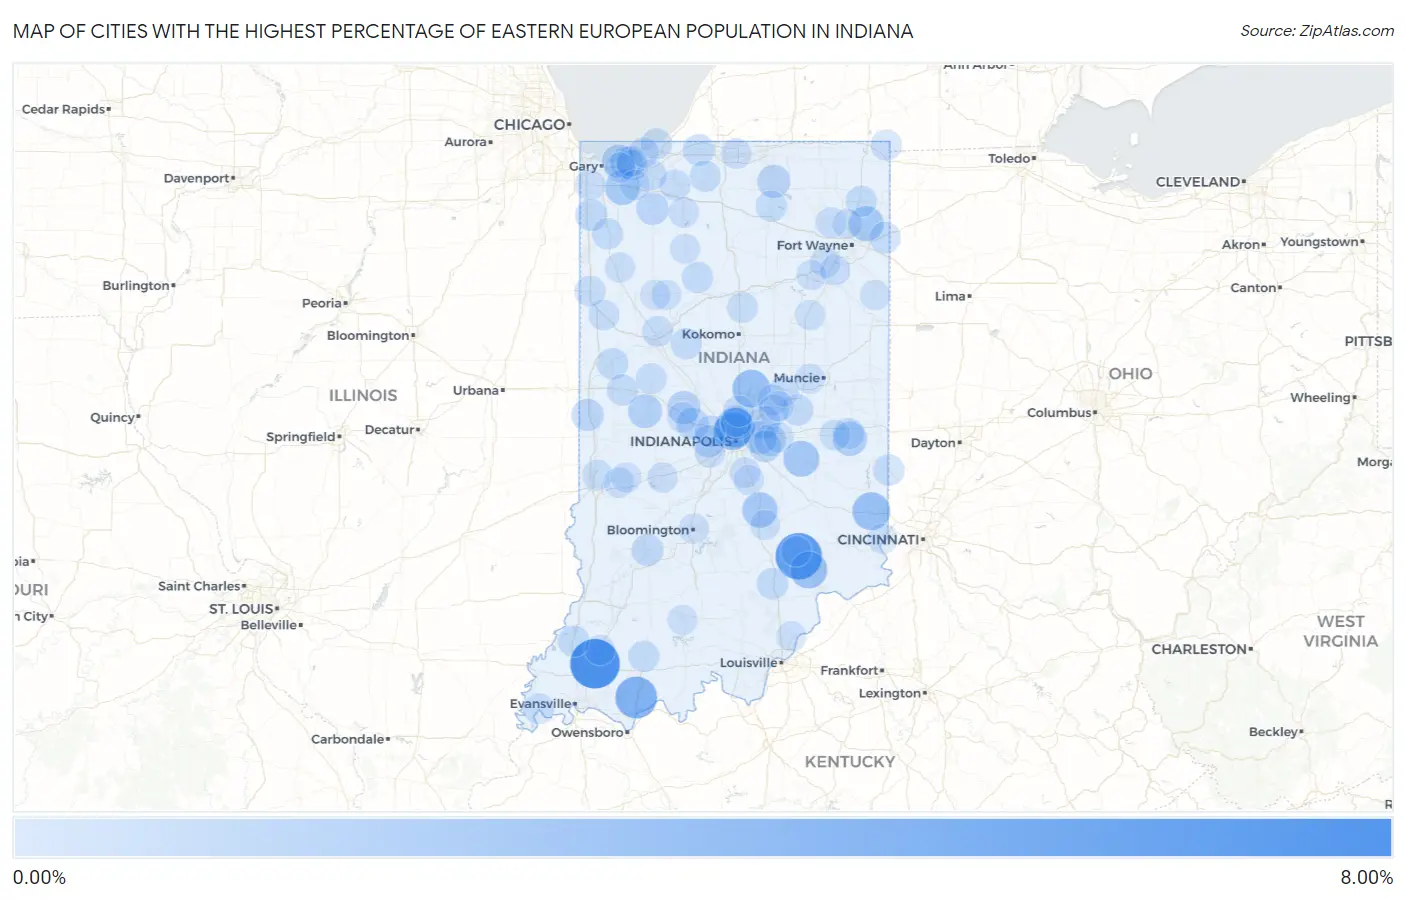
Map of Cities with the Highest Percentage of Eastern European Population in Indiana
0.00%
8.00%
Cities with the Highest Percentage of Eastern European Population in Indiana
| City | Eastern European | vs State | vs National | |
| 1. | Mackey | 6.73% | 0.17%(+6.56)#1 | 0.30%(+6.43)#86 |
| 2. | Vernon | 5.65% | 0.17%(+5.47)#2 | 0.30%(+5.34)#119 |
| 3. | Chrisney | 4.06% | 0.17%(+3.89)#3 | 0.30%(+3.76)#235 |
| 4. | Crows Nest | 3.23% | 0.17%(+3.05)#4 | 0.30%(+2.92)#335 |
| 5. | St Leon | 2.78% | 0.17%(+2.61)#5 | 0.30%(+2.48)#414 |
| 6. | Spring Hill | 2.78% | 0.17%(+2.60)#6 | 0.30%(+2.47)#415 |
| 7. | Cicero | 2.71% | 0.17%(+2.53)#7 | 0.30%(+2.40)#435 |
| 8. | Dupont | 2.52% | 0.17%(+2.35)#8 | 0.30%(+2.22)#483 |
| 9. | Arlington | 2.13% | 0.17%(+1.96)#9 | 0.30%(+1.83)#636 |
| 10. | Taylorsville | 1.95% | 0.17%(+1.78)#10 | 0.30%(+1.65)#734 |
| 11. | Leo Cedarville | 1.89% | 0.17%(+1.72)#11 | 0.30%(+1.59)#763 |
| 12. | Shorewood Forest | 1.87% | 0.17%(+1.69)#12 | 0.30%(+1.56)#777 |
| 13. | Milton | 1.55% | 0.17%(+1.37)#13 | 0.30%(+1.24)#969 |
| 14. | Lake Holiday | 1.47% | 0.17%(+1.30)#14 | 0.30%(+1.17)#1,044 |
| 15. | Ogden Dunes | 1.31% | 0.17%(+1.14)#15 | 0.30%(+1.01)#1,208 |
| 16. | Mccordsville | 1.22% | 0.17%(+1.05)#16 | 0.30%(+0.916)#1,327 |
| 17. | Advance | 1.21% | 0.17%(+1.04)#17 | 0.30%(+0.910)#1,343 |
| 18. | New Paris | 1.19% | 0.17%(+1.01)#18 | 0.30%(+0.884)#1,375 |
| 19. | Cumberland | 1.15% | 0.17%(+0.978)#19 | 0.30%(+0.848)#1,423 |
| 20. | La Crosse | 1.06% | 0.17%(+0.882)#20 | 0.30%(+0.753)#1,583 |
| 21. | Lizton | 1.03% | 0.17%(+0.855)#21 | 0.30%(+0.726)#1,629 |
| 22. | Burns Harbor | 0.95% | 0.17%(+0.781)#22 | 0.30%(+0.651)#1,784 |
| 23. | Cayuga | 0.95% | 0.17%(+0.776)#23 | 0.30%(+0.646)#1,794 |
| 24. | Spring Lake | 0.89% | 0.17%(+0.719)#24 | 0.30%(+0.589)#1,915 |
| 25. | New Palestine | 0.88% | 0.17%(+0.709)#25 | 0.30%(+0.579)#1,935 |
| 26. | Avon | 0.88% | 0.17%(+0.703)#26 | 0.30%(+0.573)#1,951 |
| 27. | Bloomfield | 0.86% | 0.17%(+0.682)#27 | 0.30%(+0.552)#2,007 |
| 28. | Meridian Hills | 0.80% | 0.17%(+0.628)#28 | 0.30%(+0.499)#2,172 |
| 29. | Lowell | 0.80% | 0.17%(+0.628)#29 | 0.30%(+0.498)#2,174 |
| 30. | Crothersville | 0.72% | 0.17%(+0.550)#30 | 0.30%(+0.420)#2,418 |
| 31. | Attica | 0.72% | 0.17%(+0.544)#31 | 0.30%(+0.414)#2,448 |
| 32. | New Carlisle | 0.69% | 0.17%(+0.520)#32 | 0.30%(+0.390)#2,513 |
| 33. | Brownsburg | 0.68% | 0.17%(+0.503)#33 | 0.30%(+0.374)#2,576 |
| 34. | Williams Creek | 0.67% | 0.17%(+0.493)#34 | 0.30%(+0.363)#2,605 |
| 35. | Patoka | 0.66% | 0.17%(+0.485)#35 | 0.30%(+0.355)#2,640 |
| 36. | Markleville | 0.65% | 0.17%(+0.481)#36 | 0.30%(+0.351)#2,654 |
| 37. | Woodburn | 0.65% | 0.17%(+0.478)#37 | 0.30%(+0.348)#2,663 |
| 38. | Carmel | 0.65% | 0.17%(+0.472)#38 | 0.30%(+0.342)#2,680 |
| 39. | North Liberty | 0.64% | 0.17%(+0.463)#39 | 0.30%(+0.334)#2,715 |
| 40. | Leesburg | 0.64% | 0.17%(+0.463)#40 | 0.30%(+0.333)#2,719 |
| 41. | Rossville | 0.63% | 0.17%(+0.455)#41 | 0.30%(+0.325)#2,755 |
| 42. | West College Corner | 0.63% | 0.17%(+0.452)#42 | 0.30%(+0.323)#2,767 |
| 43. | Chesterton | 0.62% | 0.17%(+0.446)#43 | 0.30%(+0.316)#2,798 |
| 44. | Royal Center | 0.61% | 0.17%(+0.439)#44 | 0.30%(+0.309)#2,824 |
| 45. | Hillsboro | 0.61% | 0.17%(+0.439)#45 | 0.30%(+0.309)#2,826 |
| 46. | Cambridge City | 0.61% | 0.17%(+0.436)#46 | 0.30%(+0.306)#2,840 |
| 47. | Huntingburg | 0.60% | 0.17%(+0.428)#47 | 0.30%(+0.298)#2,872 |
| 48. | Auburn | 0.59% | 0.17%(+0.419)#48 | 0.30%(+0.290)#2,906 |
| 49. | Long Beach | 0.59% | 0.17%(+0.417)#49 | 0.30%(+0.287)#2,915 |
| 50. | Roselawn | 0.57% | 0.17%(+0.391)#50 | 0.30%(+0.262)#3,019 |
| 51. | Linden | 0.53% | 0.17%(+0.359)#51 | 0.30%(+0.229)#3,181 |
| 52. | Battle Ground | 0.53% | 0.17%(+0.357)#52 | 0.30%(+0.227)#3,191 |
| 53. | Lapel | 0.52% | 0.17%(+0.343)#53 | 0.30%(+0.213)#3,258 |
| 54. | Clear Lake | 0.51% | 0.17%(+0.331)#54 | 0.30%(+0.201)#3,314 |
| 55. | Kingsford Heights | 0.50% | 0.17%(+0.329)#55 | 0.30%(+0.200)#3,324 |
| 56. | Mount Vernon | 0.48% | 0.17%(+0.304)#56 | 0.30%(+0.175)#3,471 |
| 57. | Westville | 0.48% | 0.17%(+0.302)#57 | 0.30%(+0.172)#3,487 |
| 58. | Bunker Hill | 0.47% | 0.17%(+0.298)#58 | 0.30%(+0.168)#3,513 |
| 59. | Straughn | 0.47% | 0.17%(+0.293)#59 | 0.30%(+0.164)#3,536 |
| 60. | Ingalls | 0.46% | 0.17%(+0.284)#60 | 0.30%(+0.154)#3,589 |
| 61. | Fowler | 0.45% | 0.17%(+0.279)#61 | 0.30%(+0.149)#3,613 |
| 62. | Kentland | 0.44% | 0.17%(+0.268)#62 | 0.30%(+0.138)#3,665 |
| 63. | Churubusco | 0.44% | 0.17%(+0.263)#63 | 0.30%(+0.134)#3,688 |
| 64. | Edgewood | 0.41% | 0.17%(+0.232)#64 | 0.30%(+0.103)#3,897 |
| 65. | North Terre Haute | 0.40% | 0.17%(+0.231)#65 | 0.30%(+0.101)#3,911 |
| 66. | Knox | 0.39% | 0.17%(+0.216)#66 | 0.30%(+0.086)#4,023 |
| 67. | Porter | 0.38% | 0.17%(+0.210)#67 | 0.30%(+0.081)#4,071 |
| 68. | Staunton | 0.38% | 0.17%(+0.208)#68 | 0.30%(+0.078)#4,099 |
| 69. | Roanoke | 0.38% | 0.17%(+0.204)#69 | 0.30%(+0.074)#4,125 |
| 70. | Zanesville | 0.38% | 0.17%(+0.203)#70 | 0.30%(+0.074)#4,128 |
| 71. | Jamestown | 0.38% | 0.17%(+0.203)#71 | 0.30%(+0.073)#4,134 |
| 72. | North Vernon | 0.37% | 0.17%(+0.201)#72 | 0.30%(+0.071)#4,149 |
| 73. | Whiteland | 0.37% | 0.17%(+0.200)#73 | 0.30%(+0.070)#4,158 |
| 74. | Mishawaka | 0.37% | 0.17%(+0.199)#74 | 0.30%(+0.070)#4,171 |
| 75. | Cloverdale | 0.36% | 0.17%(+0.190)#75 | 0.30%(+0.060)#4,234 |
| 76. | Schererville | 0.36% | 0.17%(+0.185)#76 | 0.30%(+0.055)#4,283 |
| 77. | Beverly Shores | 0.35% | 0.17%(+0.172)#77 | 0.30%(+0.042)#4,390 |
| 78. | Plainfield | 0.33% | 0.17%(+0.157)#78 | 0.30%(+0.027)#4,551 |
| 79. | Oakland City | 0.33% | 0.17%(+0.157)#79 | 0.30%(+0.027)#4,556 |
| 80. | Reynolds | 0.33% | 0.17%(+0.152)#80 | 0.30%(+0.022)#4,600 |
| 81. | Valparaiso | 0.32% | 0.17%(+0.150)#81 | 0.30%(+0.020)#4,615 |
| 82. | Van Buren | 0.32% | 0.17%(+0.147)#82 | 0.30%(+0.017)#4,635 |
| 83. | Rensselaer | 0.32% | 0.17%(+0.145)#83 | 0.30%(+0.015)#4,657 |
| 84. | Greenfield | 0.32% | 0.17%(+0.143)#84 | 0.30%(+0.013)#4,672 |
| 85. | Bloomington | 0.32% | 0.17%(+0.141)#85 | 0.30%(+0.011)#4,693 |
| 86. | Monroe | 0.31% | 0.17%(+0.139)#86 | 0.30%(+0.009)#4,716 |
| 87. | Lawrenceburg | 0.31% | 0.17%(+0.137)#87 | 0.30%(+0.008)#4,725 |
| 88. | Floyds Knobs | 0.31% | 0.17%(+0.132)#88 | 0.30%(+0.002)#4,772 |
| 89. | Franklin | 0.30% | 0.17%(+0.129)#89 | 0.30%(-0.001)#4,813 |
| 90. | Charlestown | 0.30% | 0.17%(+0.127)#90 | 0.30%(-0.003)#4,836 |
| 91. | Portage | 0.29% | 0.17%(+0.120)#91 | 0.30%(-0.010)#4,901 |
| 92. | Huntington | 0.29% | 0.17%(+0.120)#92 | 0.30%(-0.010)#4,908 |
| 93. | Monticello | 0.29% | 0.17%(+0.118)#93 | 0.30%(-0.012)#4,933 |
| 94. | Yorktown | 0.29% | 0.17%(+0.112)#94 | 0.30%(-0.018)#4,997 |
| 95. | French Lick | 0.29% | 0.17%(+0.111)#95 | 0.30%(-0.018)#4,999 |
| 96. | Pendleton | 0.28% | 0.17%(+0.110)#96 | 0.30%(-0.020)#5,021 |
| 97. | Brazil | 0.28% | 0.17%(+0.110)#97 | 0.30%(-0.020)#5,023 |
| 98. | Columbus | 0.28% | 0.17%(+0.109)#98 | 0.30%(-0.021)#5,036 |
| 99. | Winamac | 0.28% | 0.17%(+0.101)#99 | 0.30%(-0.028)#5,143 |
| 100. | Huntertown | 0.28% | 0.17%(+0.101)#100 | 0.30%(-0.029)#5,146 |
Common Questions
What are the Top 10 Cities with the Highest Percentage of Eastern European Population in Indiana?
Top 10 Cities with the Highest Percentage of Eastern European Population in Indiana are:
#1
6.73%
#2
5.65%
#3
4.06%
#4
3.23%
#5
2.78%
#6
2.78%
#7
2.71%
#8
2.52%
#9
2.13%
#10
1.95%
What city has the Highest Percentage of Eastern European Population in Indiana?
Mackey has the Highest Percentage of Eastern European Population in Indiana with 6.73%.
What is the Percentage of Eastern European Population in the State of Indiana?
Percentage of Eastern European Population in Indiana is 0.17%.
What is the Percentage of Eastern European Population in the United States?
Percentage of Eastern European Population in the United States is 0.30%.