Williams Creek, IN
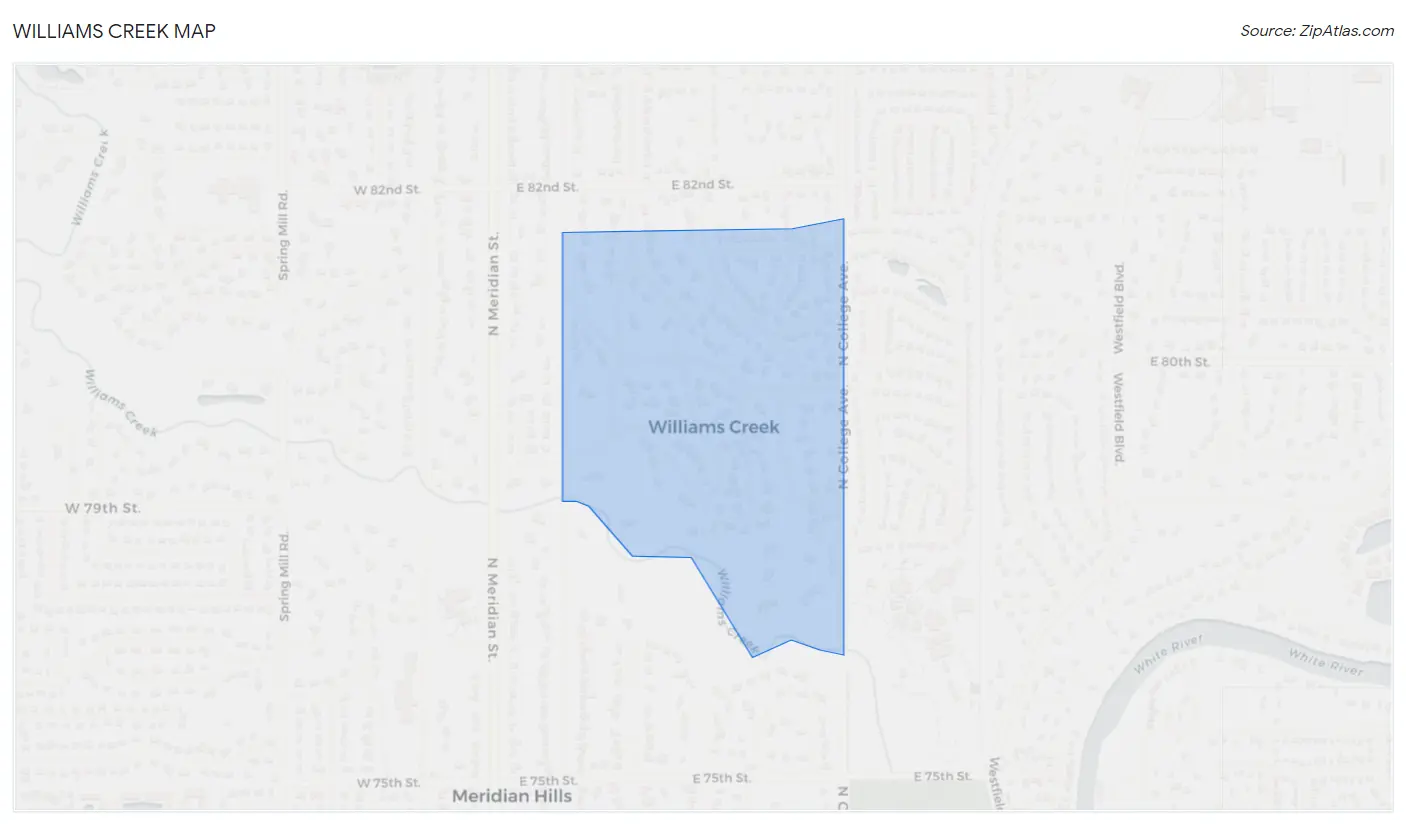
Williams Creek Map
Williams Creek Overview
450
TOTAL POPULATION
209
MALE POPULATION
241
FEMALE POPULATION
86.72
MALES / 100 FEMALES
115.31
FEMALES / 100 MALES
50.3
MEDIAN AGE
3.0
AVG FAMILY SIZE
2.8
AVG HOUSEHOLD SIZE
$116,744
PER CAPITA INCOME
$240,000
AVG FAMILY INCOME
$148,750
AVG HOUSEHOLD INCOME
52.9%
WAGE / INCOME GAP [ % ]
47.1¢/ $1
WAGE / INCOME GAP [ $ ]
0.57
INEQUALITY / GINI INDEX
206
LABOR FORCE [ PEOPLE ]
57.1%
PERCENT IN LABOR FORCE
2.4%
UNEMPLOYMENT RATE
Williams Creek Area Codes
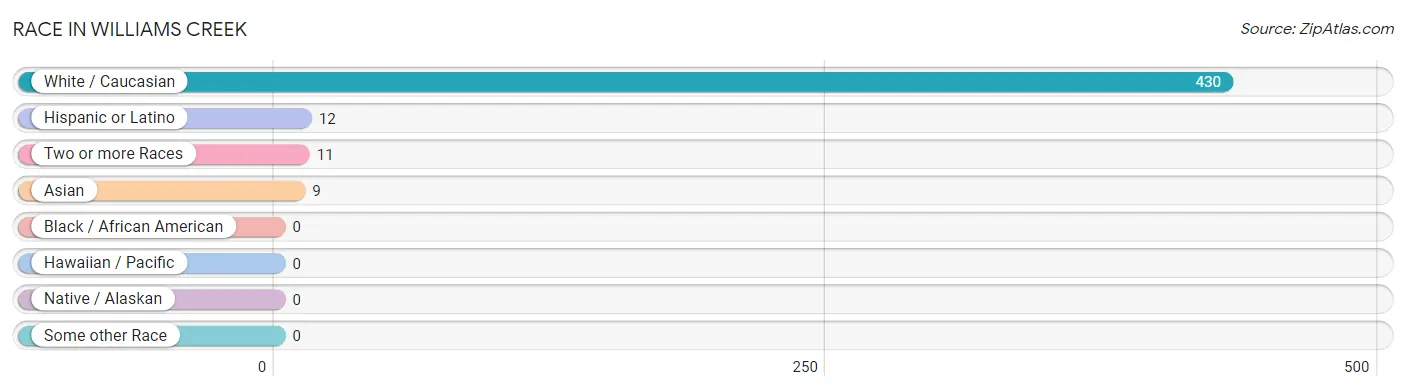
Race in Williams Creek
The most populous races in Williams Creek are White / Caucasian (430 | 95.6%), Hispanic or Latino (12 | 2.7%), and Two or more Races (11 | 2.4%).
| Race | # Population | % Population |
| Asian | 9 | 2.0% |
| Black / African American | 0 | 0.0% |
| Hawaiian / Pacific | 0 | 0.0% |
| Hispanic or Latino | 12 | 2.7% |
| Native / Alaskan | 0 | 0.0% |
| White / Caucasian | 430 | 95.6% |
| Two or more Races | 11 | 2.4% |
| Some other Race | 0 | 0.0% |
| Total | 450 | 100.0% |
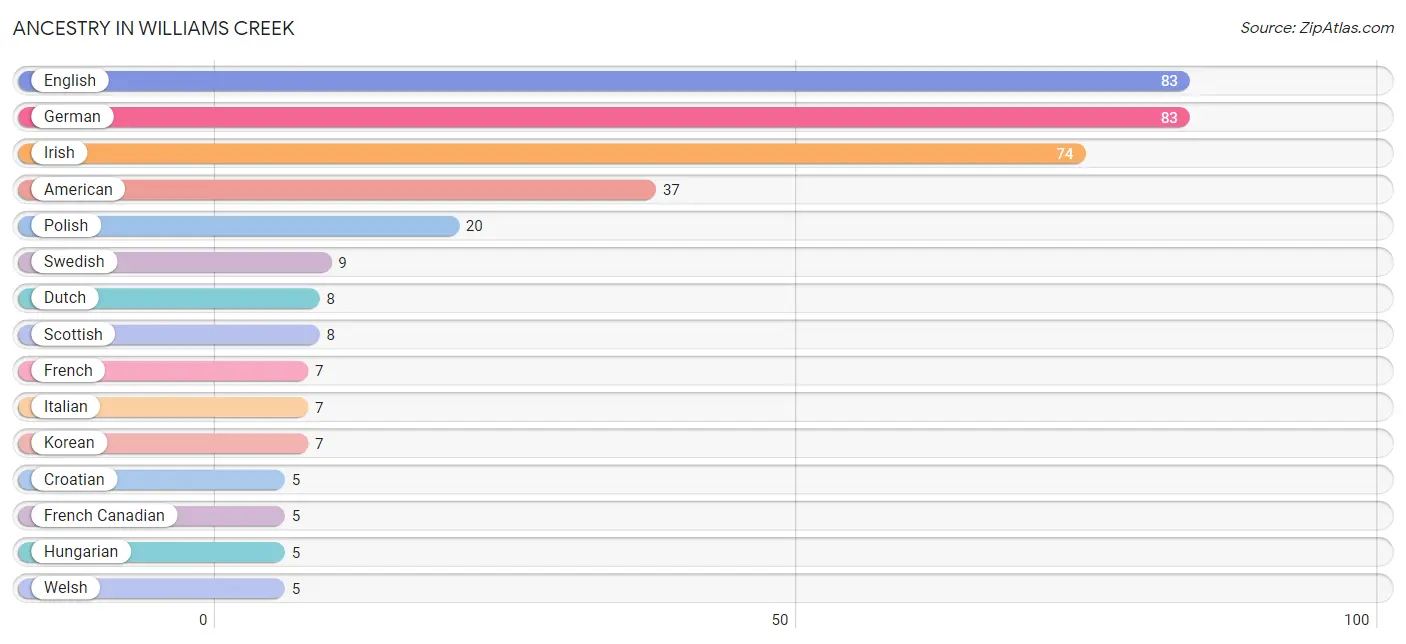
Ancestry in Williams Creek
The most populous ancestries reported in Williams Creek are English (83 | 18.4%), German (83 | 18.4%), Irish (74 | 16.4%), American (37 | 8.2%), and Polish (20 | 4.4%), together accounting for 66.0% of all Williams Creek residents.
| Ancestry | # Population | % Population |
| American | 37 | 8.2% |
| Arab | 1 | 0.2% |
| Austrian | 1 | 0.2% |
| British | 3 | 0.7% |
| Canadian | 4 | 0.9% |
| Croatian | 5 | 1.1% |
| Danish | 3 | 0.7% |
| Dutch | 8 | 1.8% |
| Eastern European | 3 | 0.7% |
| English | 83 | 18.4% |
| European | 4 | 0.9% |
| French | 7 | 1.6% |
| French Canadian | 5 | 1.1% |
| German | 83 | 18.4% |
| Greek | 2 | 0.4% |
| Hungarian | 5 | 1.1% |
| Indian (Asian) | 1 | 0.2% |
| Irish | 74 | 16.4% |
| Italian | 7 | 1.6% |
| Korean | 7 | 1.6% |
| Lebanese | 1 | 0.2% |
| Luxembourger | 2 | 0.4% |
| Mexican | 3 | 0.7% |
| Northern European | 4 | 0.9% |
| Norwegian | 4 | 0.9% |
| Polish | 20 | 4.4% |
| Romanian | 2 | 0.4% |
| Russian | 4 | 0.9% |
| Scotch-Irish | 2 | 0.4% |
| Scottish | 8 | 1.8% |
| Spanish | 2 | 0.4% |
| Swedish | 9 | 2.0% |
| Swiss | 4 | 0.9% |
| Welsh | 5 | 1.1% | View All 34 Rows |
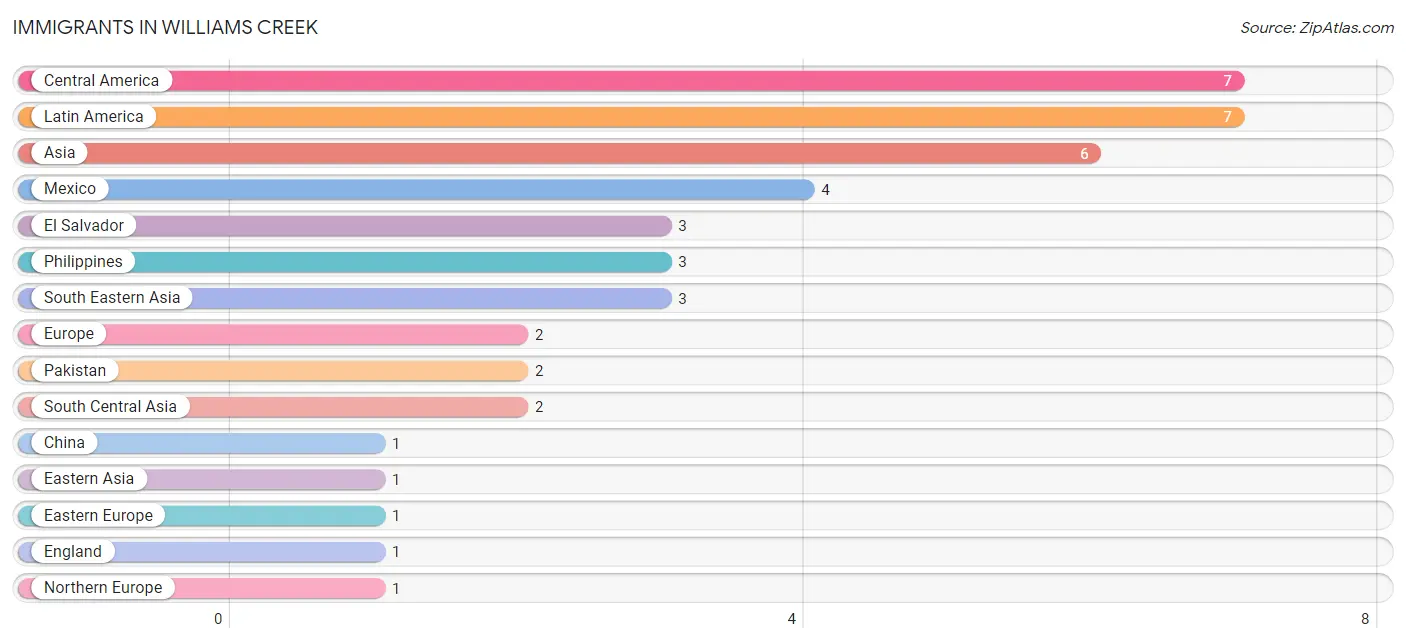
Immigrants in Williams Creek
The most numerous immigrant groups reported in Williams Creek came from Central America (7 | 1.6%), Latin America (7 | 1.6%), Asia (6 | 1.3%), Mexico (4 | 0.9%), and El Salvador (3 | 0.7%), together accounting for 6.0% of all Williams Creek residents.
| Immigration Origin | # Population | % Population |
| Asia | 6 | 1.3% |
| Central America | 7 | 1.6% |
| China | 1 | 0.2% |
| Eastern Asia | 1 | 0.2% |
| Eastern Europe | 1 | 0.2% |
| El Salvador | 3 | 0.7% |
| England | 1 | 0.2% |
| Europe | 2 | 0.4% |
| Latin America | 7 | 1.6% |
| Mexico | 4 | 0.9% |
| Northern Europe | 1 | 0.2% |
| Pakistan | 2 | 0.4% |
| Philippines | 3 | 0.7% |
| Romania | 1 | 0.2% |
| South Central Asia | 2 | 0.4% |
| South Eastern Asia | 3 | 0.7% |
| Taiwan | 1 | 0.2% | View All 17 Rows |
Sex and Age in Williams Creek
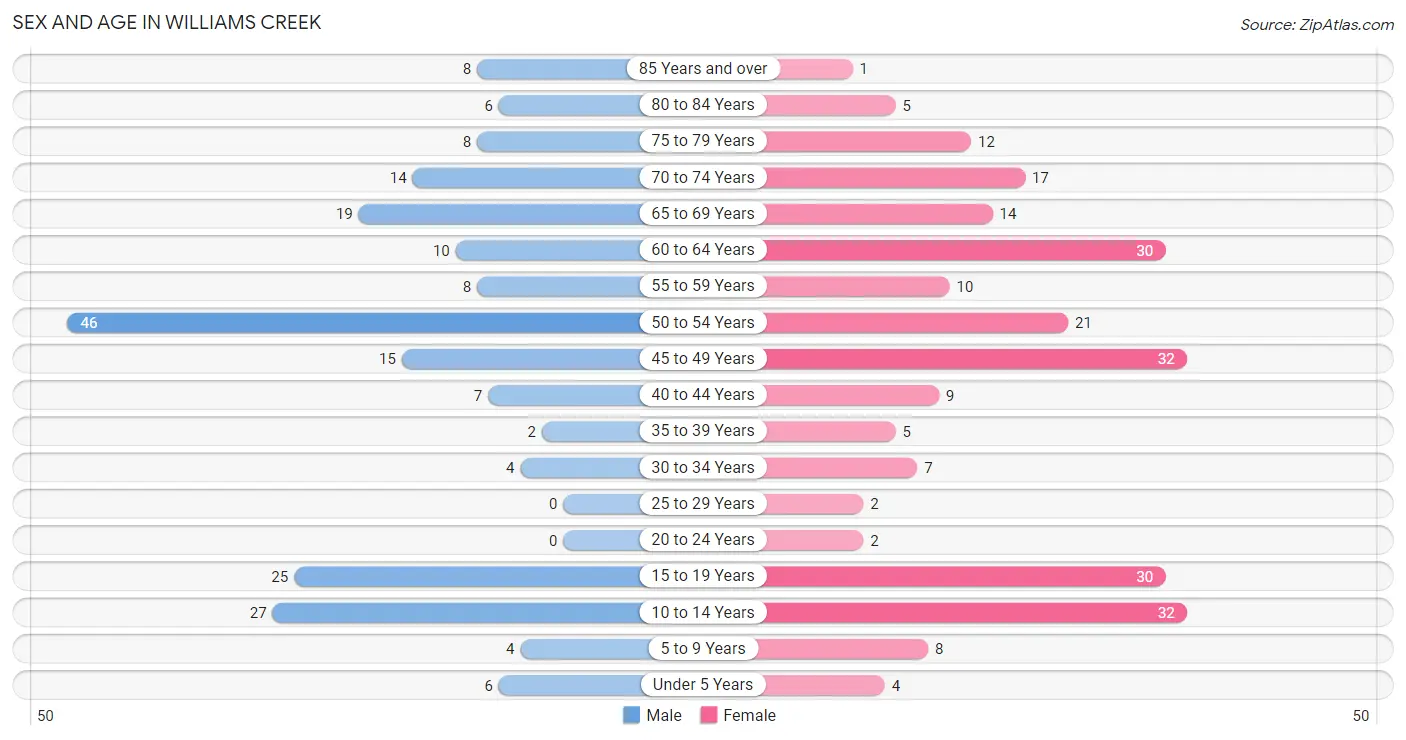
Sex and Age in Williams Creek
The most populous age groups in Williams Creek are 50 to 54 Years (46 | 22.0%) for men and 10 to 14 Years (32 | 13.3%) for women.
| Age Bracket | Male | Female |
| Under 5 Years | 6 (2.9%) | 4 (1.7%) |
| 5 to 9 Years | 4 (1.9%) | 8 (3.3%) |
| 10 to 14 Years | 27 (12.9%) | 32 (13.3%) |
| 15 to 19 Years | 25 (12.0%) | 30 (12.4%) |
| 20 to 24 Years | 0 (0.0%) | 2 (0.8%) |
| 25 to 29 Years | 0 (0.0%) | 2 (0.8%) |
| 30 to 34 Years | 4 (1.9%) | 7 (2.9%) |
| 35 to 39 Years | 2 (1.0%) | 5 (2.1%) |
| 40 to 44 Years | 7 (3.4%) | 9 (3.7%) |
| 45 to 49 Years | 15 (7.2%) | 32 (13.3%) |
| 50 to 54 Years | 46 (22.0%) | 21 (8.7%) |
| 55 to 59 Years | 8 (3.8%) | 10 (4.2%) |
| 60 to 64 Years | 10 (4.8%) | 30 (12.4%) |
| 65 to 69 Years | 19 (9.1%) | 14 (5.8%) |
| 70 to 74 Years | 14 (6.7%) | 17 (7.0%) |
| 75 to 79 Years | 8 (3.8%) | 12 (5.0%) |
| 80 to 84 Years | 6 (2.9%) | 5 (2.1%) |
| 85 Years and over | 8 (3.8%) | 1 (0.4%) |
| Total | 209 (100.0%) | 241 (100.0%) |
Families and Households in Williams Creek
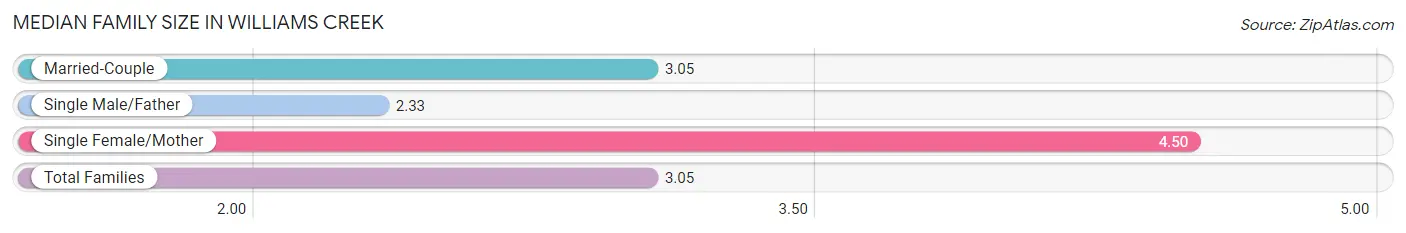
Median Family Size in Williams Creek
The median family size in Williams Creek is 3.05 persons per family, with single female/mother families (2 | 1.5%) accounting for the largest median family size of 4.5 persons per family. On the other hand, single male/father families (3 | 2.2%) represent the smallest median family size with 2.33 persons per family.
| Family Type | # Families | Family Size |
| Married-Couple | 131 (96.3%) | 3.05 |
| Single Male/Father | 3 (2.2%) | 2.33 |
| Single Female/Mother | 2 (1.5%) | 4.50 |
| Total Families | 136 (100.0%) | 3.05 |
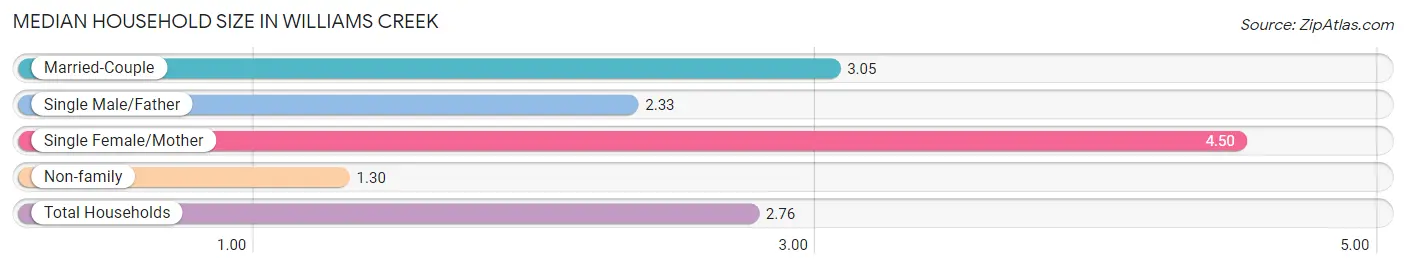
Median Household Size in Williams Creek
The median household size in Williams Creek is 2.76 persons per household, with single female/mother households (2 | 1.2%) accounting for the largest median household size of 4.5 persons per household. non-family households (27 | 16.6%) represent the smallest median household size with 1.30 persons per household.
| Household Type | # Households | Household Size |
| Married-Couple | 131 (80.4%) | 3.05 |
| Single Male/Father | 3 (1.8%) | 2.33 |
| Single Female/Mother | 2 (1.2%) | 4.50 |
| Non-family | 27 (16.6%) | 1.30 |
| Total Households | 163 (100.0%) | 2.76 |
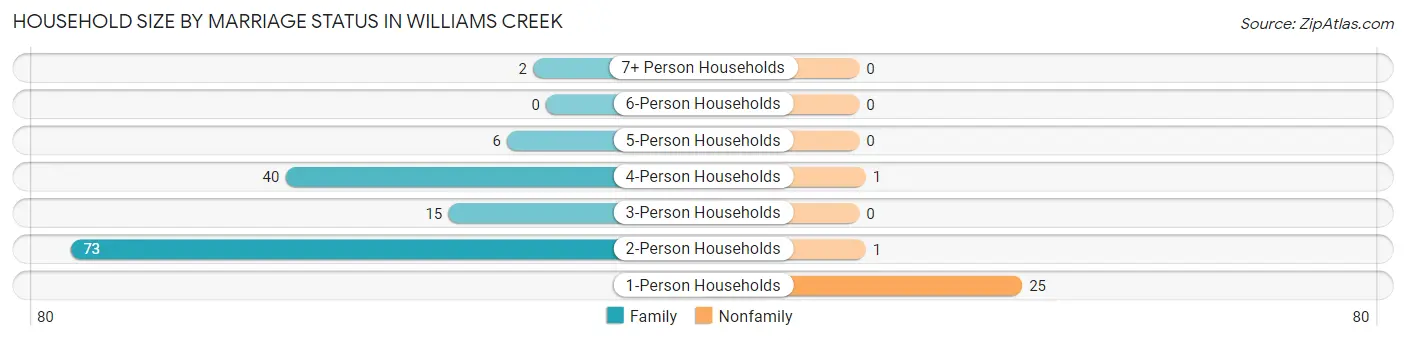
Household Size by Marriage Status in Williams Creek
Out of a total of 163 households in Williams Creek, 136 (83.4%) are family households, while 27 (16.6%) are nonfamily households. The most numerous type of family households are 2-person households, comprising 73, and the most common type of nonfamily households are 1-person households, comprising 25.
| Household Size | Family Households | Nonfamily Households |
| 1-Person Households | - | 25 (15.3%) |
| 2-Person Households | 73 (44.8%) | 1 (0.6%) |
| 3-Person Households | 15 (9.2%) | 0 (0.0%) |
| 4-Person Households | 40 (24.5%) | 1 (0.6%) |
| 5-Person Households | 6 (3.7%) | 0 (0.0%) |
| 6-Person Households | 0 (0.0%) | 0 (0.0%) |
| 7+ Person Households | 2 (1.2%) | 0 (0.0%) |
| Total | 136 (83.4%) | 27 (16.6%) |
Female Fertility in Williams Creek
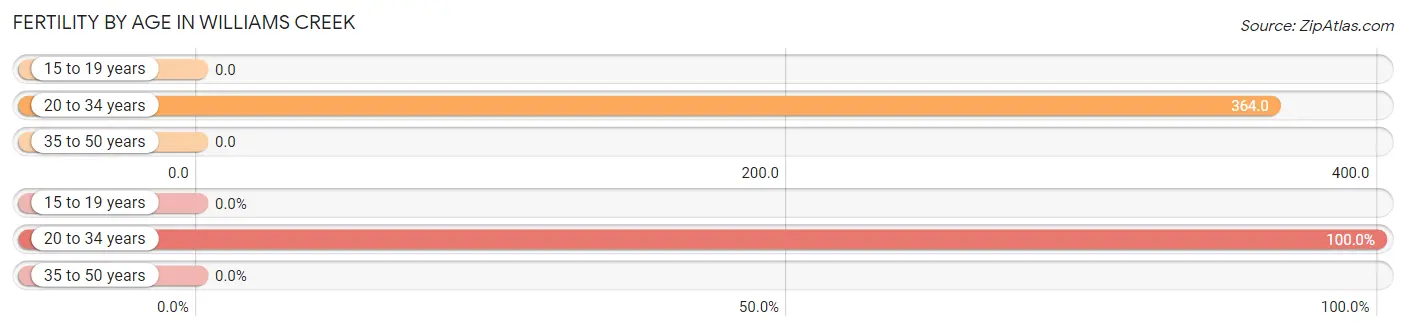
Fertility by Age in Williams Creek
Average fertility rate in Williams Creek is 43.0 births per 1,000 women. Women in the age bracket of 20 to 34 years have the highest fertility rate with 364.0 births per 1,000 women. Women in the age bracket of 20 to 34 years acount for 100.0% of all women with births.
| Age Bracket | Women with Births | Births / 1,000 Women |
| 15 to 19 years | 0 (0.0%) | 0.0 |
| 20 to 34 years | 4 (100.0%) | 364.0 |
| 35 to 50 years | 0 (0.0%) | 0.0 |
| Total | 4 (100.0%) | 43.0 |
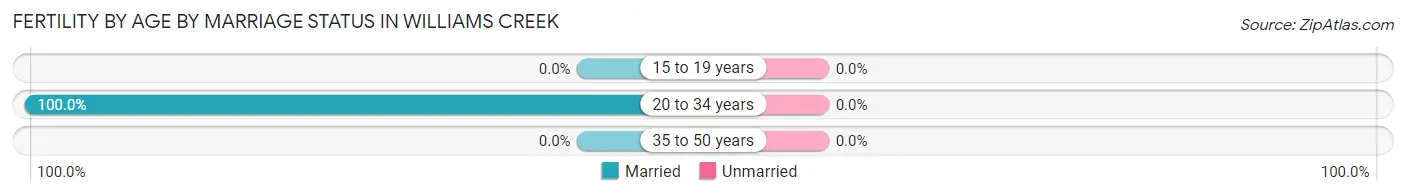
Fertility by Age by Marriage Status in Williams Creek
| Age Bracket | Married | Unmarried |
| 15 to 19 years | 0 (0.0%) | 0 (0.0%) |
| 20 to 34 years | 4 (100.0%) | 0 (0.0%) |
| 35 to 50 years | 0 (0.0%) | 0 (0.0%) |
| Total | 4 (100.0%) | 0 (0.0%) |
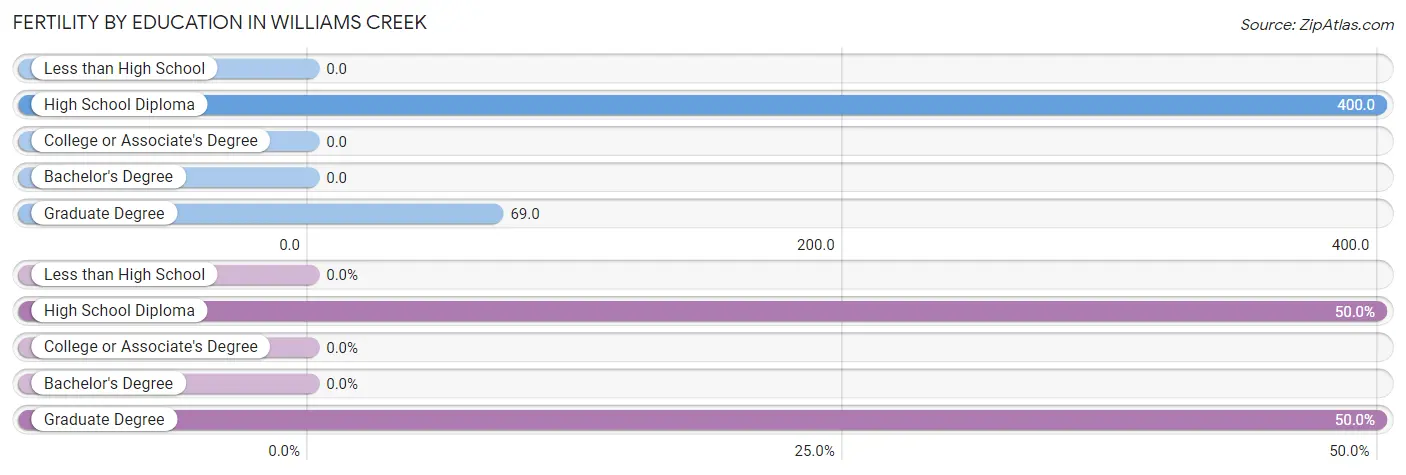
Fertility by Education in Williams Creek
| Educational Attainment | Women with Births | Births / 1,000 Women |
| Less than High School | 0 (0.0%) | 0.0 |
| High School Diploma | 2 (50.0%) | 400.0 |
| College or Associate's Degree | 0 (0.0%) | 0.0 |
| Bachelor's Degree | 0 (0.0%) | 0.0 |
| Graduate Degree | 2 (50.0%) | 69.0 |
| Total | 4 (100.0%) | 43.0 |
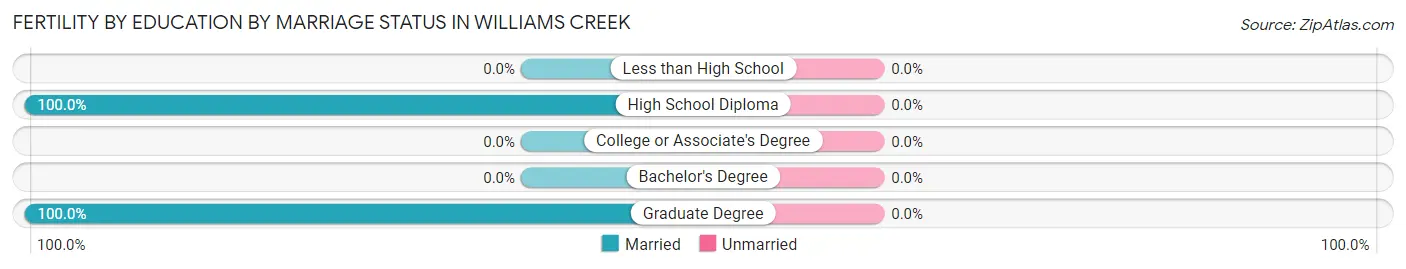
Fertility by Education by Marriage Status in Williams Creek
| Educational Attainment | Married | Unmarried |
| Less than High School | 0 (0.0%) | 0 (0.0%) |
| High School Diploma | 2 (100.0%) | 0 (0.0%) |
| College or Associate's Degree | 0 (0.0%) | 0 (0.0%) |
| Bachelor's Degree | 0 (0.0%) | 0 (0.0%) |
| Graduate Degree | 2 (100.0%) | 0 (0.0%) |
| Total | 4 (100.0%) | 0 (0.0%) |
Income in Williams Creek
Income Overview in Williams Creek
Per Capita Income in Williams Creek is $116,744, while median incomes of families and households are $240,000 and $148,750 respectively.
| Characteristic | Number | Measure |
| Per Capita Income | 450 | $116,744 |
| Median Family Income | 136 | $240,000 |
| Mean Family Income | 136 | $373,093 |
| Median Household Income | 163 | $148,750 |
| Mean Household Income | 163 | $321,223 |
| Income Deficit | 136 | $0 |
| Wage / Income Gap (%) | 450 | 52.89% |
| Wage / Income Gap ($) | 450 | 47.11¢ per $1 |
| Gini / Inequality Index | 450 | 0.57 |
Earnings by Sex in Williams Creek
Average Earnings in Williams Creek are $61,250, $86,667 for men and $40,833 for women, a difference of 52.9%.
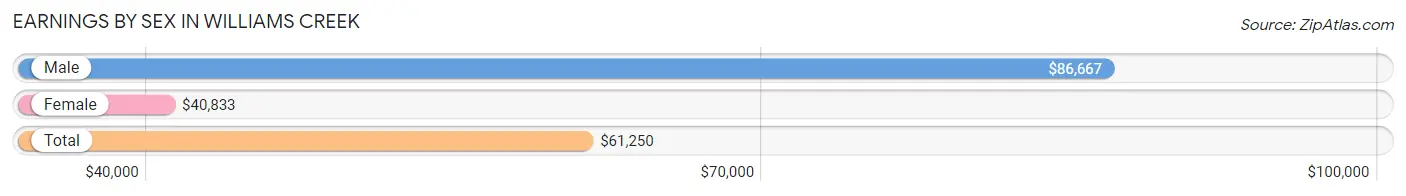
| Sex | Number | Average Earnings |
| Male | 132 (60.6%) | $86,667 |
| Female | 86 (39.5%) | $40,833 |
| Total | 218 (100.0%) | $61,250 |
Earnings by Sex by Income Bracket in Williams Creek
The most common earnings brackets in Williams Creek are $100,000+ for men (61 | 46.2%) and $100,000+ for women (22 | 25.6%).
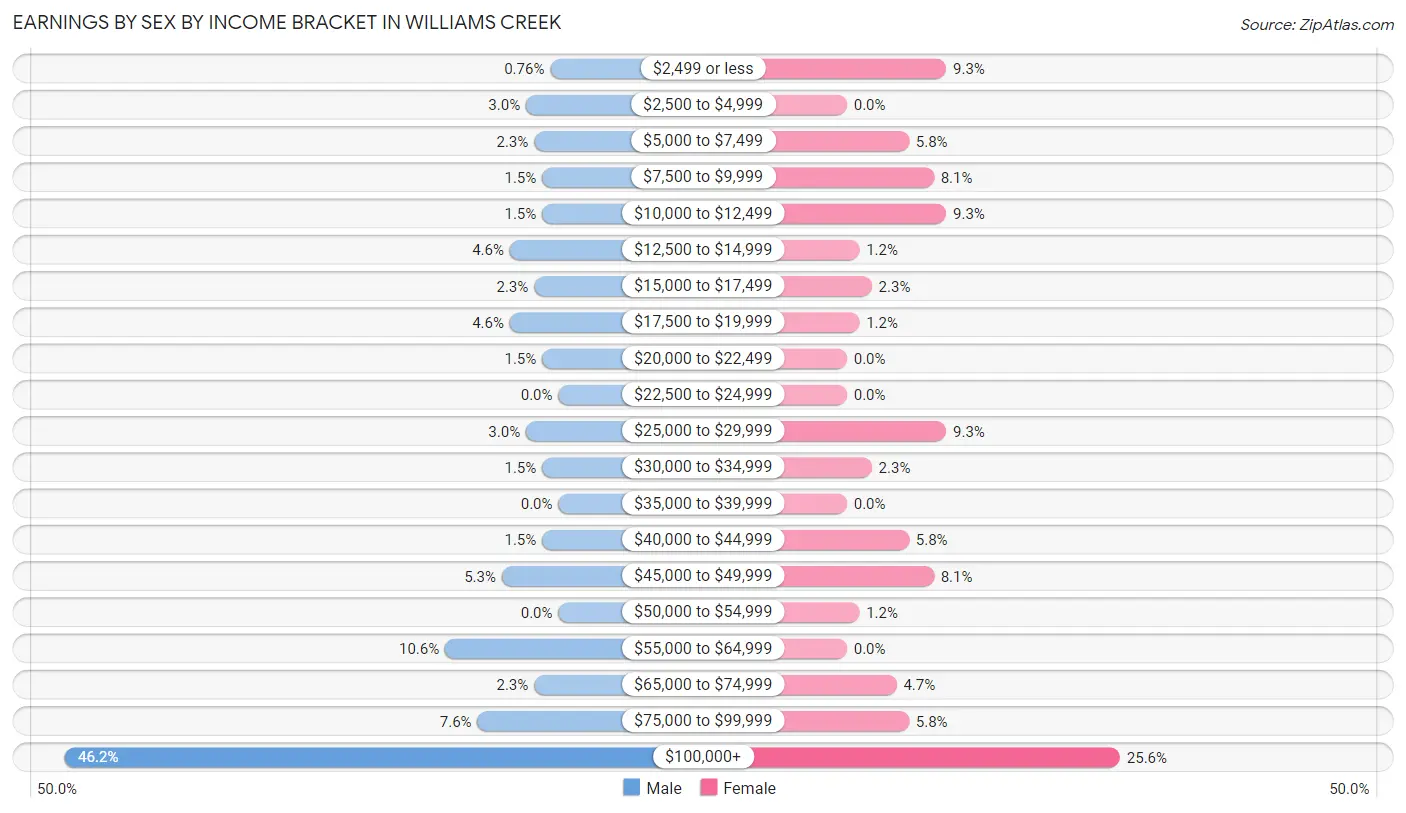
| Income | Male | Female |
| $2,499 or less | 1 (0.8%) | 8 (9.3%) |
| $2,500 to $4,999 | 4 (3.0%) | 0 (0.0%) |
| $5,000 to $7,499 | 3 (2.3%) | 5 (5.8%) |
| $7,500 to $9,999 | 2 (1.5%) | 7 (8.1%) |
| $10,000 to $12,499 | 2 (1.5%) | 8 (9.3%) |
| $12,500 to $14,999 | 6 (4.5%) | 1 (1.2%) |
| $15,000 to $17,499 | 3 (2.3%) | 2 (2.3%) |
| $17,500 to $19,999 | 6 (4.5%) | 1 (1.2%) |
| $20,000 to $22,499 | 2 (1.5%) | 0 (0.0%) |
| $22,500 to $24,999 | 0 (0.0%) | 0 (0.0%) |
| $25,000 to $29,999 | 4 (3.0%) | 8 (9.3%) |
| $30,000 to $34,999 | 2 (1.5%) | 2 (2.3%) |
| $35,000 to $39,999 | 0 (0.0%) | 0 (0.0%) |
| $40,000 to $44,999 | 2 (1.5%) | 5 (5.8%) |
| $45,000 to $49,999 | 7 (5.3%) | 7 (8.1%) |
| $50,000 to $54,999 | 0 (0.0%) | 1 (1.2%) |
| $55,000 to $64,999 | 14 (10.6%) | 0 (0.0%) |
| $65,000 to $74,999 | 3 (2.3%) | 4 (4.6%) |
| $75,000 to $99,999 | 10 (7.6%) | 5 (5.8%) |
| $100,000+ | 61 (46.2%) | 22 (25.6%) |
| Total | 132 (100.0%) | 86 (100.0%) |
Earnings by Sex by Educational Attainment in Williams Creek
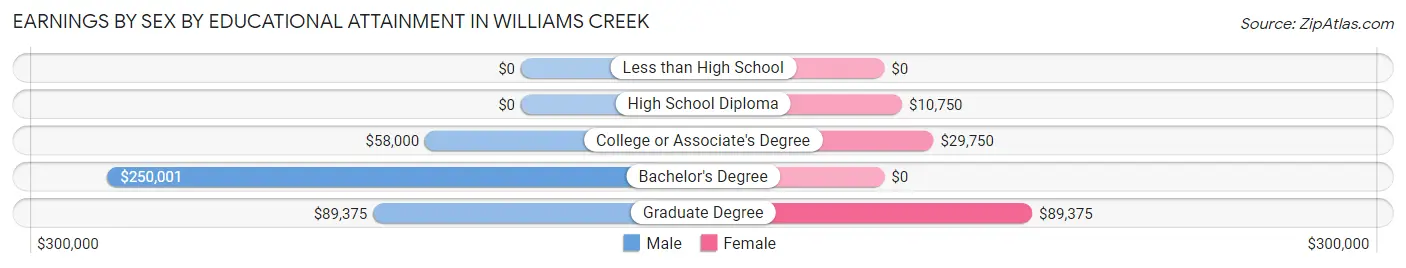
| Educational Attainment | Male Income | Female Income |
| Less than High School | - | - |
| High School Diploma | - | - |
| College or Associate's Degree | $58,000 | $29,750 |
| Bachelor's Degree | $250,001 | $0 |
| Graduate Degree | $89,375 | $89,375 |
| Total | - | - |
Family Income in Williams Creek
Family Income Brackets in Williams Creek
According to the Williams Creek family income data, there are 72 families falling into the $200,000+ income range, which is the most common income bracket and makes up 52.9% of all families.
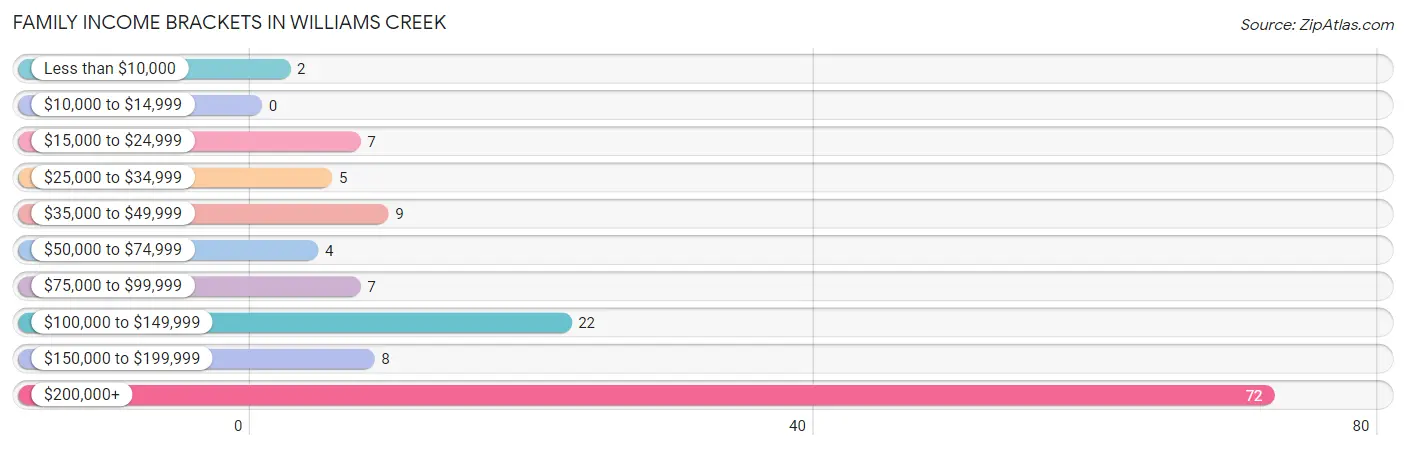
| Income Bracket | # Families | % Families |
| Less than $10,000 | 2 | 1.5% |
| $10,000 to $14,999 | 0 | 0.0% |
| $15,000 to $24,999 | 7 | 5.1% |
| $25,000 to $34,999 | 5 | 3.7% |
| $35,000 to $49,999 | 9 | 6.6% |
| $50,000 to $74,999 | 4 | 2.9% |
| $75,000 to $99,999 | 7 | 5.1% |
| $100,000 to $149,999 | 22 | 16.2% |
| $150,000 to $199,999 | 8 | 5.9% |
| $200,000+ | 72 | 52.9% |
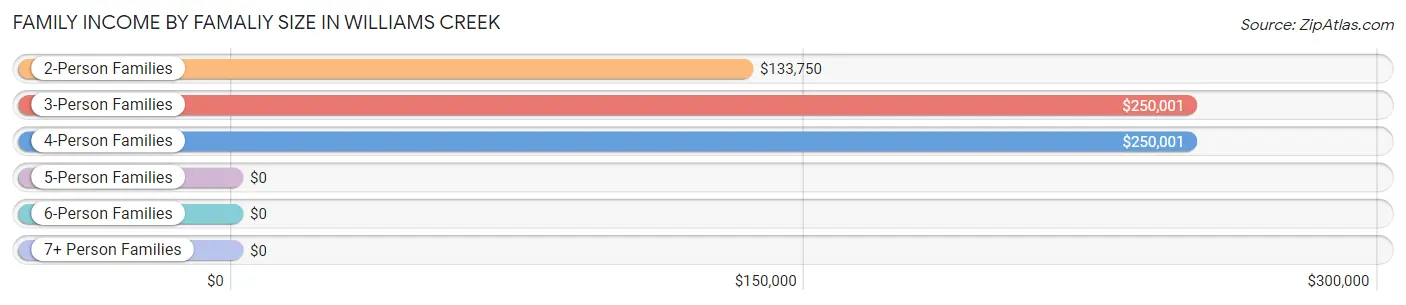
Family Income by Famaliy Size in Williams Creek
3-person families (15 | 11.0%) account for the highest median family income in Williams Creek with $250,001 per family, while 3-person families (15 | 11.0%) have the highest median income of $83,334 per family member.
| Income Bracket | # Families | Median Income |
| 2-Person Families | 73 (53.7%) | $133,750 |
| 3-Person Families | 15 (11.0%) | $250,001 |
| 4-Person Families | 40 (29.4%) | $250,001 |
| 5-Person Families | 6 (4.4%) | $0 |
| 6-Person Families | 0 (0.0%) | $0 |
| 7+ Person Families | 2 (1.5%) | $0 |
| Total | 136 (100.0%) | $240,000 |
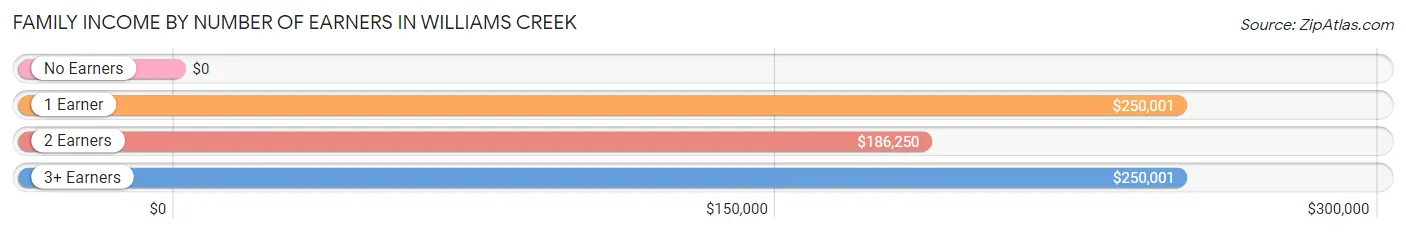
Family Income by Number of Earners in Williams Creek
| Number of Earners | # Families | Median Income |
| No Earners | 19 (14.0%) | $0 |
| 1 Earner | 54 (39.7%) | $250,001 |
| 2 Earners | 52 (38.2%) | $186,250 |
| 3+ Earners | 11 (8.1%) | $250,001 |
| Total | 136 (100.0%) | $240,000 |
Household Income in Williams Creek
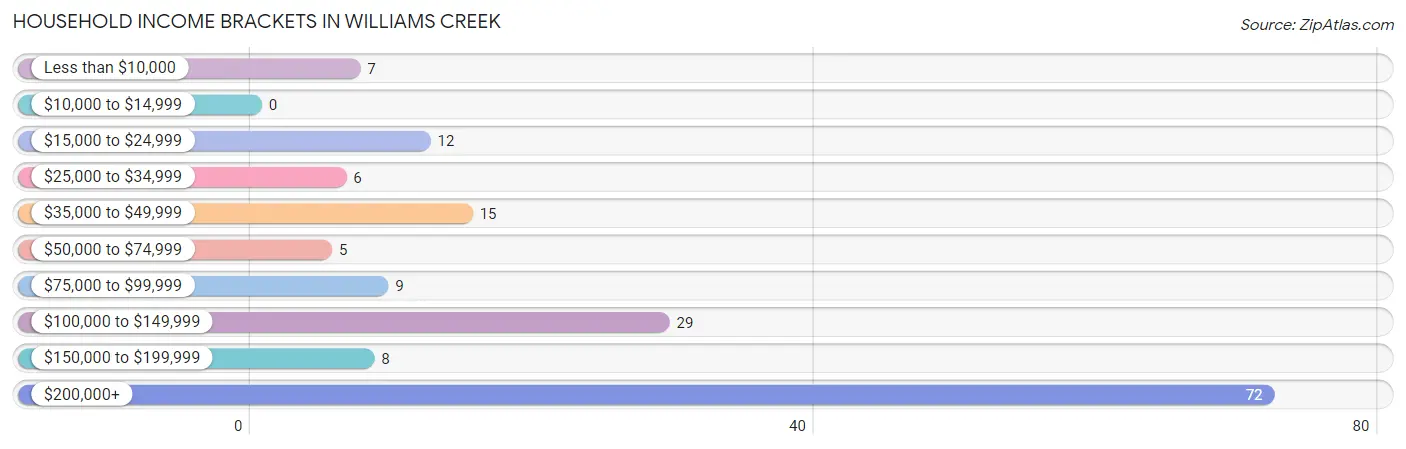
Household Income Brackets in Williams Creek
With 72 households falling in the category, the $200,000+ income range is the most frequent in Williams Creek, accounting for 44.2% of all households.
| Income Bracket | # Households | % Households |
| Less than $10,000 | 7 | 4.3% |
| $10,000 to $14,999 | 0 | 0.0% |
| $15,000 to $24,999 | 12 | 7.4% |
| $25,000 to $34,999 | 6 | 3.7% |
| $35,000 to $49,999 | 15 | 9.2% |
| $50,000 to $74,999 | 5 | 3.1% |
| $75,000 to $99,999 | 9 | 5.5% |
| $100,000 to $149,999 | 29 | 17.8% |
| $150,000 to $199,999 | 8 | 4.9% |
| $200,000+ | 72 | 44.2% |
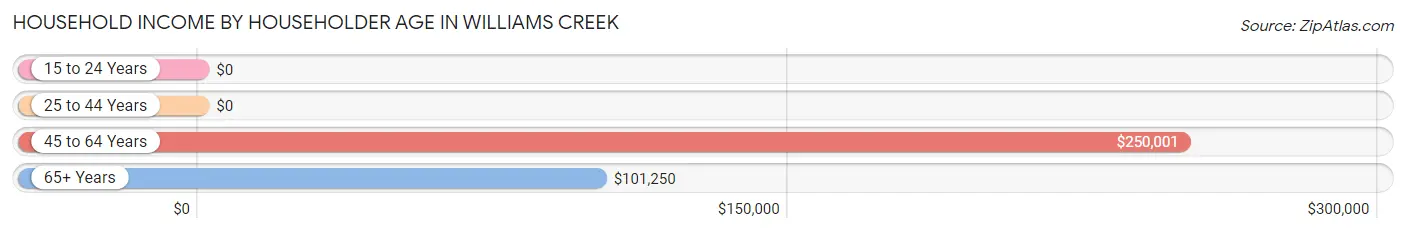
Household Income by Householder Age in Williams Creek
The median household income in Williams Creek is $148,750, with the highest median household income of $250,001 found in the 45 to 64 years age bracket for the primary householder. A total of 85 households (52.1%) fall into this category.
| Income Bracket | # Households | Median Income |
| 15 to 24 Years | 0 (0.0%) | $0 |
| 25 to 44 Years | 15 (9.2%) | $0 |
| 45 to 64 Years | 85 (52.1%) | $250,001 |
| 65+ Years | 63 (38.7%) | $101,250 |
| Total | 163 (100.0%) | $148,750 |
Poverty in Williams Creek
Income Below Poverty by Sex and Age in Williams Creek
With 7.7% poverty level for males and 4.2% for females among the residents of Williams Creek, 16 and 17 year old males and 65 to 74 year old females are the most vulnerable to poverty, with 4 males (28.6%) and 5 females (16.1%) in their respective age groups living below the poverty level.
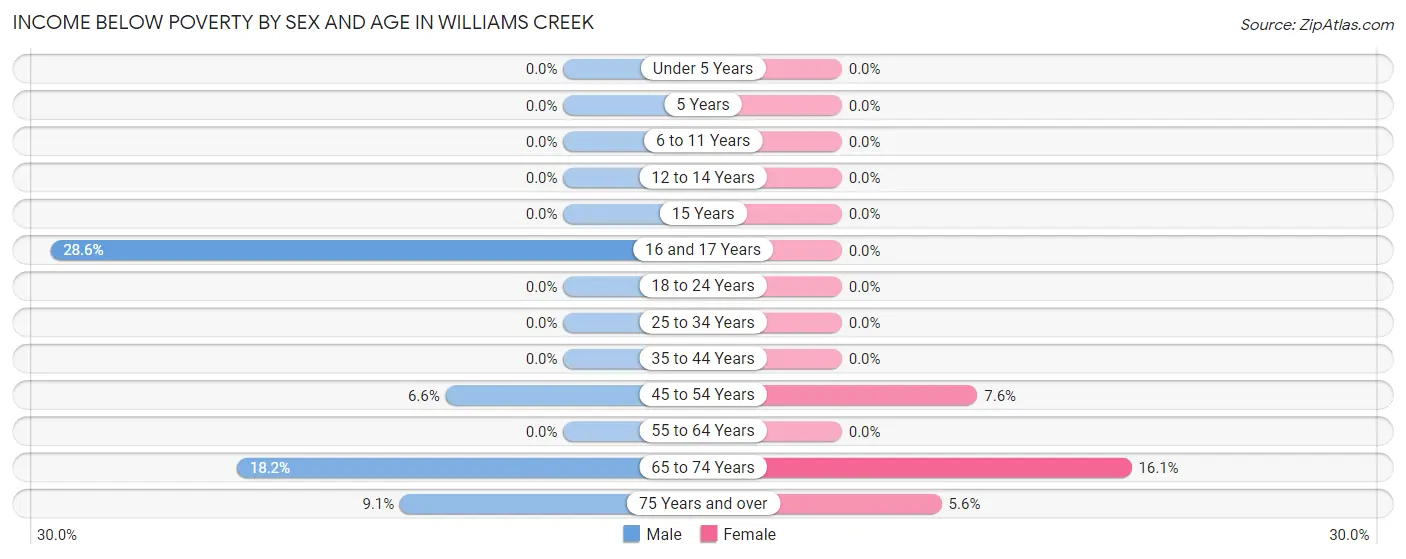
| Age Bracket | Male | Female |
| Under 5 Years | 0 (0.0%) | 0 (0.0%) |
| 5 Years | 0 (0.0%) | 0 (0.0%) |
| 6 to 11 Years | 0 (0.0%) | 0 (0.0%) |
| 12 to 14 Years | 0 (0.0%) | 0 (0.0%) |
| 15 Years | 0 (0.0%) | 0 (0.0%) |
| 16 and 17 Years | 4 (28.6%) | 0 (0.0%) |
| 18 to 24 Years | 0 (0.0%) | 0 (0.0%) |
| 25 to 34 Years | 0 (0.0%) | 0 (0.0%) |
| 35 to 44 Years | 0 (0.0%) | 0 (0.0%) |
| 45 to 54 Years | 4 (6.6%) | 4 (7.5%) |
| 55 to 64 Years | 0 (0.0%) | 0 (0.0%) |
| 65 to 74 Years | 6 (18.2%) | 5 (16.1%) |
| 75 Years and over | 2 (9.1%) | 1 (5.6%) |
| Total | 16 (7.7%) | 10 (4.2%) |
Income Above Poverty by Sex and Age in Williams Creek
According to the poverty statistics in Williams Creek, males aged under 5 years and females aged under 5 years are the age groups that are most secure financially, with 100.0% of males and 100.0% of females in these age groups living above the poverty line.
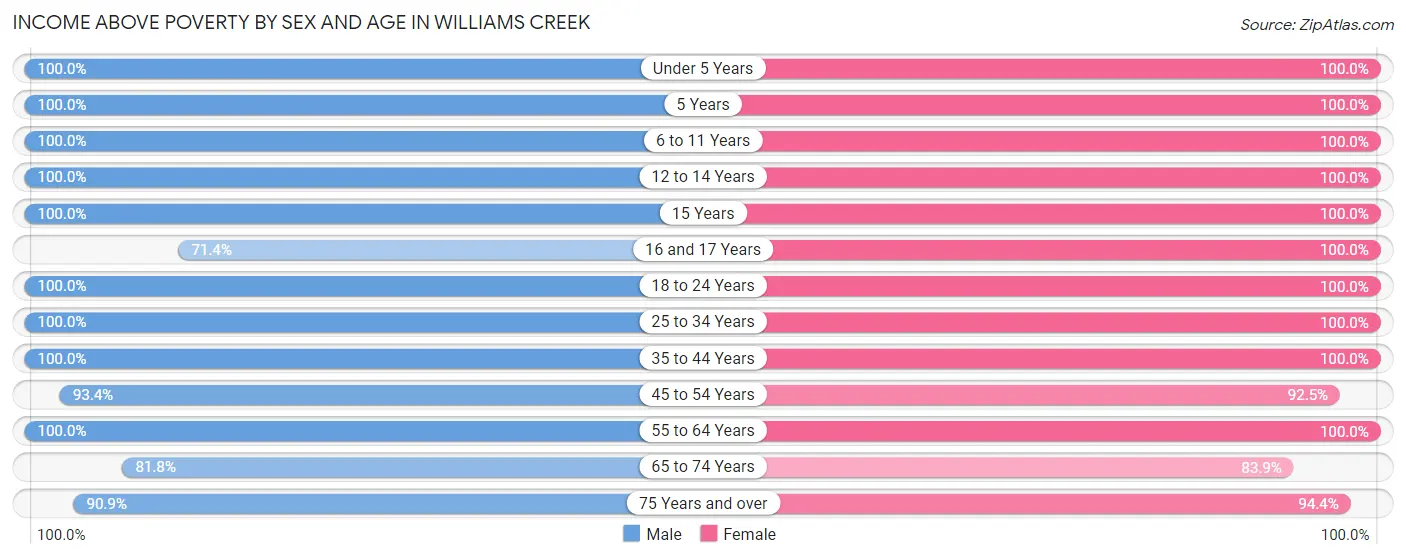
| Age Bracket | Male | Female |
| Under 5 Years | 6 (100.0%) | 4 (100.0%) |
| 5 Years | 2 (100.0%) | 2 (100.0%) |
| 6 to 11 Years | 14 (100.0%) | 17 (100.0%) |
| 12 to 14 Years | 15 (100.0%) | 21 (100.0%) |
| 15 Years | 7 (100.0%) | 1 (100.0%) |
| 16 and 17 Years | 10 (71.4%) | 23 (100.0%) |
| 18 to 24 Years | 4 (100.0%) | 8 (100.0%) |
| 25 to 34 Years | 4 (100.0%) | 9 (100.0%) |
| 35 to 44 Years | 9 (100.0%) | 14 (100.0%) |
| 45 to 54 Years | 57 (93.4%) | 49 (92.4%) |
| 55 to 64 Years | 18 (100.0%) | 40 (100.0%) |
| 65 to 74 Years | 27 (81.8%) | 26 (83.9%) |
| 75 Years and over | 20 (90.9%) | 17 (94.4%) |
| Total | 193 (92.3%) | 231 (95.9%) |
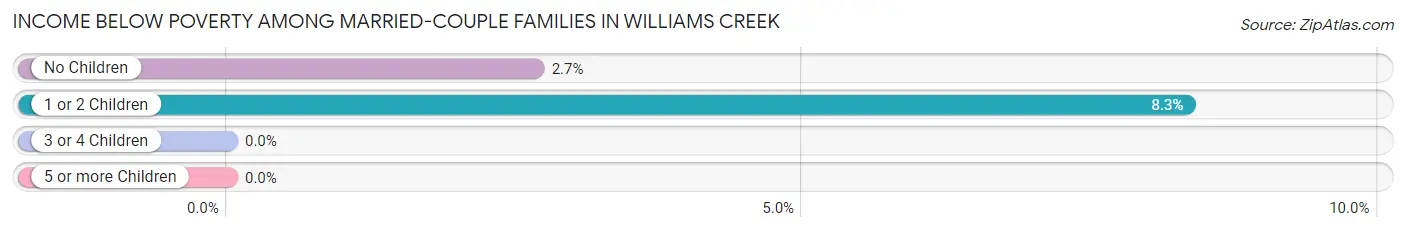
Income Below Poverty Among Married-Couple Families in Williams Creek
The poverty statistics for married-couple families in Williams Creek show that 4.6% or 6 of the total 131 families live below the poverty line. Families with 1 or 2 children have the highest poverty rate of 8.3%, comprising of 4 families. On the other hand, families with 3 or 4 children have the lowest poverty rate of 0.0%, which includes 0 families.
| Children | Above Poverty | Below Poverty |
| No Children | 73 (97.3%) | 2 (2.7%) |
| 1 or 2 Children | 44 (91.7%) | 4 (8.3%) |
| 3 or 4 Children | 8 (100.0%) | 0 (0.0%) |
| 5 or more Children | 0 (0.0%) | 0 (0.0%) |
| Total | 125 (95.4%) | 6 (4.6%) |
Income Below Poverty Among Single-Parent Households in Williams Creek
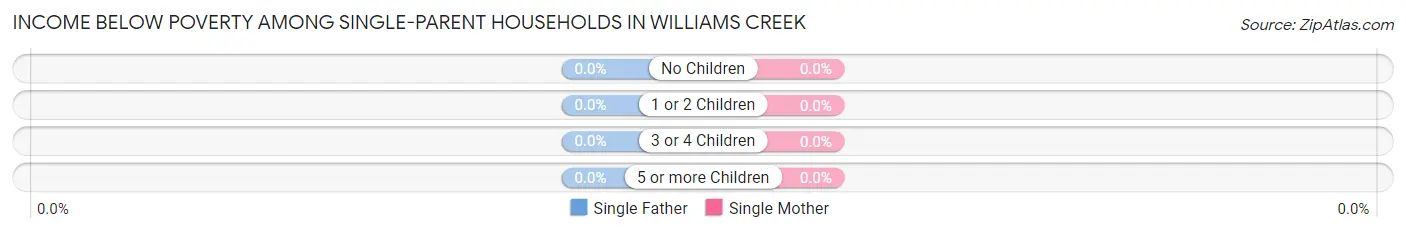
| Children | Single Father | Single Mother |
| No Children | 0 (0.0%) | 0 (0.0%) |
| 1 or 2 Children | 0 (0.0%) | 0 (0.0%) |
| 3 or 4 Children | 0 (0.0%) | 0 (0.0%) |
| 5 or more Children | 0 (0.0%) | 0 (0.0%) |
| Total | 0 (0.0%) | 0 (0.0%) |
Income Below Poverty Among Married-Couple vs Single-Parent Households in Williams Creek
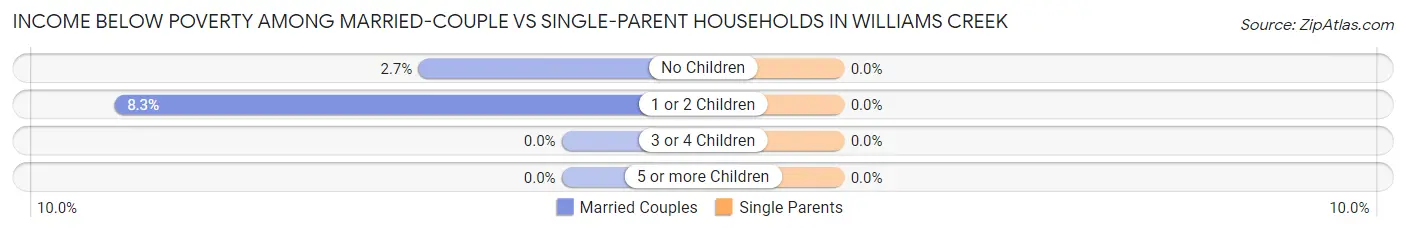
| Children | Married-Couple Families | Single-Parent Households |
| No Children | 2 (2.7%) | 0 (0.0%) |
| 1 or 2 Children | 4 (8.3%) | 0 (0.0%) |
| 3 or 4 Children | 0 (0.0%) | 0 (0.0%) |
| 5 or more Children | 0 (0.0%) | 0 (0.0%) |
| Total | 6 (4.6%) | 0 (0.0%) |
Employment Characteristics in Williams Creek
Employment by Class of Employer in Williams Creek
Among the 199 employed individuals in Williams Creek, private company employees (93 | 46.7%), self-employed (incorporated) (49 | 24.6%), and self-employed (not incorporated) (27 | 13.6%) make up the most common classes of employment.
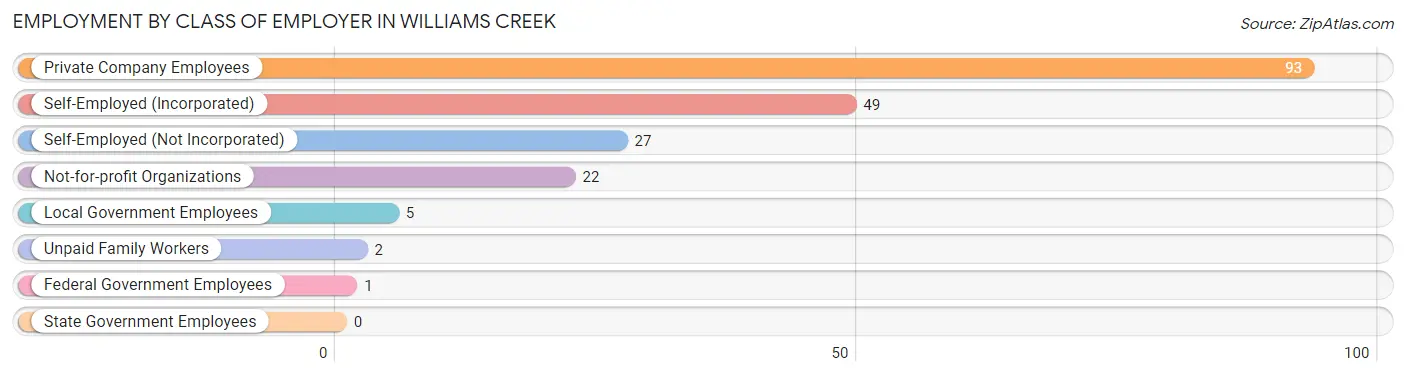
| Employer Class | # Employees | % Employees |
| Private Company Employees | 93 | 46.7% |
| Self-Employed (Incorporated) | 49 | 24.6% |
| Self-Employed (Not Incorporated) | 27 | 13.6% |
| Not-for-profit Organizations | 22 | 11.1% |
| Local Government Employees | 5 | 2.5% |
| State Government Employees | 0 | 0.0% |
| Federal Government Employees | 1 | 0.5% |
| Unpaid Family Workers | 2 | 1.0% |
| Total | 199 | 100.0% |
Employment Status by Age in Williams Creek
According to the labor force statistics for Williams Creek, out of the total population over 16 years of age (361), 57.1% or 206 individuals are in the labor force, with 2.4% or 5 of them unemployed. The age group with the highest labor force participation rate is 20 to 24 years, with 100.0% or 2 individuals in the labor force. Within the labor force, the 16 to 19 years age range has the highest percentage of unemployed individuals, with 33.3% or 2 of them being unemployed.
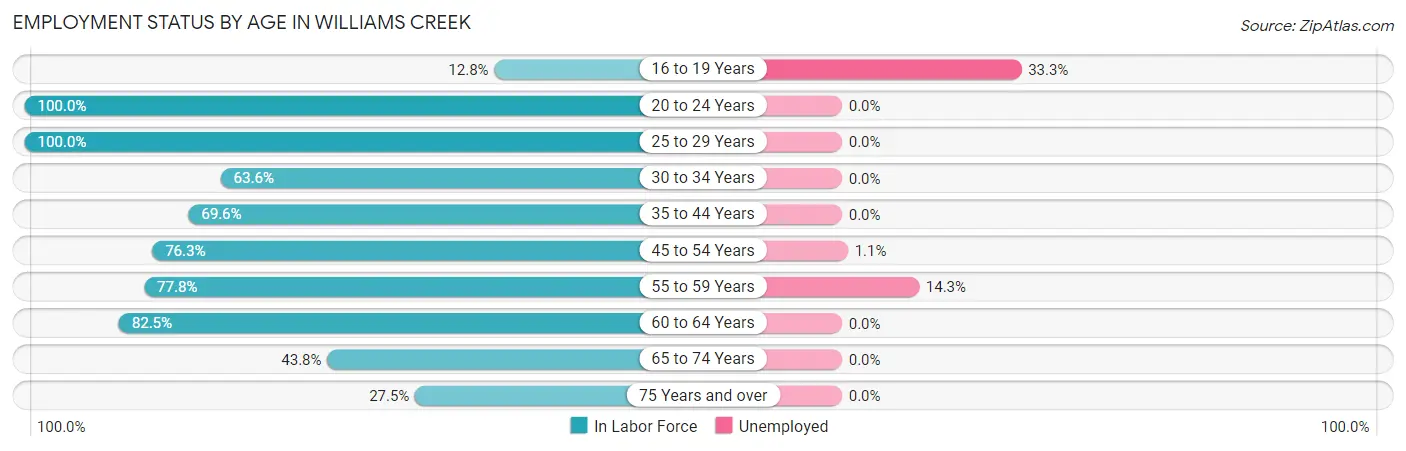
| Age Bracket | In Labor Force | Unemployed |
| 16 to 19 Years | 6 (12.8%) | 2 (33.3%) |
| 20 to 24 Years | 2 (100.0%) | 0 (0.0%) |
| 25 to 29 Years | 2 (100.0%) | 0 (0.0%) |
| 30 to 34 Years | 7 (63.6%) | 0 (0.0%) |
| 35 to 44 Years | 16 (69.6%) | 0 (0.0%) |
| 45 to 54 Years | 87 (76.3%) | 1 (1.1%) |
| 55 to 59 Years | 14 (77.8%) | 2 (14.3%) |
| 60 to 64 Years | 33 (82.5%) | 0 (0.0%) |
| 65 to 74 Years | 28 (43.8%) | 0 (0.0%) |
| 75 Years and over | 11 (27.5%) | 0 (0.0%) |
| Total | 206 (57.1%) | 5 (2.4%) |
Employment Status by Educational Attainment in Williams Creek
According to labor force statistics for Williams Creek, 76.4% of individuals (159) out of the total population between 25 and 64 years of age (208) are in the labor force, with 1.9% or 3 of them being unemployed. The group with the highest labor force participation rate are those with the educational attainment of college / associate degree, with 93.9% or 31 individuals in the labor force. Within the labor force, individuals with bachelor's degree or higher education have the highest percentage of unemployment, with 2.5% or 3 of them being unemployed.
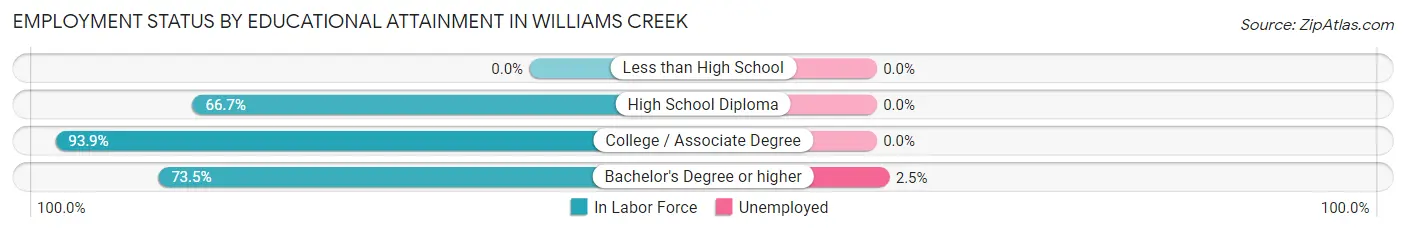
| Educational Attainment | In Labor Force | Unemployed |
| Less than High School | 0 (0.0%) | 0 (0.0%) |
| High School Diploma | 6 (66.7%) | 0 (0.0%) |
| College / Associate Degree | 31 (93.9%) | 0 (0.0%) |
| Bachelor's Degree or higher | 122 (73.5%) | 4 (2.5%) |
| Total | 159 (76.4%) | 4 (1.9%) |
Employment Occupations by Sex in Williams Creek
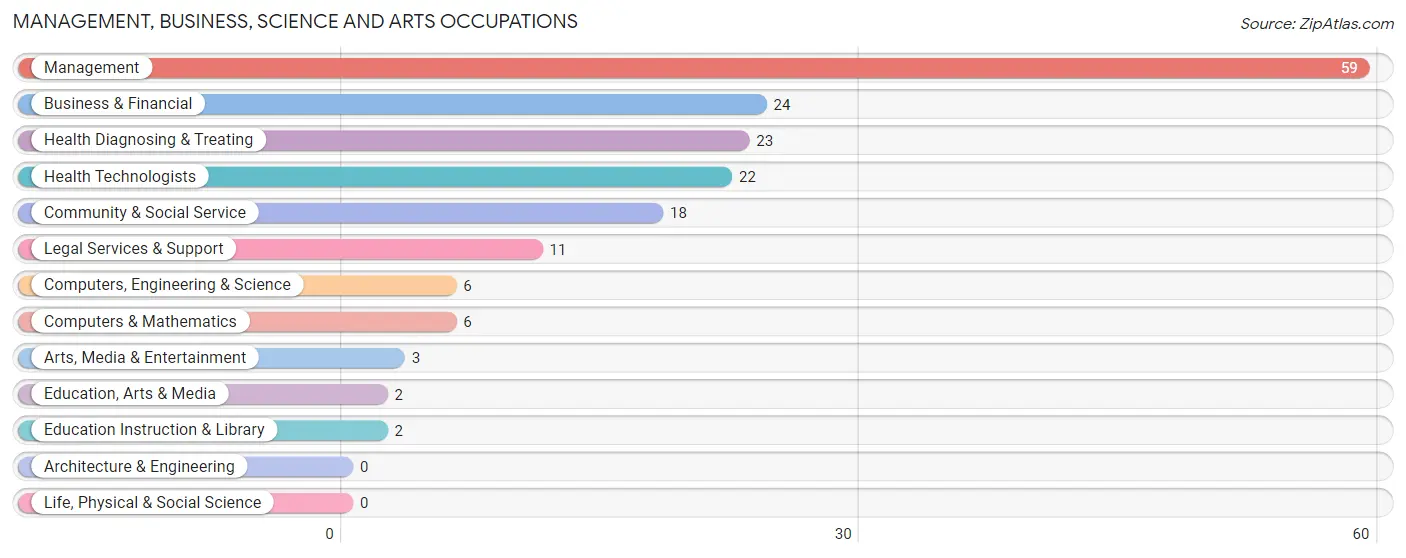
Management, Business, Science and Arts Occupations
The most common Management, Business, Science and Arts occupations in Williams Creek are Management (59 | 29.3%), Business & Financial (24 | 11.9%), Health Diagnosing & Treating (23 | 11.4%), Health Technologists (22 | 11.0%), and Community & Social Service (18 | 9.0%).
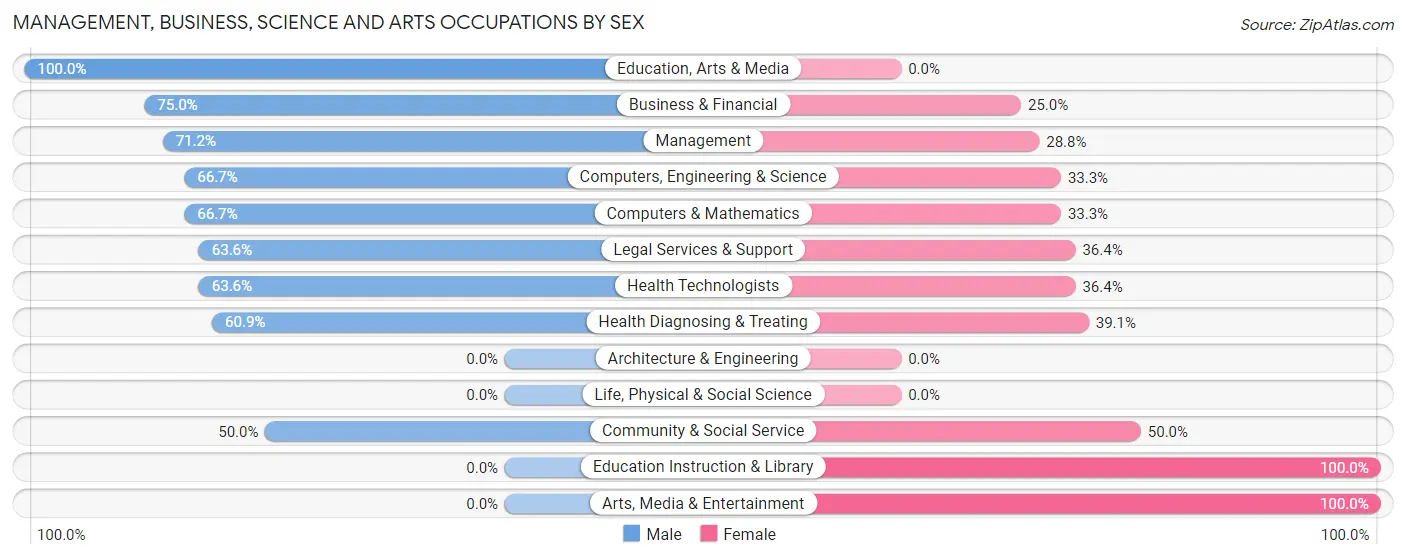
Management, Business, Science and Arts Occupations by Sex
Within the Management, Business, Science and Arts occupations in Williams Creek, the most male-oriented occupations are Education, Arts & Media (100.0%), Business & Financial (75.0%), and Management (71.2%), while the most female-oriented occupations are Education Instruction & Library (100.0%), Arts, Media & Entertainment (100.0%), and Community & Social Service (50.0%).
| Occupation | Male | Female |
| Management | 42 (71.2%) | 17 (28.8%) |
| Business & Financial | 18 (75.0%) | 6 (25.0%) |
| Computers, Engineering & Science | 4 (66.7%) | 2 (33.3%) |
| Computers & Mathematics | 4 (66.7%) | 2 (33.3%) |
| Architecture & Engineering | 0 (0.0%) | 0 (0.0%) |
| Life, Physical & Social Science | 0 (0.0%) | 0 (0.0%) |
| Community & Social Service | 9 (50.0%) | 9 (50.0%) |
| Education, Arts & Media | 2 (100.0%) | 0 (0.0%) |
| Legal Services & Support | 7 (63.6%) | 4 (36.4%) |
| Education Instruction & Library | 0 (0.0%) | 2 (100.0%) |
| Arts, Media & Entertainment | 0 (0.0%) | 3 (100.0%) |
| Health Diagnosing & Treating | 14 (60.9%) | 9 (39.1%) |
| Health Technologists | 14 (63.6%) | 8 (36.4%) |
| Total (Category) | 87 (66.9%) | 43 (33.1%) |
| Total (Overall) | 124 (61.7%) | 77 (38.3%) |
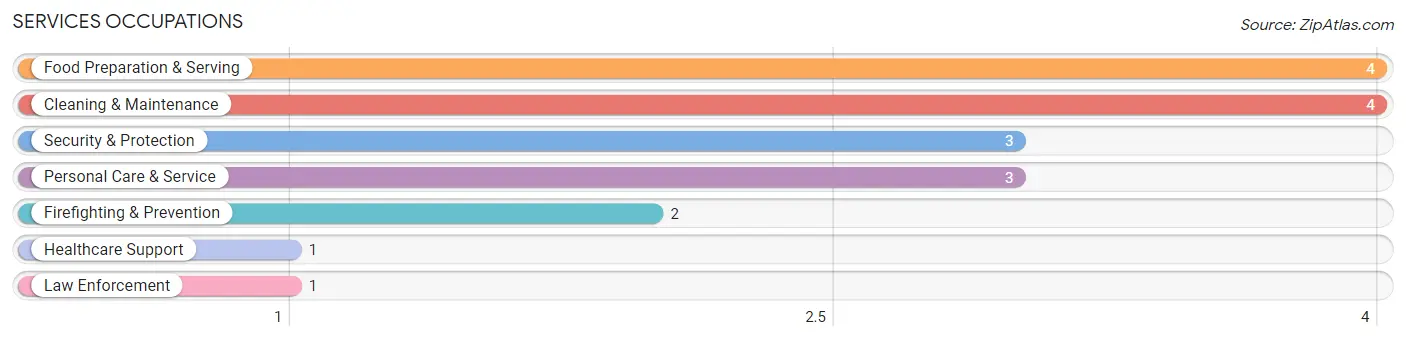
Services Occupations
The most common Services occupations in Williams Creek are Food Preparation & Serving (4 | 2.0%), Cleaning & Maintenance (4 | 2.0%), Security & Protection (3 | 1.5%), Personal Care & Service (3 | 1.5%), and Firefighting & Prevention (2 | 1.0%).
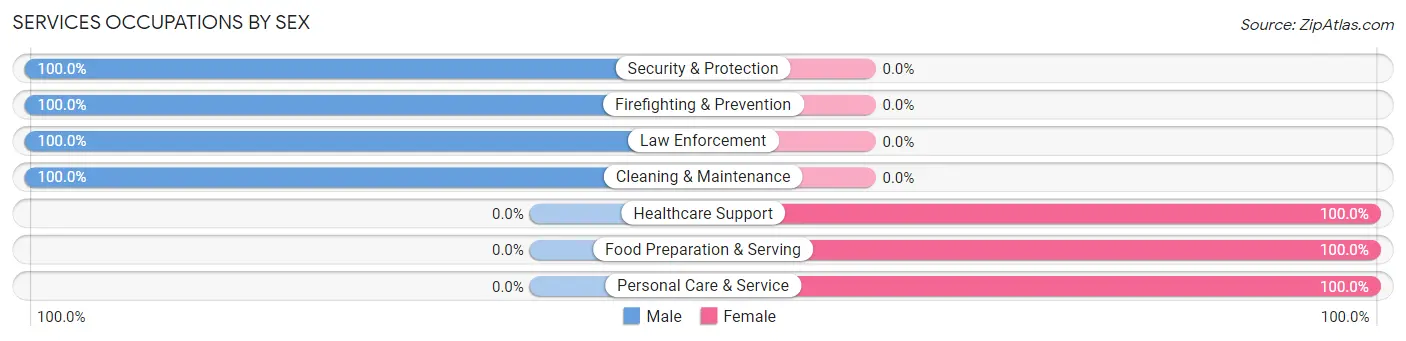
Services Occupations by Sex
Within the Services occupations in Williams Creek, the most male-oriented occupations are Security & Protection (100.0%), Firefighting & Prevention (100.0%), and Law Enforcement (100.0%), while the most female-oriented occupations are Healthcare Support (100.0%), Food Preparation & Serving (100.0%), and Personal Care & Service (100.0%).
| Occupation | Male | Female |
| Healthcare Support | 0 (0.0%) | 1 (100.0%) |
| Security & Protection | 3 (100.0%) | 0 (0.0%) |
| Firefighting & Prevention | 2 (100.0%) | 0 (0.0%) |
| Law Enforcement | 1 (100.0%) | 0 (0.0%) |
| Food Preparation & Serving | 0 (0.0%) | 4 (100.0%) |
| Cleaning & Maintenance | 4 (100.0%) | 0 (0.0%) |
| Personal Care & Service | 0 (0.0%) | 3 (100.0%) |
| Total (Category) | 7 (46.7%) | 8 (53.3%) |
| Total (Overall) | 124 (61.7%) | 77 (38.3%) |
Sales and Office Occupations
The most common Sales and Office occupations in Williams Creek are Sales & Related (42 | 20.9%), and Office & Administration (3 | 1.5%).
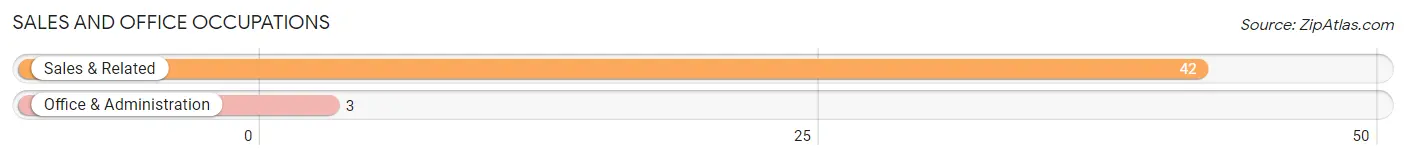
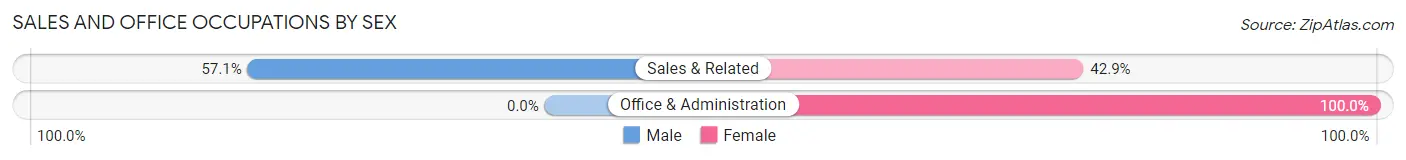
Sales and Office Occupations by Sex
| Occupation | Male | Female |
| Sales & Related | 24 (57.1%) | 18 (42.9%) |
| Office & Administration | 0 (0.0%) | 3 (100.0%) |
| Total (Category) | 24 (53.3%) | 21 (46.7%) |
| Total (Overall) | 124 (61.7%) | 77 (38.3%) |
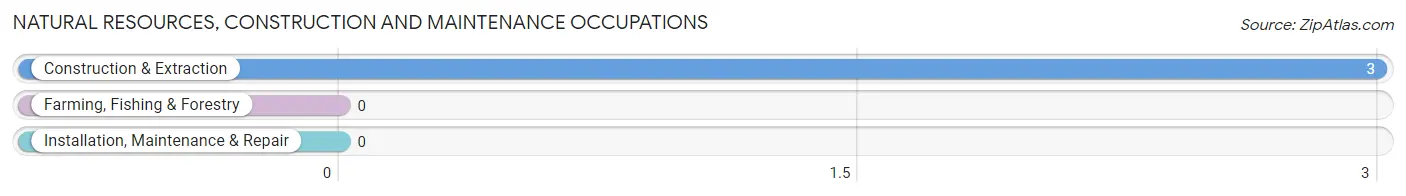
Natural Resources, Construction and Maintenance Occupations
The most common Natural Resources, Construction and Maintenance occupations in Williams Creek are , and Construction & Extraction (3 | 1.5%).
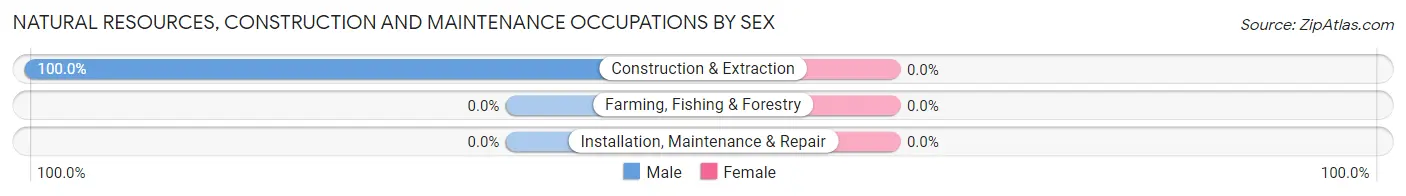
Natural Resources, Construction and Maintenance Occupations by Sex
| Occupation | Male | Female |
| Farming, Fishing & Forestry | 0 (0.0%) | 0 (0.0%) |
| Construction & Extraction | 3 (100.0%) | 0 (0.0%) |
| Installation, Maintenance & Repair | 0 (0.0%) | 0 (0.0%) |
| Total (Category) | 3 (100.0%) | 0 (0.0%) |
| Total (Overall) | 124 (61.7%) | 77 (38.3%) |
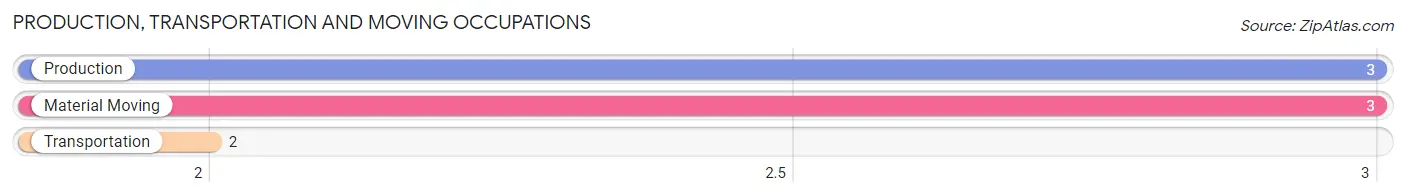
Production, Transportation and Moving Occupations
The most common Production, Transportation and Moving occupations in Williams Creek are Production (3 | 1.5%), Material Moving (3 | 1.5%), and Transportation (2 | 1.0%).
Production, Transportation and Moving Occupations by Sex
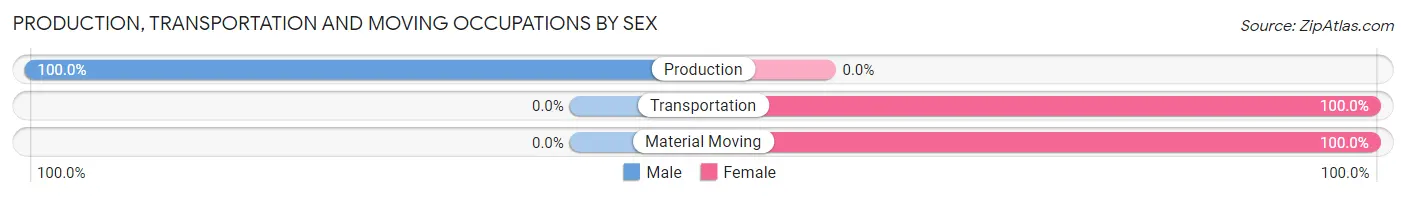
| Occupation | Male | Female |
| Production | 3 (100.0%) | 0 (0.0%) |
| Transportation | 0 (0.0%) | 2 (100.0%) |
| Material Moving | 0 (0.0%) | 3 (100.0%) |
| Total (Category) | 3 (37.5%) | 5 (62.5%) |
| Total (Overall) | 124 (61.7%) | 77 (38.3%) |
Employment Industries by Sex in Williams Creek
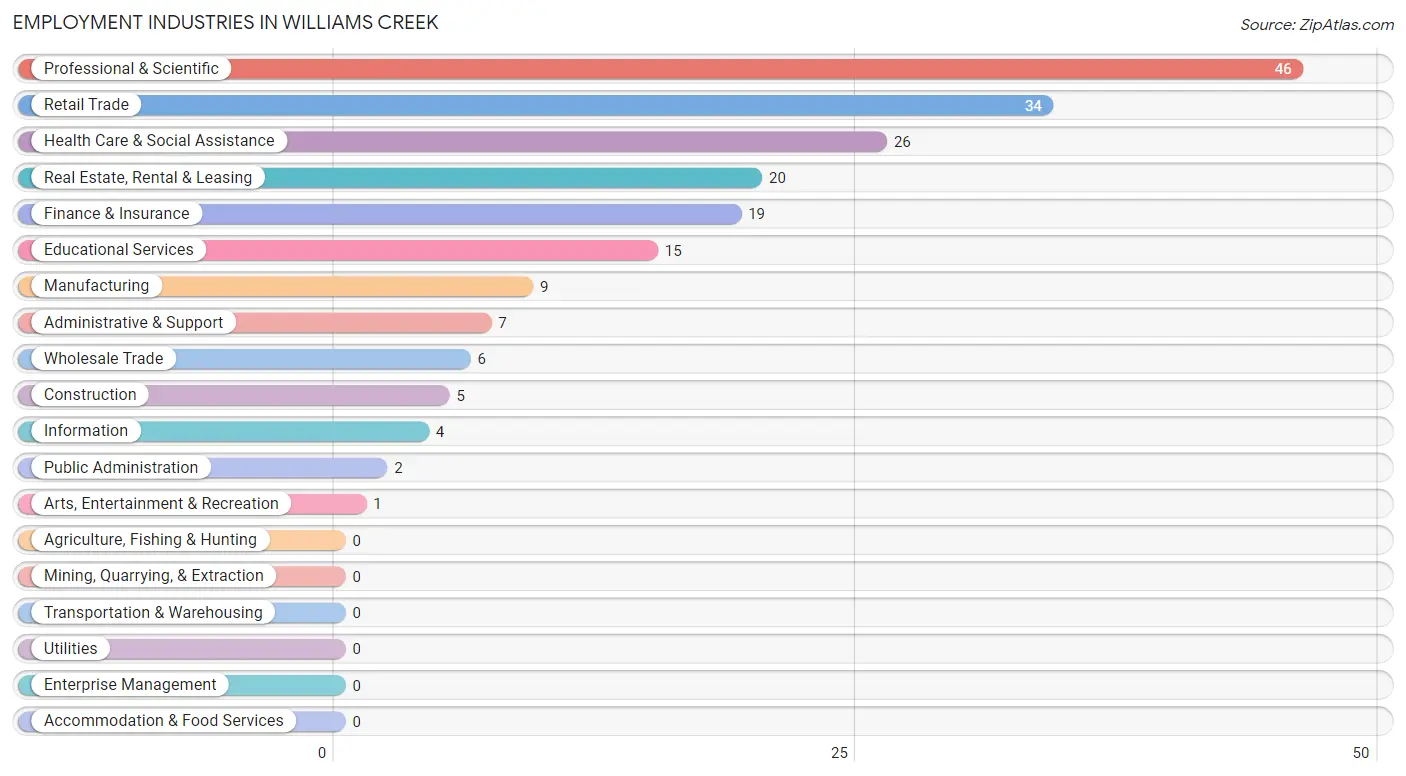
Employment Industries in Williams Creek
The major employment industries in Williams Creek include Professional & Scientific (46 | 22.9%), Retail Trade (34 | 16.9%), Health Care & Social Assistance (26 | 12.9%), Real Estate, Rental & Leasing (20 | 10.0%), and Finance & Insurance (19 | 9.5%).
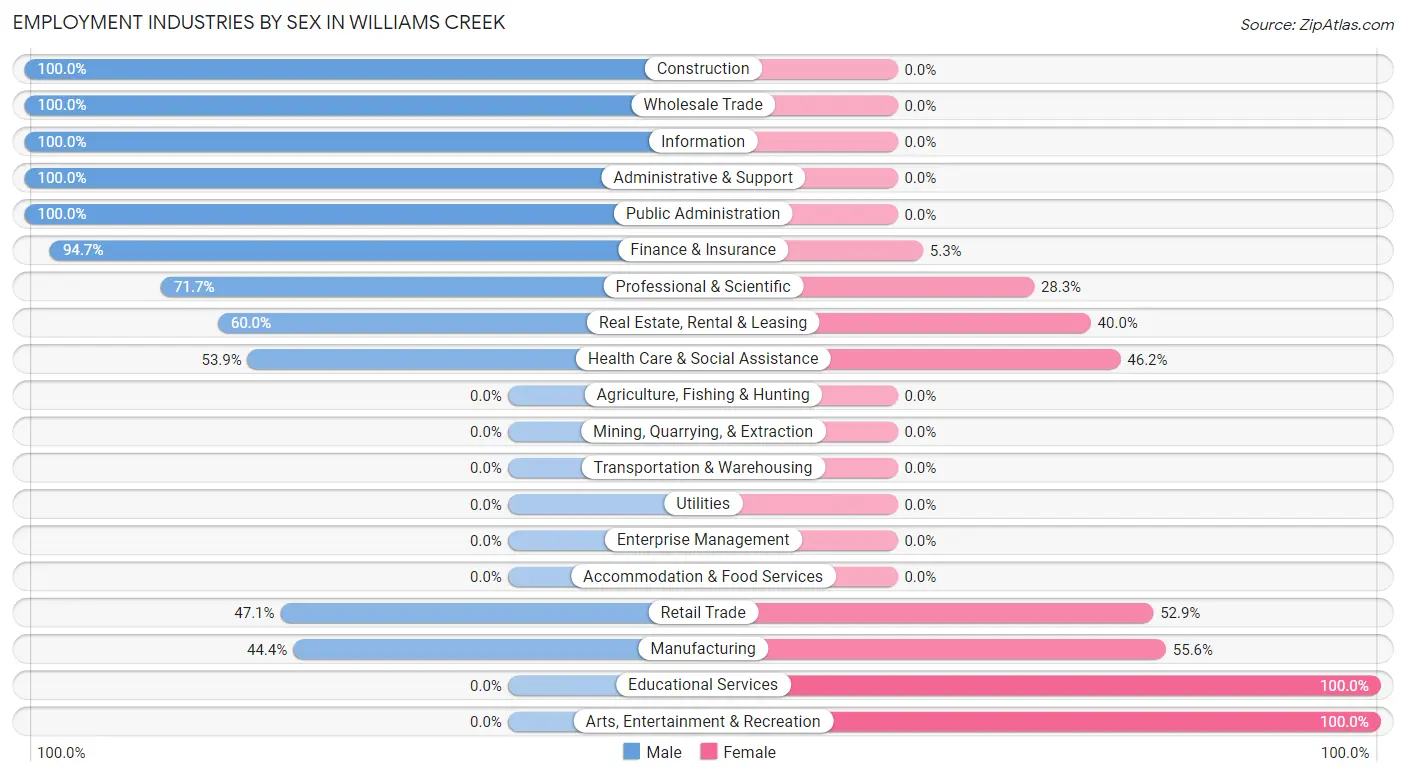
Employment Industries by Sex in Williams Creek
The Williams Creek industries that see more men than women are Construction (100.0%), Wholesale Trade (100.0%), and Information (100.0%), whereas the industries that tend to have a higher number of women are Educational Services (100.0%), Arts, Entertainment & Recreation (100.0%), and Manufacturing (55.6%).
| Industry | Male | Female |
| Agriculture, Fishing & Hunting | 0 (0.0%) | 0 (0.0%) |
| Mining, Quarrying, & Extraction | 0 (0.0%) | 0 (0.0%) |
| Construction | 5 (100.0%) | 0 (0.0%) |
| Manufacturing | 4 (44.4%) | 5 (55.6%) |
| Wholesale Trade | 6 (100.0%) | 0 (0.0%) |
| Retail Trade | 16 (47.1%) | 18 (52.9%) |
| Transportation & Warehousing | 0 (0.0%) | 0 (0.0%) |
| Utilities | 0 (0.0%) | 0 (0.0%) |
| Information | 4 (100.0%) | 0 (0.0%) |
| Finance & Insurance | 18 (94.7%) | 1 (5.3%) |
| Real Estate, Rental & Leasing | 12 (60.0%) | 8 (40.0%) |
| Professional & Scientific | 33 (71.7%) | 13 (28.3%) |
| Enterprise Management | 0 (0.0%) | 0 (0.0%) |
| Administrative & Support | 7 (100.0%) | 0 (0.0%) |
| Educational Services | 0 (0.0%) | 15 (100.0%) |
| Health Care & Social Assistance | 14 (53.8%) | 12 (46.2%) |
| Arts, Entertainment & Recreation | 0 (0.0%) | 1 (100.0%) |
| Accommodation & Food Services | 0 (0.0%) | 0 (0.0%) |
| Public Administration | 2 (100.0%) | 0 (0.0%) |
| Total | 124 (61.7%) | 77 (38.3%) |
Education in Williams Creek
School Enrollment in Williams Creek
The most common levels of schooling among the 127 students in Williams Creek are high school (52 | 40.9%), middle school (41 | 32.3%), and elementary school (20 | 15.8%).
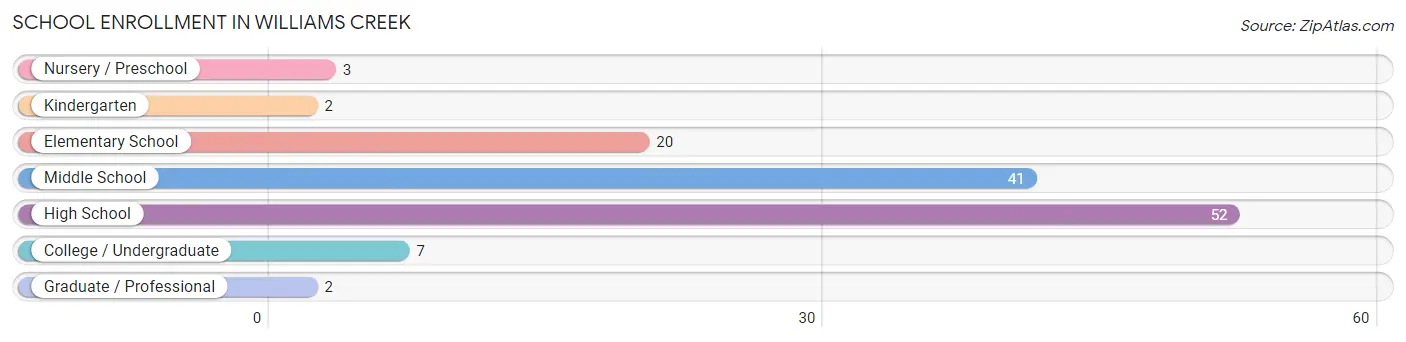
| School Level | # Students | % Students |
| Nursery / Preschool | 3 | 2.4% |
| Kindergarten | 2 | 1.6% |
| Elementary School | 20 | 15.8% |
| Middle School | 41 | 32.3% |
| High School | 52 | 40.9% |
| College / Undergraduate | 7 | 5.5% |
| Graduate / Professional | 2 | 1.6% |
| Total | 127 | 100.0% |
School Enrollment by Age by Funding Source in Williams Creek
Out of a total of 127 students who are enrolled in schools in Williams Creek, 93 (73.2%) attend a private institution, while the remaining 34 (26.8%) are enrolled in public schools. The age group of 3 to 4 year olds has the highest likelihood of being enrolled in private schools, with 1 (100.0% in the age bracket) enrolled. Conversely, the age group of 20 to 24 year olds has the lowest likelihood of being enrolled in a private school, with 2 (100.0% in the age bracket) attending a public institution.
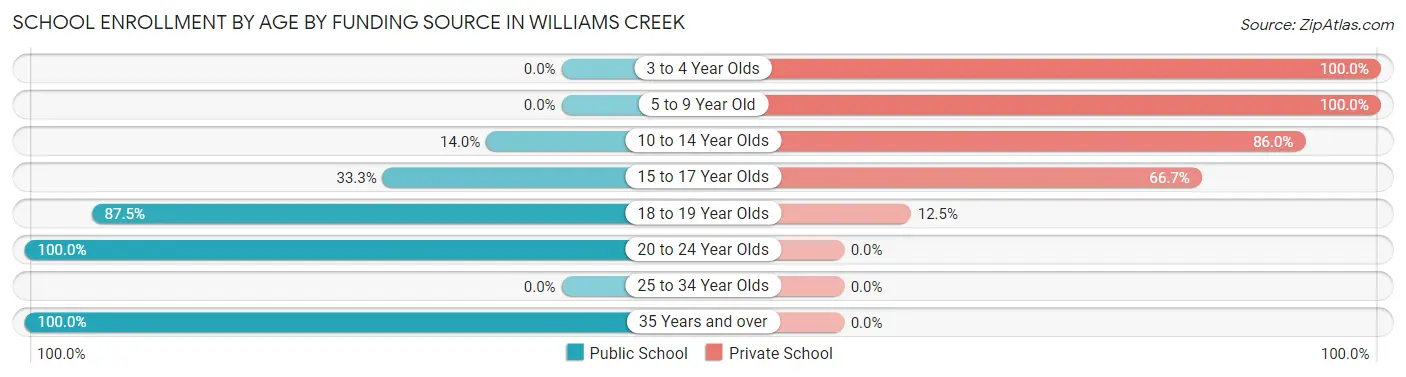
| Age Bracket | Public School | Private School |
| 3 to 4 Year Olds | 0 (0.0%) | 1 (100.0%) |
| 5 to 9 Year Old | 0 (0.0%) | 12 (100.0%) |
| 10 to 14 Year Olds | 8 (14.0%) | 49 (86.0%) |
| 15 to 17 Year Olds | 15 (33.3%) | 30 (66.7%) |
| 18 to 19 Year Olds | 7 (87.5%) | 1 (12.5%) |
| 20 to 24 Year Olds | 2 (100.0%) | 0 (0.0%) |
| 25 to 34 Year Olds | 0 (0.0%) | 0 (0.0%) |
| 35 Years and over | 2 (100.0%) | 0 (0.0%) |
| Total | 34 (26.8%) | 93 (73.2%) |
Educational Attainment by Field of Study in Williams Creek
Business (60 | 23.4%), bio, nature & agricultural (33 | 12.8%), social sciences (24 | 9.3%), engineering (24 | 9.3%), and science & technology (23 | 8.9%) are the most common fields of study among 257 individuals in Williams Creek who have obtained a bachelor's degree or higher.
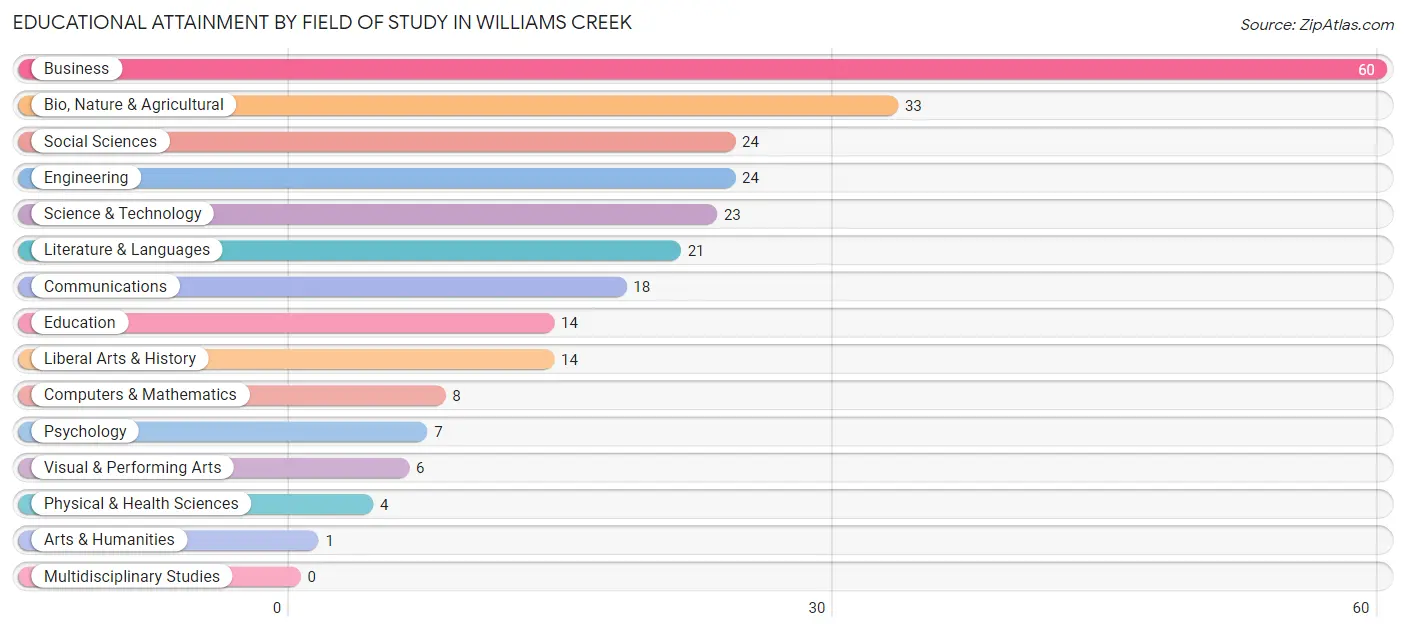
| Field of Study | # Graduates | % Graduates |
| Computers & Mathematics | 8 | 3.1% |
| Bio, Nature & Agricultural | 33 | 12.8% |
| Physical & Health Sciences | 4 | 1.6% |
| Psychology | 7 | 2.7% |
| Social Sciences | 24 | 9.3% |
| Engineering | 24 | 9.3% |
| Multidisciplinary Studies | 0 | 0.0% |
| Science & Technology | 23 | 8.9% |
| Business | 60 | 23.4% |
| Education | 14 | 5.4% |
| Literature & Languages | 21 | 8.2% |
| Liberal Arts & History | 14 | 5.4% |
| Visual & Performing Arts | 6 | 2.3% |
| Communications | 18 | 7.0% |
| Arts & Humanities | 1 | 0.4% |
| Total | 257 | 100.0% |
Transportation & Commute in Williams Creek
Vehicle Availability by Sex in Williams Creek
The most prevalent vehicle ownership categories in Williams Creek are males with 2 vehicles (57, accounting for 46.7%) and females with 2 vehicles (42, making up 74.0%).
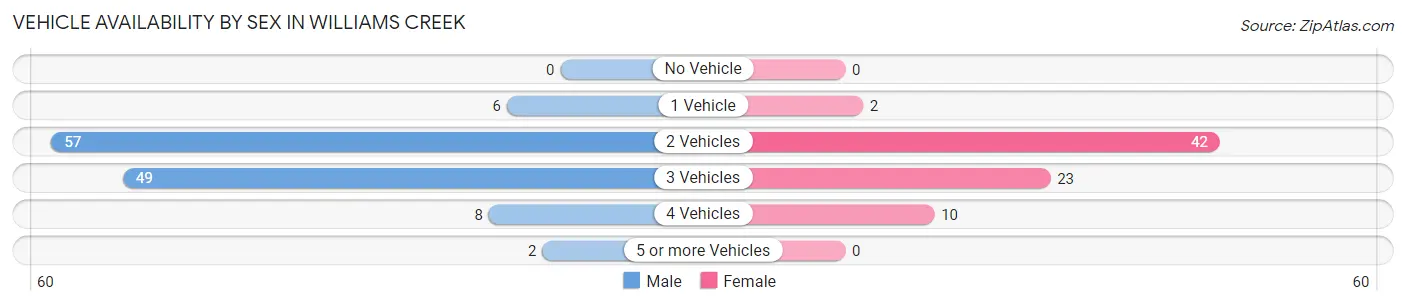
| Vehicles Available | Male | Female |
| No Vehicle | 0 (0.0%) | 0 (0.0%) |
| 1 Vehicle | 6 (4.9%) | 2 (2.6%) |
| 2 Vehicles | 57 (46.7%) | 42 (54.5%) |
| 3 Vehicles | 49 (40.2%) | 23 (29.9%) |
| 4 Vehicles | 8 (6.6%) | 10 (13.0%) |
| 5 or more Vehicles | 2 (1.6%) | 0 (0.0%) |
| Total | 122 (100.0%) | 77 (100.0%) |
Commute Time in Williams Creek
The most frequently occuring commute durations in Williams Creek are 30 to 34 minutes (34 commuters, 22.7%), 5 to 9 minutes (27 commuters, 18.0%), and 10 to 14 minutes (21 commuters, 14.0%).
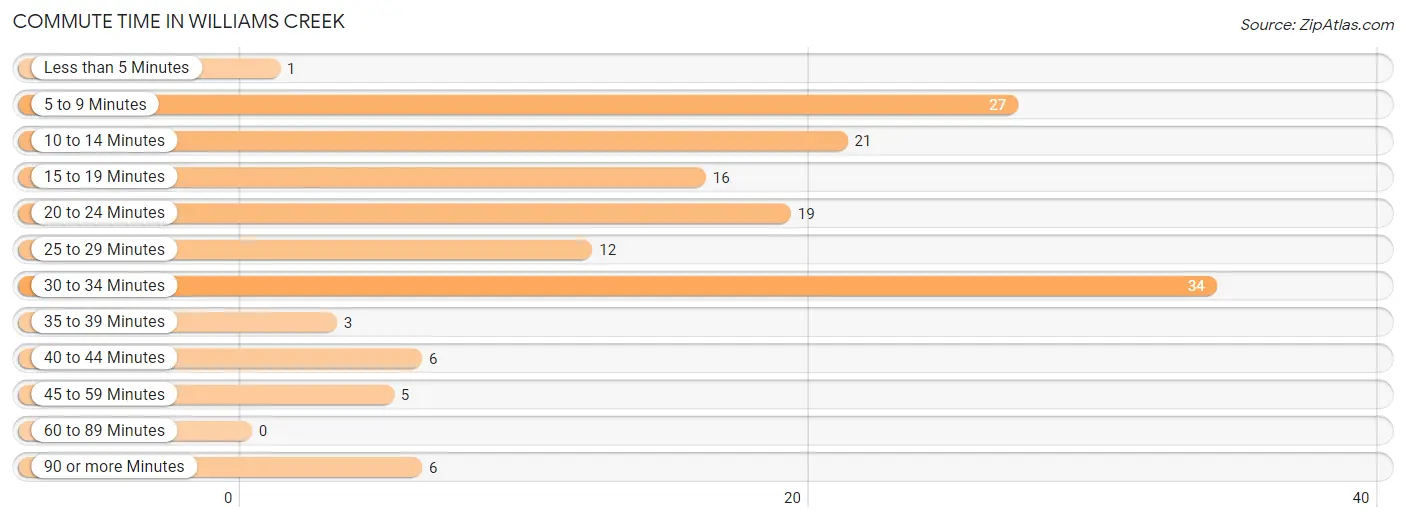
| Commute Time | # Commuters | % Commuters |
| Less than 5 Minutes | 1 | 0.7% |
| 5 to 9 Minutes | 27 | 18.0% |
| 10 to 14 Minutes | 21 | 14.0% |
| 15 to 19 Minutes | 16 | 10.7% |
| 20 to 24 Minutes | 19 | 12.7% |
| 25 to 29 Minutes | 12 | 8.0% |
| 30 to 34 Minutes | 34 | 22.7% |
| 35 to 39 Minutes | 3 | 2.0% |
| 40 to 44 Minutes | 6 | 4.0% |
| 45 to 59 Minutes | 5 | 3.3% |
| 60 to 89 Minutes | 0 | 0.0% |
| 90 or more Minutes | 6 | 4.0% |
Commute Time by Sex in Williams Creek
The most common commute times in Williams Creek are 30 to 34 minutes (29 commuters, 29.6%) for males and 10 to 14 minutes (10 commuters, 19.2%) for females.
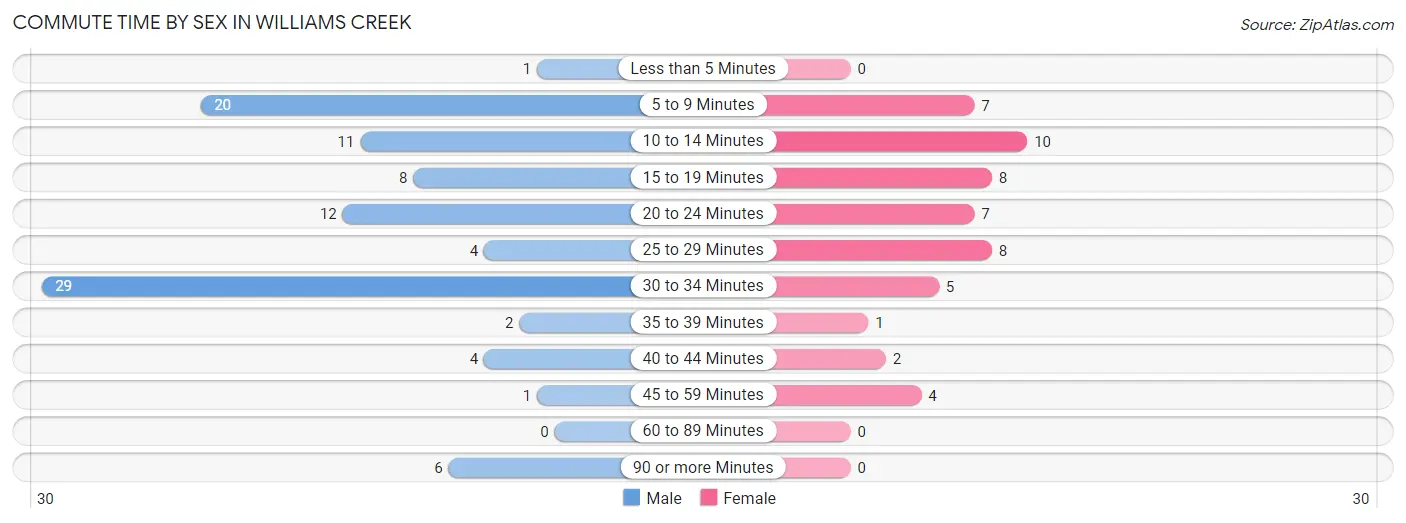
| Commute Time | Male | Female |
| Less than 5 Minutes | 1 (1.0%) | 0 (0.0%) |
| 5 to 9 Minutes | 20 (20.4%) | 7 (13.5%) |
| 10 to 14 Minutes | 11 (11.2%) | 10 (19.2%) |
| 15 to 19 Minutes | 8 (8.2%) | 8 (15.4%) |
| 20 to 24 Minutes | 12 (12.2%) | 7 (13.5%) |
| 25 to 29 Minutes | 4 (4.1%) | 8 (15.4%) |
| 30 to 34 Minutes | 29 (29.6%) | 5 (9.6%) |
| 35 to 39 Minutes | 2 (2.0%) | 1 (1.9%) |
| 40 to 44 Minutes | 4 (4.1%) | 2 (3.8%) |
| 45 to 59 Minutes | 1 (1.0%) | 4 (7.7%) |
| 60 to 89 Minutes | 0 (0.0%) | 0 (0.0%) |
| 90 or more Minutes | 6 (6.1%) | 0 (0.0%) |
Time of Departure to Work by Sex in Williams Creek
The most frequent times of departure to work in Williams Creek are 8:00 AM to 8:29 AM (25, 25.5%) for males and 9:00 AM to 9:59 AM (14, 26.9%) for females.
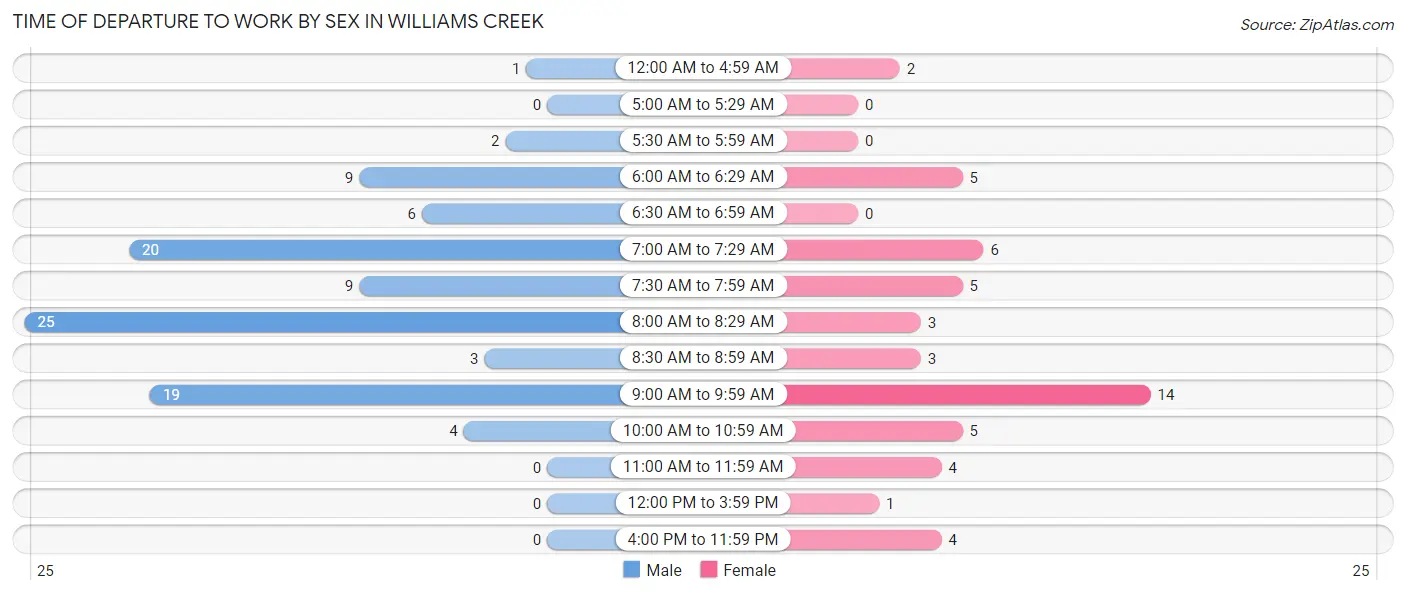
| Time of Departure | Male | Female |
| 12:00 AM to 4:59 AM | 1 (1.0%) | 2 (3.8%) |
| 5:00 AM to 5:29 AM | 0 (0.0%) | 0 (0.0%) |
| 5:30 AM to 5:59 AM | 2 (2.0%) | 0 (0.0%) |
| 6:00 AM to 6:29 AM | 9 (9.2%) | 5 (9.6%) |
| 6:30 AM to 6:59 AM | 6 (6.1%) | 0 (0.0%) |
| 7:00 AM to 7:29 AM | 20 (20.4%) | 6 (11.5%) |
| 7:30 AM to 7:59 AM | 9 (9.2%) | 5 (9.6%) |
| 8:00 AM to 8:29 AM | 25 (25.5%) | 3 (5.8%) |
| 8:30 AM to 8:59 AM | 3 (3.1%) | 3 (5.8%) |
| 9:00 AM to 9:59 AM | 19 (19.4%) | 14 (26.9%) |
| 10:00 AM to 10:59 AM | 4 (4.1%) | 5 (9.6%) |
| 11:00 AM to 11:59 AM | 0 (0.0%) | 4 (7.7%) |
| 12:00 PM to 3:59 PM | 0 (0.0%) | 1 (1.9%) |
| 4:00 PM to 11:59 PM | 0 (0.0%) | 4 (7.7%) |
| Total | 98 (100.0%) | 52 (100.0%) |
Housing Occupancy in Williams Creek
Occupancy by Ownership in Williams Creek
Of the total 163 dwellings in Williams Creek, owner-occupied units account for 152 (93.2%), while renter-occupied units make up 11 (6.8%).
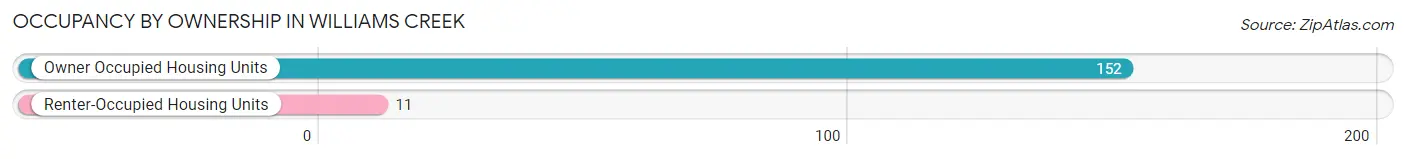
| Occupancy | # Housing Units | % Housing Units |
| Owner Occupied Housing Units | 152 | 93.2% |
| Renter-Occupied Housing Units | 11 | 6.8% |
| Total Occupied Housing Units | 163 | 100.0% |
Occupancy by Household Size in Williams Creek
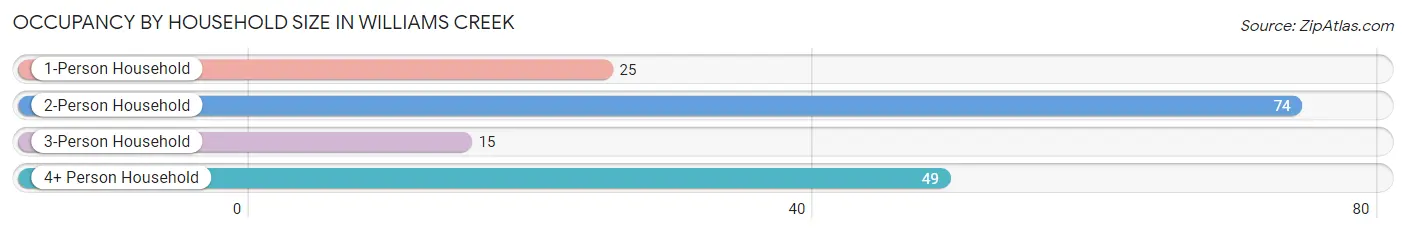
| Household Size | # Housing Units | % Housing Units |
| 1-Person Household | 25 | 15.3% |
| 2-Person Household | 74 | 45.4% |
| 3-Person Household | 15 | 9.2% |
| 4+ Person Household | 49 | 30.1% |
| Total Housing Units | 163 | 100.0% |
Occupancy by Ownership by Household Size in Williams Creek
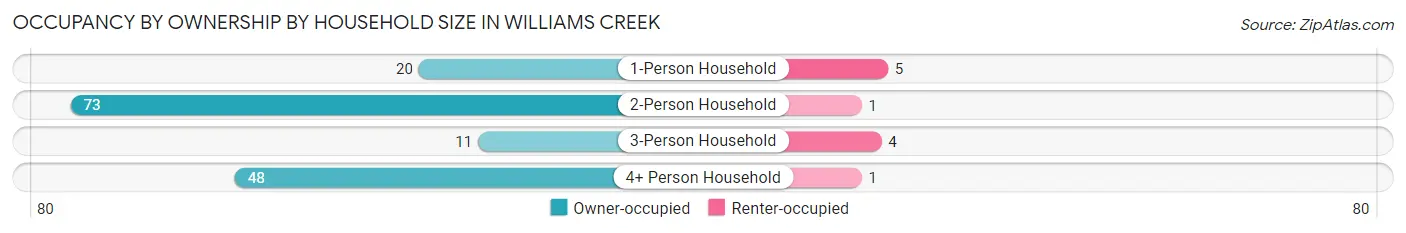
| Household Size | Owner-occupied | Renter-occupied |
| 1-Person Household | 20 (80.0%) | 5 (20.0%) |
| 2-Person Household | 73 (98.7%) | 1 (1.3%) |
| 3-Person Household | 11 (73.3%) | 4 (26.7%) |
| 4+ Person Household | 48 (98.0%) | 1 (2.0%) |
| Total Housing Units | 152 (93.2%) | 11 (6.8%) |
Occupancy by Educational Attainment in Williams Creek
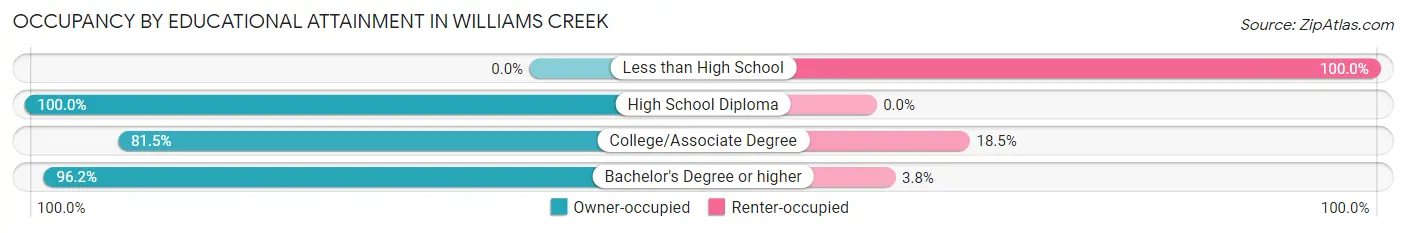
| Household Size | Owner-occupied | Renter-occupied |
| Less than High School | 0 (0.0%) | 1 (100.0%) |
| High School Diploma | 2 (100.0%) | 0 (0.0%) |
| College/Associate Degree | 22 (81.5%) | 5 (18.5%) |
| Bachelor's Degree or higher | 128 (96.2%) | 5 (3.8%) |
Occupancy by Age of Householder in Williams Creek
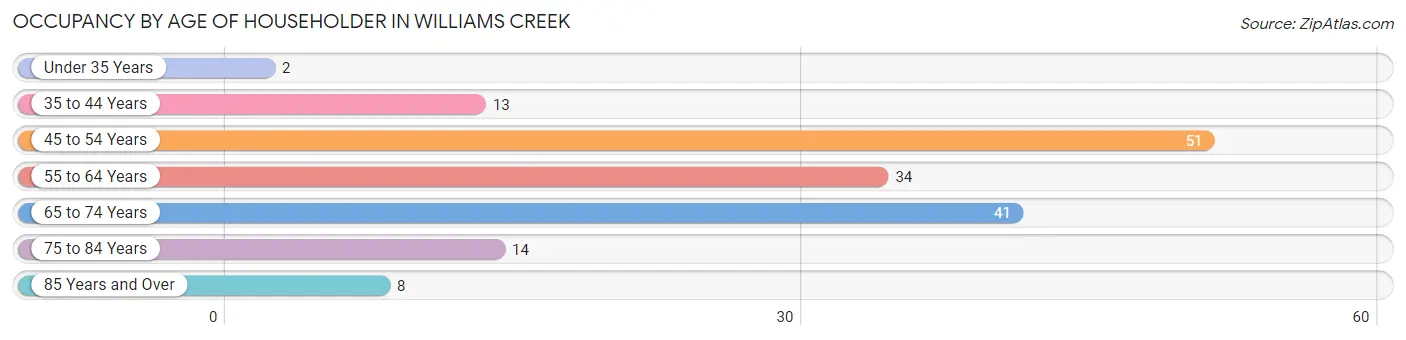
| Age Bracket | # Households | % Households |
| Under 35 Years | 2 | 1.2% |
| 35 to 44 Years | 13 | 8.0% |
| 45 to 54 Years | 51 | 31.3% |
| 55 to 64 Years | 34 | 20.9% |
| 65 to 74 Years | 41 | 25.2% |
| 75 to 84 Years | 14 | 8.6% |
| 85 Years and Over | 8 | 4.9% |
| Total | 163 | 100.0% |
Housing Finances in Williams Creek
Median Income by Occupancy in Williams Creek
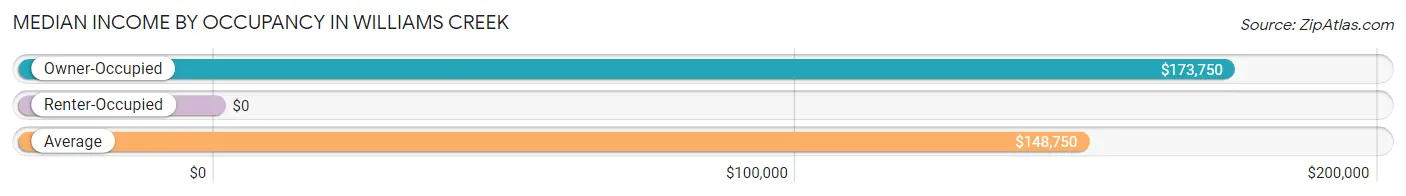
| Occupancy Type | # Households | Median Income |
| Owner-Occupied | 152 (93.2%) | $173,750 |
| Renter-Occupied | 11 (6.8%) | $0 |
| Average | 163 (100.0%) | $148,750 |
Occupancy by Householder Income Bracket in Williams Creek
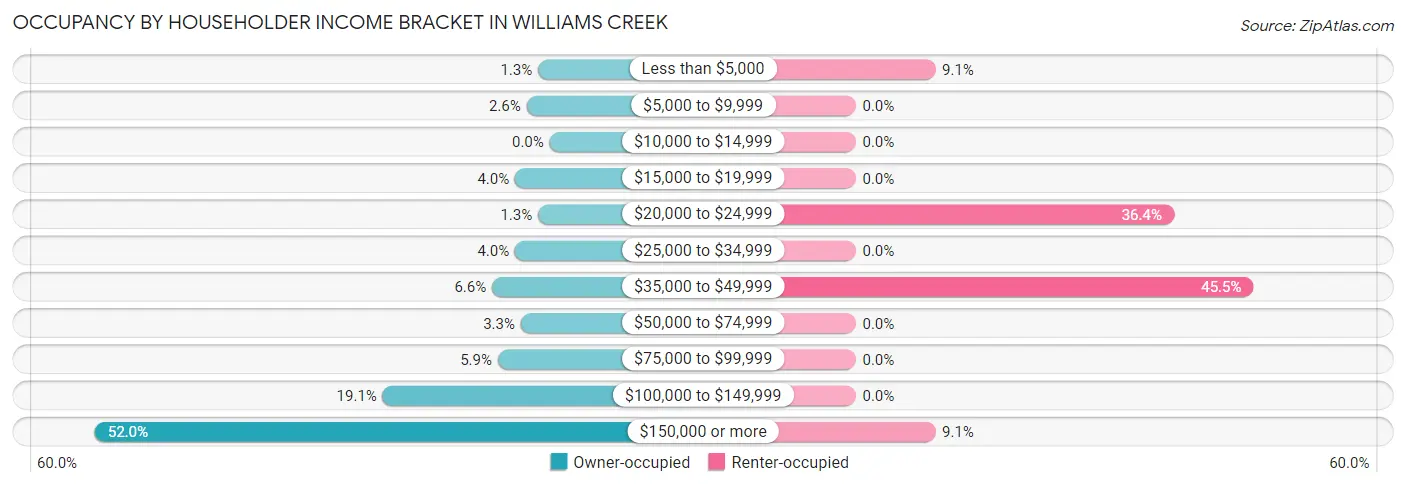
| Income Bracket | Owner-occupied | Renter-occupied |
| Less than $5,000 | 2 (1.3%) | 1 (9.1%) |
| $5,000 to $9,999 | 4 (2.6%) | 0 (0.0%) |
| $10,000 to $14,999 | 0 (0.0%) | 0 (0.0%) |
| $15,000 to $19,999 | 6 (4.0%) | 0 (0.0%) |
| $20,000 to $24,999 | 2 (1.3%) | 4 (36.4%) |
| $25,000 to $34,999 | 6 (4.0%) | 0 (0.0%) |
| $35,000 to $49,999 | 10 (6.6%) | 5 (45.5%) |
| $50,000 to $74,999 | 5 (3.3%) | 0 (0.0%) |
| $75,000 to $99,999 | 9 (5.9%) | 0 (0.0%) |
| $100,000 to $149,999 | 29 (19.1%) | 0 (0.0%) |
| $150,000 or more | 79 (52.0%) | 1 (9.1%) |
| Total | 152 (100.0%) | 11 (100.0%) |
Monthly Housing Cost Tiers in Williams Creek
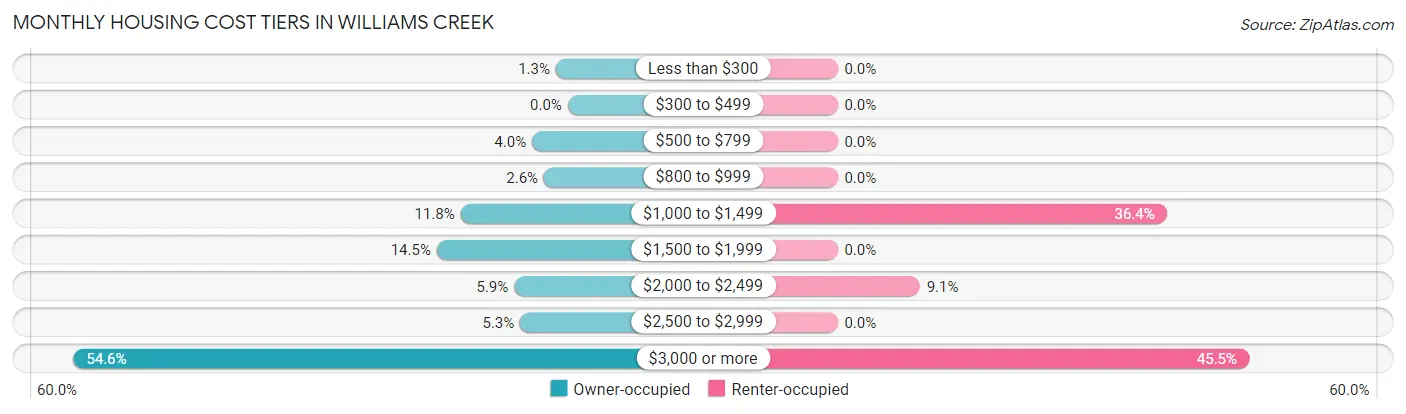
| Monthly Cost | Owner-occupied | Renter-occupied |
| Less than $300 | 2 (1.3%) | 0 (0.0%) |
| $300 to $499 | 0 (0.0%) | 0 (0.0%) |
| $500 to $799 | 6 (4.0%) | 0 (0.0%) |
| $800 to $999 | 4 (2.6%) | 0 (0.0%) |
| $1,000 to $1,499 | 18 (11.8%) | 4 (36.4%) |
| $1,500 to $1,999 | 22 (14.5%) | 0 (0.0%) |
| $2,000 to $2,499 | 9 (5.9%) | 1 (9.1%) |
| $2,500 to $2,999 | 8 (5.3%) | 0 (0.0%) |
| $3,000 or more | 83 (54.6%) | 5 (45.5%) |
| Total | 152 (100.0%) | 11 (100.0%) |
Physical Housing Characteristics in Williams Creek
Housing Structures in Williams Creek
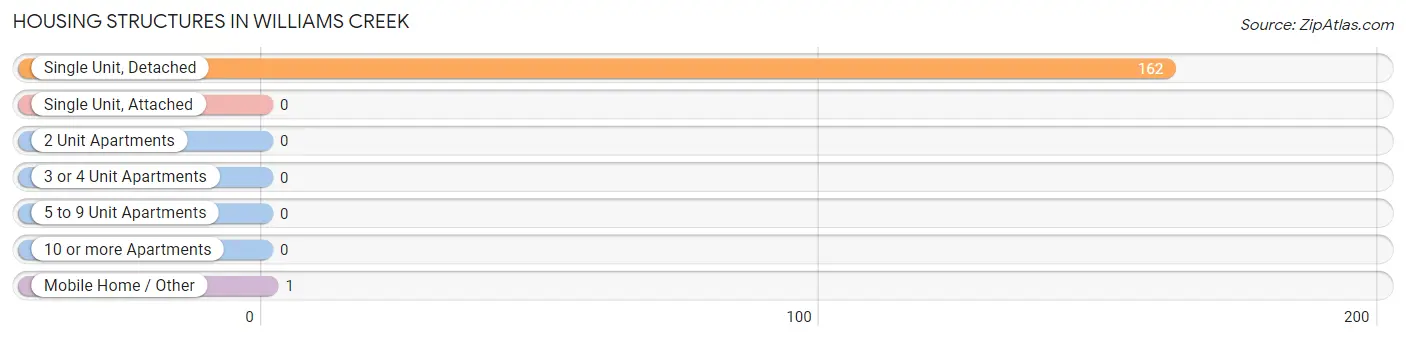
| Structure Type | # Housing Units | % Housing Units |
| Single Unit, Detached | 162 | 99.4% |
| Single Unit, Attached | 0 | 0.0% |
| 2 Unit Apartments | 0 | 0.0% |
| 3 or 4 Unit Apartments | 0 | 0.0% |
| 5 to 9 Unit Apartments | 0 | 0.0% |
| 10 or more Apartments | 0 | 0.0% |
| Mobile Home / Other | 1 | 0.6% |
| Total | 163 | 100.0% |
Housing Structures by Occupancy in Williams Creek
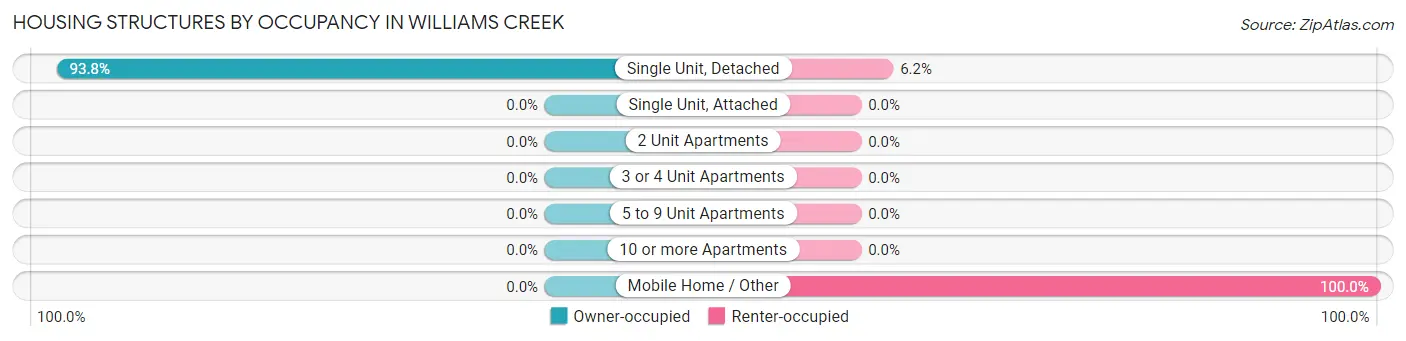
| Structure Type | Owner-occupied | Renter-occupied |
| Single Unit, Detached | 152 (93.8%) | 10 (6.2%) |
| Single Unit, Attached | 0 (0.0%) | 0 (0.0%) |
| 2 Unit Apartments | 0 (0.0%) | 0 (0.0%) |
| 3 or 4 Unit Apartments | 0 (0.0%) | 0 (0.0%) |
| 5 to 9 Unit Apartments | 0 (0.0%) | 0 (0.0%) |
| 10 or more Apartments | 0 (0.0%) | 0 (0.0%) |
| Mobile Home / Other | 0 (0.0%) | 1 (100.0%) |
| Total | 152 (93.2%) | 11 (6.8%) |
Housing Structures by Number of Rooms in Williams Creek
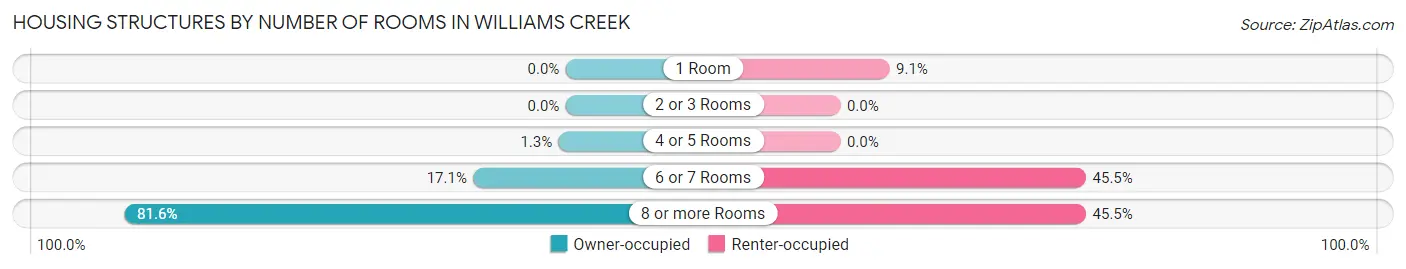
| Number of Rooms | Owner-occupied | Renter-occupied |
| 1 Room | 0 (0.0%) | 1 (9.1%) |
| 2 or 3 Rooms | 0 (0.0%) | 0 (0.0%) |
| 4 or 5 Rooms | 2 (1.3%) | 0 (0.0%) |
| 6 or 7 Rooms | 26 (17.1%) | 5 (45.5%) |
| 8 or more Rooms | 124 (81.6%) | 5 (45.5%) |
| Total | 152 (100.0%) | 11 (100.0%) |
Housing Structure by Heating Type in Williams Creek
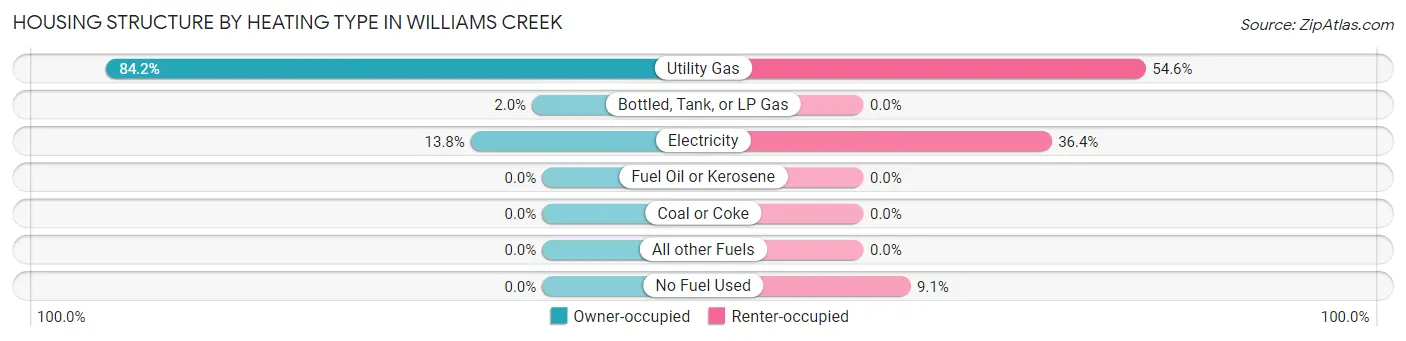
| Heating Type | Owner-occupied | Renter-occupied |
| Utility Gas | 128 (84.2%) | 6 (54.5%) |
| Bottled, Tank, or LP Gas | 3 (2.0%) | 0 (0.0%) |
| Electricity | 21 (13.8%) | 4 (36.4%) |
| Fuel Oil or Kerosene | 0 (0.0%) | 0 (0.0%) |
| Coal or Coke | 0 (0.0%) | 0 (0.0%) |
| All other Fuels | 0 (0.0%) | 0 (0.0%) |
| No Fuel Used | 0 (0.0%) | 1 (9.1%) |
| Total | 152 (100.0%) | 11 (100.0%) |
Household Vehicle Usage in Williams Creek
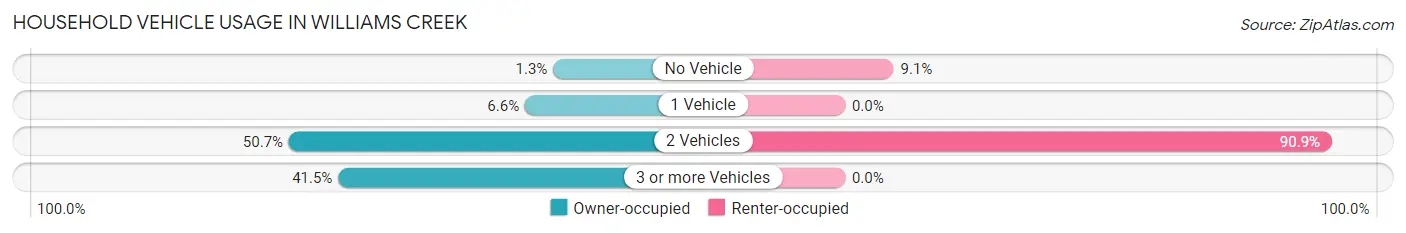
| Vehicles per Household | Owner-occupied | Renter-occupied |
| No Vehicle | 2 (1.3%) | 1 (9.1%) |
| 1 Vehicle | 10 (6.6%) | 0 (0.0%) |
| 2 Vehicles | 77 (50.7%) | 10 (90.9%) |
| 3 or more Vehicles | 63 (41.4%) | 0 (0.0%) |
| Total | 152 (100.0%) | 11 (100.0%) |
Real Estate & Mortgages in Williams Creek
Real Estate and Mortgage Overview in Williams Creek
| Characteristic | Without Mortgage | With Mortgage |
| Housing Units | 57 | 95 |
| Median Property Value | $914,500 | $1,197,100 |
| Median Household Income | $91,250 | $60 |
| Monthly Housing Costs | $1,501 | $80 |
| Real Estate Taxes | $9,219 | $0 |
Property Value by Mortgage Status in Williams Creek
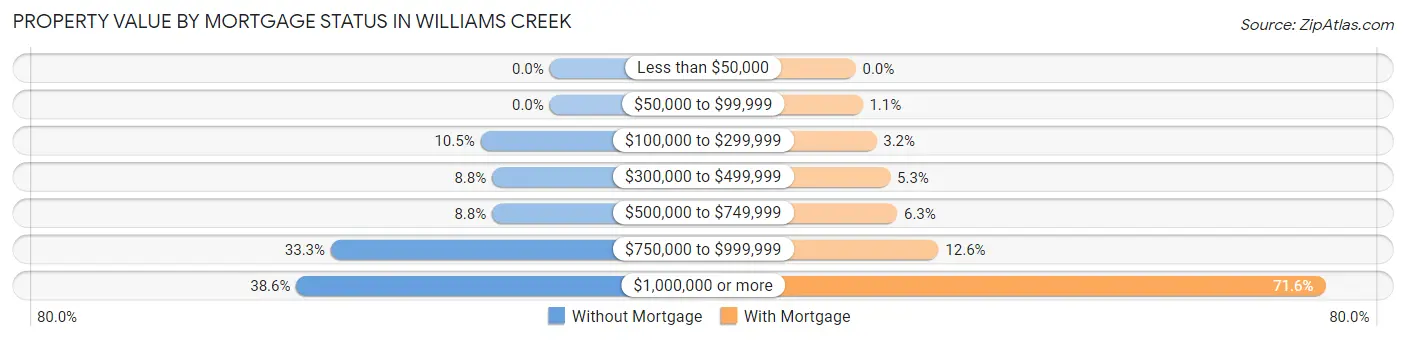
| Property Value | Without Mortgage | With Mortgage |
| Less than $50,000 | 0 (0.0%) | 0 (0.0%) |
| $50,000 to $99,999 | 0 (0.0%) | 1 (1.1%) |
| $100,000 to $299,999 | 6 (10.5%) | 3 (3.2%) |
| $300,000 to $499,999 | 5 (8.8%) | 5 (5.3%) |
| $500,000 to $749,999 | 5 (8.8%) | 6 (6.3%) |
| $750,000 to $999,999 | 19 (33.3%) | 12 (12.6%) |
| $1,000,000 or more | 22 (38.6%) | 68 (71.6%) |
| Total | 57 (100.0%) | 95 (100.0%) |
Household Income by Mortgage Status in Williams Creek
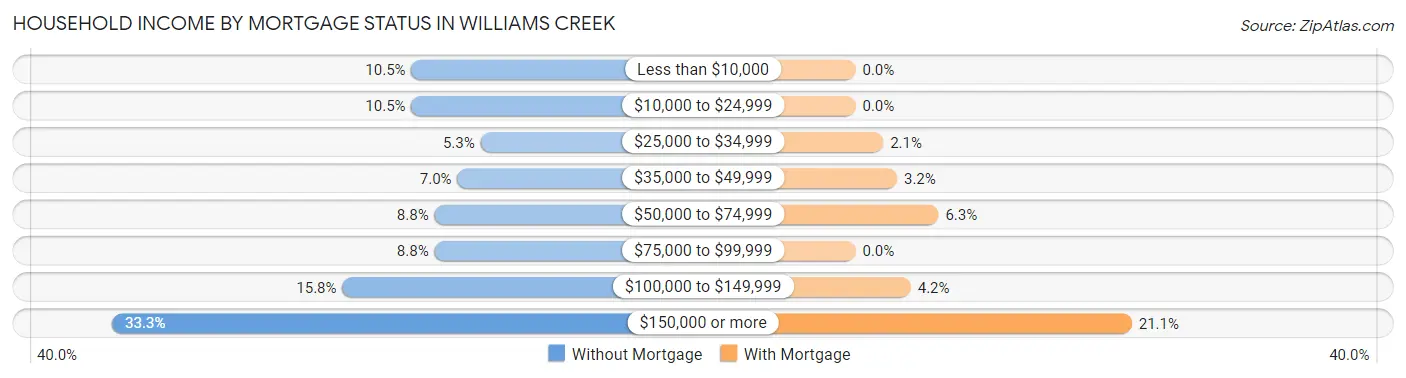
| Household Income | Without Mortgage | With Mortgage |
| Less than $10,000 | 6 (10.5%) | 0 (0.0%) |
| $10,000 to $24,999 | 6 (10.5%) | 0 (0.0%) |
| $25,000 to $34,999 | 3 (5.3%) | 2 (2.1%) |
| $35,000 to $49,999 | 4 (7.0%) | 3 (3.2%) |
| $50,000 to $74,999 | 5 (8.8%) | 6 (6.3%) |
| $75,000 to $99,999 | 5 (8.8%) | 0 (0.0%) |
| $100,000 to $149,999 | 9 (15.8%) | 4 (4.2%) |
| $150,000 or more | 19 (33.3%) | 20 (21.0%) |
| Total | 57 (100.0%) | 95 (100.0%) |
Property Value to Household Income Ratio in Williams Creek
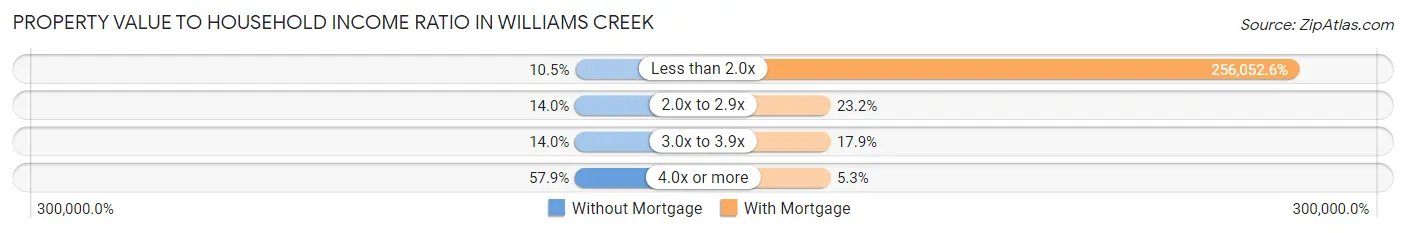
| Value-to-Income Ratio | Without Mortgage | With Mortgage |
| Less than 2.0x | 6 (10.5%) | 243,250 (256,052.6%) |
| 2.0x to 2.9x | 8 (14.0%) | 22 (23.2%) |
| 3.0x to 3.9x | 8 (14.0%) | 17 (17.9%) |
| 4.0x or more | 33 (57.9%) | 5 (5.3%) |
| Total | 57 (100.0%) | 95 (100.0%) |
Real Estate Taxes by Mortgage Status in Williams Creek
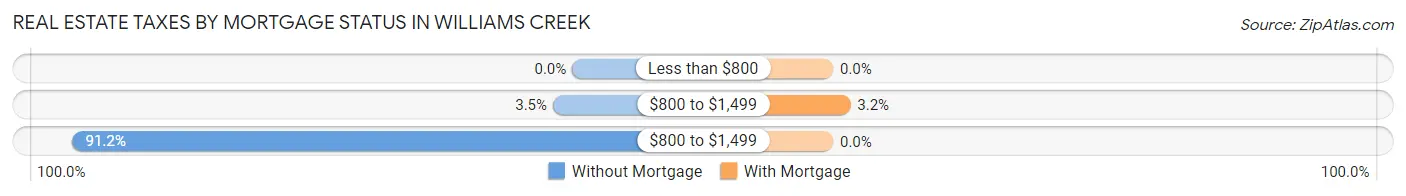
| Property Taxes | Without Mortgage | With Mortgage |
| Less than $800 | 0 (0.0%) | 0 (0.0%) |
| $800 to $1,499 | 2 (3.5%) | 3 (3.2%) |
| $800 to $1,499 | 52 (91.2%) | 0 (0.0%) |
| Total | 57 (100.0%) | 95 (100.0%) |
Health & Disability in Williams Creek
Health Insurance Coverage by Age in Williams Creek
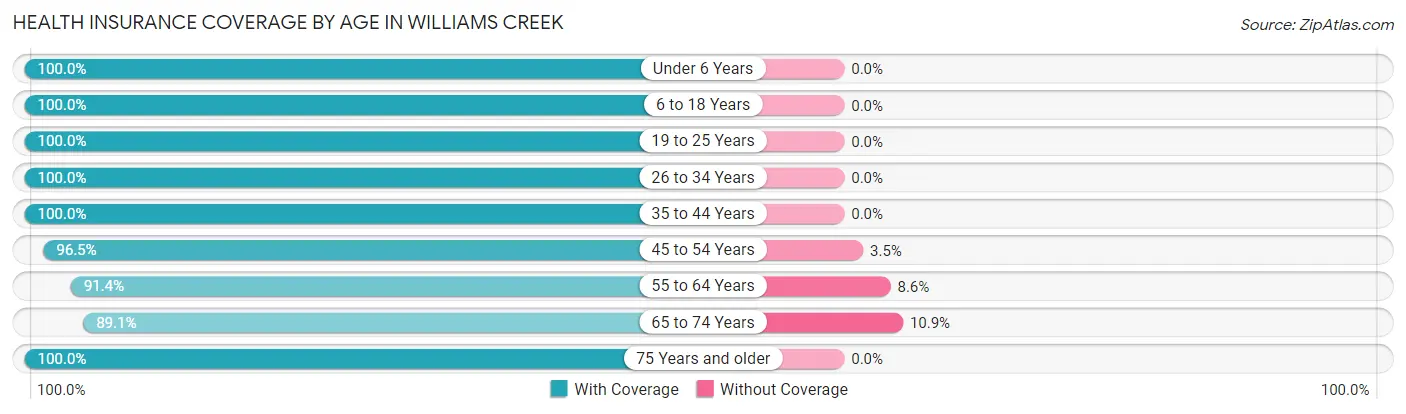
| Age Bracket | With Coverage | Without Coverage |
| Under 6 Years | 14 (100.0%) | 0 (0.0%) |
| 6 to 18 Years | 113 (100.0%) | 0 (0.0%) |
| 19 to 25 Years | 11 (100.0%) | 0 (0.0%) |
| 26 to 34 Years | 13 (100.0%) | 0 (0.0%) |
| 35 to 44 Years | 23 (100.0%) | 0 (0.0%) |
| 45 to 54 Years | 110 (96.5%) | 4 (3.5%) |
| 55 to 64 Years | 53 (91.4%) | 5 (8.6%) |
| 65 to 74 Years | 57 (89.1%) | 7 (10.9%) |
| 75 Years and older | 40 (100.0%) | 0 (0.0%) |
| Total | 434 (96.4%) | 16 (3.6%) |
Health Insurance Coverage by Citizenship Status in Williams Creek
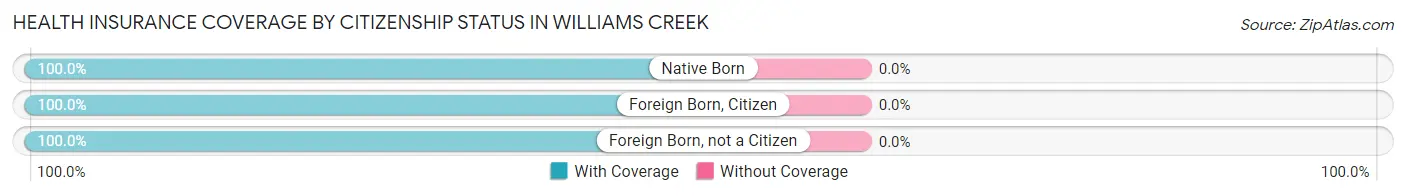
| Citizenship Status | With Coverage | Without Coverage |
| Native Born | 14 (100.0%) | 0 (0.0%) |
| Foreign Born, Citizen | 113 (100.0%) | 0 (0.0%) |
| Foreign Born, not a Citizen | 11 (100.0%) | 0 (0.0%) |
Health Insurance Coverage by Household Income in Williams Creek
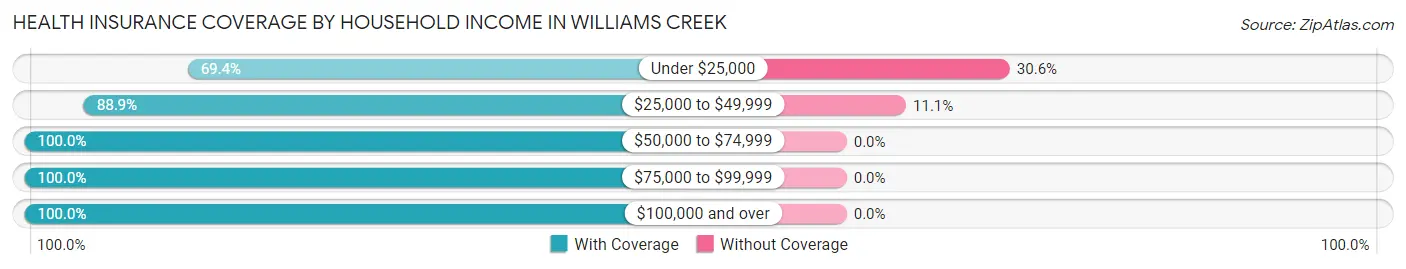
| Household Income | With Coverage | Without Coverage |
| Under $25,000 | 25 (69.4%) | 11 (30.6%) |
| $25,000 to $49,999 | 40 (88.9%) | 5 (11.1%) |
| $50,000 to $74,999 | 11 (100.0%) | 0 (0.0%) |
| $75,000 to $99,999 | 19 (100.0%) | 0 (0.0%) |
| $100,000 and over | 339 (100.0%) | 0 (0.0%) |
Public vs Private Health Insurance Coverage by Age in Williams Creek
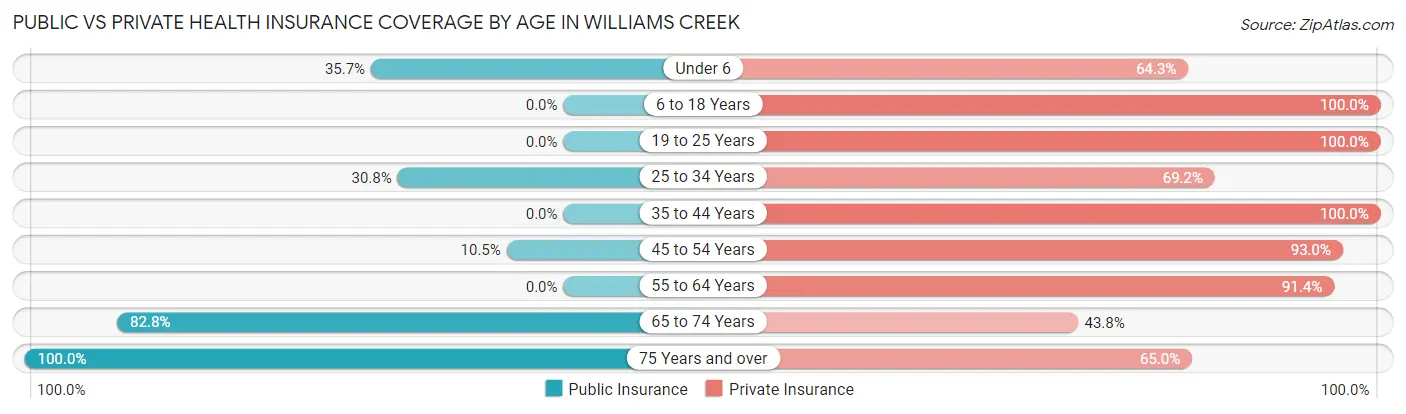
| Age Bracket | Public Insurance | Private Insurance |
| Under 6 | 5 (35.7%) | 9 (64.3%) |
| 6 to 18 Years | 0 (0.0%) | 113 (100.0%) |
| 19 to 25 Years | 0 (0.0%) | 11 (100.0%) |
| 25 to 34 Years | 4 (30.8%) | 9 (69.2%) |
| 35 to 44 Years | 0 (0.0%) | 23 (100.0%) |
| 45 to 54 Years | 12 (10.5%) | 106 (93.0%) |
| 55 to 64 Years | 0 (0.0%) | 53 (91.4%) |
| 65 to 74 Years | 53 (82.8%) | 28 (43.8%) |
| 75 Years and over | 40 (100.0%) | 26 (65.0%) |
| Total | 114 (25.3%) | 378 (84.0%) |
Disability Status by Sex by Age in Williams Creek
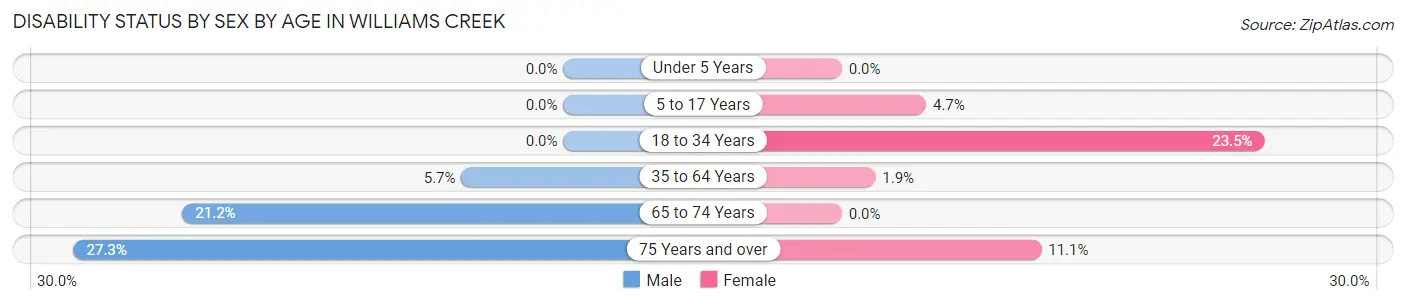
| Age Bracket | Male | Female |
| Under 5 Years | 0 (0.0%) | 0 (0.0%) |
| 5 to 17 Years | 0 (0.0%) | 3 (4.7%) |
| 18 to 34 Years | 0 (0.0%) | 4 (23.5%) |
| 35 to 64 Years | 5 (5.7%) | 2 (1.9%) |
| 65 to 74 Years | 7 (21.2%) | 0 (0.0%) |
| 75 Years and over | 6 (27.3%) | 2 (11.1%) |
Disability Class by Sex by Age in Williams Creek
Disability Class: Hearing Difficulty
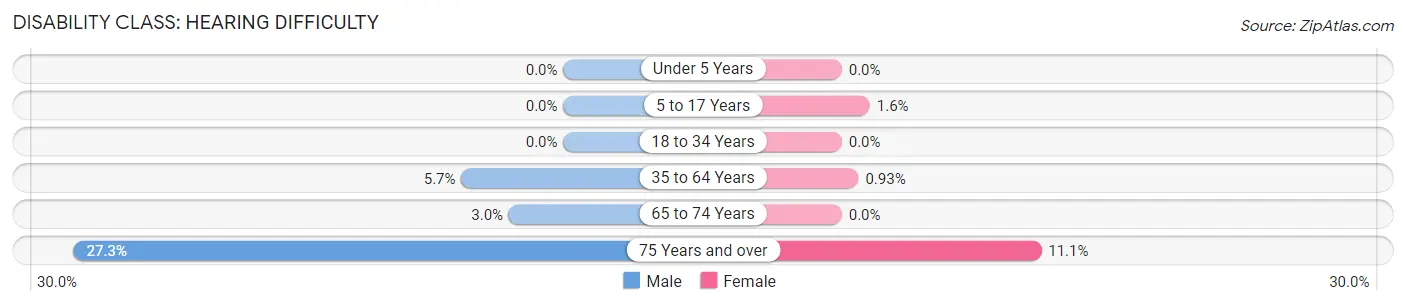
| Age Bracket | Male | Female |
| Under 5 Years | 0 (0.0%) | 0 (0.0%) |
| 5 to 17 Years | 0 (0.0%) | 1 (1.6%) |
| 18 to 34 Years | 0 (0.0%) | 0 (0.0%) |
| 35 to 64 Years | 5 (5.7%) | 1 (0.9%) |
| 65 to 74 Years | 1 (3.0%) | 0 (0.0%) |
| 75 Years and over | 6 (27.3%) | 2 (11.1%) |
Disability Class: Vision Difficulty
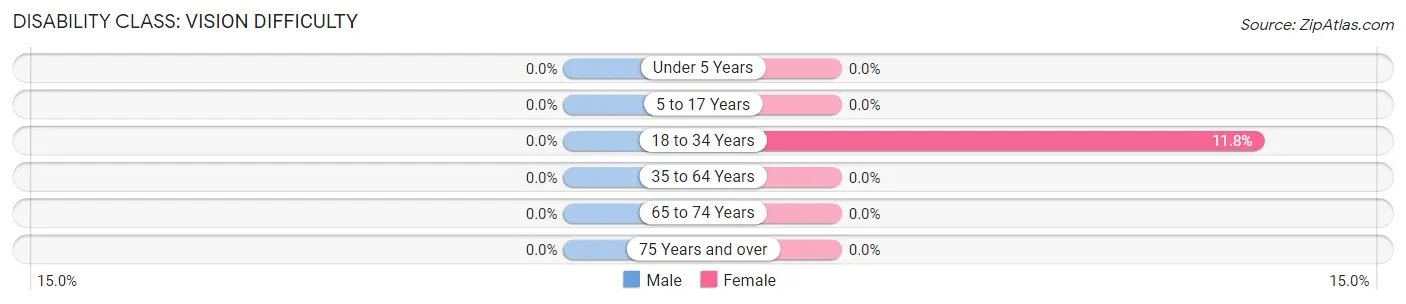
| Age Bracket | Male | Female |
| Under 5 Years | 0 (0.0%) | 0 (0.0%) |
| 5 to 17 Years | 0 (0.0%) | 0 (0.0%) |
| 18 to 34 Years | 0 (0.0%) | 2 (11.8%) |
| 35 to 64 Years | 0 (0.0%) | 0 (0.0%) |
| 65 to 74 Years | 0 (0.0%) | 0 (0.0%) |
| 75 Years and over | 0 (0.0%) | 0 (0.0%) |
Disability Class: Cognitive Difficulty
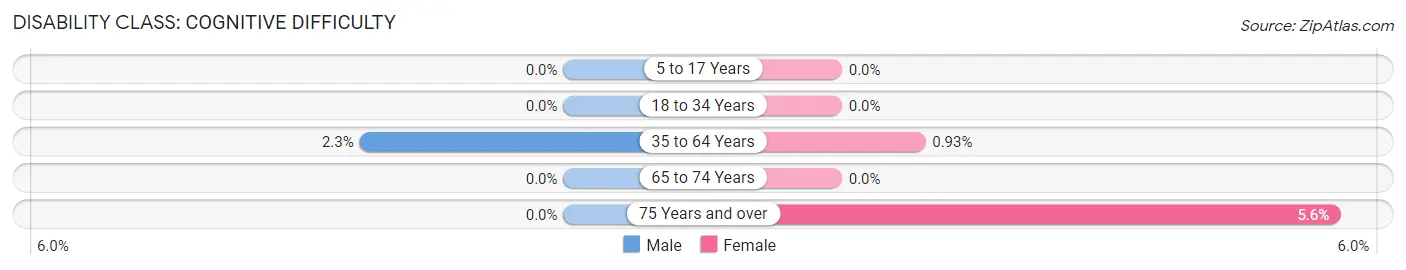
| Age Bracket | Male | Female |
| 5 to 17 Years | 0 (0.0%) | 0 (0.0%) |
| 18 to 34 Years | 0 (0.0%) | 0 (0.0%) |
| 35 to 64 Years | 2 (2.3%) | 1 (0.9%) |
| 65 to 74 Years | 0 (0.0%) | 0 (0.0%) |
| 75 Years and over | 0 (0.0%) | 1 (5.6%) |
Disability Class: Ambulatory Difficulty
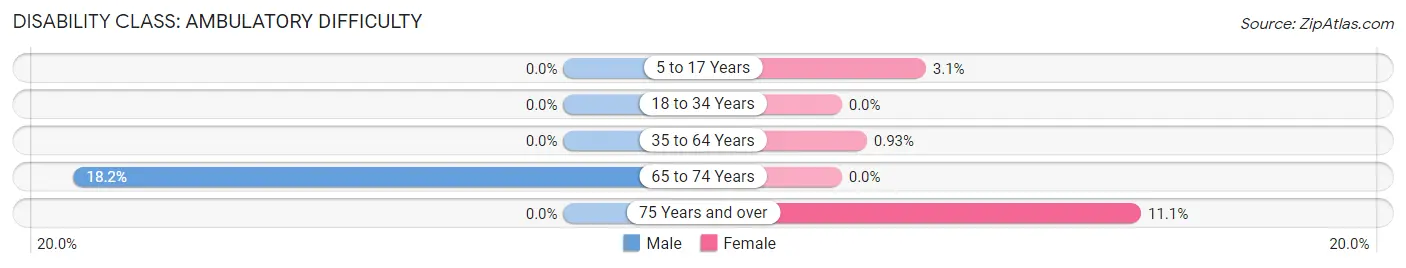
| Age Bracket | Male | Female |
| 5 to 17 Years | 0 (0.0%) | 2 (3.1%) |
| 18 to 34 Years | 0 (0.0%) | 0 (0.0%) |
| 35 to 64 Years | 0 (0.0%) | 1 (0.9%) |
| 65 to 74 Years | 6 (18.2%) | 0 (0.0%) |
| 75 Years and over | 0 (0.0%) | 2 (11.1%) |
Disability Class: Self-Care Difficulty
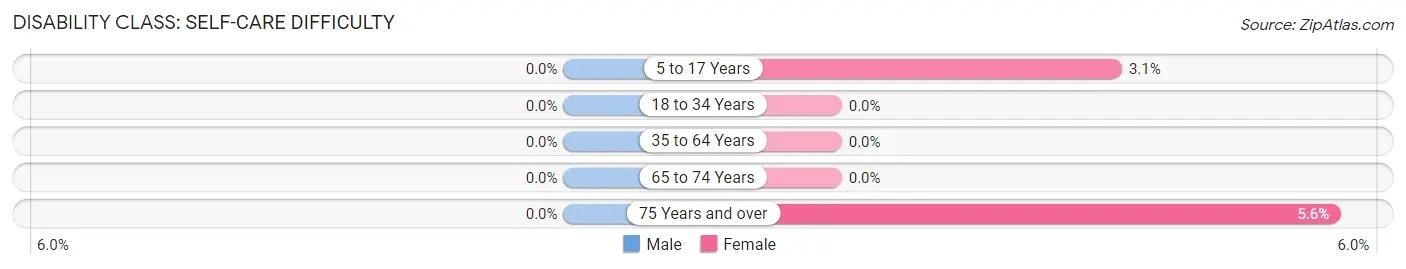
| Age Bracket | Male | Female |
| 5 to 17 Years | 0 (0.0%) | 2 (3.1%) |
| 18 to 34 Years | 0 (0.0%) | 0 (0.0%) |
| 35 to 64 Years | 0 (0.0%) | 0 (0.0%) |
| 65 to 74 Years | 0 (0.0%) | 0 (0.0%) |
| 75 Years and over | 0 (0.0%) | 1 (5.6%) |
Technology Access in Williams Creek
Computing Device Access in Williams Creek
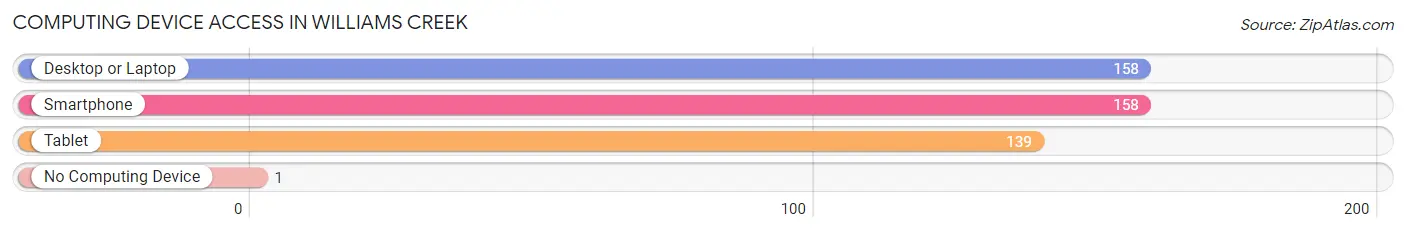
| Device Type | # Households | % Households |
| Desktop or Laptop | 158 | 96.9% |
| Smartphone | 158 | 96.9% |
| Tablet | 139 | 85.3% |
| No Computing Device | 1 | 0.6% |
| Total | 163 | 100.0% |
Internet Access in Williams Creek
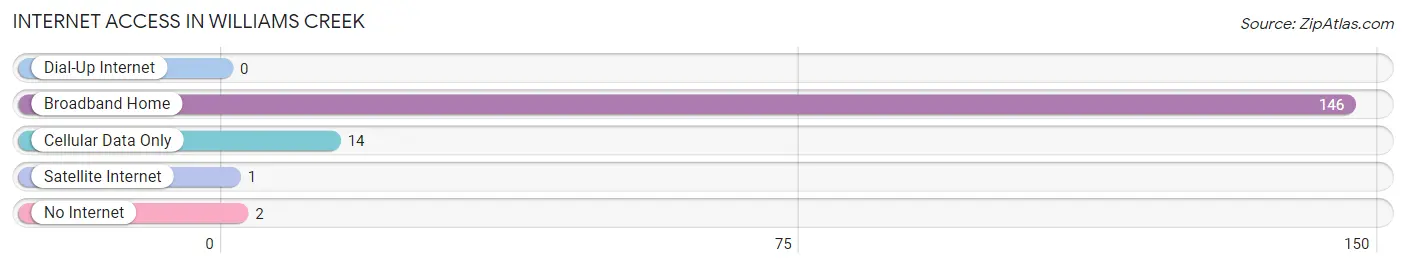
| Internet Type | # Households | % Households |
| Dial-Up Internet | 0 | 0.0% |
| Broadband Home | 146 | 89.6% |
| Cellular Data Only | 14 | 8.6% |
| Satellite Internet | 1 | 0.6% |
| No Internet | 2 | 1.2% |
| Total | 163 | 100.0% |
Williams Creek Summary
Williams Creek is a small unincorporated community located in Marion County, Indiana. It is situated in the northeast corner of the county, just south of the city of Indianapolis. The population of Williams Creek was estimated to be 1,845 in the 2010 census.
History
Williams Creek was first settled in the early 1800s by a group of settlers from North Carolina. The area was originally known as “Williamsburg”, but the name was changed to “Williams Creek” in 1837. The name was chosen to honor the creek that runs through the area.
The first post office in Williams Creek was established in 1837. The town was officially incorporated in 1851.
In the late 1800s, Williams Creek was a thriving agricultural community. The area was known for its production of corn, wheat, and other crops. The town also had several mills, including a grist mill, a saw mill, and a woolen mill.
In the early 1900s, the town began to experience a decline in population as many of its residents moved away to larger cities. The population of Williams Creek was estimated to be 1,845 in the 2010 census.
Geography
Williams Creek is located in the northeast corner of Marion County, Indiana. It is situated just south of the city of Indianapolis. The town is bordered by the White River to the east and the Fall Creek to the west.
The town has a total area of 1.2 square miles, all of which is land. The elevation of Williams Creek is 845 feet above sea level.
Economy
The economy of Williams Creek is largely based on agriculture. The town is known for its production of corn, wheat, and other crops. The town also has several mills, including a grist mill, a saw mill, and a woolen mill.
In addition to agriculture, Williams Creek is home to several small businesses, including restaurants, retail stores, and service providers. The town also has a few small manufacturing companies.
Demographics
The population of Williams Creek was estimated to be 1,845 in the 2010 census. The racial makeup of the town was 94.3% White, 2.2% African American, 0.3% Native American, 0.7% Asian, 0.1% Pacific Islander, and 2.4% from other races.
The median household income in Williams Creek was $50,938 in 2017. The median age of the town’s residents was 43.7 years. The town had a poverty rate of 8.3%.
Conclusion
Williams Creek is a small unincorporated community located in Marion County, Indiana. It is situated in the northeast corner of the county, just south of the city of Indianapolis. The population of Williams Creek was estimated to be 1,845 in the 2010 census. The town has a largely agricultural economy, with several small businesses and manufacturing companies. The median household income in Williams Creek was $50,938 in 2017. The town had a poverty rate of 8.3%.
Common Questions
What is the Total Population of Williams Creek?
Total Population of Williams Creek is 450.
What is the Total Male Population of Williams Creek?
Total Male Population of Williams Creek is 209.
What is the Total Female Population of Williams Creek?
Total Female Population of Williams Creek is 241.
What is the Ratio of Males per 100 Females in Williams Creek?
There are 86.72 Males per 100 Females in Williams Creek.
What is the Ratio of Females per 100 Males in Williams Creek?
There are 115.31 Females per 100 Males in Williams Creek.
What is the Median Population Age in Williams Creek?
Median Population Age in Williams Creek is 50.3 Years.
What is the Average Family Size in Williams Creek
Average Family Size in Williams Creek is 3.0 People.
What is the Average Household Size in Williams Creek
Average Household Size in Williams Creek is 2.8 People.
What is Per Capita Income in Williams Creek?
Per Capita income in Williams Creek is $116,744.
What is the Median Family Income in Williams Creek?
Median Family Income in Williams Creek is $240,000.
What is the Median Household income in Williams Creek?
Median Household Income in Williams Creek is $148,750.
What is Income or Wage Gap in Williams Creek?
Income or Wage Gap in Williams Creek is 52.9%.
Women in Williams Creek earn 47.1 cents for every dollar earned by a man.
What is Inequality or Gini Index in Williams Creek?
Inequality or Gini Index in Williams Creek is 0.57.
How Large is the Labor Force in Williams Creek?
There are 206 People in the Labor Forcein in Williams Creek.
What is the Percentage of People in the Labor Force in Williams Creek?
57.1% of People are in the Labor Force in Williams Creek.
What is the Unemployment Rate in Williams Creek?
Unemployment Rate in Williams Creek is 2.4%.