Mccordsville, IN
Mccordsville Map
Mccordsville Overview
9,098
TOTAL POPULATION
4,335
MALE POPULATION
4,763
FEMALE POPULATION
91.01
MALES / 100 FEMALES
109.87
FEMALES / 100 MALES
36.4
MEDIAN AGE
3.0
AVG FAMILY SIZE
2.6
AVG HOUSEHOLD SIZE
$52,530
PER CAPITA INCOME
$130,089
AVG FAMILY INCOME
$103,539
AVG HOUSEHOLD INCOME
25.5%
WAGE / INCOME GAP [ % ]
74.5¢/ $1
WAGE / INCOME GAP [ $ ]
0.38
INEQUALITY / GINI INDEX
5,089
LABOR FORCE [ PEOPLE ]
74.5%
PERCENT IN LABOR FORCE
2.7%
UNEMPLOYMENT RATE
Mccordsville Zip Codes
Mccordsville Area Codes
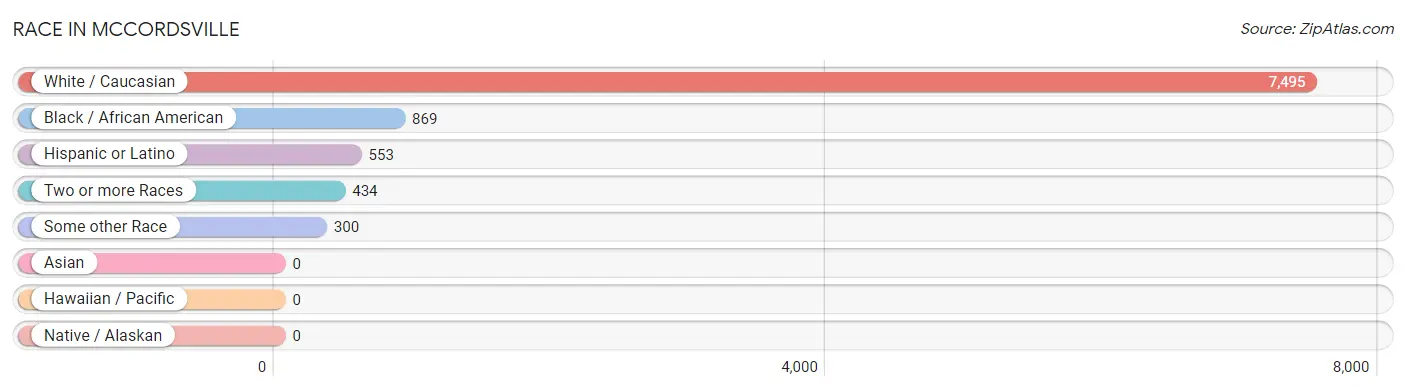
Race in Mccordsville
The most populous races in Mccordsville are White / Caucasian (7,495 | 82.4%), Black / African American (869 | 9.6%), and Hispanic or Latino (553 | 6.1%).
| Race | # Population | % Population |
| Asian | 0 | 0.0% |
| Black / African American | 869 | 9.6% |
| Hawaiian / Pacific | 0 | 0.0% |
| Hispanic or Latino | 553 | 6.1% |
| Native / Alaskan | 0 | 0.0% |
| White / Caucasian | 7,495 | 82.4% |
| Two or more Races | 434 | 4.8% |
| Some other Race | 300 | 3.3% |
| Total | 9,098 | 100.0% |
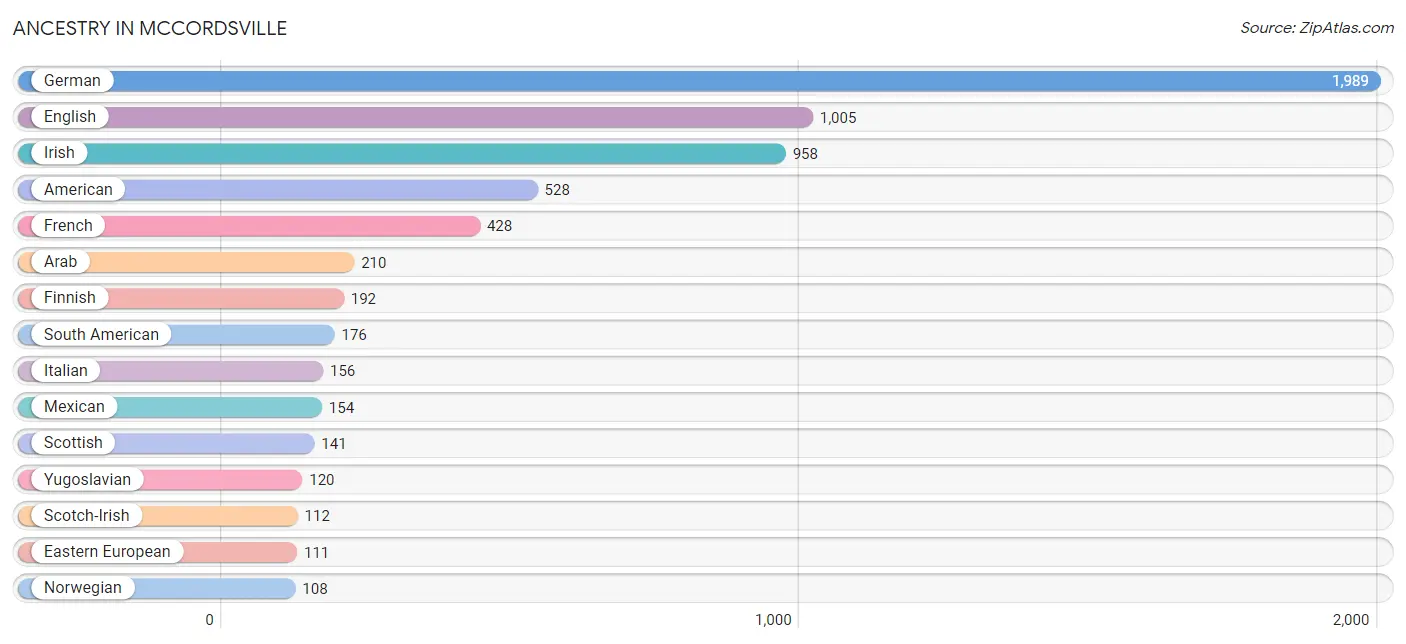
Ancestry in Mccordsville
The most populous ancestries reported in Mccordsville are German (1,989 | 21.9%), English (1,005 | 11.1%), Irish (958 | 10.5%), American (528 | 5.8%), and French (428 | 4.7%), together accounting for 53.9% of all Mccordsville residents.
| Ancestry | # Population | % Population |
| American | 528 | 5.8% |
| Apache | 20 | 0.2% |
| Arab | 210 | 2.3% |
| Canadian | 26 | 0.3% |
| Central American | 102 | 1.1% |
| Colombian | 84 | 0.9% |
| Czech | 33 | 0.4% |
| Danish | 49 | 0.5% |
| Dutch | 53 | 0.6% |
| Eastern European | 111 | 1.2% |
| English | 1,005 | 11.1% |
| European | 57 | 0.6% |
| Finnish | 192 | 2.1% |
| French | 428 | 4.7% |
| German | 1,989 | 21.9% |
| Ghanaian | 26 | 0.3% |
| Guatemalan | 102 | 1.1% |
| Hungarian | 85 | 0.9% |
| Irish | 958 | 10.5% |
| Italian | 156 | 1.7% |
| Luxembourger | 10 | 0.1% |
| Mexican | 154 | 1.7% |
| Northern European | 102 | 1.1% |
| Norwegian | 108 | 1.2% |
| Pennsylvania German | 22 | 0.2% |
| Peruvian | 35 | 0.4% |
| Polish | 52 | 0.6% |
| Puerto Rican | 7 | 0.1% |
| Scotch-Irish | 112 | 1.2% |
| Scottish | 141 | 1.5% |
| Serbian | 20 | 0.2% |
| Slovene | 45 | 0.5% |
| South American | 176 | 1.9% |
| Subsaharan African | 26 | 0.3% |
| Swedish | 13 | 0.1% |
| Swiss | 88 | 1.0% |
| Turkish | 27 | 0.3% |
| Venezuelan | 57 | 0.6% |
| Yugoslavian | 120 | 1.3% | View All 39 Rows |
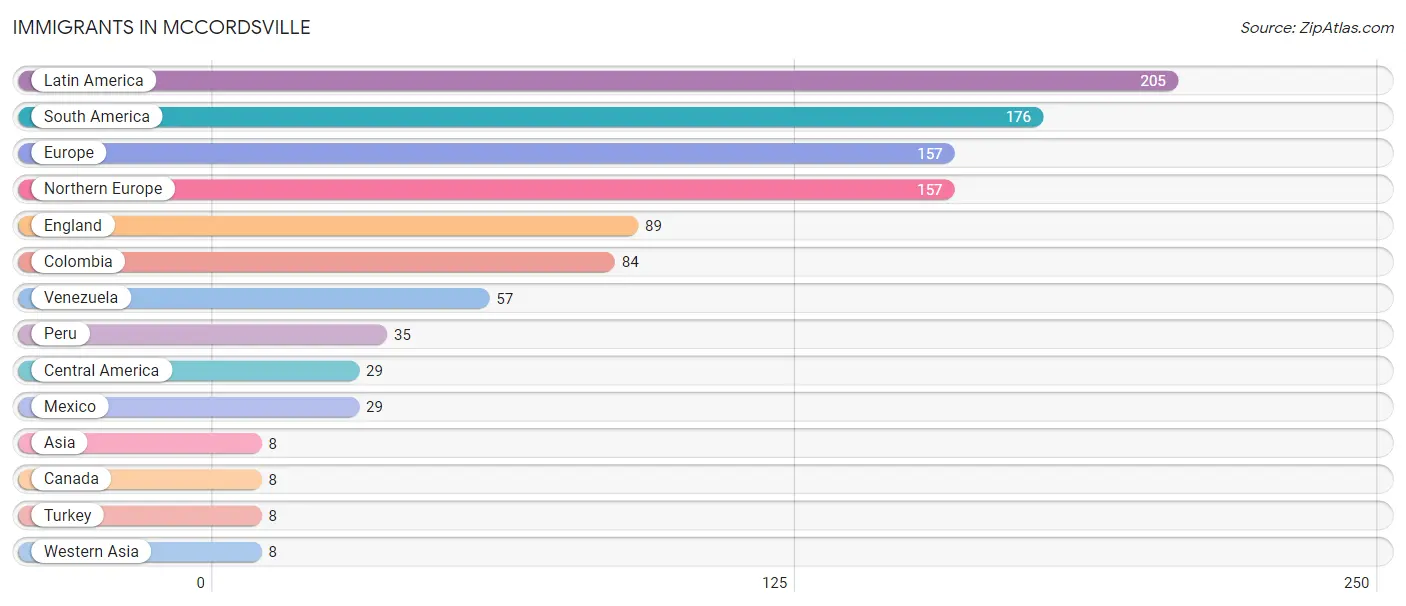
Immigrants in Mccordsville
The most numerous immigrant groups reported in Mccordsville came from Latin America (205 | 2.2%), South America (176 | 1.9%), Europe (157 | 1.7%), Northern Europe (157 | 1.7%), and England (89 | 1.0%), together accounting for 8.6% of all Mccordsville residents.
| Immigration Origin | # Population | % Population |
| Asia | 8 | 0.1% |
| Canada | 8 | 0.1% |
| Central America | 29 | 0.3% |
| Colombia | 84 | 0.9% |
| England | 89 | 1.0% |
| Europe | 157 | 1.7% |
| Latin America | 205 | 2.2% |
| Mexico | 29 | 0.3% |
| Northern Europe | 157 | 1.7% |
| Peru | 35 | 0.4% |
| South America | 176 | 1.9% |
| Turkey | 8 | 0.1% |
| Venezuela | 57 | 0.6% |
| Western Asia | 8 | 0.1% | View All 14 Rows |
Sex and Age in Mccordsville
Sex and Age in Mccordsville
The most populous age groups in Mccordsville are 35 to 39 Years (476 | 11.0%) for men and 5 to 9 Years (534 | 11.2%) for women.
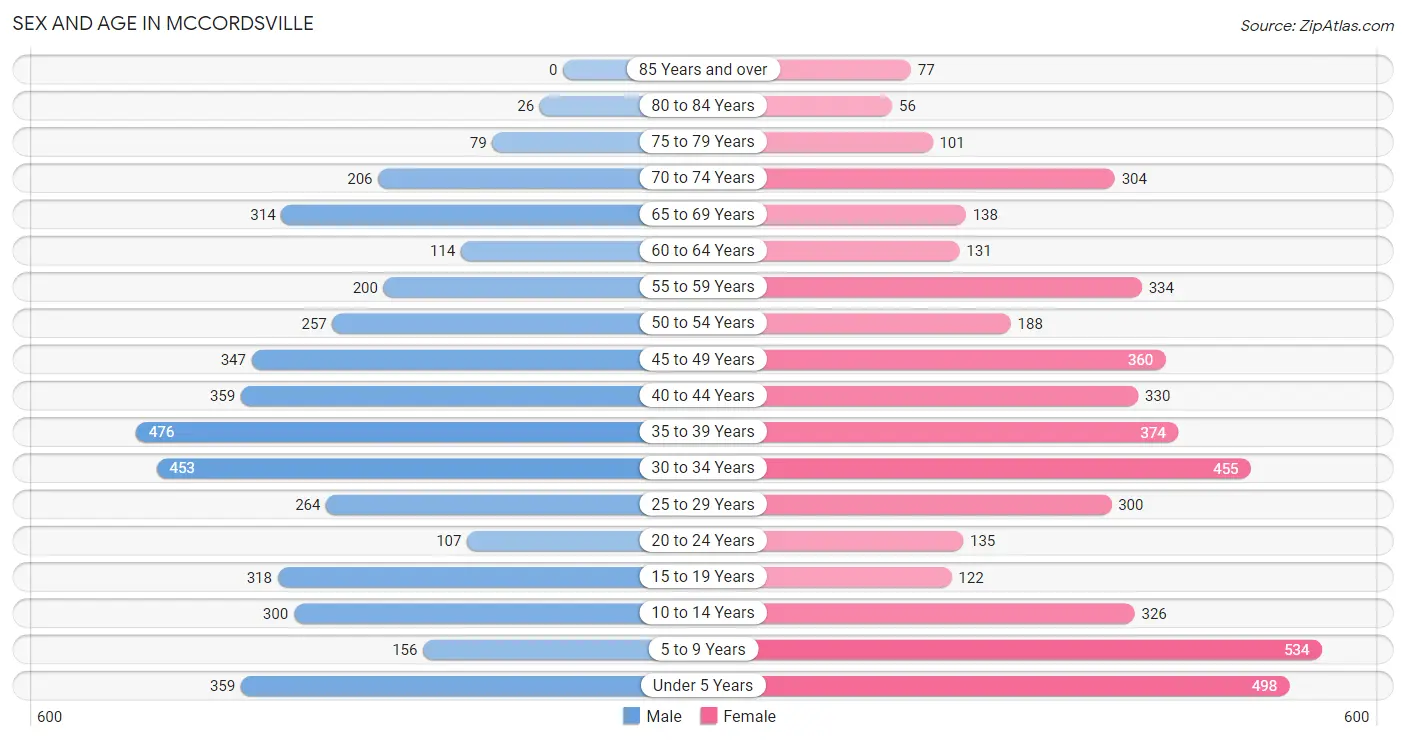
| Age Bracket | Male | Female |
| Under 5 Years | 359 (8.3%) | 498 (10.5%) |
| 5 to 9 Years | 156 (3.6%) | 534 (11.2%) |
| 10 to 14 Years | 300 (6.9%) | 326 (6.8%) |
| 15 to 19 Years | 318 (7.3%) | 122 (2.6%) |
| 20 to 24 Years | 107 (2.5%) | 135 (2.8%) |
| 25 to 29 Years | 264 (6.1%) | 300 (6.3%) |
| 30 to 34 Years | 453 (10.4%) | 455 (9.6%) |
| 35 to 39 Years | 476 (11.0%) | 374 (7.9%) |
| 40 to 44 Years | 359 (8.3%) | 330 (6.9%) |
| 45 to 49 Years | 347 (8.0%) | 360 (7.6%) |
| 50 to 54 Years | 257 (5.9%) | 188 (4.0%) |
| 55 to 59 Years | 200 (4.6%) | 334 (7.0%) |
| 60 to 64 Years | 114 (2.6%) | 131 (2.8%) |
| 65 to 69 Years | 314 (7.2%) | 138 (2.9%) |
| 70 to 74 Years | 206 (4.8%) | 304 (6.4%) |
| 75 to 79 Years | 79 (1.8%) | 101 (2.1%) |
| 80 to 84 Years | 26 (0.6%) | 56 (1.2%) |
| 85 Years and over | 0 (0.0%) | 77 (1.6%) |
| Total | 4,335 (100.0%) | 4,763 (100.0%) |
Families and Households in Mccordsville
Median Family Size in Mccordsville
The median family size in Mccordsville is 2.98 persons per family, with single female/mother families (177 | 6.6%) accounting for the largest median family size of 3.36 persons per family. On the other hand, single male/father families (94 | 3.5%) represent the smallest median family size with 2.55 persons per family.
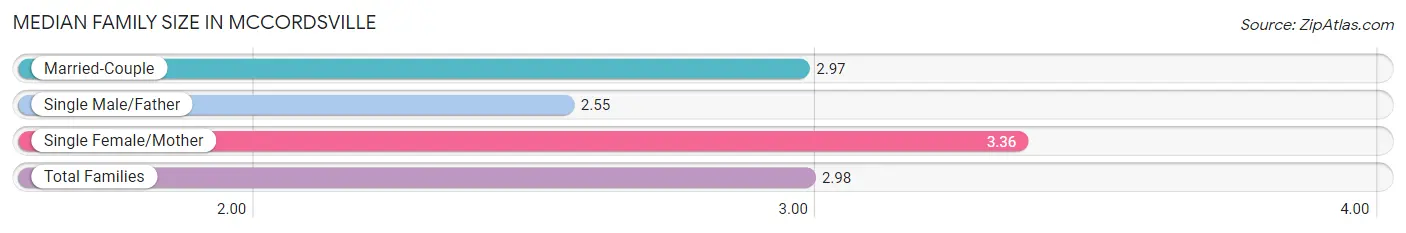
| Family Type | # Families | Family Size |
| Married-Couple | 2,426 (89.9%) | 2.97 |
| Single Male/Father | 94 (3.5%) | 2.55 |
| Single Female/Mother | 177 (6.6%) | 3.36 |
| Total Families | 2,697 (100.0%) | 2.98 |
Median Household Size in Mccordsville
The median household size in Mccordsville is 2.59 persons per household, with single female/mother households (177 | 5.0%) accounting for the largest median household size of 3.64 persons per household. non-family households (821 | 23.3%) represent the smallest median household size with 1.11 persons per household.
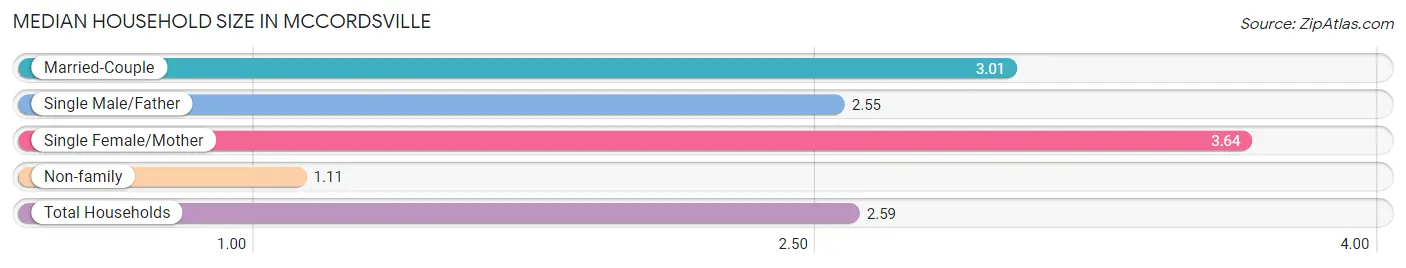
| Household Type | # Households | Household Size |
| Married-Couple | 2,426 (69.0%) | 3.01 |
| Single Male/Father | 94 (2.7%) | 2.55 |
| Single Female/Mother | 177 (5.0%) | 3.64 |
| Non-family | 821 (23.3%) | 1.11 |
| Total Households | 3,518 (100.0%) | 2.59 |
Household Size by Marriage Status in Mccordsville
Out of a total of 3,518 households in Mccordsville, 2,697 (76.7%) are family households, while 821 (23.3%) are nonfamily households. The most numerous type of family households are 2-person households, comprising 1,214, and the most common type of nonfamily households are 1-person households, comprising 732.
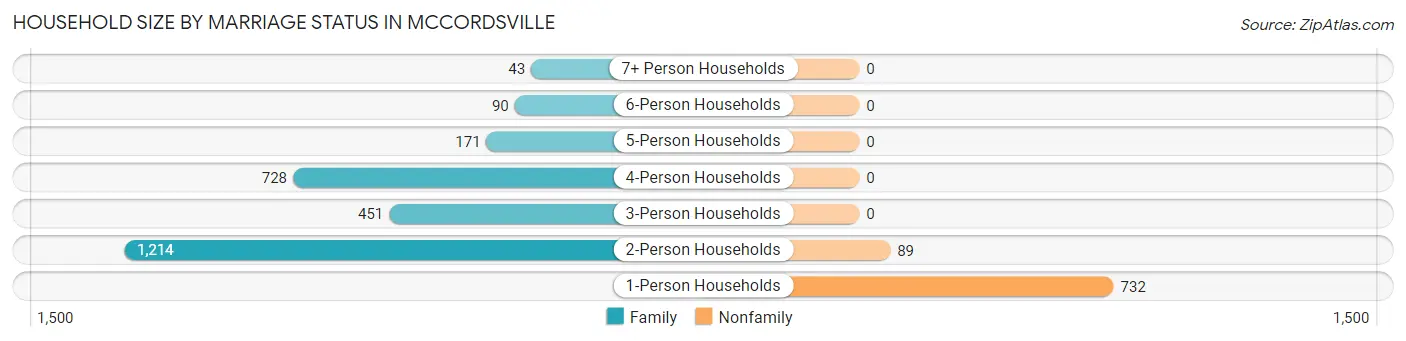
| Household Size | Family Households | Nonfamily Households |
| 1-Person Households | - | 732 (20.8%) |
| 2-Person Households | 1,214 (34.5%) | 89 (2.5%) |
| 3-Person Households | 451 (12.8%) | 0 (0.0%) |
| 4-Person Households | 728 (20.7%) | 0 (0.0%) |
| 5-Person Households | 171 (4.9%) | 0 (0.0%) |
| 6-Person Households | 90 (2.6%) | 0 (0.0%) |
| 7+ Person Households | 43 (1.2%) | 0 (0.0%) |
| Total | 2,697 (76.7%) | 821 (23.3%) |
Female Fertility in Mccordsville
Fertility by Age in Mccordsville
Average fertility rate in Mccordsville is 78.0 births per 1,000 women. Women in the age bracket of 20 to 34 years have the highest fertility rate with 190.0 births per 1,000 women. Women in the age bracket of 20 to 34 years acount for 100.0% of all women with births.
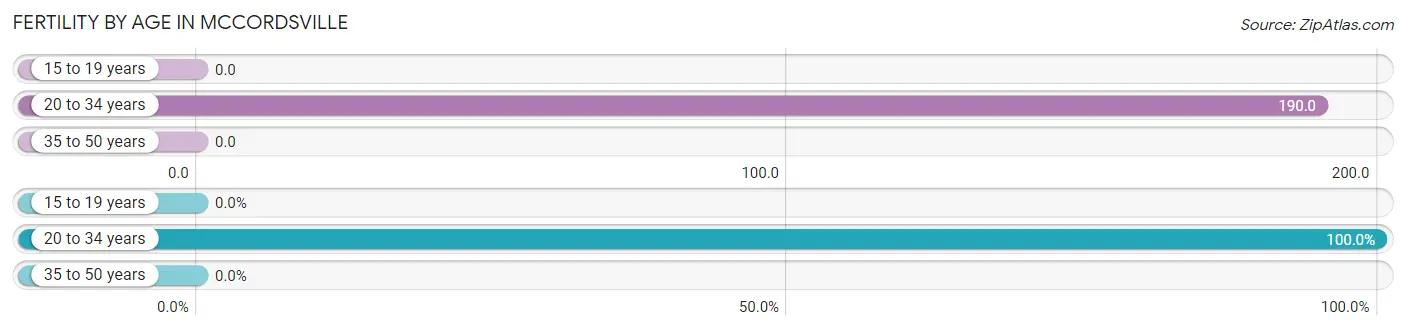
| Age Bracket | Women with Births | Births / 1,000 Women |
| 15 to 19 years | 0 (0.0%) | 0.0 |
| 20 to 34 years | 169 (100.0%) | 190.0 |
| 35 to 50 years | 0 (0.0%) | 0.0 |
| Total | 169 (100.0%) | 78.0 |
Fertility by Age by Marriage Status in Mccordsville
90.5% of women with births (169) in Mccordsville are married. The highest percentage of unmarried women with births falls into 20 to 34 years age bracket with 9.5% of them unmarried at the time of birth, while the lowest percentage of unmarried women with births belong to 20 to 34 years age bracket with 9.5% of them unmarried.
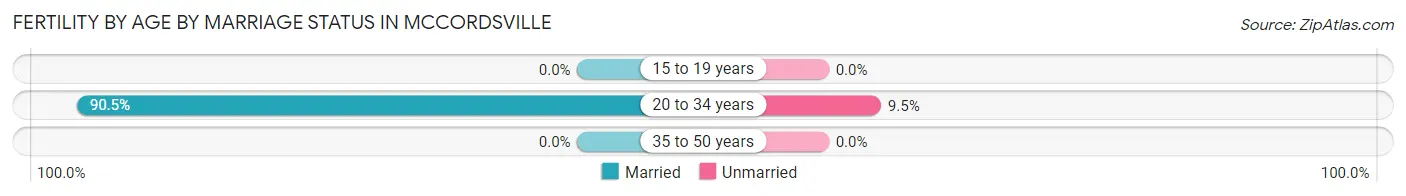
| Age Bracket | Married | Unmarried |
| 15 to 19 years | 0 (0.0%) | 0 (0.0%) |
| 20 to 34 years | 153 (90.5%) | 16 (9.5%) |
| 35 to 50 years | 0 (0.0%) | 0 (0.0%) |
| Total | 153 (90.5%) | 16 (9.5%) |
Fertility by Education in Mccordsville
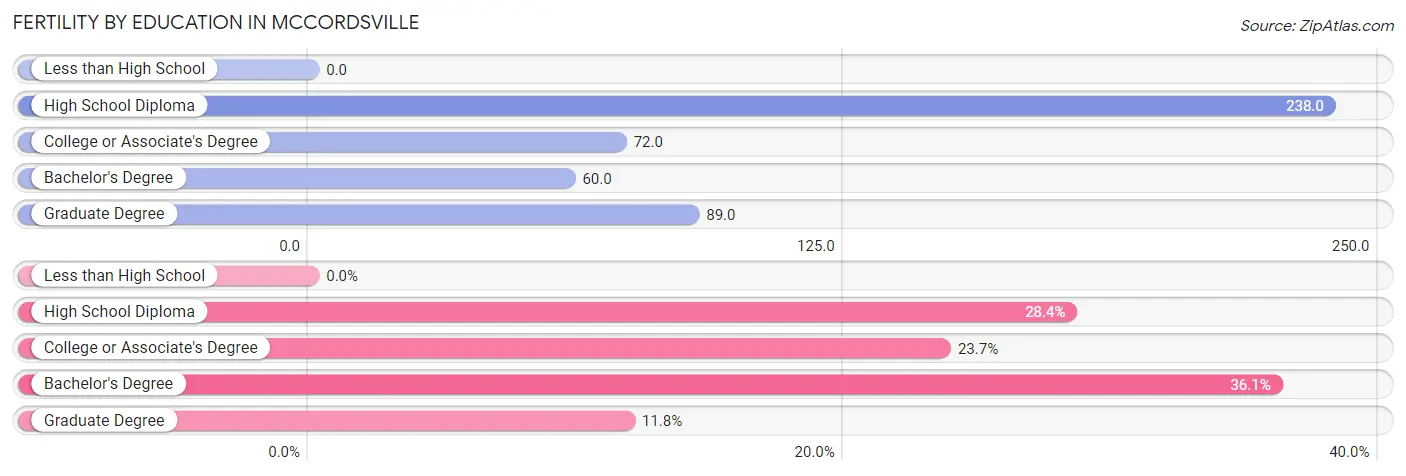
| Educational Attainment | Women with Births | Births / 1,000 Women |
| Less than High School | 0 (0.0%) | 0.0 |
| High School Diploma | 48 (28.4%) | 238.0 |
| College or Associate's Degree | 40 (23.7%) | 72.0 |
| Bachelor's Degree | 61 (36.1%) | 60.0 |
| Graduate Degree | 20 (11.8%) | 89.0 |
| Total | 169 (100.0%) | 78.0 |
Fertility by Education by Marriage Status in Mccordsville
9.5% of women with births in Mccordsville are unmarried. Women with the educational attainment of college or associate's degree are most likely to be married with 100.0% of them married at childbirth, while women with the educational attainment of high school diploma are least likely to be married with 33.3% of them unmarried at childbirth.
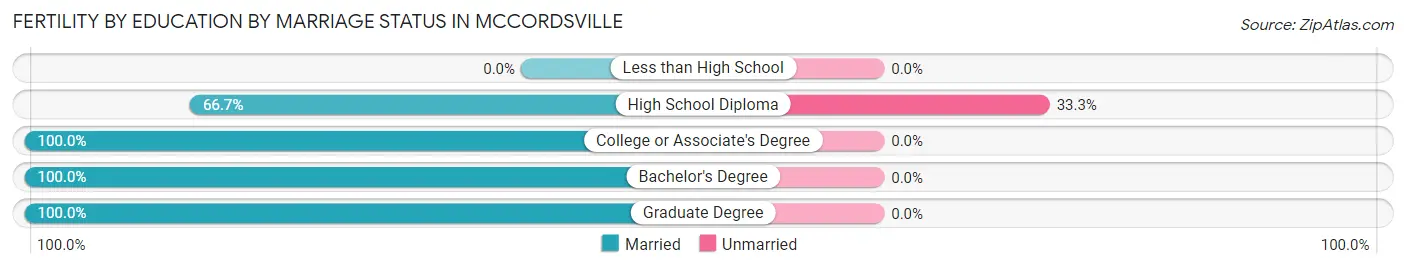
| Educational Attainment | Married | Unmarried |
| Less than High School | 0 (0.0%) | 0 (0.0%) |
| High School Diploma | 32 (66.7%) | 16 (33.3%) |
| College or Associate's Degree | 40 (100.0%) | 0 (0.0%) |
| Bachelor's Degree | 61 (100.0%) | 0 (0.0%) |
| Graduate Degree | 20 (100.0%) | 0 (0.0%) |
| Total | 153 (90.5%) | 16 (9.5%) |
Income in Mccordsville
Income Overview in Mccordsville
Per Capita Income in Mccordsville is $52,530, while median incomes of families and households are $130,089 and $103,539 respectively.
| Characteristic | Number | Measure |
| Per Capita Income | 9,098 | $52,530 |
| Median Family Income | 2,697 | $130,089 |
| Mean Family Income | 2,697 | $159,281 |
| Median Household Income | 3,518 | $103,539 |
| Mean Household Income | 3,518 | $137,356 |
| Income Deficit | 2,697 | $0 |
| Wage / Income Gap (%) | 9,098 | 25.45% |
| Wage / Income Gap ($) | 9,098 | 74.55¢ per $1 |
| Gini / Inequality Index | 9,098 | 0.38 |
Earnings by Sex in Mccordsville
Average Earnings in Mccordsville are $60,593, $74,619 for men and $55,625 for women, a difference of 25.5%.
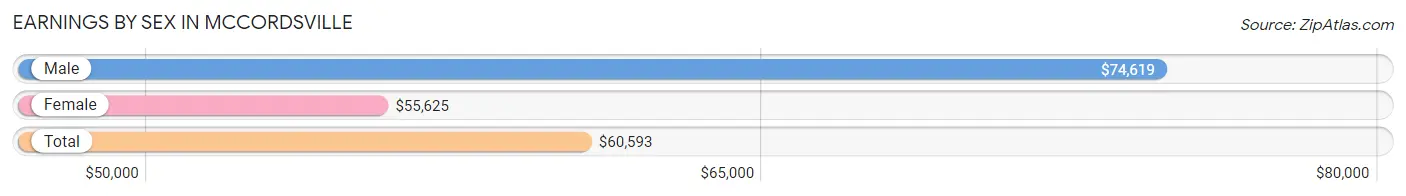
| Sex | Number | Average Earnings |
| Male | 2,855 (53.7%) | $74,619 |
| Female | 2,458 (46.3%) | $55,625 |
| Total | 5,313 (100.0%) | $60,593 |
Earnings by Sex by Income Bracket in Mccordsville
The most common earnings brackets in Mccordsville are $100,000+ for men (981 | 34.4%) and $75,000 to $99,999 for women (375 | 15.3%).
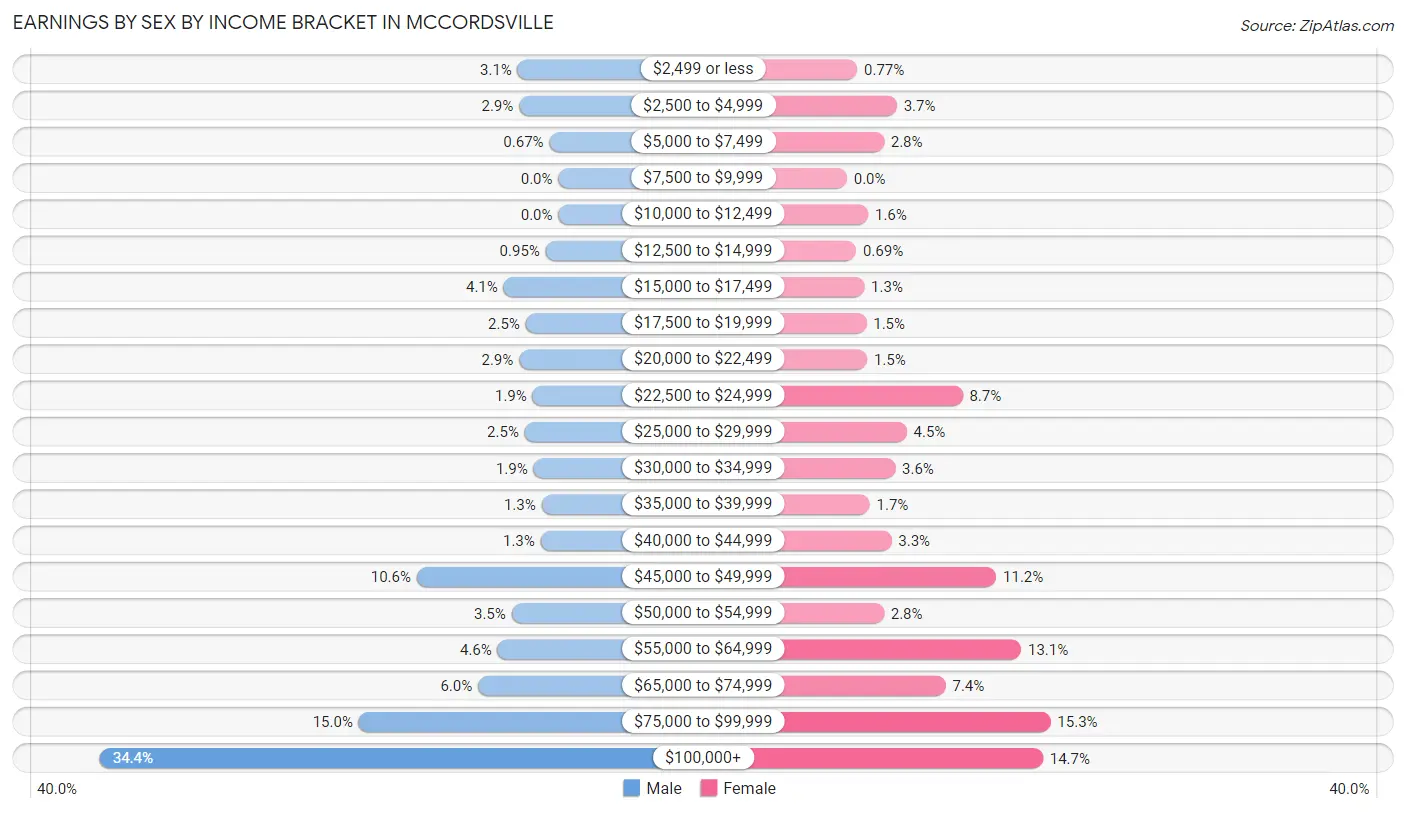
| Income | Male | Female |
| $2,499 or less | 87 (3.0%) | 19 (0.8%) |
| $2,500 to $4,999 | 84 (2.9%) | 92 (3.7%) |
| $5,000 to $7,499 | 19 (0.7%) | 68 (2.8%) |
| $7,500 to $9,999 | 0 (0.0%) | 0 (0.0%) |
| $10,000 to $12,499 | 0 (0.0%) | 39 (1.6%) |
| $12,500 to $14,999 | 27 (0.9%) | 17 (0.7%) |
| $15,000 to $17,499 | 117 (4.1%) | 32 (1.3%) |
| $17,500 to $19,999 | 70 (2.5%) | 36 (1.5%) |
| $20,000 to $22,499 | 84 (2.9%) | 37 (1.5%) |
| $22,500 to $24,999 | 55 (1.9%) | 213 (8.7%) |
| $25,000 to $29,999 | 72 (2.5%) | 110 (4.5%) |
| $30,000 to $34,999 | 53 (1.9%) | 89 (3.6%) |
| $35,000 to $39,999 | 36 (1.3%) | 42 (1.7%) |
| $40,000 to $44,999 | 38 (1.3%) | 82 (3.3%) |
| $45,000 to $49,999 | 303 (10.6%) | 275 (11.2%) |
| $50,000 to $54,999 | 100 (3.5%) | 68 (2.8%) |
| $55,000 to $64,999 | 130 (4.5%) | 321 (13.1%) |
| $65,000 to $74,999 | 172 (6.0%) | 182 (7.4%) |
| $75,000 to $99,999 | 427 (15.0%) | 375 (15.3%) |
| $100,000+ | 981 (34.4%) | 361 (14.7%) |
| Total | 2,855 (100.0%) | 2,458 (100.0%) |
Earnings by Sex by Educational Attainment in Mccordsville
Average earnings in Mccordsville are $82,909 for men and $58,297 for women, a difference of 29.7%. Men with an educational attainment of bachelor's degree enjoy the highest average annual earnings of $89,612, while those with high school diploma education earn the least with $52,581. Women with an educational attainment of graduate degree earn the most with the average annual earnings of $78,053, while those with college or associate's degree education have the smallest earnings of $51,250.
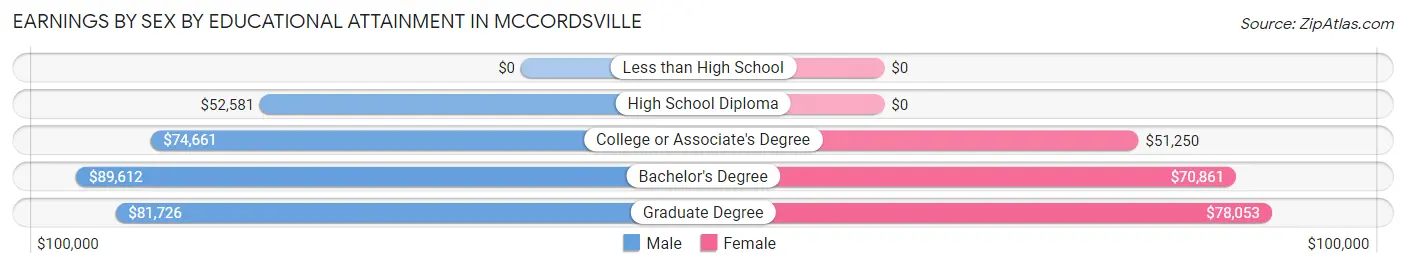
| Educational Attainment | Male Income | Female Income |
| Less than High School | - | - |
| High School Diploma | $52,581 | $0 |
| College or Associate's Degree | $74,661 | $51,250 |
| Bachelor's Degree | $89,612 | $70,861 |
| Graduate Degree | $81,726 | $78,053 |
| Total | $82,909 | $58,297 |
Family Income in Mccordsville
Family Income Brackets in Mccordsville
According to the Mccordsville family income data, there are 933 families falling into the $100,000 to $149,999 income range, which is the most common income bracket and makes up 34.6% of all families.
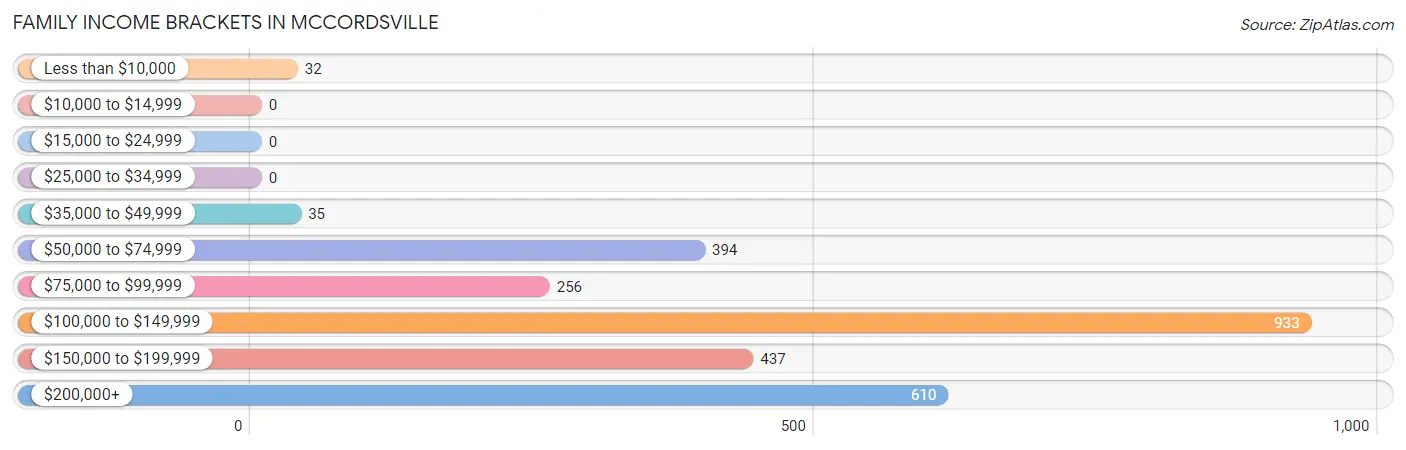
| Income Bracket | # Families | % Families |
| Less than $10,000 | 32 | 1.2% |
| $10,000 to $14,999 | 0 | 0.0% |
| $15,000 to $24,999 | 0 | 0.0% |
| $25,000 to $34,999 | 0 | 0.0% |
| $35,000 to $49,999 | 35 | 1.3% |
| $50,000 to $74,999 | 394 | 14.6% |
| $75,000 to $99,999 | 256 | 9.5% |
| $100,000 to $149,999 | 933 | 34.6% |
| $150,000 to $199,999 | 437 | 16.2% |
| $200,000+ | 610 | 22.6% |
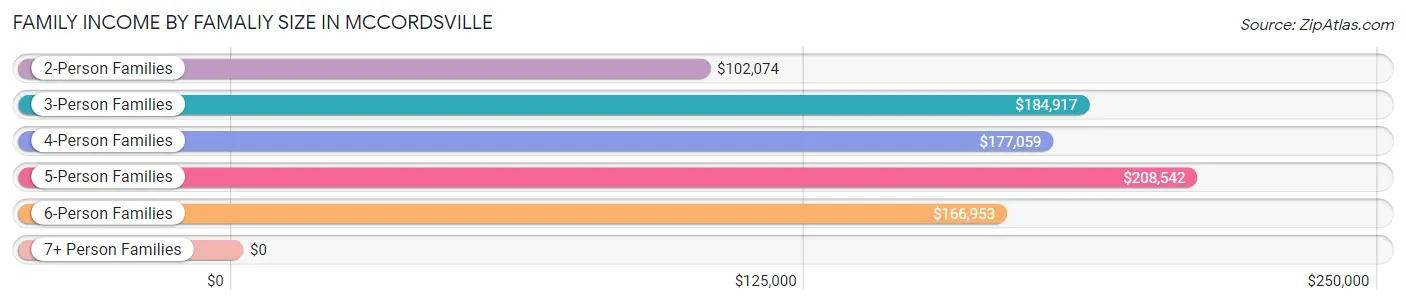
Family Income by Famaliy Size in Mccordsville
5-person families (175 | 6.5%) account for the highest median family income in Mccordsville with $208,542 per family, while 3-person families (434 | 16.1%) have the highest median income of $61,639 per family member.
| Income Bracket | # Families | Median Income |
| 2-Person Families | 1,250 (46.4%) | $102,074 |
| 3-Person Families | 434 (16.1%) | $184,917 |
| 4-Person Families | 744 (27.6%) | $177,059 |
| 5-Person Families | 175 (6.5%) | $208,542 |
| 6-Person Families | 51 (1.9%) | $166,953 |
| 7+ Person Families | 43 (1.6%) | $0 |
| Total | 2,697 (100.0%) | $130,089 |
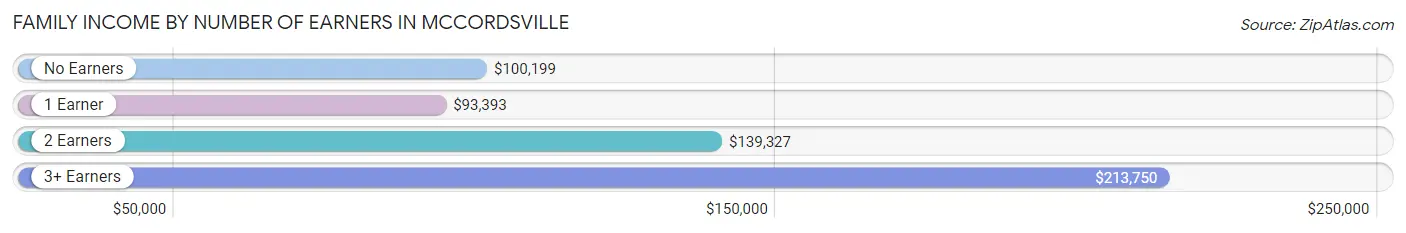
Family Income by Number of Earners in Mccordsville
The median family income in Mccordsville is $130,089, with families comprising 3+ earners (277) having the highest median family income of $213,750, while families with 1 earner (573) have the lowest median family income of $93,393, accounting for 10.3% and 21.2% of families, respectively.
| Number of Earners | # Families | Median Income |
| No Earners | 184 (6.8%) | $100,199 |
| 1 Earner | 573 (21.2%) | $93,393 |
| 2 Earners | 1,663 (61.7%) | $139,327 |
| 3+ Earners | 277 (10.3%) | $213,750 |
| Total | 2,697 (100.0%) | $130,089 |
Household Income in Mccordsville
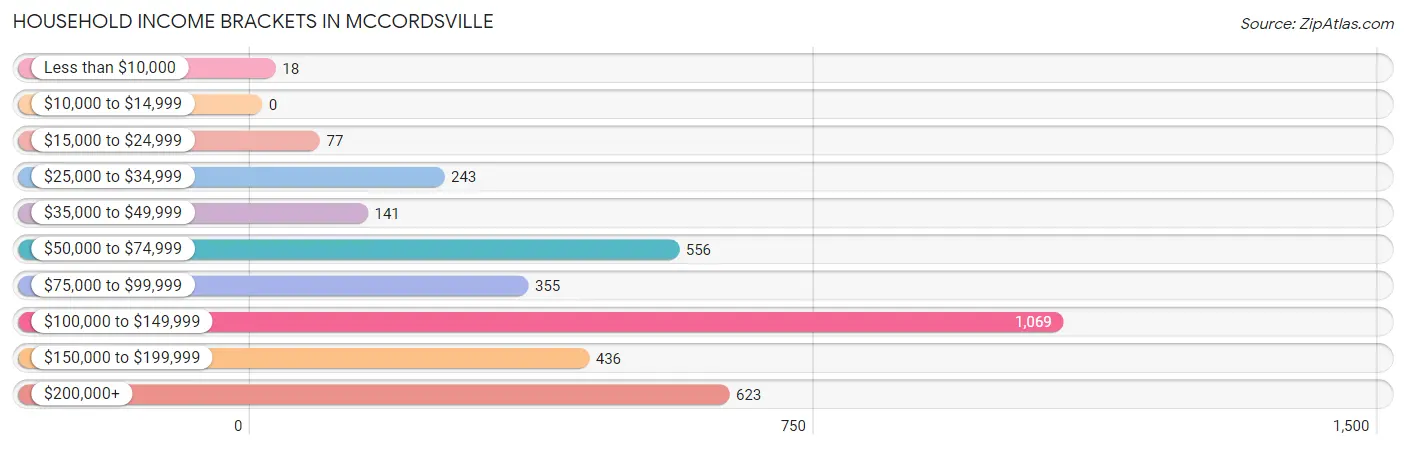
Household Income Brackets in Mccordsville
With 1,069 households falling in the category, the $100,000 to $149,999 income range is the most frequent in Mccordsville, accounting for 30.4% of all households.
| Income Bracket | # Households | % Households |
| Less than $10,000 | 18 | 0.5% |
| $10,000 to $14,999 | 0 | 0.0% |
| $15,000 to $24,999 | 77 | 2.2% |
| $25,000 to $34,999 | 243 | 6.9% |
| $35,000 to $49,999 | 141 | 4.0% |
| $50,000 to $74,999 | 556 | 15.8% |
| $75,000 to $99,999 | 355 | 10.1% |
| $100,000 to $149,999 | 1,069 | 30.4% |
| $150,000 to $199,999 | 436 | 12.4% |
| $200,000+ | 623 | 17.7% |
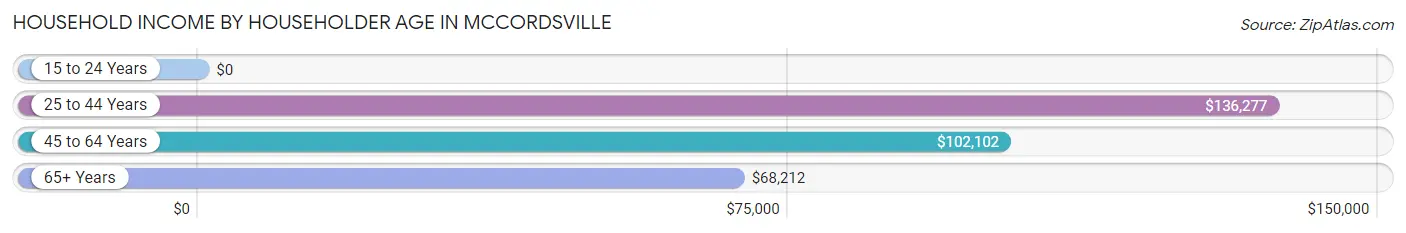
Household Income by Householder Age in Mccordsville
The median household income in Mccordsville is $103,539, with the highest median household income of $136,277 found in the 25 to 44 years age bracket for the primary householder. A total of 1,618 households (46.0%) fall into this category.
| Income Bracket | # Households | Median Income |
| 15 to 24 Years | 0 (0.0%) | $0 |
| 25 to 44 Years | 1,618 (46.0%) | $136,277 |
| 45 to 64 Years | 980 (27.9%) | $102,102 |
| 65+ Years | 920 (26.2%) | $68,212 |
| Total | 3,518 (100.0%) | $103,539 |
Poverty in Mccordsville
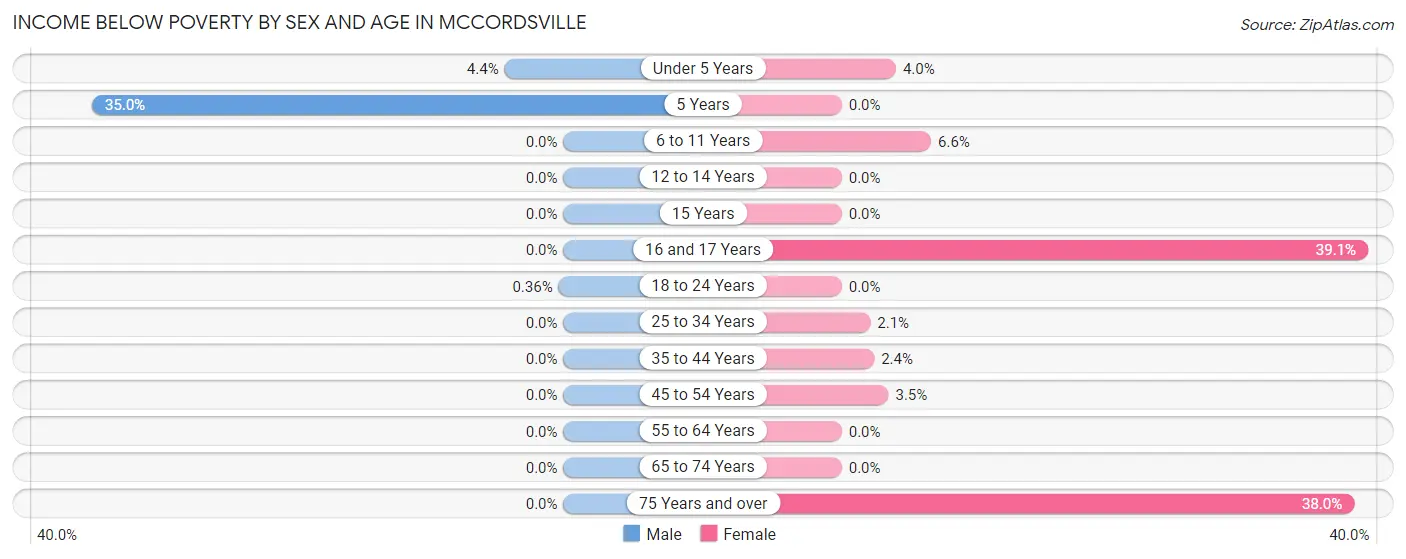
Income Below Poverty by Sex and Age in Mccordsville
With 0.7% poverty level for males and 4.8% for females among the residents of Mccordsville, 5 year old males and 16 and 17 year old females are the most vulnerable to poverty, with 14 males (35.0%) and 25 females (39.1%) in their respective age groups living below the poverty level.
| Age Bracket | Male | Female |
| Under 5 Years | 15 (4.4%) | 20 (4.0%) |
| 5 Years | 14 (35.0%) | 0 (0.0%) |
| 6 to 11 Years | 0 (0.0%) | 40 (6.6%) |
| 12 to 14 Years | 0 (0.0%) | 0 (0.0%) |
| 15 Years | 0 (0.0%) | 0 (0.0%) |
| 16 and 17 Years | 0 (0.0%) | 25 (39.1%) |
| 18 to 24 Years | 1 (0.4%) | 0 (0.0%) |
| 25 to 34 Years | 0 (0.0%) | 16 (2.1%) |
| 35 to 44 Years | 0 (0.0%) | 17 (2.4%) |
| 45 to 54 Years | 0 (0.0%) | 19 (3.5%) |
| 55 to 64 Years | 0 (0.0%) | 0 (0.0%) |
| 65 to 74 Years | 0 (0.0%) | 0 (0.0%) |
| 75 Years and over | 0 (0.0%) | 89 (38.0%) |
| Total | 30 (0.7%) | 226 (4.8%) |
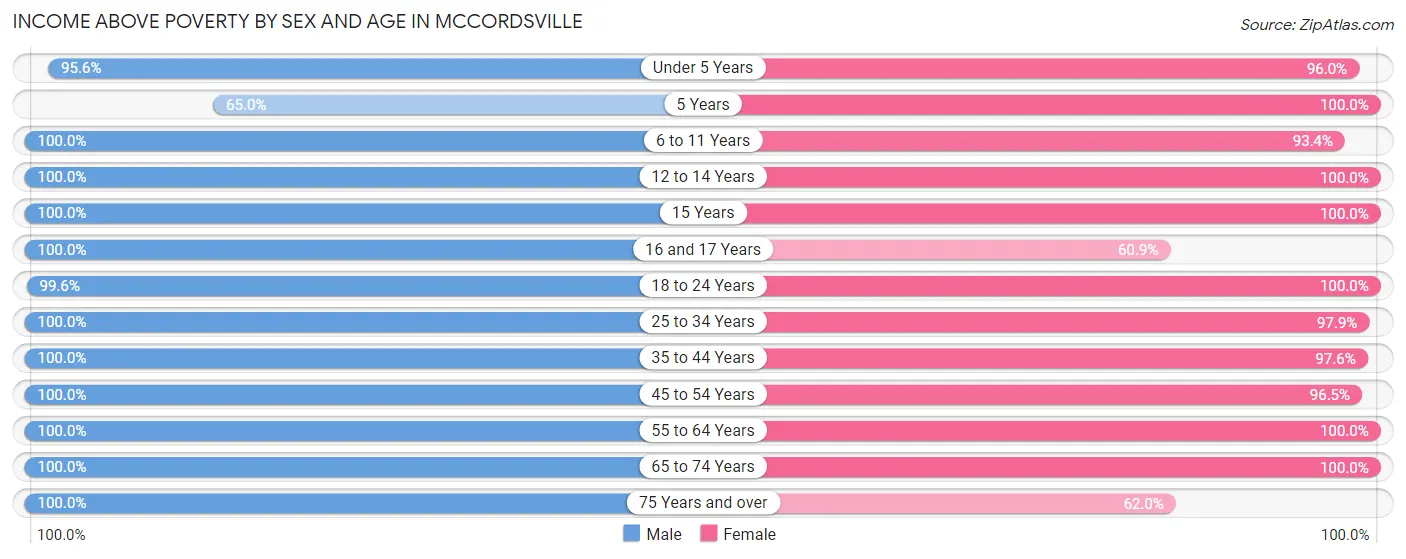
Income Above Poverty by Sex and Age in Mccordsville
According to the poverty statistics in Mccordsville, males aged 6 to 11 years and females aged 5 years are the age groups that are most secure financially, with 100.0% of males and 100.0% of females in these age groups living above the poverty line.
| Age Bracket | Male | Female |
| Under 5 Years | 328 (95.6%) | 478 (96.0%) |
| 5 Years | 26 (65.0%) | 54 (100.0%) |
| 6 to 11 Years | 210 (100.0%) | 563 (93.4%) |
| 12 to 14 Years | 185 (100.0%) | 184 (100.0%) |
| 15 Years | 83 (100.0%) | 11 (100.0%) |
| 16 and 17 Years | 61 (100.0%) | 39 (60.9%) |
| 18 to 24 Years | 280 (99.6%) | 182 (100.0%) |
| 25 to 34 Years | 717 (100.0%) | 739 (97.9%) |
| 35 to 44 Years | 835 (100.0%) | 687 (97.6%) |
| 45 to 54 Years | 604 (100.0%) | 529 (96.5%) |
| 55 to 64 Years | 314 (100.0%) | 465 (100.0%) |
| 65 to 74 Years | 520 (100.0%) | 442 (100.0%) |
| 75 Years and over | 105 (100.0%) | 145 (62.0%) |
| Total | 4,268 (99.3%) | 4,518 (95.2%) |
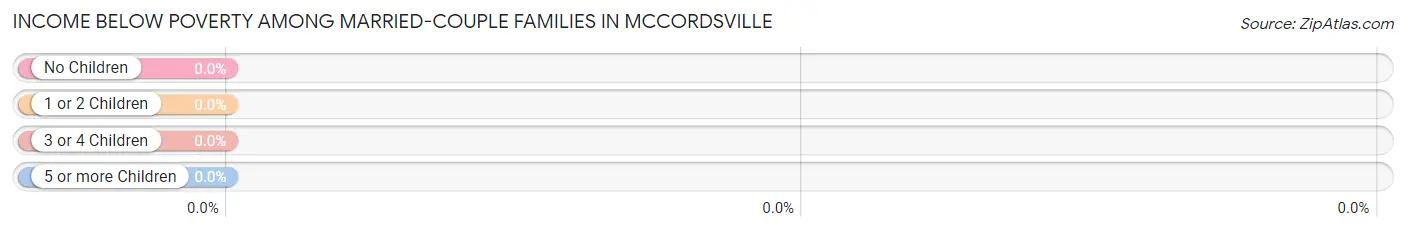
Income Below Poverty Among Married-Couple Families in Mccordsville
| Children | Above Poverty | Below Poverty |
| No Children | 1,292 (100.0%) | 0 (0.0%) |
| 1 or 2 Children | 948 (100.0%) | 0 (0.0%) |
| 3 or 4 Children | 186 (100.0%) | 0 (0.0%) |
| 5 or more Children | 0 (0.0%) | 0 (0.0%) |
| Total | 2,426 (100.0%) | 0 (0.0%) |
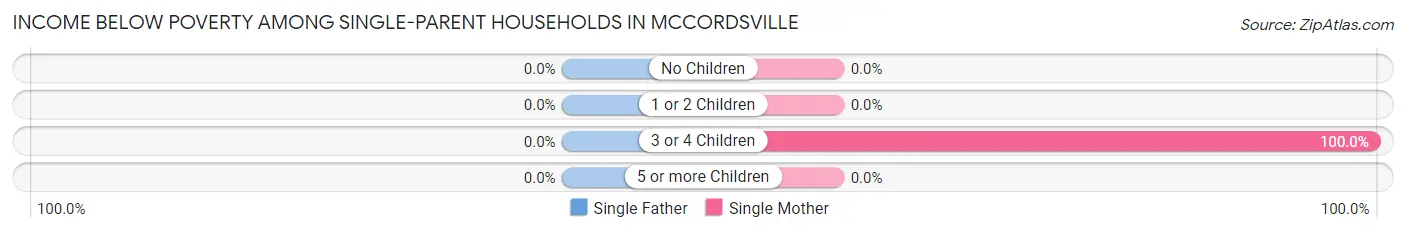
Income Below Poverty Among Single-Parent Households in Mccordsville
| Children | Single Father | Single Mother |
| No Children | 0 (0.0%) | 0 (0.0%) |
| 1 or 2 Children | 0 (0.0%) | 0 (0.0%) |
| 3 or 4 Children | 0 (0.0%) | 33 (100.0%) |
| 5 or more Children | 0 (0.0%) | 0 (0.0%) |
| Total | 0 (0.0%) | 33 (18.6%) |
Income Below Poverty Among Married-Couple vs Single-Parent Households in Mccordsville
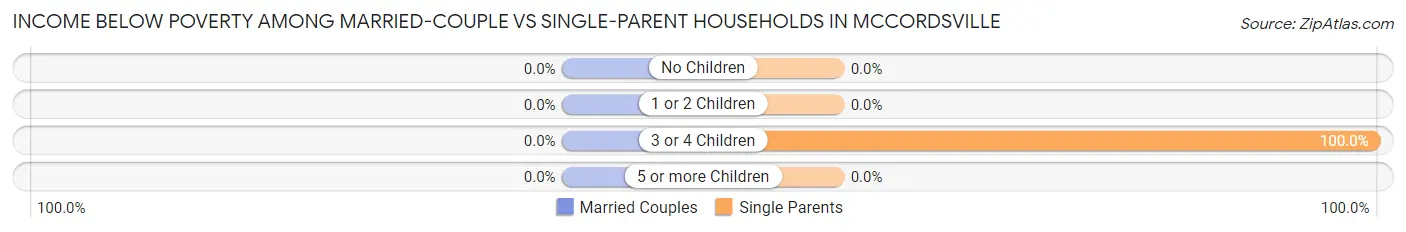
| Children | Married-Couple Families | Single-Parent Households |
| No Children | 0 (0.0%) | 0 (0.0%) |
| 1 or 2 Children | 0 (0.0%) | 0 (0.0%) |
| 3 or 4 Children | 0 (0.0%) | 33 (100.0%) |
| 5 or more Children | 0 (0.0%) | 0 (0.0%) |
| Total | 0 (0.0%) | 33 (12.2%) |
Employment Characteristics in Mccordsville
Employment by Class of Employer in Mccordsville
Among the 4,915 employed individuals in Mccordsville, private company employees (3,217 | 65.4%), not-for-profit organizations (538 | 11.0%), and federal government employees (483 | 9.8%) make up the most common classes of employment.
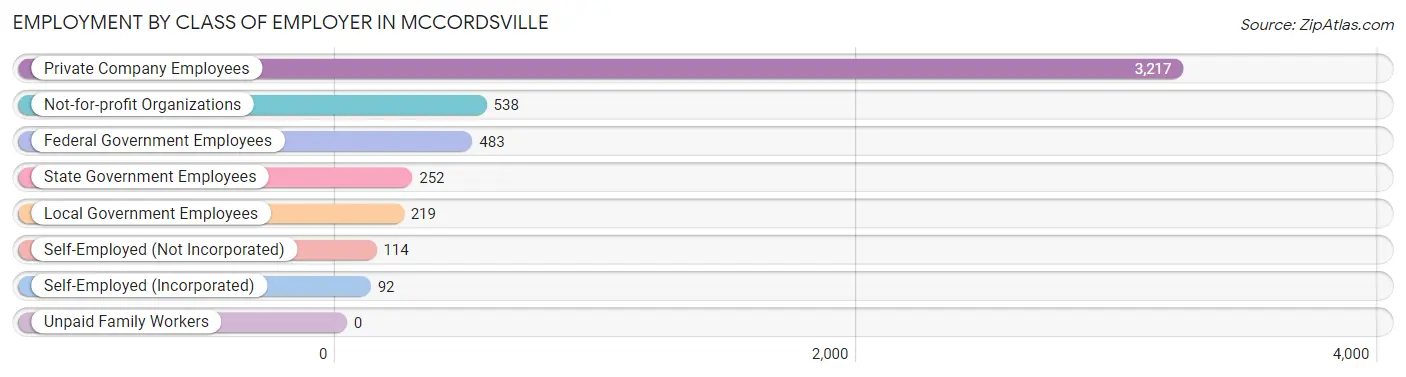
| Employer Class | # Employees | % Employees |
| Private Company Employees | 3,217 | 65.4% |
| Self-Employed (Incorporated) | 92 | 1.9% |
| Self-Employed (Not Incorporated) | 114 | 2.3% |
| Not-for-profit Organizations | 538 | 11.0% |
| Local Government Employees | 219 | 4.5% |
| State Government Employees | 252 | 5.1% |
| Federal Government Employees | 483 | 9.8% |
| Unpaid Family Workers | 0 | 0.0% |
| Total | 4,915 | 100.0% |
Employment Status by Age in Mccordsville
According to the labor force statistics for Mccordsville, out of the total population over 16 years of age (6,831), 74.5% or 5,089 individuals are in the labor force, with 2.7% or 137 of them unemployed. The age group with the highest labor force participation rate is 35 to 44 years, with 96.5% or 1,485 individuals in the labor force. Within the labor force, the 16 to 19 years age range has the highest percentage of unemployed individuals, with 38.5% or 111 of them being unemployed.
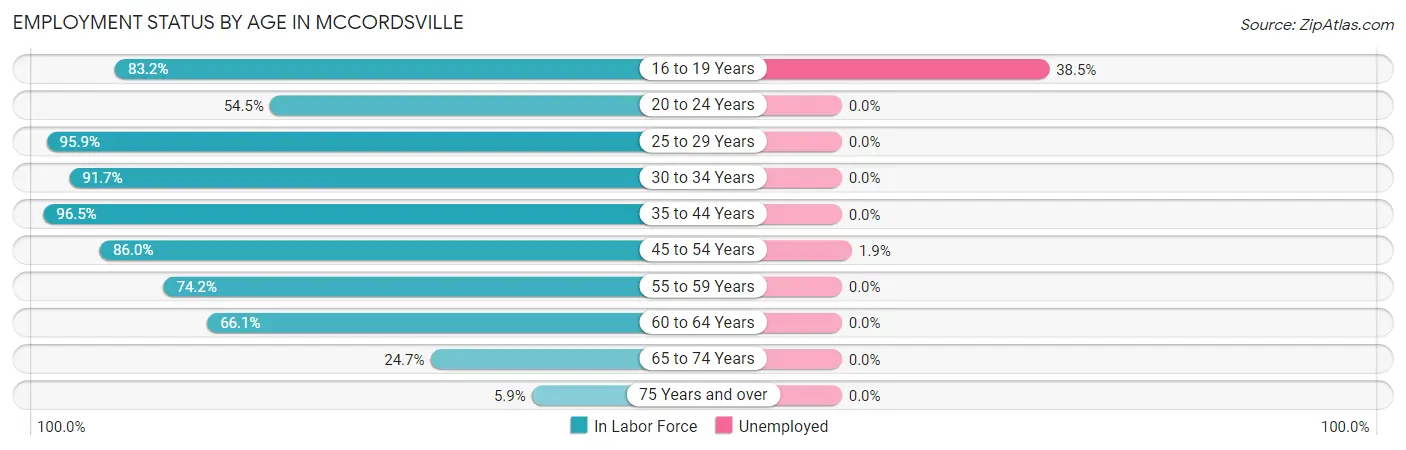
| Age Bracket | In Labor Force | Unemployed |
| 16 to 19 Years | 288 (83.2%) | 111 (38.5%) |
| 20 to 24 Years | 132 (54.5%) | 0 (0.0%) |
| 25 to 29 Years | 541 (95.9%) | 0 (0.0%) |
| 30 to 34 Years | 833 (91.7%) | 0 (0.0%) |
| 35 to 44 Years | 1,485 (96.5%) | 0 (0.0%) |
| 45 to 54 Years | 991 (86.0%) | 19 (1.9%) |
| 55 to 59 Years | 396 (74.2%) | 0 (0.0%) |
| 60 to 64 Years | 162 (66.1%) | 0 (0.0%) |
| 65 to 74 Years | 238 (24.7%) | 0 (0.0%) |
| 75 Years and over | 20 (5.9%) | 0 (0.0%) |
| Total | 5,089 (74.5%) | 137 (2.7%) |
Employment Status by Educational Attainment in Mccordsville
According to labor force statistics for Mccordsville, 89.2% of individuals (4,408) out of the total population between 25 and 64 years of age (4,942) are in the labor force, with 0.5% or 22 of them being unemployed. The group with the highest labor force participation rate are those with the educational attainment of college / associate degree, with 90.8% or 1,101 individuals in the labor force. Within the labor force, individuals with high school diploma education have the highest percentage of unemployment, with 4.3% or 19 of them being unemployed.
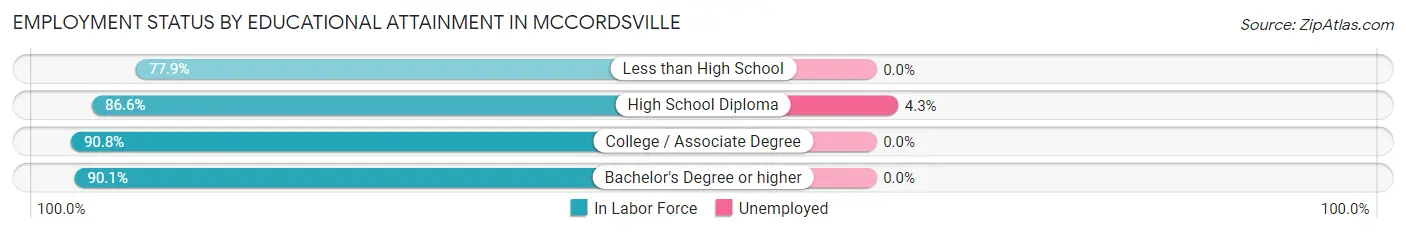
| Educational Attainment | In Labor Force | Unemployed |
| Less than High School | 229 (77.9%) | 0 (0.0%) |
| High School Diploma | 446 (86.6%) | 22 (4.3%) |
| College / Associate Degree | 1,101 (90.8%) | 0 (0.0%) |
| Bachelor's Degree or higher | 2,631 (90.1%) | 0 (0.0%) |
| Total | 4,408 (89.2%) | 25 (0.5%) |
Employment Occupations by Sex in Mccordsville
Management, Business, Science and Arts Occupations
The most common Management, Business, Science and Arts occupations in Mccordsville are Business & Financial (788 | 16.7%), Community & Social Service (694 | 14.7%), Management (630 | 13.3%), Health Diagnosing & Treating (462 | 9.8%), and Education Instruction & Library (433 | 9.1%).
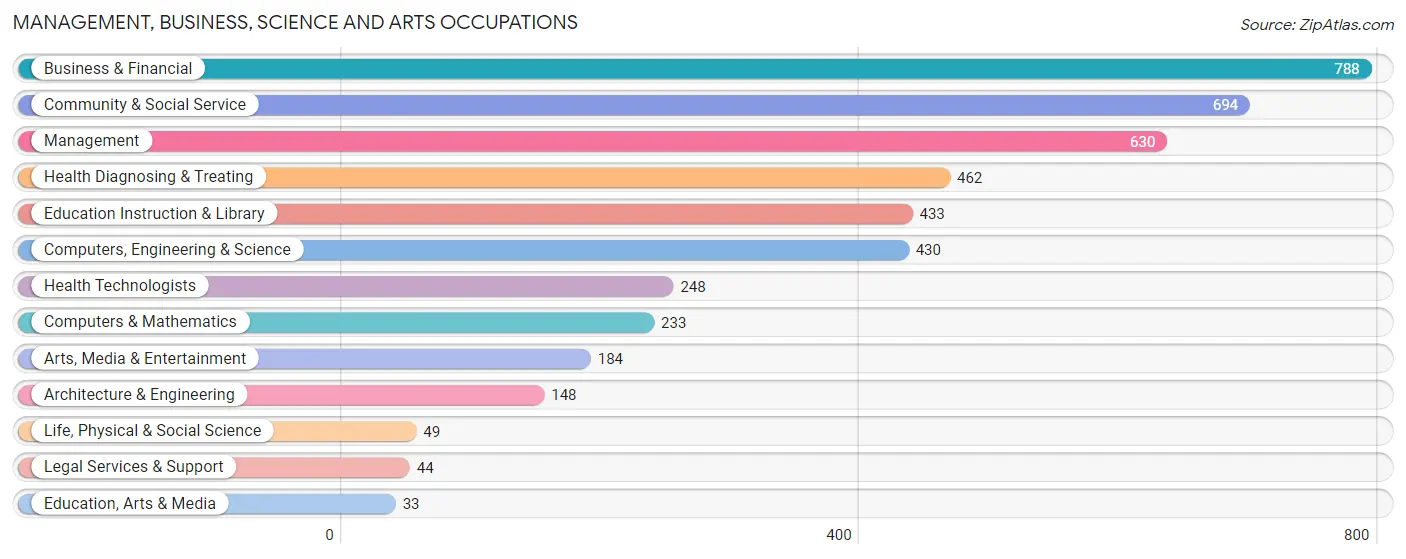
Management, Business, Science and Arts Occupations by Sex
Within the Management, Business, Science and Arts occupations in Mccordsville, the most male-oriented occupations are Life, Physical & Social Science (100.0%), Education, Arts & Media (100.0%), and Arts, Media & Entertainment (80.4%), while the most female-oriented occupations are Health Technologists (78.2%), Education Instruction & Library (77.8%), and Health Diagnosing & Treating (68.0%).

| Occupation | Male | Female |
| Management | 292 (46.4%) | 338 (53.6%) |
| Business & Financial | 442 (56.1%) | 346 (43.9%) |
| Computers, Engineering & Science | 281 (65.3%) | 149 (34.6%) |
| Computers & Mathematics | 171 (73.4%) | 62 (26.6%) |
| Architecture & Engineering | 61 (41.2%) | 87 (58.8%) |
| Life, Physical & Social Science | 49 (100.0%) | 0 (0.0%) |
| Community & Social Service | 295 (42.5%) | 399 (57.5%) |
| Education, Arts & Media | 33 (100.0%) | 0 (0.0%) |
| Legal Services & Support | 18 (40.9%) | 26 (59.1%) |
| Education Instruction & Library | 96 (22.2%) | 337 (77.8%) |
| Arts, Media & Entertainment | 148 (80.4%) | 36 (19.6%) |
| Health Diagnosing & Treating | 148 (32.0%) | 314 (68.0%) |
| Health Technologists | 54 (21.8%) | 194 (78.2%) |
| Total (Category) | 1,458 (48.5%) | 1,546 (51.5%) |
| Total (Overall) | 2,472 (52.2%) | 2,260 (47.8%) |
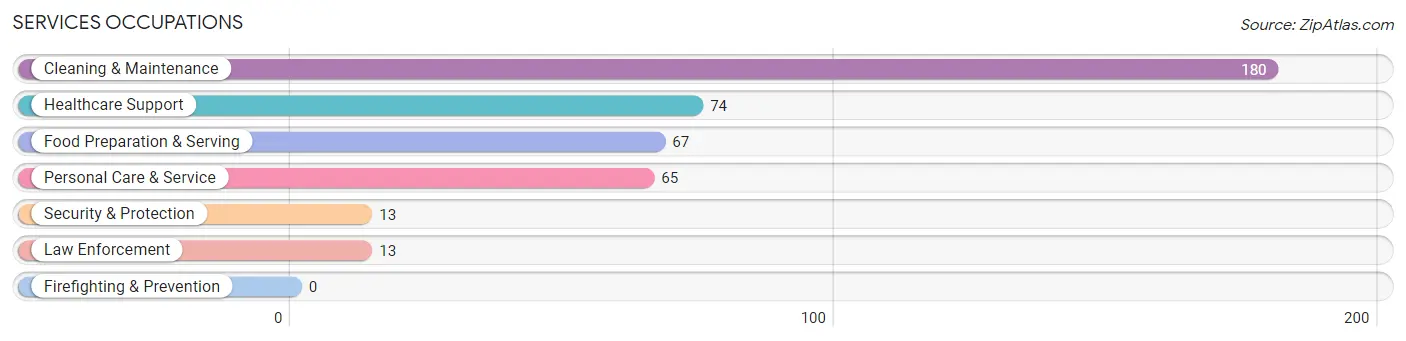
Services Occupations
The most common Services occupations in Mccordsville are Cleaning & Maintenance (180 | 3.8%), Healthcare Support (74 | 1.6%), Food Preparation & Serving (67 | 1.4%), Personal Care & Service (65 | 1.4%), and Security & Protection (13 | 0.3%).
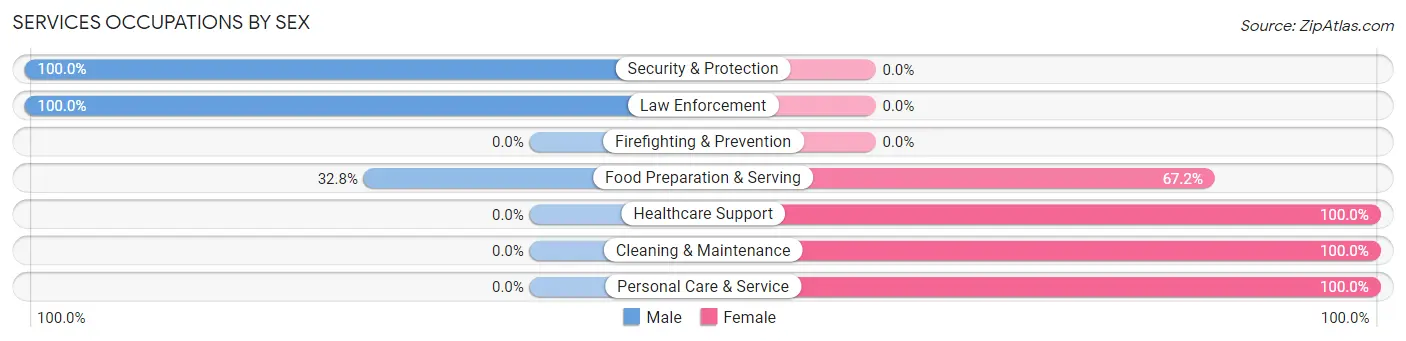
Services Occupations by Sex
Within the Services occupations in Mccordsville, the most male-oriented occupations are Security & Protection (100.0%), Law Enforcement (100.0%), and Food Preparation & Serving (32.8%), while the most female-oriented occupations are Healthcare Support (100.0%), Cleaning & Maintenance (100.0%), and Personal Care & Service (100.0%).
| Occupation | Male | Female |
| Healthcare Support | 0 (0.0%) | 74 (100.0%) |
| Security & Protection | 13 (100.0%) | 0 (0.0%) |
| Firefighting & Prevention | 0 (0.0%) | 0 (0.0%) |
| Law Enforcement | 13 (100.0%) | 0 (0.0%) |
| Food Preparation & Serving | 22 (32.8%) | 45 (67.2%) |
| Cleaning & Maintenance | 0 (0.0%) | 180 (100.0%) |
| Personal Care & Service | 0 (0.0%) | 65 (100.0%) |
| Total (Category) | 35 (8.8%) | 364 (91.2%) |
| Total (Overall) | 2,472 (52.2%) | 2,260 (47.8%) |
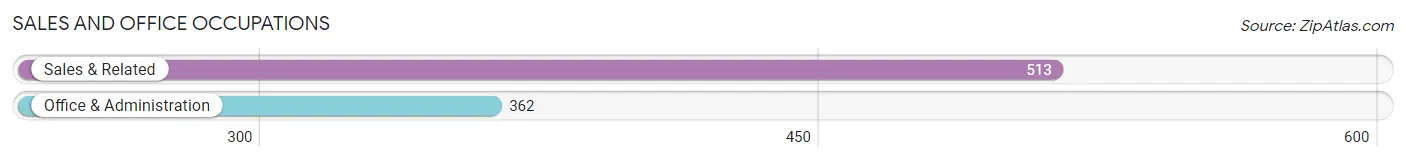
Sales and Office Occupations
The most common Sales and Office occupations in Mccordsville are Sales & Related (513 | 10.8%), and Office & Administration (362 | 7.6%).
Sales and Office Occupations by Sex
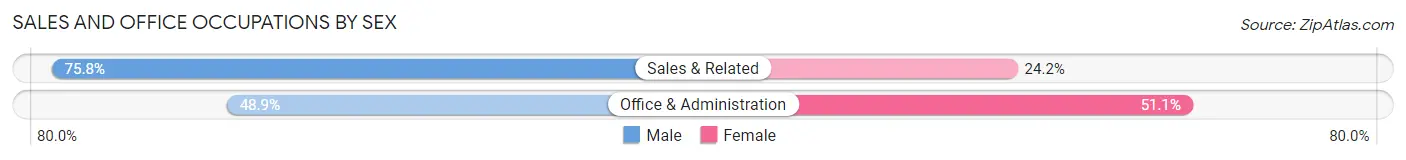
| Occupation | Male | Female |
| Sales & Related | 389 (75.8%) | 124 (24.2%) |
| Office & Administration | 177 (48.9%) | 185 (51.1%) |
| Total (Category) | 566 (64.7%) | 309 (35.3%) |
| Total (Overall) | 2,472 (52.2%) | 2,260 (47.8%) |
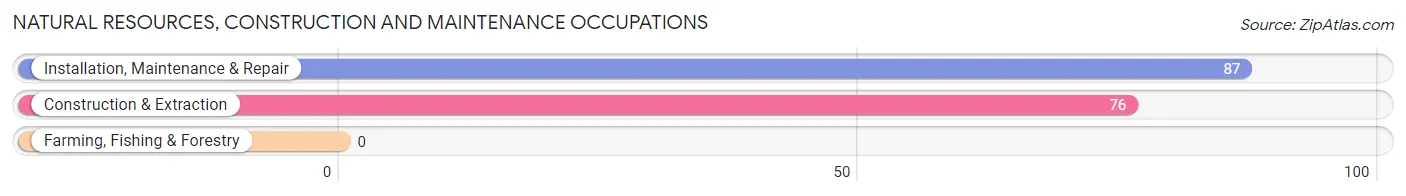
Natural Resources, Construction and Maintenance Occupations
The most common Natural Resources, Construction and Maintenance occupations in Mccordsville are Installation, Maintenance & Repair (87 | 1.8%), and Construction & Extraction (76 | 1.6%).
Natural Resources, Construction and Maintenance Occupations by Sex
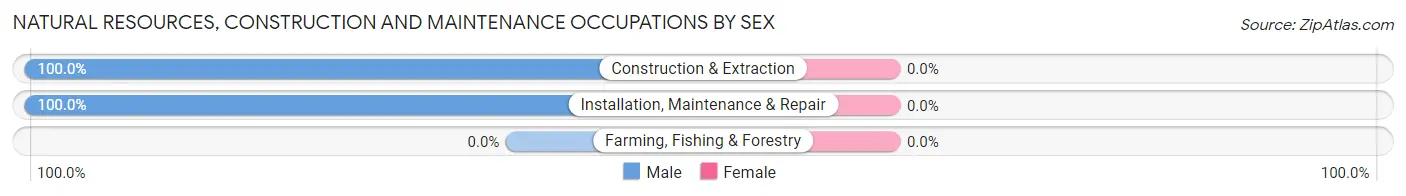
| Occupation | Male | Female |
| Farming, Fishing & Forestry | 0 (0.0%) | 0 (0.0%) |
| Construction & Extraction | 76 (100.0%) | 0 (0.0%) |
| Installation, Maintenance & Repair | 87 (100.0%) | 0 (0.0%) |
| Total (Category) | 163 (100.0%) | 0 (0.0%) |
| Total (Overall) | 2,472 (52.2%) | 2,260 (47.8%) |
Production, Transportation and Moving Occupations
The most common Production, Transportation and Moving occupations in Mccordsville are Transportation (156 | 3.3%), Material Moving (88 | 1.9%), and Production (47 | 1.0%).
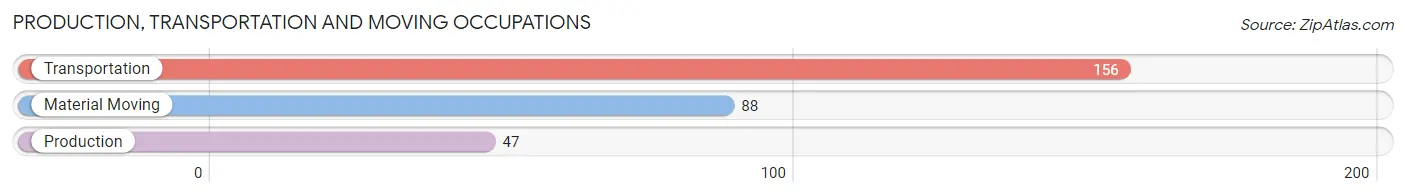
Production, Transportation and Moving Occupations by Sex
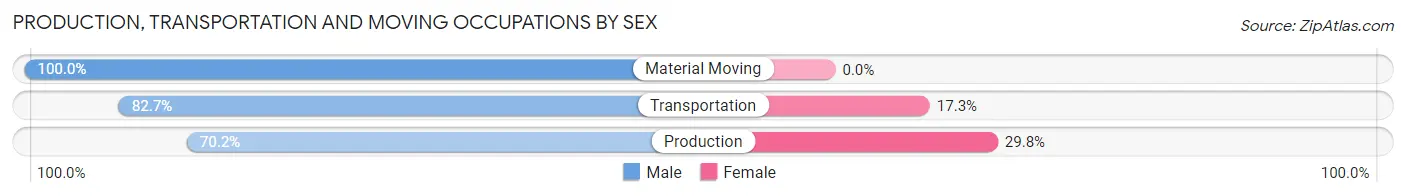
| Occupation | Male | Female |
| Production | 33 (70.2%) | 14 (29.8%) |
| Transportation | 129 (82.7%) | 27 (17.3%) |
| Material Moving | 88 (100.0%) | 0 (0.0%) |
| Total (Category) | 250 (85.9%) | 41 (14.1%) |
| Total (Overall) | 2,472 (52.2%) | 2,260 (47.8%) |
Employment Industries by Sex in Mccordsville
Employment Industries in Mccordsville
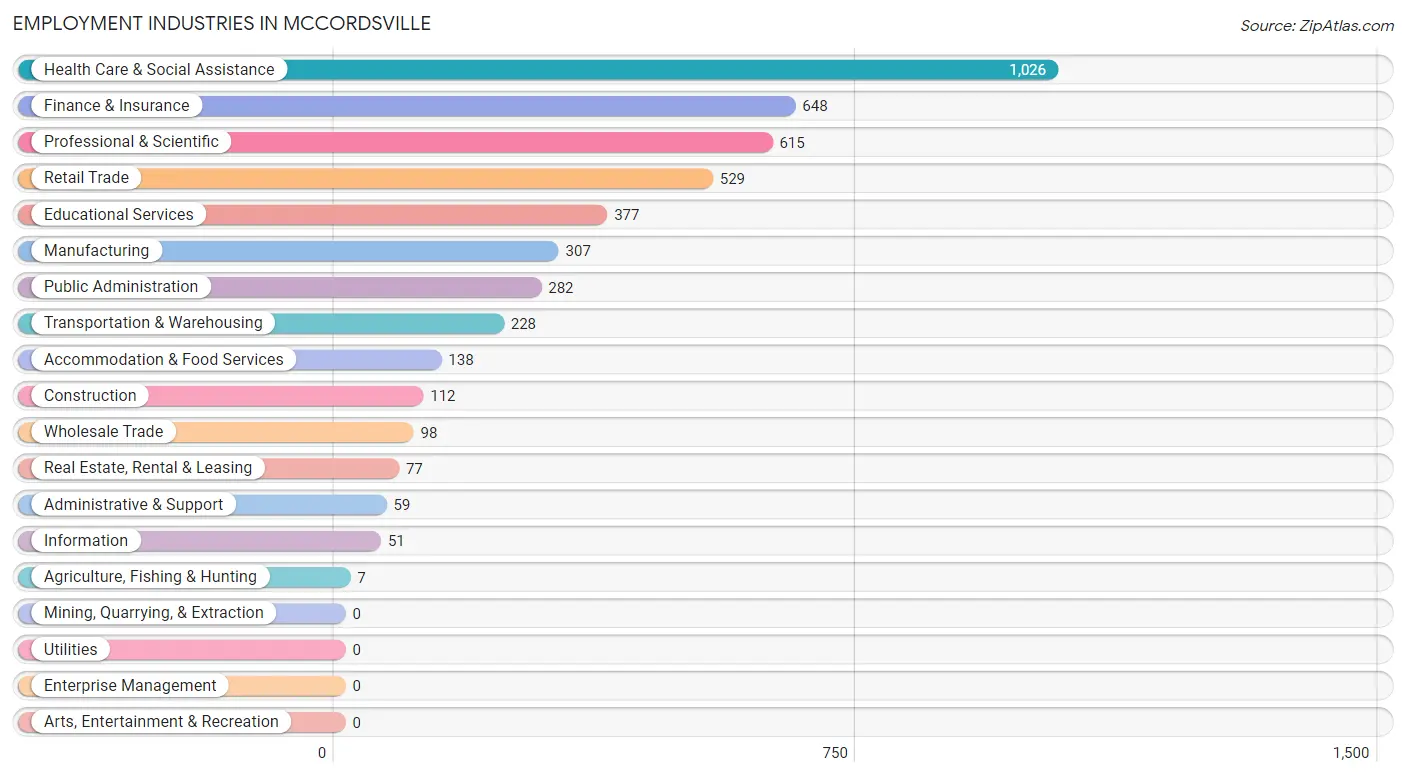
The major employment industries in Mccordsville include Health Care & Social Assistance (1,026 | 21.7%), Finance & Insurance (648 | 13.7%), Professional & Scientific (615 | 13.0%), Retail Trade (529 | 11.2%), and Educational Services (377 | 8.0%).
Employment Industries by Sex in Mccordsville
The Mccordsville industries that see more men than women are Agriculture, Fishing & Hunting (100.0%), Construction (100.0%), and Wholesale Trade (100.0%), whereas the industries that tend to have a higher number of women are Information (100.0%), Health Care & Social Assistance (89.5%), and Educational Services (65.5%).
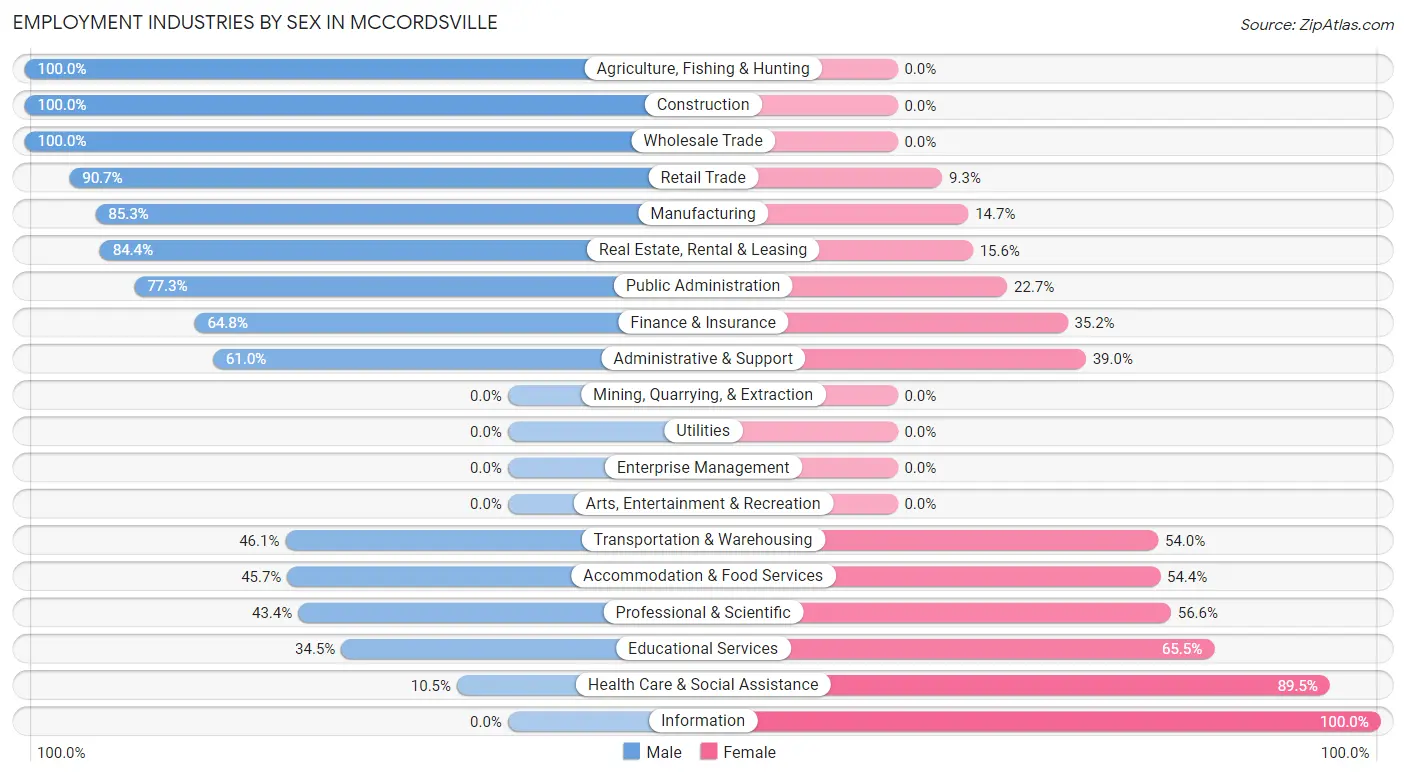
| Industry | Male | Female |
| Agriculture, Fishing & Hunting | 7 (100.0%) | 0 (0.0%) |
| Mining, Quarrying, & Extraction | 0 (0.0%) | 0 (0.0%) |
| Construction | 112 (100.0%) | 0 (0.0%) |
| Manufacturing | 262 (85.3%) | 45 (14.7%) |
| Wholesale Trade | 98 (100.0%) | 0 (0.0%) |
| Retail Trade | 480 (90.7%) | 49 (9.3%) |
| Transportation & Warehousing | 105 (46.1%) | 123 (53.9%) |
| Utilities | 0 (0.0%) | 0 (0.0%) |
| Information | 0 (0.0%) | 51 (100.0%) |
| Finance & Insurance | 420 (64.8%) | 228 (35.2%) |
| Real Estate, Rental & Leasing | 65 (84.4%) | 12 (15.6%) |
| Professional & Scientific | 267 (43.4%) | 348 (56.6%) |
| Enterprise Management | 0 (0.0%) | 0 (0.0%) |
| Administrative & Support | 36 (61.0%) | 23 (39.0%) |
| Educational Services | 130 (34.5%) | 247 (65.5%) |
| Health Care & Social Assistance | 108 (10.5%) | 918 (89.5%) |
| Arts, Entertainment & Recreation | 0 (0.0%) | 0 (0.0%) |
| Accommodation & Food Services | 63 (45.7%) | 75 (54.3%) |
| Public Administration | 218 (77.3%) | 64 (22.7%) |
| Total | 2,472 (52.2%) | 2,260 (47.8%) |
Education in Mccordsville
School Enrollment in Mccordsville
The most common levels of schooling among the 2,206 students in Mccordsville are elementary school (580 | 26.3%), middle school (440 | 20.0%), and high school (386 | 17.5%).
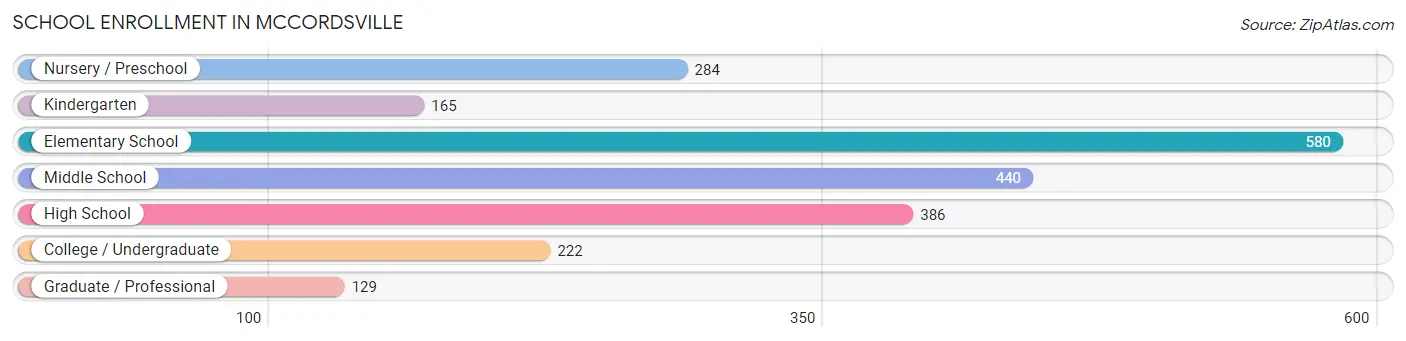
| School Level | # Students | % Students |
| Nursery / Preschool | 284 | 12.9% |
| Kindergarten | 165 | 7.5% |
| Elementary School | 580 | 26.3% |
| Middle School | 440 | 20.0% |
| High School | 386 | 17.5% |
| College / Undergraduate | 222 | 10.1% |
| Graduate / Professional | 129 | 5.9% |
| Total | 2,206 | 100.0% |
School Enrollment by Age by Funding Source in Mccordsville
Out of a total of 2,206 students who are enrolled in schools in Mccordsville, 410 (18.6%) attend a private institution, while the remaining 1,796 (81.4%) are enrolled in public schools. The age group of 3 to 4 year olds has the highest likelihood of being enrolled in private schools, with 176 (62.0% in the age bracket) enrolled. Conversely, the age group of 18 to 19 year olds has the lowest likelihood of being enrolled in a private school, with 63 (100.0% in the age bracket) attending a public institution.
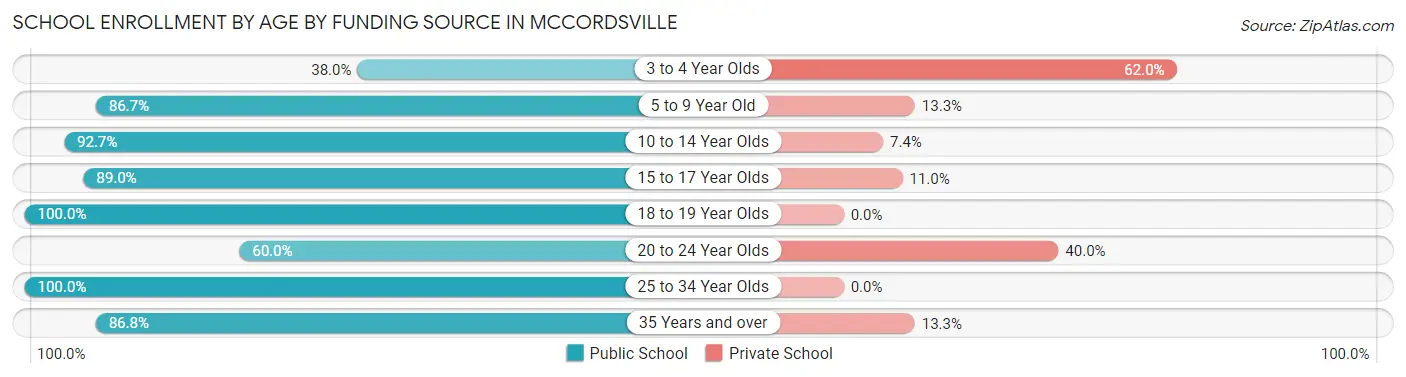
| Age Bracket | Public School | Private School |
| 3 to 4 Year Olds | 108 (38.0%) | 176 (62.0%) |
| 5 to 9 Year Old | 575 (86.7%) | 88 (13.3%) |
| 10 to 14 Year Olds | 580 (92.6%) | 46 (7.3%) |
| 15 to 17 Year Olds | 195 (89.0%) | 24 (11.0%) |
| 18 to 19 Year Olds | 63 (100.0%) | 0 (0.0%) |
| 20 to 24 Year Olds | 81 (60.0%) | 54 (40.0%) |
| 25 to 34 Year Olds | 50 (100.0%) | 0 (0.0%) |
| 35 Years and over | 144 (86.8%) | 22 (13.3%) |
| Total | 1,796 (81.4%) | 410 (18.6%) |
Educational Attainment by Field of Study in Mccordsville
Business (1,364 | 38.4%), science & technology (355 | 10.0%), computers & mathematics (332 | 9.3%), education (246 | 6.9%), and liberal arts & history (196 | 5.5%) are the most common fields of study among 3,550 individuals in Mccordsville who have obtained a bachelor's degree or higher.
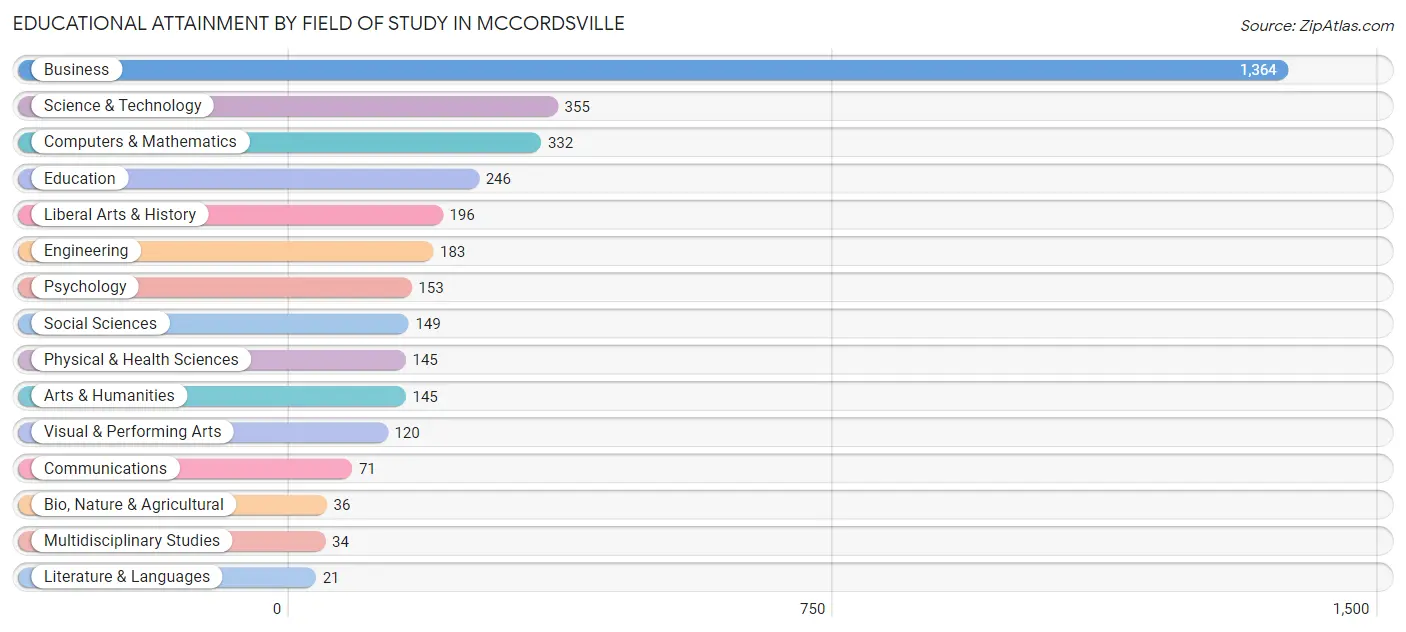
| Field of Study | # Graduates | % Graduates |
| Computers & Mathematics | 332 | 9.3% |
| Bio, Nature & Agricultural | 36 | 1.0% |
| Physical & Health Sciences | 145 | 4.1% |
| Psychology | 153 | 4.3% |
| Social Sciences | 149 | 4.2% |
| Engineering | 183 | 5.1% |
| Multidisciplinary Studies | 34 | 1.0% |
| Science & Technology | 355 | 10.0% |
| Business | 1,364 | 38.4% |
| Education | 246 | 6.9% |
| Literature & Languages | 21 | 0.6% |
| Liberal Arts & History | 196 | 5.5% |
| Visual & Performing Arts | 120 | 3.4% |
| Communications | 71 | 2.0% |
| Arts & Humanities | 145 | 4.1% |
| Total | 3,550 | 100.0% |
Transportation & Commute in Mccordsville
Vehicle Availability by Sex in Mccordsville
The most prevalent vehicle ownership categories in Mccordsville are males with 2 vehicles (1,603, accounting for 61.9%) and females with 2 vehicles (1,367, making up 69.0%).
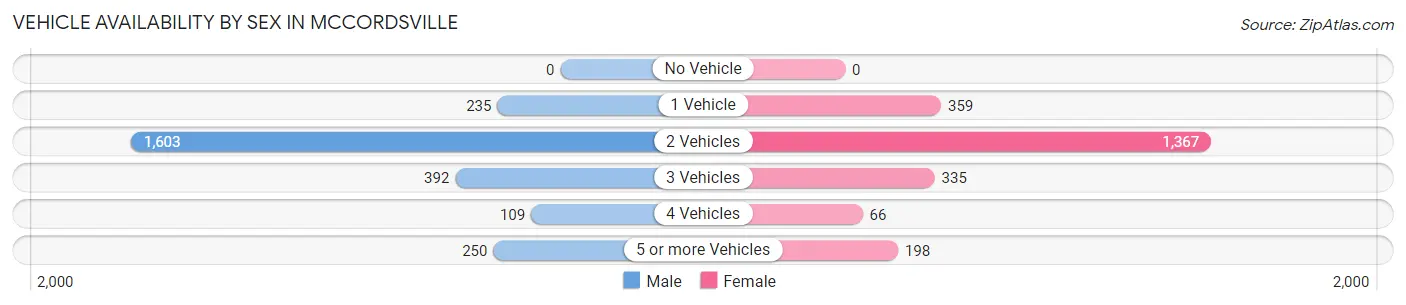
| Vehicles Available | Male | Female |
| No Vehicle | 0 (0.0%) | 0 (0.0%) |
| 1 Vehicle | 235 (9.1%) | 359 (15.4%) |
| 2 Vehicles | 1,603 (61.9%) | 1,367 (58.8%) |
| 3 Vehicles | 392 (15.1%) | 335 (14.4%) |
| 4 Vehicles | 109 (4.2%) | 66 (2.8%) |
| 5 or more Vehicles | 250 (9.7%) | 198 (8.5%) |
| Total | 2,589 (100.0%) | 2,325 (100.0%) |
Commute Time in Mccordsville
The most frequently occuring commute durations in Mccordsville are 20 to 24 minutes (676 commuters, 17.9%), 25 to 29 minutes (489 commuters, 12.9%), and 45 to 59 minutes (457 commuters, 12.1%).
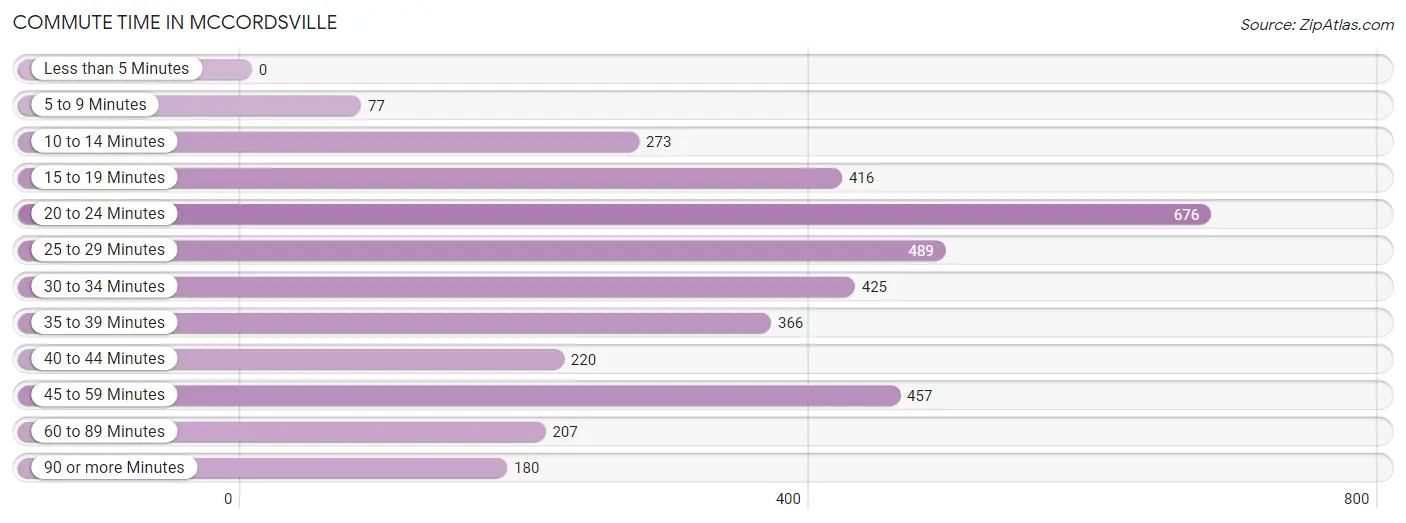
| Commute Time | # Commuters | % Commuters |
| Less than 5 Minutes | 0 | 0.0% |
| 5 to 9 Minutes | 77 | 2.0% |
| 10 to 14 Minutes | 273 | 7.2% |
| 15 to 19 Minutes | 416 | 11.0% |
| 20 to 24 Minutes | 676 | 17.9% |
| 25 to 29 Minutes | 489 | 12.9% |
| 30 to 34 Minutes | 425 | 11.2% |
| 35 to 39 Minutes | 366 | 9.7% |
| 40 to 44 Minutes | 220 | 5.8% |
| 45 to 59 Minutes | 457 | 12.1% |
| 60 to 89 Minutes | 207 | 5.5% |
| 90 or more Minutes | 180 | 4.8% |
Commute Time by Sex in Mccordsville
The most common commute times in Mccordsville are 45 to 59 minutes (368 commuters, 17.7%) for males and 20 to 24 minutes (349 commuters, 20.4%) for females.
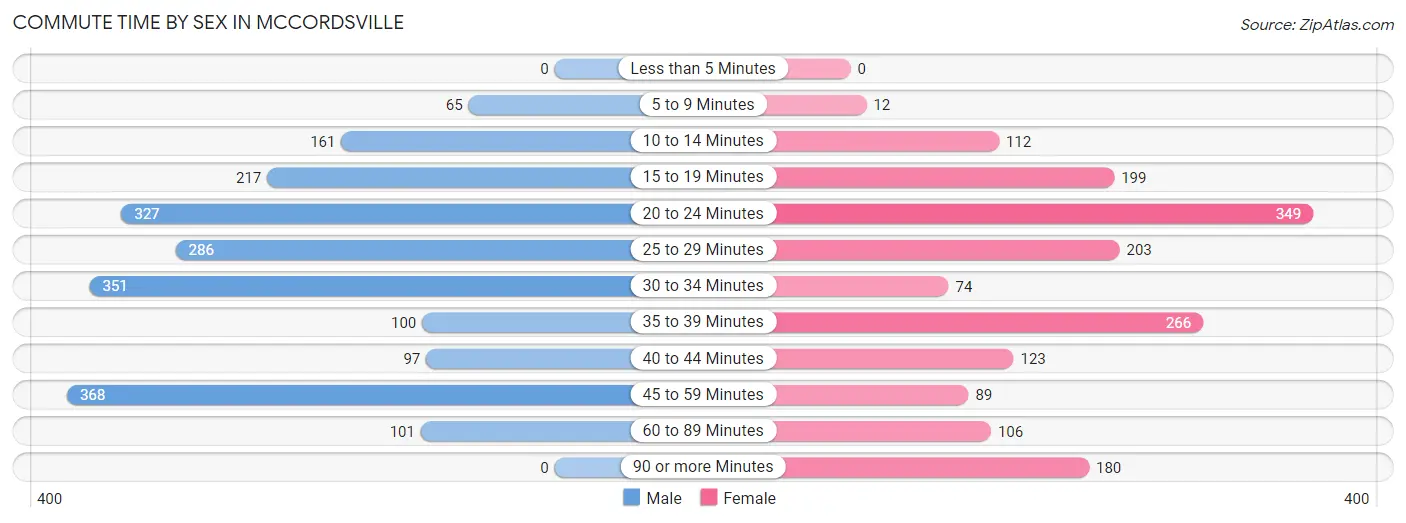
| Commute Time | Male | Female |
| Less than 5 Minutes | 0 (0.0%) | 0 (0.0%) |
| 5 to 9 Minutes | 65 (3.1%) | 12 (0.7%) |
| 10 to 14 Minutes | 161 (7.8%) | 112 (6.5%) |
| 15 to 19 Minutes | 217 (10.5%) | 199 (11.6%) |
| 20 to 24 Minutes | 327 (15.8%) | 349 (20.4%) |
| 25 to 29 Minutes | 286 (13.8%) | 203 (11.8%) |
| 30 to 34 Minutes | 351 (16.9%) | 74 (4.3%) |
| 35 to 39 Minutes | 100 (4.8%) | 266 (15.5%) |
| 40 to 44 Minutes | 97 (4.7%) | 123 (7.2%) |
| 45 to 59 Minutes | 368 (17.7%) | 89 (5.2%) |
| 60 to 89 Minutes | 101 (4.9%) | 106 (6.2%) |
| 90 or more Minutes | 0 (0.0%) | 180 (10.5%) |
Time of Departure to Work by Sex in Mccordsville
The most frequent times of departure to work in Mccordsville are 7:00 AM to 7:29 AM (680, 32.8%) for males and 6:30 AM to 6:59 AM (552, 32.2%) for females.
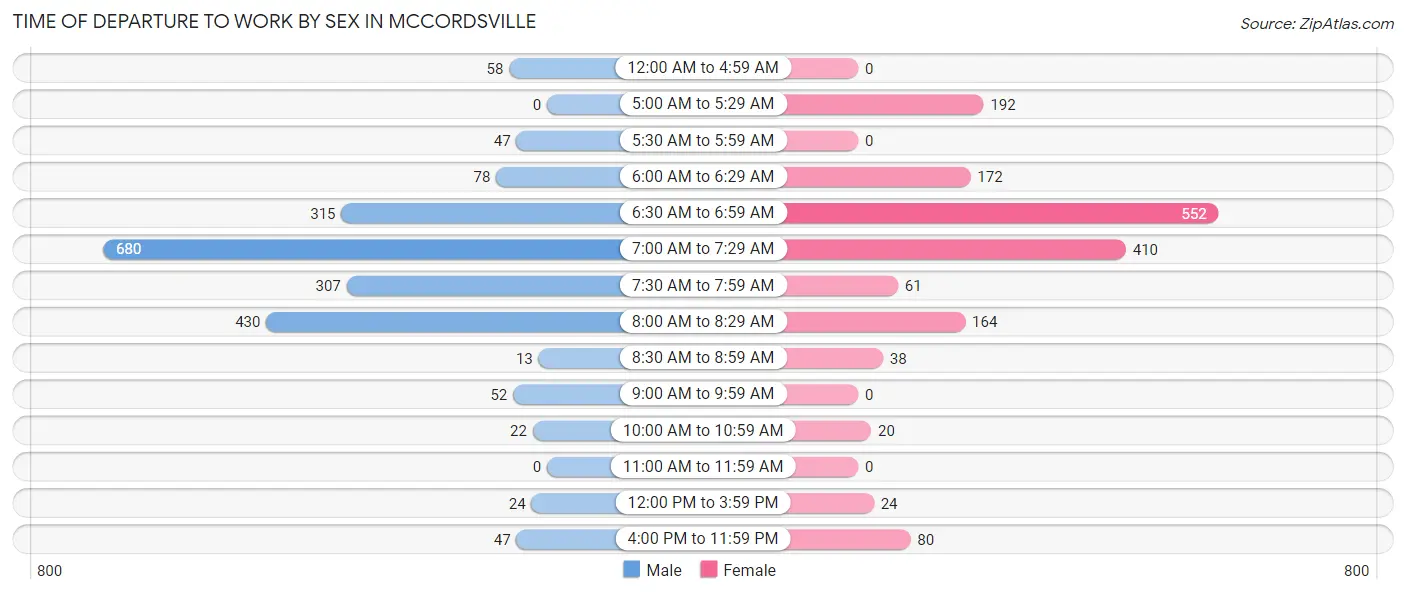
| Time of Departure | Male | Female |
| 12:00 AM to 4:59 AM | 58 (2.8%) | 0 (0.0%) |
| 5:00 AM to 5:29 AM | 0 (0.0%) | 192 (11.2%) |
| 5:30 AM to 5:59 AM | 47 (2.3%) | 0 (0.0%) |
| 6:00 AM to 6:29 AM | 78 (3.8%) | 172 (10.0%) |
| 6:30 AM to 6:59 AM | 315 (15.2%) | 552 (32.2%) |
| 7:00 AM to 7:29 AM | 680 (32.8%) | 410 (23.9%) |
| 7:30 AM to 7:59 AM | 307 (14.8%) | 61 (3.6%) |
| 8:00 AM to 8:29 AM | 430 (20.7%) | 164 (9.6%) |
| 8:30 AM to 8:59 AM | 13 (0.6%) | 38 (2.2%) |
| 9:00 AM to 9:59 AM | 52 (2.5%) | 0 (0.0%) |
| 10:00 AM to 10:59 AM | 22 (1.1%) | 20 (1.2%) |
| 11:00 AM to 11:59 AM | 0 (0.0%) | 0 (0.0%) |
| 12:00 PM to 3:59 PM | 24 (1.2%) | 24 (1.4%) |
| 4:00 PM to 11:59 PM | 47 (2.3%) | 80 (4.7%) |
| Total | 2,073 (100.0%) | 1,713 (100.0%) |
Housing Occupancy in Mccordsville
Occupancy by Ownership in Mccordsville
Of the total 3,518 dwellings in Mccordsville, owner-occupied units account for 3,127 (88.9%), while renter-occupied units make up 391 (11.1%).
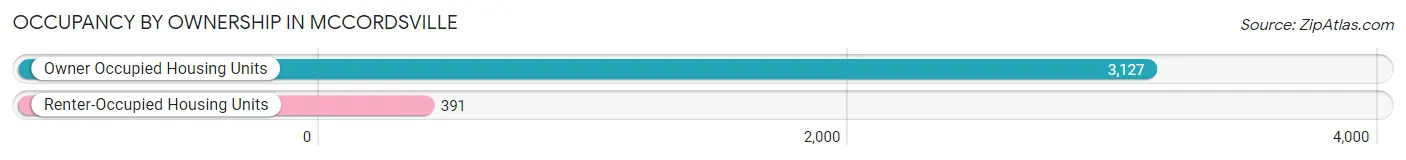
| Occupancy | # Housing Units | % Housing Units |
| Owner Occupied Housing Units | 3,127 | 88.9% |
| Renter-Occupied Housing Units | 391 | 11.1% |
| Total Occupied Housing Units | 3,518 | 100.0% |
Occupancy by Household Size in Mccordsville
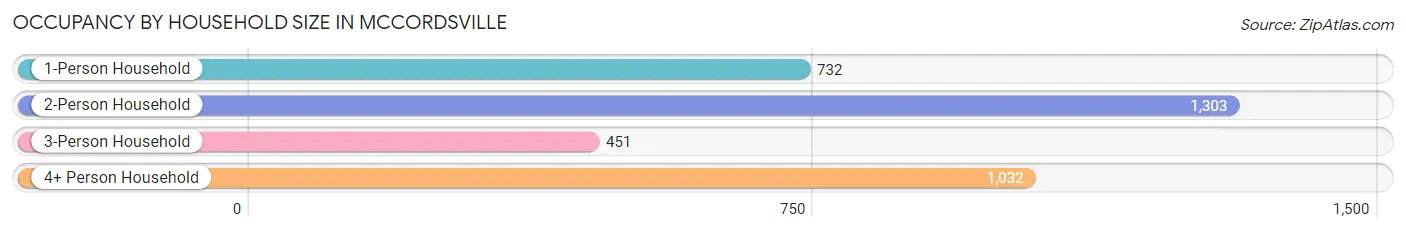
| Household Size | # Housing Units | % Housing Units |
| 1-Person Household | 732 | 20.8% |
| 2-Person Household | 1,303 | 37.0% |
| 3-Person Household | 451 | 12.8% |
| 4+ Person Household | 1,032 | 29.3% |
| Total Housing Units | 3,518 | 100.0% |
Occupancy by Ownership by Household Size in Mccordsville
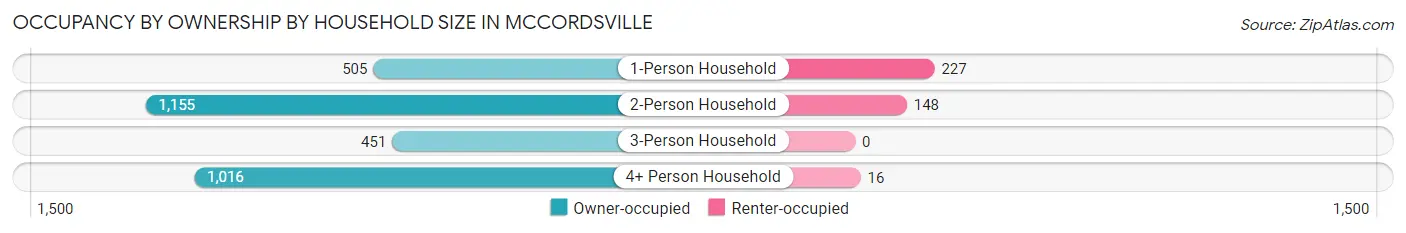
| Household Size | Owner-occupied | Renter-occupied |
| 1-Person Household | 505 (69.0%) | 227 (31.0%) |
| 2-Person Household | 1,155 (88.6%) | 148 (11.4%) |
| 3-Person Household | 451 (100.0%) | 0 (0.0%) |
| 4+ Person Household | 1,016 (98.5%) | 16 (1.5%) |
| Total Housing Units | 3,127 (88.9%) | 391 (11.1%) |
Occupancy by Educational Attainment in Mccordsville
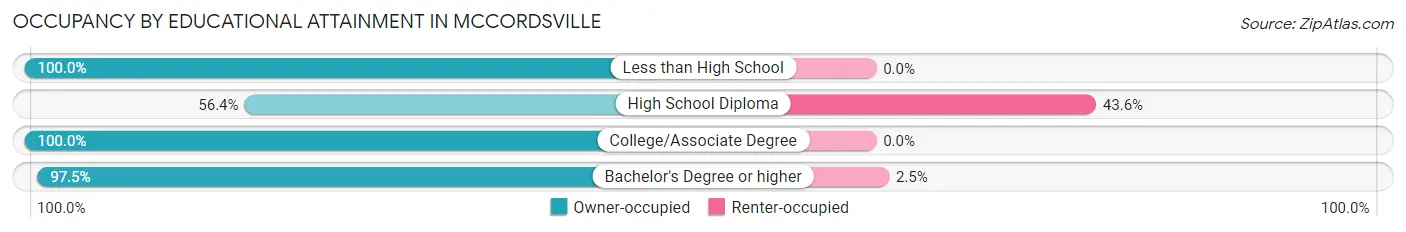
| Household Size | Owner-occupied | Renter-occupied |
| Less than High School | 20 (100.0%) | 0 (0.0%) |
| High School Diploma | 439 (56.4%) | 339 (43.6%) |
| College/Associate Degree | 661 (100.0%) | 0 (0.0%) |
| Bachelor's Degree or higher | 2,007 (97.5%) | 52 (2.5%) |
Occupancy by Age of Householder in Mccordsville
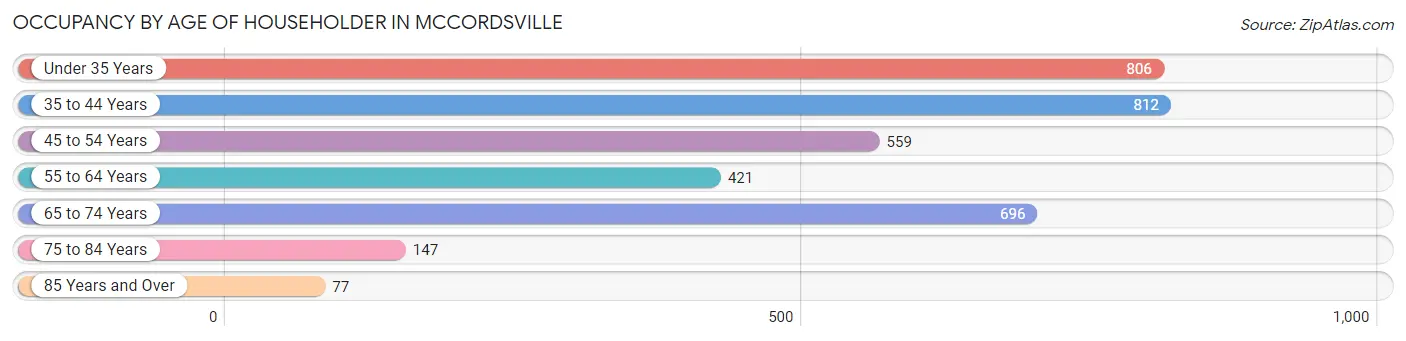
| Age Bracket | # Households | % Households |
| Under 35 Years | 806 | 22.9% |
| 35 to 44 Years | 812 | 23.1% |
| 45 to 54 Years | 559 | 15.9% |
| 55 to 64 Years | 421 | 12.0% |
| 65 to 74 Years | 696 | 19.8% |
| 75 to 84 Years | 147 | 4.2% |
| 85 Years and Over | 77 | 2.2% |
| Total | 3,518 | 100.0% |
Housing Finances in Mccordsville
Median Income by Occupancy in Mccordsville
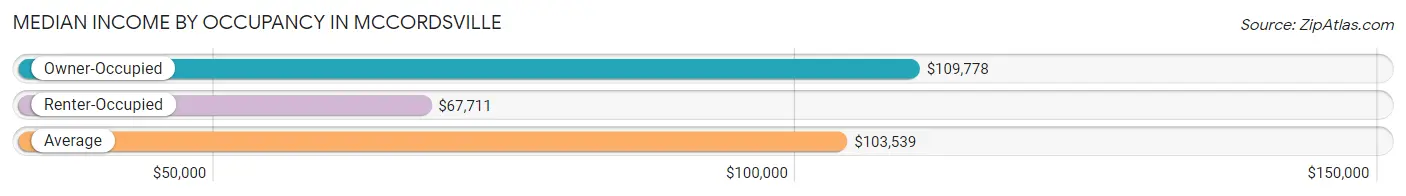
| Occupancy Type | # Households | Median Income |
| Owner-Occupied | 3,127 (88.9%) | $109,778 |
| Renter-Occupied | 391 (11.1%) | $67,711 |
| Average | 3,518 (100.0%) | $103,539 |
Occupancy by Householder Income Bracket in Mccordsville
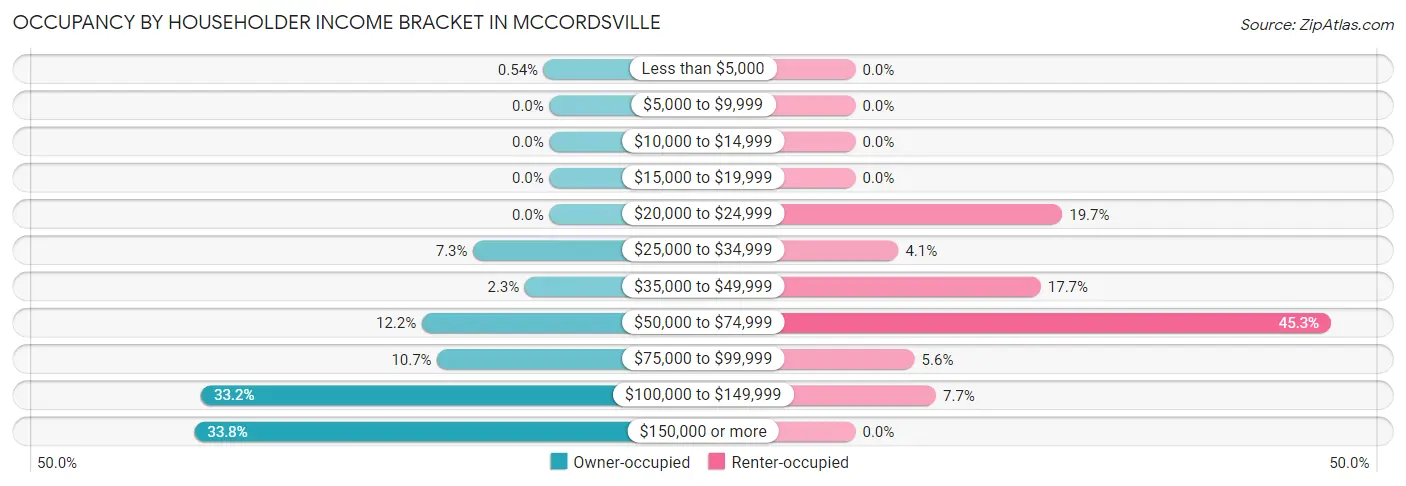
| Income Bracket | Owner-occupied | Renter-occupied |
| Less than $5,000 | 17 (0.5%) | 0 (0.0%) |
| $5,000 to $9,999 | 0 (0.0%) | 0 (0.0%) |
| $10,000 to $14,999 | 0 (0.0%) | 0 (0.0%) |
| $15,000 to $19,999 | 0 (0.0%) | 0 (0.0%) |
| $20,000 to $24,999 | 0 (0.0%) | 77 (19.7%) |
| $25,000 to $34,999 | 227 (7.3%) | 16 (4.1%) |
| $35,000 to $49,999 | 73 (2.3%) | 69 (17.6%) |
| $50,000 to $74,999 | 380 (12.1%) | 177 (45.3%) |
| $75,000 to $99,999 | 334 (10.7%) | 22 (5.6%) |
| $100,000 to $149,999 | 1,038 (33.2%) | 30 (7.7%) |
| $150,000 or more | 1,058 (33.8%) | 0 (0.0%) |
| Total | 3,127 (100.0%) | 391 (100.0%) |
Monthly Housing Cost Tiers in Mccordsville
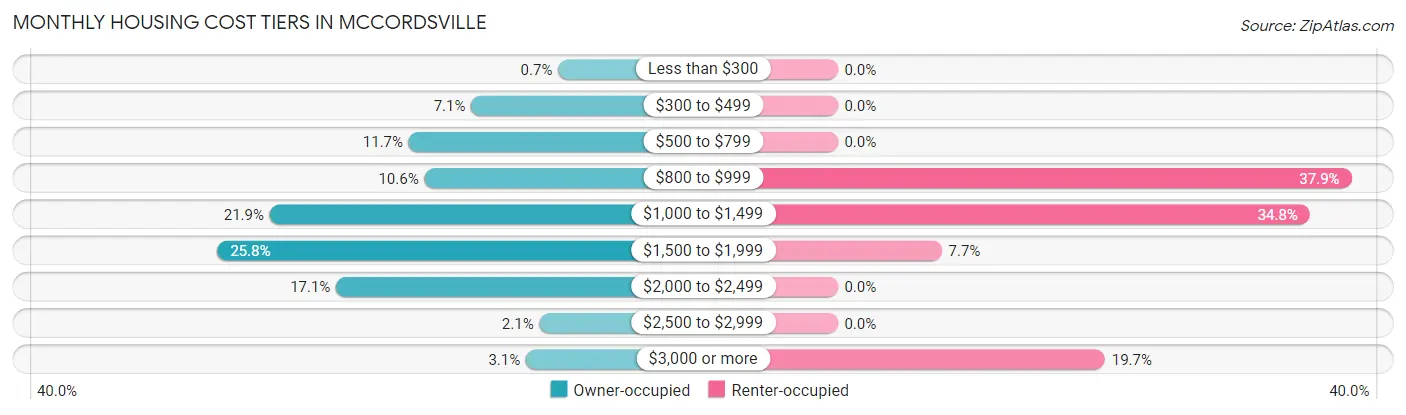
| Monthly Cost | Owner-occupied | Renter-occupied |
| Less than $300 | 22 (0.7%) | 0 (0.0%) |
| $300 to $499 | 222 (7.1%) | 0 (0.0%) |
| $500 to $799 | 366 (11.7%) | 0 (0.0%) |
| $800 to $999 | 330 (10.5%) | 148 (37.9%) |
| $1,000 to $1,499 | 686 (21.9%) | 136 (34.8%) |
| $1,500 to $1,999 | 807 (25.8%) | 30 (7.7%) |
| $2,000 to $2,499 | 533 (17.1%) | 0 (0.0%) |
| $2,500 to $2,999 | 65 (2.1%) | 0 (0.0%) |
| $3,000 or more | 96 (3.1%) | 77 (19.7%) |
| Total | 3,127 (100.0%) | 391 (100.0%) |
Physical Housing Characteristics in Mccordsville
Housing Structures in Mccordsville
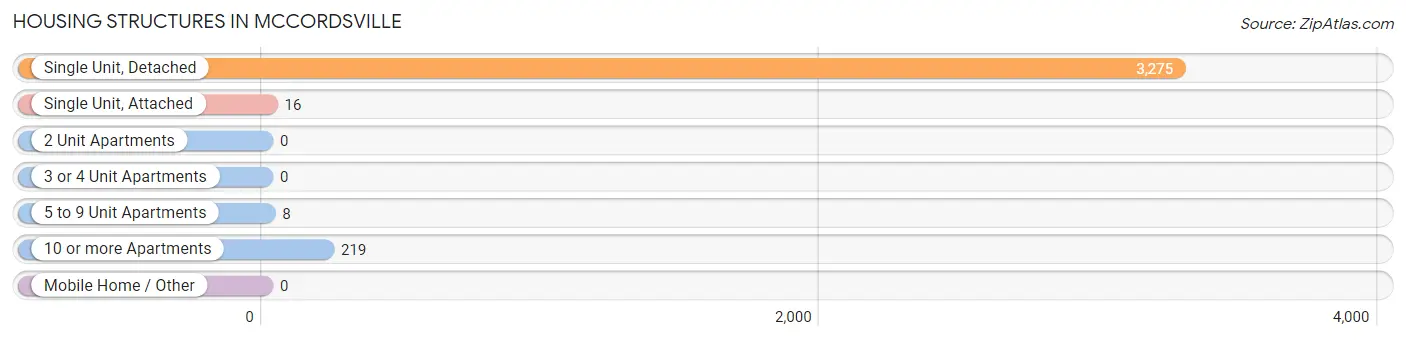
| Structure Type | # Housing Units | % Housing Units |
| Single Unit, Detached | 3,275 | 93.1% |
| Single Unit, Attached | 16 | 0.4% |
| 2 Unit Apartments | 0 | 0.0% |
| 3 or 4 Unit Apartments | 0 | 0.0% |
| 5 to 9 Unit Apartments | 8 | 0.2% |
| 10 or more Apartments | 219 | 6.2% |
| Mobile Home / Other | 0 | 0.0% |
| Total | 3,518 | 100.0% |
Housing Structures by Occupancy in Mccordsville
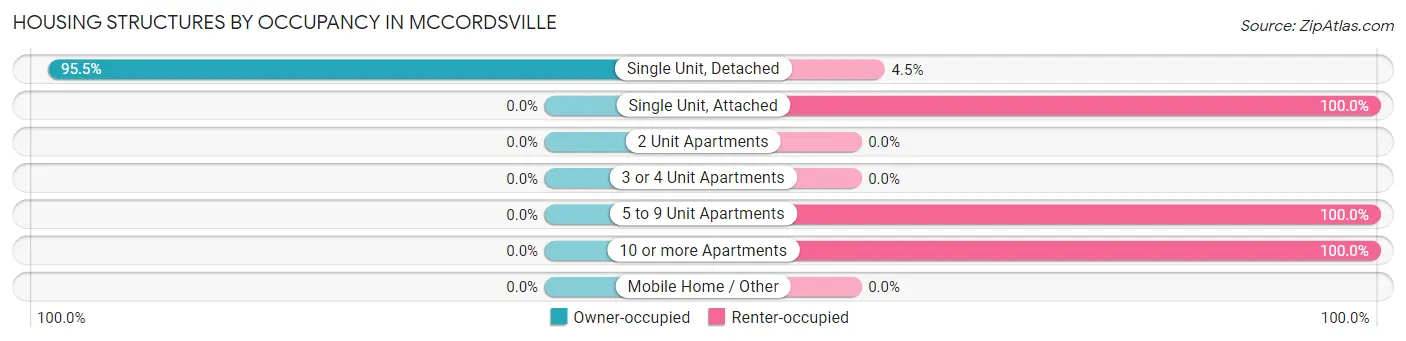
| Structure Type | Owner-occupied | Renter-occupied |
| Single Unit, Detached | 3,127 (95.5%) | 148 (4.5%) |
| Single Unit, Attached | 0 (0.0%) | 16 (100.0%) |
| 2 Unit Apartments | 0 (0.0%) | 0 (0.0%) |
| 3 or 4 Unit Apartments | 0 (0.0%) | 0 (0.0%) |
| 5 to 9 Unit Apartments | 0 (0.0%) | 8 (100.0%) |
| 10 or more Apartments | 0 (0.0%) | 219 (100.0%) |
| Mobile Home / Other | 0 (0.0%) | 0 (0.0%) |
| Total | 3,127 (88.9%) | 391 (11.1%) |
Housing Structures by Number of Rooms in Mccordsville
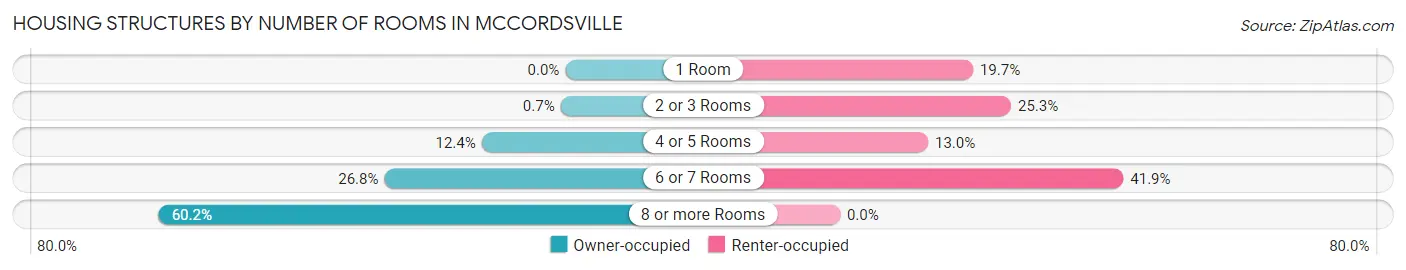
| Number of Rooms | Owner-occupied | Renter-occupied |
| 1 Room | 0 (0.0%) | 77 (19.7%) |
| 2 or 3 Rooms | 22 (0.7%) | 99 (25.3%) |
| 4 or 5 Rooms | 387 (12.4%) | 51 (13.0%) |
| 6 or 7 Rooms | 837 (26.8%) | 164 (41.9%) |
| 8 or more Rooms | 1,881 (60.2%) | 0 (0.0%) |
| Total | 3,127 (100.0%) | 391 (100.0%) |
Housing Structure by Heating Type in Mccordsville
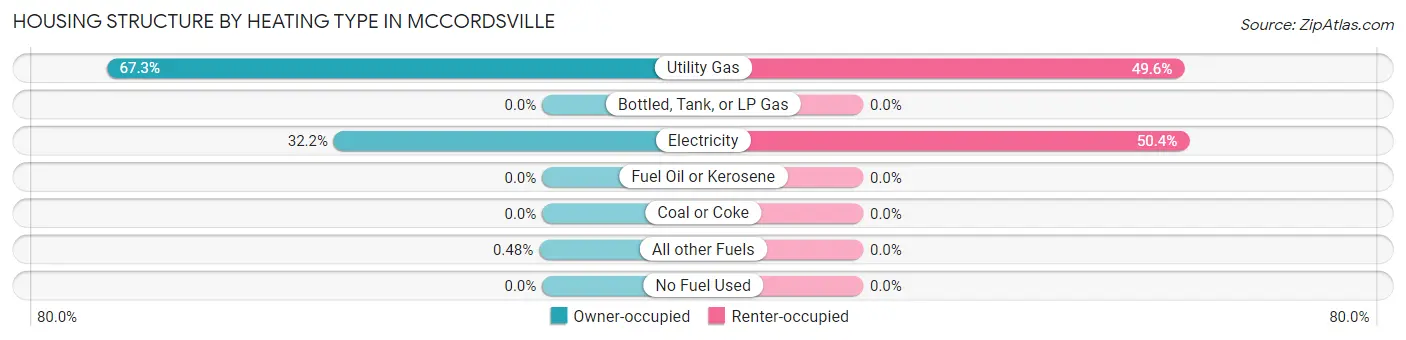
| Heating Type | Owner-occupied | Renter-occupied |
| Utility Gas | 2,105 (67.3%) | 194 (49.6%) |
| Bottled, Tank, or LP Gas | 0 (0.0%) | 0 (0.0%) |
| Electricity | 1,007 (32.2%) | 197 (50.4%) |
| Fuel Oil or Kerosene | 0 (0.0%) | 0 (0.0%) |
| Coal or Coke | 0 (0.0%) | 0 (0.0%) |
| All other Fuels | 15 (0.5%) | 0 (0.0%) |
| No Fuel Used | 0 (0.0%) | 0 (0.0%) |
| Total | 3,127 (100.0%) | 391 (100.0%) |
Household Vehicle Usage in Mccordsville
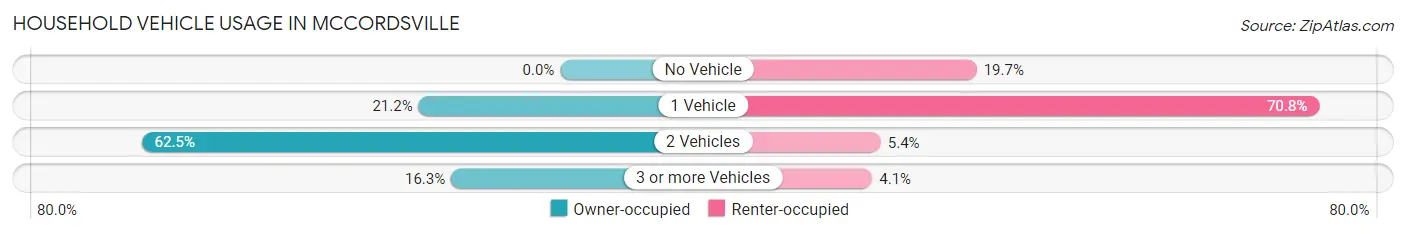
| Vehicles per Household | Owner-occupied | Renter-occupied |
| No Vehicle | 0 (0.0%) | 77 (19.7%) |
| 1 Vehicle | 662 (21.2%) | 277 (70.8%) |
| 2 Vehicles | 1,955 (62.5%) | 21 (5.4%) |
| 3 or more Vehicles | 510 (16.3%) | 16 (4.1%) |
| Total | 3,127 (100.0%) | 391 (100.0%) |
Real Estate & Mortgages in Mccordsville
Real Estate and Mortgage Overview in Mccordsville
| Characteristic | Without Mortgage | With Mortgage |
| Housing Units | 679 | 2,448 |
| Median Property Value | $288,100 | $306,400 |
| Median Household Income | $104,345 | $891 |
| Monthly Housing Costs | $536 | $96 |
| Real Estate Taxes | $2,457 | $0 |
Property Value by Mortgage Status in Mccordsville
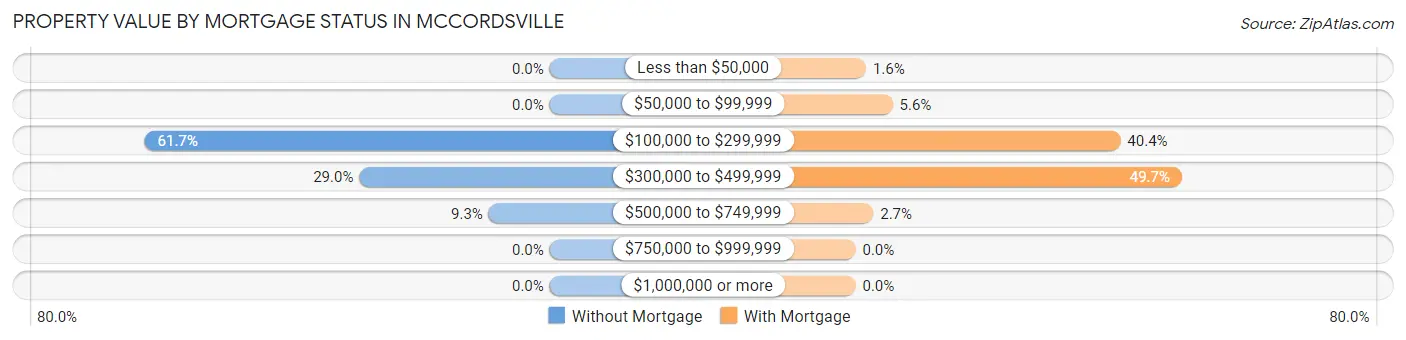
| Property Value | Without Mortgage | With Mortgage |
| Less than $50,000 | 0 (0.0%) | 39 (1.6%) |
| $50,000 to $99,999 | 0 (0.0%) | 138 (5.6%) |
| $100,000 to $299,999 | 419 (61.7%) | 988 (40.4%) |
| $300,000 to $499,999 | 197 (29.0%) | 1,217 (49.7%) |
| $500,000 to $749,999 | 63 (9.3%) | 66 (2.7%) |
| $750,000 to $999,999 | 0 (0.0%) | 0 (0.0%) |
| $1,000,000 or more | 0 (0.0%) | 0 (0.0%) |
| Total | 679 (100.0%) | 2,448 (100.0%) |
Household Income by Mortgage Status in Mccordsville
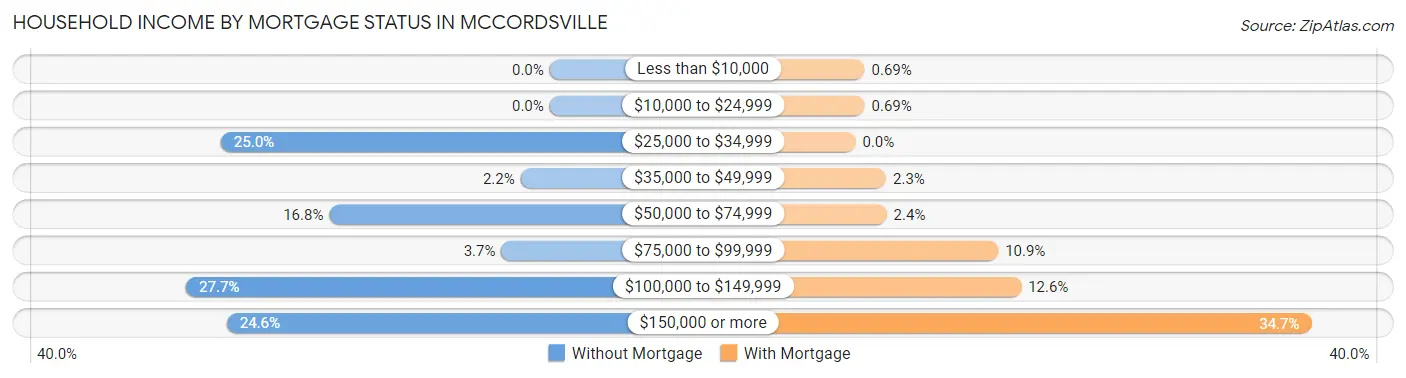
| Household Income | Without Mortgage | With Mortgage |
| Less than $10,000 | 0 (0.0%) | 17 (0.7%) |
| $10,000 to $24,999 | 0 (0.0%) | 17 (0.7%) |
| $25,000 to $34,999 | 170 (25.0%) | 0 (0.0%) |
| $35,000 to $49,999 | 15 (2.2%) | 57 (2.3%) |
| $50,000 to $74,999 | 114 (16.8%) | 58 (2.4%) |
| $75,000 to $99,999 | 25 (3.7%) | 266 (10.9%) |
| $100,000 to $149,999 | 188 (27.7%) | 309 (12.6%) |
| $150,000 or more | 167 (24.6%) | 850 (34.7%) |
| Total | 679 (100.0%) | 2,448 (100.0%) |
Property Value to Household Income Ratio in Mccordsville
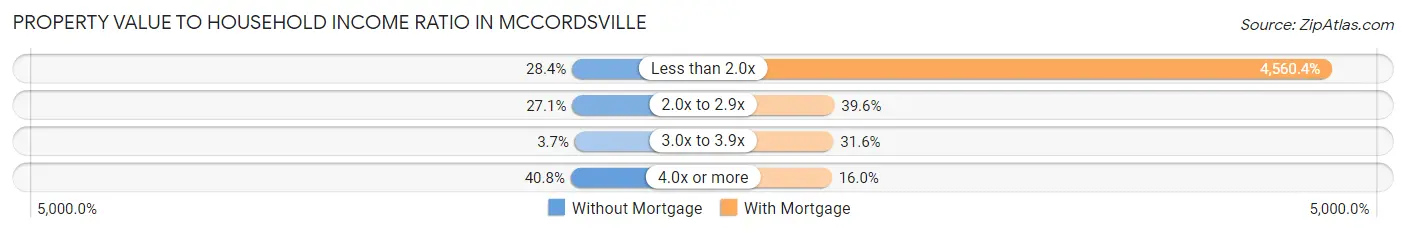
| Value-to-Income Ratio | Without Mortgage | With Mortgage |
| Less than 2.0x | 193 (28.4%) | 111,638 (4,560.4%) |
| 2.0x to 2.9x | 184 (27.1%) | 970 (39.6%) |
| 3.0x to 3.9x | 25 (3.7%) | 773 (31.6%) |
| 4.0x or more | 277 (40.8%) | 392 (16.0%) |
| Total | 679 (100.0%) | 2,448 (100.0%) |
Real Estate Taxes by Mortgage Status in Mccordsville
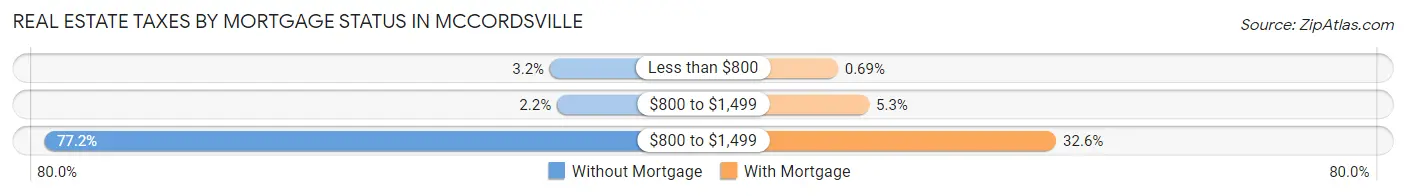
| Property Taxes | Without Mortgage | With Mortgage |
| Less than $800 | 22 (3.2%) | 17 (0.7%) |
| $800 to $1,499 | 15 (2.2%) | 129 (5.3%) |
| $800 to $1,499 | 524 (77.2%) | 798 (32.6%) |
| Total | 679 (100.0%) | 2,448 (100.0%) |
Health & Disability in Mccordsville
Health Insurance Coverage by Age in Mccordsville
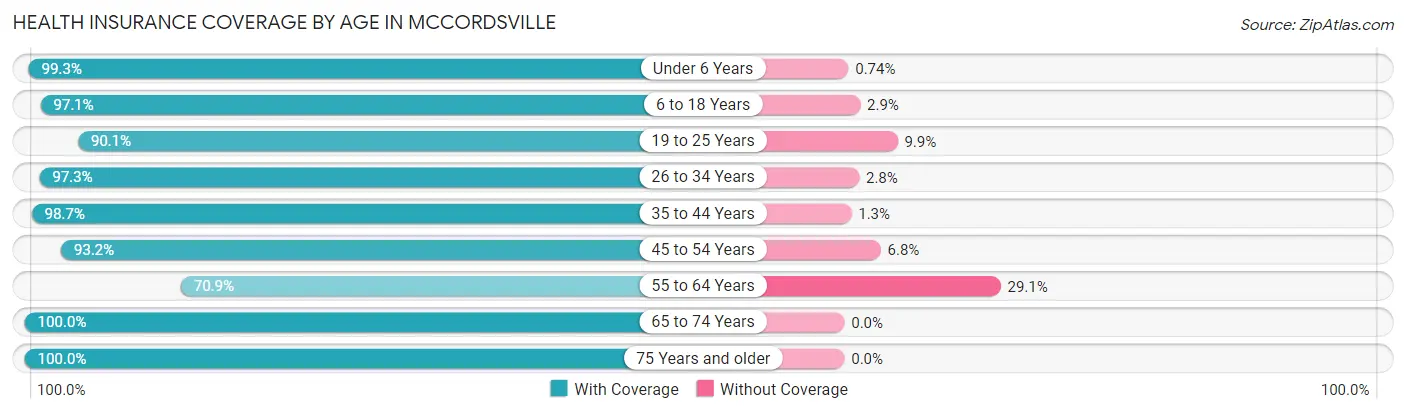
| Age Bracket | With Coverage | Without Coverage |
| Under 6 Years | 944 (99.3%) | 7 (0.7%) |
| 6 to 18 Years | 1,551 (97.1%) | 47 (2.9%) |
| 19 to 25 Years | 318 (90.1%) | 35 (9.9%) |
| 26 to 34 Years | 1,168 (97.3%) | 33 (2.8%) |
| 35 to 44 Years | 1,519 (98.7%) | 20 (1.3%) |
| 45 to 54 Years | 1,074 (93.2%) | 78 (6.8%) |
| 55 to 64 Years | 552 (70.9%) | 227 (29.1%) |
| 65 to 74 Years | 962 (100.0%) | 0 (0.0%) |
| 75 Years and older | 339 (100.0%) | 0 (0.0%) |
| Total | 8,427 (95.0%) | 447 (5.0%) |
Health Insurance Coverage by Citizenship Status in Mccordsville
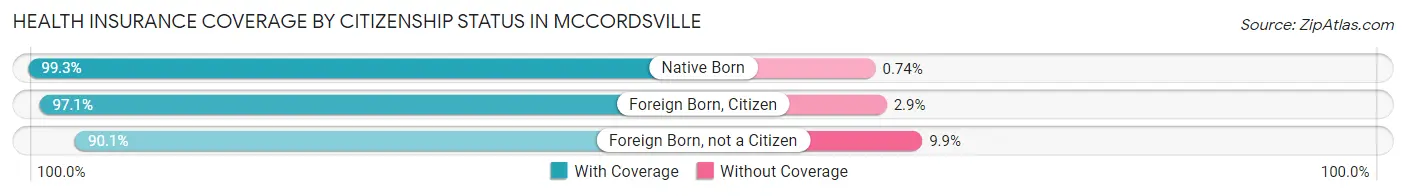
| Citizenship Status | With Coverage | Without Coverage |
| Native Born | 944 (99.3%) | 7 (0.7%) |
| Foreign Born, Citizen | 1,551 (97.1%) | 47 (2.9%) |
| Foreign Born, not a Citizen | 318 (90.1%) | 35 (9.9%) |
Health Insurance Coverage by Household Income in Mccordsville
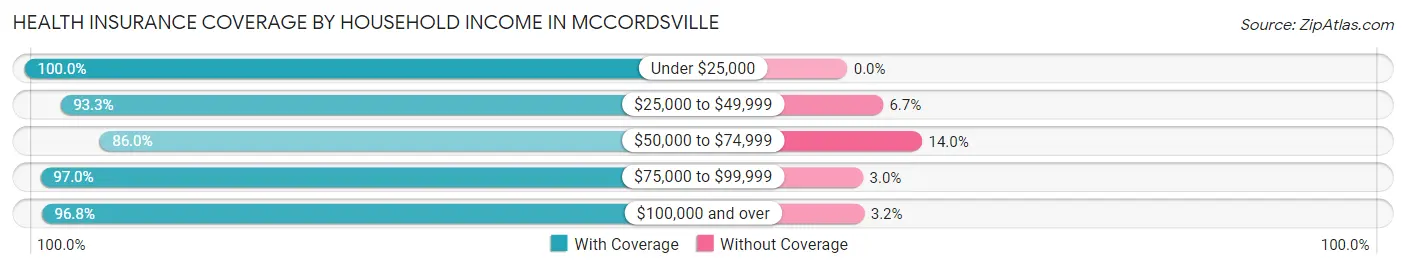
| Household Income | With Coverage | Without Coverage |
| Under $25,000 | 136 (100.0%) | 0 (0.0%) |
| $25,000 to $49,999 | 461 (93.3%) | 33 (6.7%) |
| $50,000 to $74,999 | 1,222 (86.0%) | 199 (14.0%) |
| $75,000 to $99,999 | 886 (97.0%) | 27 (3.0%) |
| $100,000 and over | 5,721 (96.8%) | 188 (3.2%) |
Public vs Private Health Insurance Coverage by Age in Mccordsville
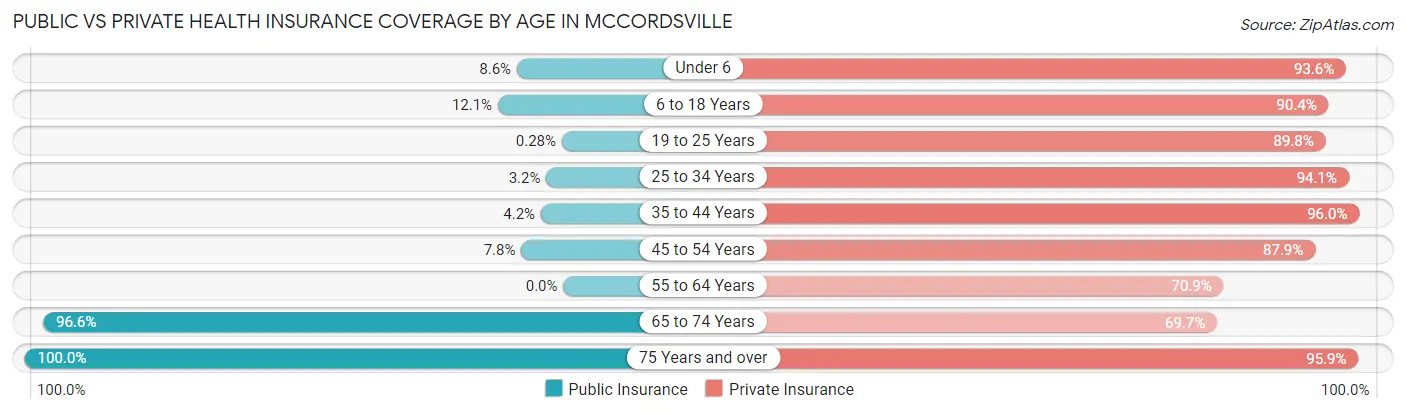
| Age Bracket | Public Insurance | Private Insurance |
| Under 6 | 82 (8.6%) | 890 (93.6%) |
| 6 to 18 Years | 194 (12.1%) | 1,444 (90.4%) |
| 19 to 25 Years | 1 (0.3%) | 317 (89.8%) |
| 25 to 34 Years | 38 (3.2%) | 1,130 (94.1%) |
| 35 to 44 Years | 64 (4.2%) | 1,478 (96.0%) |
| 45 to 54 Years | 90 (7.8%) | 1,012 (87.8%) |
| 55 to 64 Years | 0 (0.0%) | 552 (70.9%) |
| 65 to 74 Years | 929 (96.6%) | 670 (69.7%) |
| 75 Years and over | 339 (100.0%) | 325 (95.9%) |
| Total | 1,737 (19.6%) | 7,818 (88.1%) |
Disability Status by Sex by Age in Mccordsville
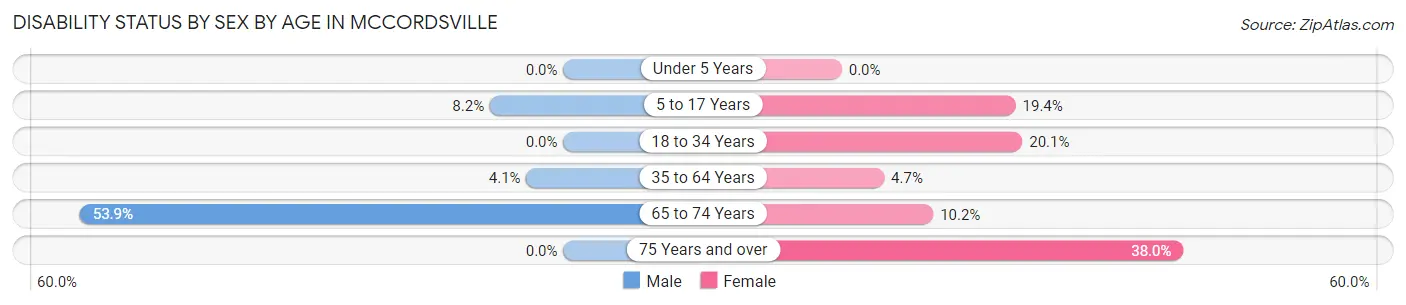
| Age Bracket | Male | Female |
| Under 5 Years | 0 (0.0%) | 0 (0.0%) |
| 5 to 17 Years | 49 (8.2%) | 181 (19.4%) |
| 18 to 34 Years | 0 (0.0%) | 167 (20.1%) |
| 35 to 64 Years | 72 (4.1%) | 81 (4.7%) |
| 65 to 74 Years | 280 (53.8%) | 45 (10.2%) |
| 75 Years and over | 0 (0.0%) | 89 (38.0%) |
Disability Class by Sex by Age in Mccordsville
Disability Class: Hearing Difficulty
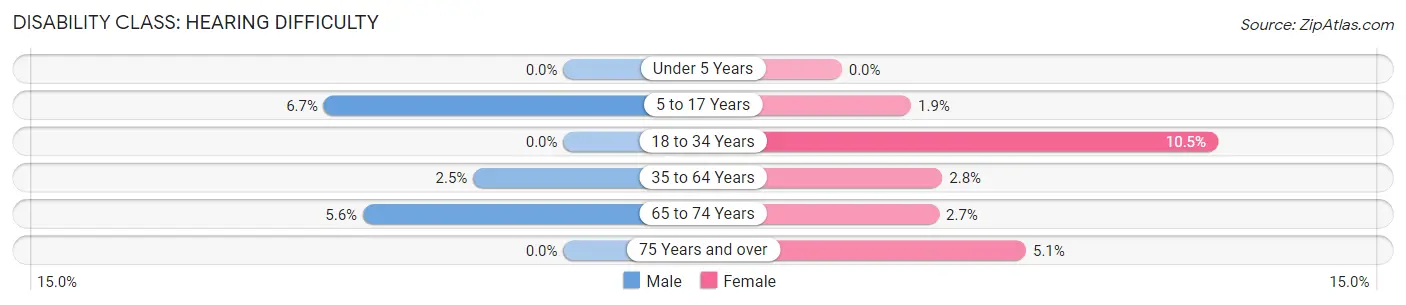
| Age Bracket | Male | Female |
| Under 5 Years | 0 (0.0%) | 0 (0.0%) |
| 5 to 17 Years | 40 (6.7%) | 18 (1.9%) |
| 18 to 34 Years | 0 (0.0%) | 87 (10.5%) |
| 35 to 64 Years | 44 (2.5%) | 48 (2.8%) |
| 65 to 74 Years | 29 (5.6%) | 12 (2.7%) |
| 75 Years and over | 0 (0.0%) | 12 (5.1%) |
Disability Class: Vision Difficulty
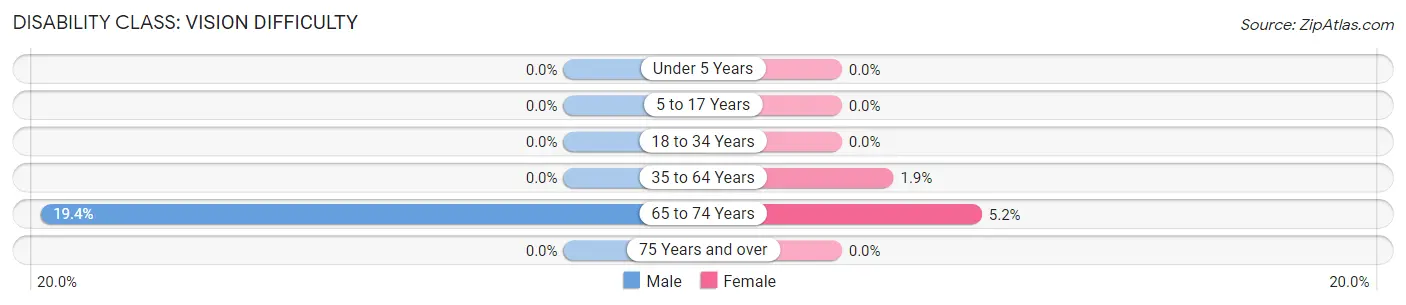
| Age Bracket | Male | Female |
| Under 5 Years | 0 (0.0%) | 0 (0.0%) |
| 5 to 17 Years | 0 (0.0%) | 0 (0.0%) |
| 18 to 34 Years | 0 (0.0%) | 0 (0.0%) |
| 35 to 64 Years | 0 (0.0%) | 33 (1.9%) |
| 65 to 74 Years | 101 (19.4%) | 23 (5.2%) |
| 75 Years and over | 0 (0.0%) | 0 (0.0%) |
Disability Class: Cognitive Difficulty
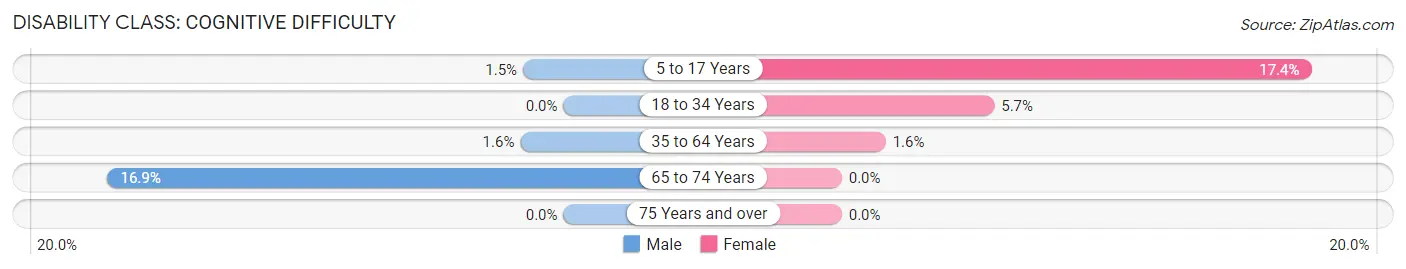
| Age Bracket | Male | Female |
| 5 to 17 Years | 9 (1.5%) | 163 (17.4%) |
| 18 to 34 Years | 0 (0.0%) | 47 (5.7%) |
| 35 to 64 Years | 28 (1.6%) | 28 (1.6%) |
| 65 to 74 Years | 88 (16.9%) | 0 (0.0%) |
| 75 Years and over | 0 (0.0%) | 0 (0.0%) |
Disability Class: Ambulatory Difficulty
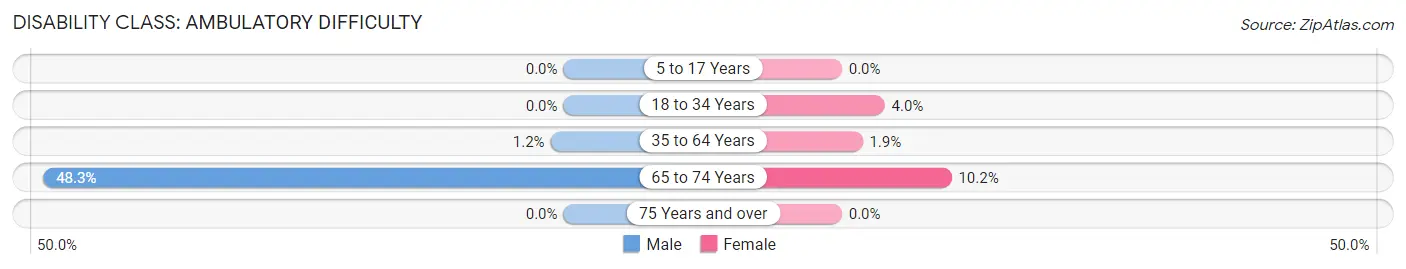
| Age Bracket | Male | Female |
| 5 to 17 Years | 0 (0.0%) | 0 (0.0%) |
| 18 to 34 Years | 0 (0.0%) | 33 (4.0%) |
| 35 to 64 Years | 21 (1.2%) | 33 (1.9%) |
| 65 to 74 Years | 251 (48.3%) | 45 (10.2%) |
| 75 Years and over | 0 (0.0%) | 0 (0.0%) |
Disability Class: Self-Care Difficulty
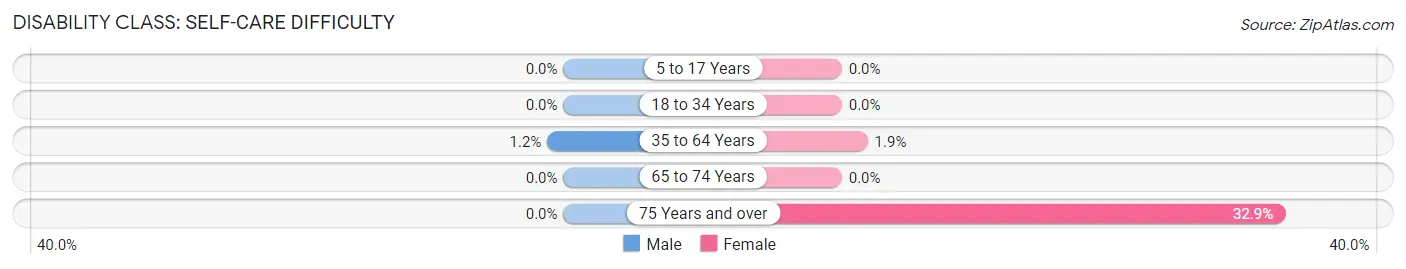
| Age Bracket | Male | Female |
| 5 to 17 Years | 0 (0.0%) | 0 (0.0%) |
| 18 to 34 Years | 0 (0.0%) | 0 (0.0%) |
| 35 to 64 Years | 21 (1.2%) | 33 (1.9%) |
| 65 to 74 Years | 0 (0.0%) | 0 (0.0%) |
| 75 Years and over | 0 (0.0%) | 77 (32.9%) |
Technology Access in Mccordsville
Computing Device Access in Mccordsville
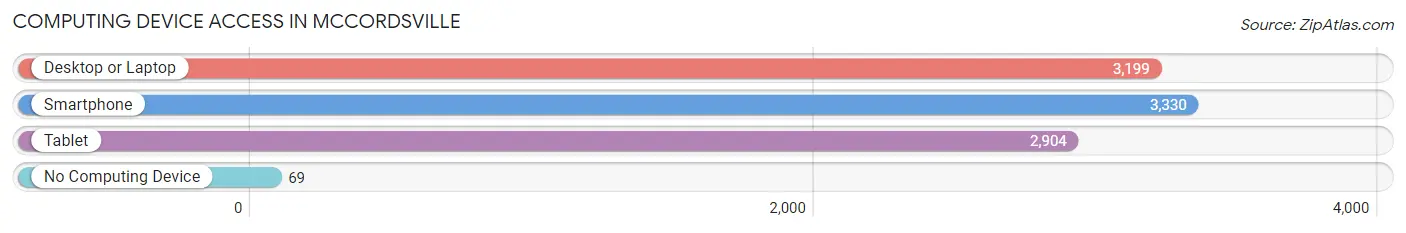
| Device Type | # Households | % Households |
| Desktop or Laptop | 3,199 | 90.9% |
| Smartphone | 3,330 | 94.7% |
| Tablet | 2,904 | 82.6% |
| No Computing Device | 69 | 2.0% |
| Total | 3,518 | 100.0% |
Internet Access in Mccordsville
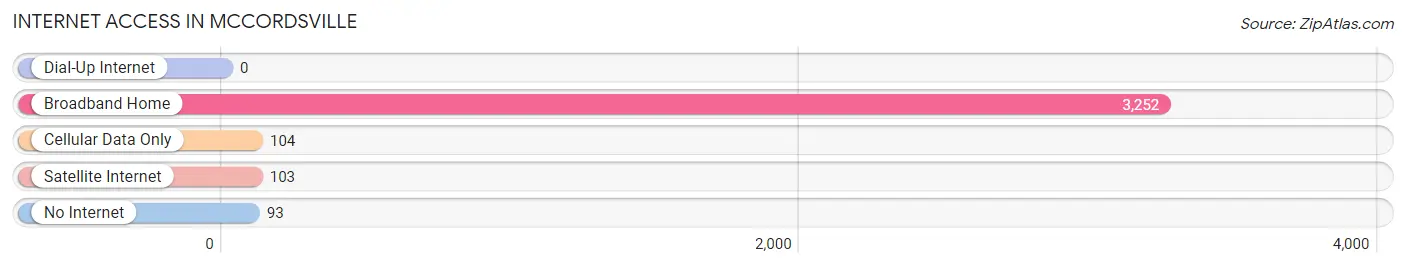
| Internet Type | # Households | % Households |
| Dial-Up Internet | 0 | 0.0% |
| Broadband Home | 3,252 | 92.4% |
| Cellular Data Only | 104 | 3.0% |
| Satellite Internet | 103 | 2.9% |
| No Internet | 93 | 2.6% |
| Total | 3,518 | 100.0% |
Mccordsville Summary
Mccordsville is a small town located in Hancock County, Indiana, United States. The town is situated in the northwest corner of the county, approximately 20 miles northeast of Indianapolis. The population of Mccordsville was estimated to be 4,845 in 2019.
History
Mccordsville was founded in 1837 by William McCord, a local farmer. The town was originally known as McCord’s Station, and was later changed to Mccordsville. The town was officially incorporated in 1871.
Mccordsville was a small farming community until the 1950s, when the population began to grow rapidly due to the growth of Indianapolis. The town has since become a bedroom community for Indianapolis, with many residents commuting to the city for work.
Geography
Mccordsville is located in the northwest corner of Hancock County, approximately 20 miles northeast of Indianapolis. The town is situated on the banks of the White River, and is surrounded by rolling hills and farmland. The town is located in the Central Till Plains region of Indiana, and has a humid continental climate.
Economy
Mccordsville’s economy is largely based on agriculture and manufacturing. The town is home to several large agricultural operations, including a dairy farm, a hog farm, and a poultry farm. The town is also home to several manufacturing companies, including a plastics manufacturer and a metal fabrication company.
The town is also home to several small businesses, including restaurants, retail stores, and service providers. The town is also home to several large employers, including a hospital, a school district, and a manufacturing plant.
Demographics
Mccordsville’s population was estimated to be 4,845 in 2019. The town has a median age of 38.7 years, and a median household income of $63,945. The town is predominantly white (93.2%), with small percentages of African American (2.3%), Hispanic (2.2%), and Asian (1.7%) residents.
Conclusion
Mccordsville is a small town located in Hancock County, Indiana, United States. The town was founded in 1837 by William McCord, and has since become a bedroom community for Indianapolis. The town’s economy is largely based on agriculture and manufacturing, and the population was estimated to be 4,845 in 2019. The town is predominantly white, with small percentages of African American, Hispanic, and Asian residents.
Common Questions
What is the Total Population of Mccordsville?
Total Population of Mccordsville is 9,098.
What is the Total Male Population of Mccordsville?
Total Male Population of Mccordsville is 4,335.
What is the Total Female Population of Mccordsville?
Total Female Population of Mccordsville is 4,763.
What is the Ratio of Males per 100 Females in Mccordsville?
There are 91.01 Males per 100 Females in Mccordsville.
What is the Ratio of Females per 100 Males in Mccordsville?
There are 109.87 Females per 100 Males in Mccordsville.
What is the Median Population Age in Mccordsville?
Median Population Age in Mccordsville is 36.4 Years.
What is the Average Family Size in Mccordsville
Average Family Size in Mccordsville is 3.0 People.
What is the Average Household Size in Mccordsville
Average Household Size in Mccordsville is 2.6 People.
What is Per Capita Income in Mccordsville?
Per Capita income in Mccordsville is $52,530.
What is the Median Family Income in Mccordsville?
Median Family Income in Mccordsville is $130,089.
What is the Median Household income in Mccordsville?
Median Household Income in Mccordsville is $103,539.
What is Income or Wage Gap in Mccordsville?
Income or Wage Gap in Mccordsville is 25.5%.
Women in Mccordsville earn 74.5 cents for every dollar earned by a man.
What is Inequality or Gini Index in Mccordsville?
Inequality or Gini Index in Mccordsville is 0.38.
How Large is the Labor Force in Mccordsville?
There are 5,089 People in the Labor Forcein in Mccordsville.
What is the Percentage of People in the Labor Force in Mccordsville?
74.5% of People are in the Labor Force in Mccordsville.
What is the Unemployment Rate in Mccordsville?
Unemployment Rate in Mccordsville is 2.7%.