Cities with the Most Immigrants from Eastern Europe in Indiana
RELATED REPORTS & OPTIONS
Eastern Europe
Indiana
Compare Cities
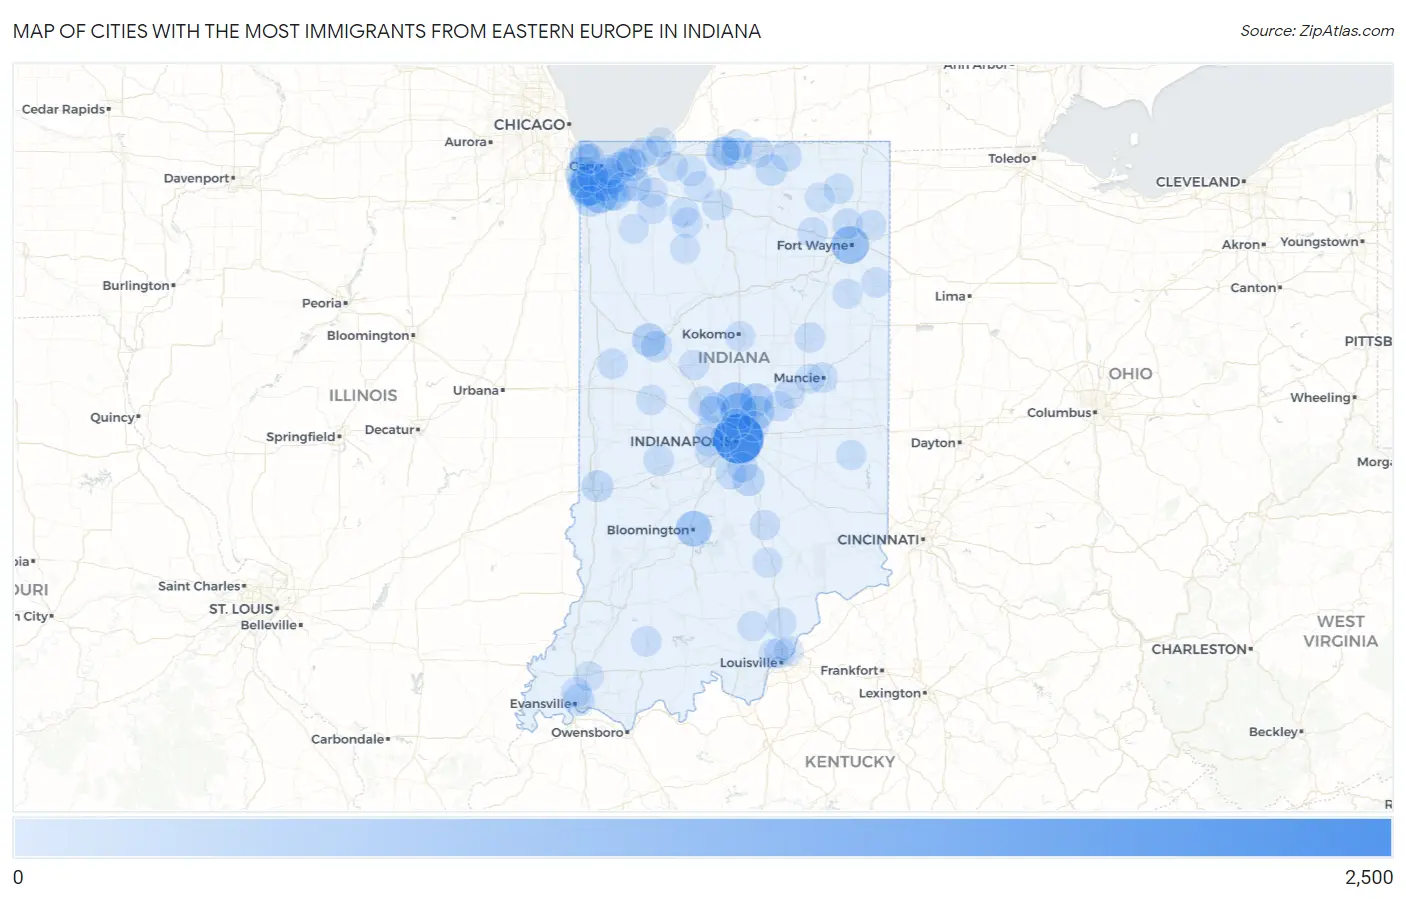
Map of Cities with the Most Immigrants from Eastern Europe in Indiana
0
2,500
Cities with the Most Immigrants from Eastern Europe in Indiana
| City | Eastern Europe | vs State | vs National | |
| 1. | Indianapolis | 2,106 | 18,710(11.26%)#1 | 2,208,794(0.10%)#115 |
| 2. | Schererville | 1,083 | 18,710(5.79%)#2 | 2,208,794(0.05%)#270 |
| 3. | Fort Wayne | 788 | 18,710(4.21%)#3 | 2,208,794(0.04%)#402 |
| 4. | Carmel | 659 | 18,710(3.52%)#4 | 2,208,794(0.03%)#475 |
| 5. | Crown Point | 659 | 18,710(3.52%)#5 | 2,208,794(0.03%)#477 |
| 6. | Bloomington | 597 | 18,710(3.19%)#6 | 2,208,794(0.03%)#521 |
| 7. | Westfield | 555 | 18,710(2.97%)#7 | 2,208,794(0.03%)#561 |
| 8. | Munster | 446 | 18,710(2.38%)#8 | 2,208,794(0.02%)#696 |
| 9. | St John | 389 | 18,710(2.08%)#9 | 2,208,794(0.02%)#776 |
| 10. | West Lafayette | 364 | 18,710(1.95%)#10 | 2,208,794(0.02%)#824 |
| 11. | Fishers | 360 | 18,710(1.92%)#11 | 2,208,794(0.02%)#833 |
| 12. | Noblesville | 358 | 18,710(1.91%)#12 | 2,208,794(0.02%)#841 |
| 13. | South Bend | 339 | 18,710(1.81%)#13 | 2,208,794(0.02%)#885 |
| 14. | Valparaiso | 305 | 18,710(1.63%)#14 | 2,208,794(0.01%)#1,004 |
| 15. | Merrillville | 273 | 18,710(1.46%)#15 | 2,208,794(0.01%)#1,098 |
| 16. | Chesterton | 256 | 18,710(1.37%)#16 | 2,208,794(0.01%)#1,168 |
| 17. | Franklin | 225 | 18,710(1.20%)#17 | 2,208,794(0.01%)#1,292 |
| 18. | Hobart | 222 | 18,710(1.19%)#18 | 2,208,794(0.01%)#1,303 |
| 19. | Portage | 209 | 18,710(1.12%)#19 | 2,208,794(0.01%)#1,371 |
| 20. | Hammond | 180 | 18,710(0.96%)#20 | 2,208,794(0.01%)#1,523 |
| 21. | Terre Haute | 178 | 18,710(0.95%)#21 | 2,208,794(0.01%)#1,534 |
| 22. | Evansville | 164 | 18,710(0.88%)#22 | 2,208,794(0.01%)#1,628 |
| 23. | Lakes Of The Four Seasons | 147 | 18,710(0.79%)#23 | 2,208,794(0.01%)#1,786 |
| 24. | Winfield | 146 | 18,710(0.78%)#24 | 2,208,794(0.01%)#1,793 |
| 25. | Lafayette | 144 | 18,710(0.77%)#25 | 2,208,794(0.01%)#1,809 |
| 26. | Goshen | 143 | 18,710(0.76%)#26 | 2,208,794(0.01%)#1,823 |
| 27. | Mishawaka | 138 | 18,710(0.74%)#27 | 2,208,794(0.01%)#1,878 |
| 28. | Dyer | 130 | 18,710(0.69%)#28 | 2,208,794(0.01%)#1,946 |
| 29. | Griffith | 125 | 18,710(0.67%)#29 | 2,208,794(0.01%)#1,993 |
| 30. | Bargersville | 113 | 18,710(0.60%)#30 | 2,208,794(0.01%)#2,135 |
| 31. | Granger | 106 | 18,710(0.57%)#31 | 2,208,794(0.00%)#2,223 |
| 32. | Cedar Lake | 100 | 18,710(0.53%)#32 | 2,208,794(0.00%)#2,298 |
| 33. | Brownsburg | 83 | 18,710(0.44%)#33 | 2,208,794(0.00%)#2,572 |
| 34. | Lawrence | 75 | 18,710(0.40%)#34 | 2,208,794(0.00%)#2,742 |
| 35. | Greencastle | 73 | 18,710(0.39%)#35 | 2,208,794(0.00%)#2,783 |
| 36. | Attica | 67 | 18,710(0.36%)#36 | 2,208,794(0.00%)#2,920 |
| 37. | Lebanon | 66 | 18,710(0.35%)#37 | 2,208,794(0.00%)#2,931 |
| 38. | Greenwood | 65 | 18,710(0.35%)#38 | 2,208,794(0.00%)#2,949 |
| 39. | Pendleton | 56 | 18,710(0.30%)#39 | 2,208,794(0.00%)#3,176 |
| 40. | Huntertown | 55 | 18,710(0.29%)#40 | 2,208,794(0.00%)#3,206 |
| 41. | Ardmore | 55 | 18,710(0.29%)#41 | 2,208,794(0.00%)#3,216 |
| 42. | Zionsville | 54 | 18,710(0.29%)#42 | 2,208,794(0.00%)#3,221 |
| 43. | Whitestown | 54 | 18,710(0.29%)#43 | 2,208,794(0.00%)#3,227 |
| 44. | La Porte | 53 | 18,710(0.28%)#44 | 2,208,794(0.00%)#3,250 |
| 45. | Middlebury | 53 | 18,710(0.28%)#45 | 2,208,794(0.00%)#3,277 |
| 46. | Jasper | 51 | 18,710(0.27%)#46 | 2,208,794(0.00%)#3,323 |
| 47. | Muncie | 50 | 18,710(0.27%)#47 | 2,208,794(0.00%)#3,350 |
| 48. | Frankfort | 49 | 18,710(0.26%)#48 | 2,208,794(0.00%)#3,390 |
| 49. | Columbia City | 49 | 18,710(0.26%)#49 | 2,208,794(0.00%)#3,399 |
| 50. | Lake Station | 47 | 18,710(0.25%)#50 | 2,208,794(0.00%)#3,465 |
| 51. | Crawfordsville | 44 | 18,710(0.24%)#51 | 2,208,794(0.00%)#3,568 |
| 52. | Clarksville | 43 | 18,710(0.23%)#52 | 2,208,794(0.00%)#3,608 |
| 53. | Kokomo | 39 | 18,710(0.21%)#53 | 2,208,794(0.00%)#3,779 |
| 54. | Plymouth | 35 | 18,710(0.19%)#54 | 2,208,794(0.00%)#3,961 |
| 55. | Upland | 35 | 18,710(0.19%)#55 | 2,208,794(0.00%)#3,977 |
| 56. | La Crosse | 35 | 18,710(0.19%)#56 | 2,208,794(0.00%)#3,992 |
| 57. | Highland | 33 | 18,710(0.18%)#57 | 2,208,794(0.00%)#4,072 |
| 58. | Henryville | 33 | 18,710(0.18%)#58 | 2,208,794(0.00%)#4,086 |
| 59. | Lyford | 33 | 18,710(0.18%)#59 | 2,208,794(0.00%)#4,096 |
| 60. | Porter | 30 | 18,710(0.16%)#60 | 2,208,794(0.00%)#4,245 |
| 61. | Bass Lake | 27 | 18,710(0.14%)#61 | 2,208,794(0.00%)#4,422 |
| 62. | Whiting | 26 | 18,710(0.14%)#62 | 2,208,794(0.00%)#4,470 |
| 63. | Trail Creek | 25 | 18,710(0.13%)#63 | 2,208,794(0.00%)#4,556 |
| 64. | Elkhart | 24 | 18,710(0.13%)#64 | 2,208,794(0.00%)#4,571 |
| 65. | East Chicago | 23 | 18,710(0.12%)#65 | 2,208,794(0.00%)#4,646 |
| 66. | Decatur | 23 | 18,710(0.12%)#66 | 2,208,794(0.00%)#4,661 |
| 67. | New Albany | 21 | 18,710(0.11%)#67 | 2,208,794(0.00%)#4,793 |
| 68. | Columbus | 20 | 18,710(0.11%)#68 | 2,208,794(0.00%)#4,886 |
| 69. | Connersville | 19 | 18,710(0.10%)#69 | 2,208,794(0.00%)#4,974 |
| 70. | Kendallville | 19 | 18,710(0.10%)#70 | 2,208,794(0.00%)#4,980 |
| 71. | Underwood | 19 | 18,710(0.10%)#71 | 2,208,794(0.00%)#5,048 |
| 72. | Anderson | 18 | 18,710(0.10%)#72 | 2,208,794(0.00%)#5,057 |
| 73. | Grabill | 18 | 18,710(0.10%)#73 | 2,208,794(0.00%)#5,151 |
| 74. | Gilmer Park | 18 | 18,710(0.10%)#74 | 2,208,794(0.00%)#5,159 |
| 75. | Foster | 18 | 18,710(0.10%)#75 | 2,208,794(0.00%)#5,165 |
| 76. | Jeffersonville | 17 | 18,710(0.09%)#76 | 2,208,794(0.00%)#5,168 |
| 77. | Walkerton | 17 | 18,710(0.09%)#77 | 2,208,794(0.00%)#5,249 |
| 78. | Shipshewana Lake | 17 | 18,710(0.09%)#78 | 2,208,794(0.00%)#5,281 |
| 79. | Avon | 16 | 18,710(0.09%)#79 | 2,208,794(0.00%)#5,290 |
| 80. | Beech Grove | 15 | 18,710(0.08%)#80 | 2,208,794(0.00%)#5,410 |
| 81. | Wanatah | 15 | 18,710(0.08%)#81 | 2,208,794(0.00%)#5,500 |
| 82. | Fish Lake | 14 | 18,710(0.07%)#82 | 2,208,794(0.00%)#5,646 |
| 83. | Plainfield | 13 | 18,710(0.07%)#83 | 2,208,794(0.00%)#5,653 |
| 84. | Seymour | 12 | 18,710(0.06%)#84 | 2,208,794(0.00%)#5,795 |
| 85. | Speedway | 12 | 18,710(0.06%)#85 | 2,208,794(0.00%)#5,805 |
| 86. | Burns Harbor | 12 | 18,710(0.06%)#86 | 2,208,794(0.00%)#5,874 |
| 87. | New Chicago | 10 | 18,710(0.05%)#87 | 2,208,794(0.00%)#6,190 |
| 88. | Yorktown | 9 | 18,710(0.05%)#88 | 2,208,794(0.00%)#6,275 |
| 89. | Knox | 9 | 18,710(0.05%)#89 | 2,208,794(0.00%)#6,323 |
| 90. | Beverly Shores | 9 | 18,710(0.05%)#90 | 2,208,794(0.00%)#6,397 |
| 91. | Michiana Shores | 9 | 18,710(0.05%)#91 | 2,208,794(0.00%)#6,403 |
| 92. | Winamac | 8 | 18,710(0.04%)#92 | 2,208,794(0.00%)#6,491 |
| 93. | Bluffton | 7 | 18,710(0.04%)#93 | 2,208,794(0.00%)#6,610 |
| 94. | Notre Dame | 7 | 18,710(0.04%)#94 | 2,208,794(0.00%)#6,625 |
| 95. | Shorewood Forest | 7 | 18,710(0.04%)#95 | 2,208,794(0.00%)#6,665 |
| 96. | New Pekin | 7 | 18,710(0.04%)#96 | 2,208,794(0.00%)#6,731 |
| 97. | Elberfeld | 7 | 18,710(0.04%)#97 | 2,208,794(0.00%)#6,742 |
| 98. | Wheatfield | 7 | 18,710(0.04%)#98 | 2,208,794(0.00%)#6,744 |
| 99. | Albion | 6 | 18,710(0.03%)#99 | 2,208,794(0.00%)#6,853 |
| 100. | Meridian Hills | 6 | 18,710(0.03%)#100 | 2,208,794(0.00%)#6,902 |
Common Questions
What are the Top 10 Cities with the Most Immigrants from Eastern Europe in Indiana?
Top 10 Cities with the Most Immigrants from Eastern Europe in Indiana are:
#1
2,106
#2
1,083
#3
788
#4
659
#5
659
#6
597
#7
555
#8
446
#9
389
#10
364
What city has the Most Immigrants from Eastern Europe in Indiana?
Indianapolis has the Most Immigrants from Eastern Europe in Indiana with 2,106.
What is the Total Immigrants from Eastern Europe in the State of Indiana?
Total Immigrants from Eastern Europe in Indiana is 18,710.
What is the Total Immigrants from Eastern Europe in the United States?
Total Immigrants from Eastern Europe in the United States is 2,208,794.