Cities with the Highest Poverty Level Among Single Mothers in Indiana
RELATED REPORTS & OPTIONS
Highest Poverty | Single Mother
Indiana
Compare Cities
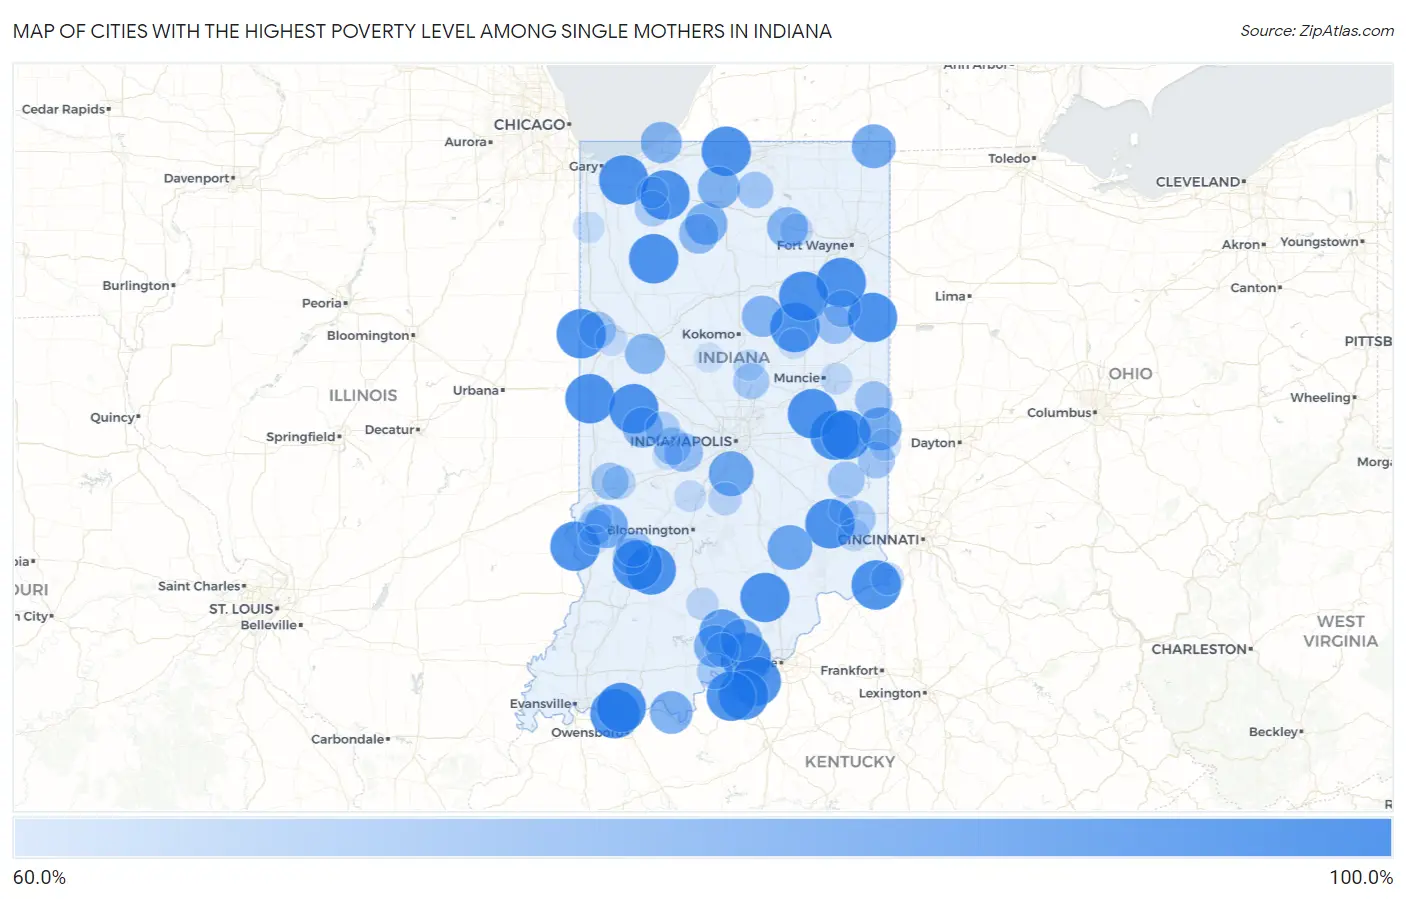
Map of Cities with the Highest Poverty Level Among Single Mothers in Indiana
0.0%
100.0%
Cities with the Highest Poverty Level Among Single Mothers in Indiana
| City | Single Mother Poverty | vs State | vs National | |
| 1. | Notre Dame | 100.0% | 35.1%(+64.9)#1 | 33.1%(+66.9)#12 |
| 2. | Salt Creek Commons | 100.0% | 35.1%(+64.9)#2 | 33.1%(+66.9)#172 |
| 3. | Jimmerson Lake | 100.0% | 35.1%(+64.9)#3 | 33.1%(+66.9)#327 |
| 4. | Francesville | 100.0% | 35.1%(+64.9)#4 | 33.1%(+66.9)#444 |
| 5. | Thayer | 100.0% | 35.1%(+64.9)#5 | 33.1%(+66.9)#647 |
| 6. | Hatfield | 100.0% | 35.1%(+64.9)#6 | 33.1%(+66.9)#678 |
| 7. | Lewis | 100.0% | 35.1%(+64.9)#7 | 33.1%(+66.9)#701 |
| 8. | Perrysville | 100.0% | 35.1%(+64.9)#8 | 33.1%(+66.9)#738 |
| 9. | Richland | 100.0% | 35.1%(+64.9)#9 | 33.1%(+66.9)#759 |
| 10. | Hanna | 100.0% | 35.1%(+64.9)#10 | 33.1%(+66.9)#769 |
| 11. | Prairieton | 100.0% | 35.1%(+64.9)#11 | 33.1%(+66.9)#788 |
| 12. | Williamsburg | 100.0% | 35.1%(+64.9)#12 | 33.1%(+66.9)#897 |
| 13. | Servia | 100.0% | 35.1%(+64.9)#13 | 33.1%(+66.9)#959 |
| 14. | Lyford | 100.0% | 35.1%(+64.9)#14 | 33.1%(+66.9)#1,050 |
| 15. | Geneva | 100.0% | 35.1%(+64.9)#15 | 33.1%(+66.9)#1,132 |
| 16. | Crane | 100.0% | 35.1%(+64.9)#16 | 33.1%(+66.9)#1,203 |
| 17. | Napoleon | 100.0% | 35.1%(+64.9)#17 | 33.1%(+66.9)#1,221 |
| 18. | Hartz Lake | 100.0% | 35.1%(+64.9)#18 | 33.1%(+66.9)#1,233 |
| 19. | Brimfield | 100.0% | 35.1%(+64.9)#19 | 33.1%(+66.9)#1,308 |
| 20. | Crandall | 100.0% | 35.1%(+64.9)#20 | 33.1%(+66.9)#1,322 |
| 21. | Liberty Mills | 100.0% | 35.1%(+64.9)#21 | 33.1%(+66.9)#1,333 |
| 22. | Ambia | 100.0% | 35.1%(+64.9)#22 | 33.1%(+66.9)#1,335 |
| 23. | Uniondale | 100.0% | 35.1%(+64.9)#23 | 33.1%(+66.9)#1,355 |
| 24. | Little York | 100.0% | 35.1%(+64.9)#24 | 33.1%(+66.9)#1,366 |
| 25. | Straughn | 100.0% | 35.1%(+64.9)#25 | 33.1%(+66.9)#1,382 |
| 26. | Marion | 100.0% | 35.1%(+64.9)#26 | 33.1%(+66.9)#1,403 |
| 27. | Cadiz | 100.0% | 35.1%(+64.9)#27 | 33.1%(+66.9)#1,474 |
| 28. | Centerton | 100.0% | 35.1%(+64.9)#28 | 33.1%(+66.9)#1,484 |
| 29. | Mount Etna | 100.0% | 35.1%(+64.9)#29 | 33.1%(+66.9)#1,490 |
| 30. | Merom | 100.0% | 35.1%(+64.9)#30 | 33.1%(+66.9)#1,495 |
| 31. | Deer Creek | 100.0% | 35.1%(+64.9)#31 | 33.1%(+66.9)#1,533 |
| 32. | Eugene | 100.0% | 35.1%(+64.9)#32 | 33.1%(+66.9)#1,553 |
| 33. | Newberry | 100.0% | 35.1%(+64.9)#33 | 33.1%(+66.9)#1,622 |
| 34. | Elizabeth | 100.0% | 35.1%(+64.9)#34 | 33.1%(+66.9)#1,668 |
| 35. | Grayford | 100.0% | 35.1%(+64.9)#35 | 33.1%(+66.9)#1,673 |
| 36. | Mount Auburn | 100.0% | 35.1%(+64.9)#36 | 33.1%(+66.9)#1,776 |
| 37. | Hobbs | 100.0% | 35.1%(+64.9)#37 | 33.1%(+66.9)#1,780 |
| 38. | Cross Plains | 100.0% | 35.1%(+64.9)#38 | 33.1%(+66.9)#1,788 |
| 39. | Florence | 100.0% | 35.1%(+64.9)#39 | 33.1%(+66.9)#1,814 |
| 40. | Laconia | 100.0% | 35.1%(+64.9)#40 | 33.1%(+66.9)#1,870 |
| 41. | Mauckport | 100.0% | 35.1%(+64.9)#41 | 33.1%(+66.9)#1,885 |
| 42. | Alamo | 100.0% | 35.1%(+64.9)#42 | 33.1%(+66.9)#1,893 |
| 43. | Burney | 100.0% | 35.1%(+64.9)#43 | 33.1%(+66.9)#1,953 |
| 44. | Hardinsburg | 93.3% | 35.1%(+58.2)#44 | 33.1%(+60.2)#2,060 |
| 45. | Bargersville | 90.4% | 35.1%(+55.4)#45 | 33.1%(+57.3)#2,151 |
| 46. | Country Squire Lakes | 90.2% | 35.1%(+55.1)#46 | 33.1%(+57.0)#2,157 |
| 47. | Fremont | 88.5% | 35.1%(+53.4)#47 | 33.1%(+55.3)#2,243 |
| 48. | Hymera | 87.8% | 35.1%(+52.7)#48 | 33.1%(+54.7)#2,263 |
| 49. | Spring Grove | 87.0% | 35.1%(+51.9)#49 | 33.1%(+53.8)#2,311 |
| 50. | Cannelton | 86.1% | 35.1%(+51.0)#50 | 33.1%(+53.0)#2,348 |
| 51. | Culver | 85.2% | 35.1%(+50.1)#51 | 33.1%(+52.0)#2,423 |
| 52. | Marengo | 85.2% | 35.1%(+50.1)#52 | 33.1%(+52.0)#2,424 |
| 53. | Palmyra | 84.8% | 35.1%(+49.8)#53 | 33.1%(+51.7)#2,441 |
| 54. | La Paz | 84.6% | 35.1%(+49.5)#54 | 33.1%(+51.5)#2,457 |
| 55. | Michiana Shores | 83.3% | 35.1%(+48.2)#55 | 33.1%(+50.2)#2,526 |
| 56. | Amboy | 83.3% | 35.1%(+48.2)#56 | 33.1%(+50.2)#2,527 |
| 57. | Pierceton | 82.4% | 35.1%(+47.3)#57 | 33.1%(+49.2)#2,594 |
| 58. | Russellville | 81.5% | 35.1%(+46.4)#58 | 33.1%(+48.3)#2,668 |
| 59. | Shadeland | 81.2% | 35.1%(+46.2)#59 | 33.1%(+48.1)#2,673 |
| 60. | Monterey | 80.0% | 35.1%(+44.9)#60 | 33.1%(+46.9)#2,767 |
| 61. | Amo | 77.8% | 35.1%(+42.7)#61 | 33.1%(+44.6)#2,939 |
| 62. | Montpelier | 76.5% | 35.1%(+41.4)#62 | 33.1%(+43.3)#3,051 |
| 63. | Lynn | 75.7% | 35.1%(+40.6)#63 | 33.1%(+42.5)#3,117 |
| 64. | Heritage Lake | 75.3% | 35.1%(+40.3)#64 | 33.1%(+42.2)#3,136 |
| 65. | Seelyville | 75.0% | 35.1%(+39.9)#65 | 33.1%(+41.9)#3,172 |
| 66. | Poneto | 75.0% | 35.1%(+39.9)#66 | 33.1%(+41.9)#3,238 |
| 67. | Laurel | 74.6% | 35.1%(+39.5)#67 | 33.1%(+41.5)#3,256 |
| 68. | Liberty | 74.3% | 35.1%(+39.2)#68 | 33.1%(+41.2)#3,277 |
| 69. | Boswell | 74.3% | 35.1%(+39.2)#69 | 33.1%(+41.2)#3,281 |
| 70. | Nappanee | 73.8% | 35.1%(+38.7)#70 | 33.1%(+40.7)#3,319 |
| 71. | Sunman | 73.7% | 35.1%(+38.6)#71 | 33.1%(+40.5)#3,330 |
| 72. | Lyons | 73.7% | 35.1%(+38.6)#72 | 33.1%(+40.5)#3,338 |
| 73. | Switz City | 73.3% | 35.1%(+38.2)#73 | 33.1%(+40.2)#3,371 |
| 74. | Arcadia | 72.9% | 35.1%(+37.8)#74 | 33.1%(+39.8)#3,398 |
| 75. | Leavenworth | 72.7% | 35.1%(+37.6)#75 | 33.1%(+39.6)#3,437 |
| 76. | Shelburn | 72.4% | 35.1%(+37.4)#76 | 33.1%(+39.3)#3,474 |
| 77. | La Crosse | 71.4% | 35.1%(+36.3)#77 | 33.1%(+38.3)#3,575 |
| 78. | Roachdale | 69.8% | 35.1%(+34.7)#78 | 33.1%(+36.7)#3,765 |
| 79. | Milltown | 69.2% | 35.1%(+34.1)#79 | 33.1%(+36.1)#3,820 |
| 80. | Staunton | 68.2% | 35.1%(+33.1)#80 | 33.1%(+35.0)#3,938 |
| 81. | Morgantown | 67.3% | 35.1%(+32.2)#81 | 33.1%(+34.2)#4,008 |
| 82. | Larwill | 66.7% | 35.1%(+31.6)#82 | 33.1%(+33.5)#4,146 |
| 83. | Johnson | 66.7% | 35.1%(+31.6)#83 | 33.1%(+33.5)#4,161 |
| 84. | Patriot | 66.7% | 35.1%(+31.6)#84 | 33.1%(+33.5)#4,208 |
| 85. | Orleans | 66.2% | 35.1%(+31.1)#85 | 33.1%(+33.0)#4,277 |
| 86. | Milan | 66.0% | 35.1%(+30.9)#86 | 33.1%(+32.9)#4,294 |
| 87. | Boston | 65.0% | 35.1%(+29.9)#87 | 33.1%(+31.9)#4,400 |
| 88. | Selma | 64.6% | 35.1%(+29.5)#88 | 33.1%(+31.4)#4,451 |
| 89. | Paragon | 64.3% | 35.1%(+29.2)#89 | 33.1%(+31.2)#4,493 |
| 90. | Pine Village | 64.3% | 35.1%(+29.2)#90 | 33.1%(+31.2)#4,499 |
| 91. | Wanatah | 64.0% | 35.1%(+28.9)#91 | 33.1%(+30.9)#4,523 |
| 92. | Tipton | 63.9% | 35.1%(+28.8)#92 | 33.1%(+30.8)#4,532 |
| 93. | Schneider | 63.6% | 35.1%(+28.5)#93 | 33.1%(+30.5)#4,602 |
| 94. | Farmersburg | 63.3% | 35.1%(+28.2)#94 | 33.1%(+30.2)#4,625 |
| 95. | Fairmount | 62.7% | 35.1%(+27.6)#95 | 33.1%(+29.6)#4,711 |
| 96. | Batesville | 61.8% | 35.1%(+26.7)#96 | 33.1%(+28.7)#4,839 |
| 97. | Fillmore | 61.5% | 35.1%(+26.5)#97 | 33.1%(+28.4)#4,879 |
| 98. | Michigantown | 61.1% | 35.1%(+26.0)#98 | 33.1%(+28.0)#4,937 |
| 99. | Sullivan | 61.1% | 35.1%(+26.0)#99 | 33.1%(+27.9)#4,944 |
| 100. | Gilmer Park | 60.9% | 35.1%(+25.8)#100 | 33.1%(+27.7)#4,974 |
Common Questions
What are the Top 10 Cities with the Highest Poverty Level Among Single Mothers in Indiana?
Top 10 Cities with the Highest Poverty Level Among Single Mothers in Indiana are:
#1
100.0%
#2
100.0%
#3
100.0%
#4
100.0%
#5
100.0%
#6
100.0%
#7
100.0%
#8
100.0%
#9
100.0%
#10
100.0%
What city has the Highest Poverty Level Among Single Mothers in Indiana?
Notre Dame has the Highest Poverty Level Among Single Mothers in Indiana with 100.0%.
What is the Poverty Level Among Single Mothers in the State of Indiana?
Poverty Level Among Single Mothers in Indiana is 35.1%.
What is the Poverty Level Among Single Mothers in the United States?
Poverty Level Among Single Mothers in the United States is 33.1%.