Cities with the Highest Percentage of Immigrants from Ukraine in Indiana

RELATED REPORTS & OPTIONS

Ukraine
Population
Families and Households
Female Fertility
Female Fertility (Unmarried)
Race (Community Size)
Race (Percentage)
Ancestry (Community Size)
AfghanAfricanAlaska NativeAlaskan AthabascanAlbanianAleutAlsatianAmericanApacheArabArapahoArgentineanArmenianAssyrian / Chaldean / SyriacAustralianAustrianBahamianBangladeshiBarbadianBasqueBelgianBelizeanBermudanBhutaneseBlackfeetBolivianBrazilianBritishBritish West IndianBulgarianBurmeseCajunCambodianCanadianCape VerdeanCarpatho RusynCelticCentral AmericanCentral American IndianCherokeeCheyenneChickasawChileanChineseChippewaChoctawColombianColvilleComancheCosta RicanCreeCreekCroatianCrowCubanCypriotCzechCzechoslovakianDanishDelawareDominicanDutchDutch West IndianEastern EuropeanEcuadorianEgyptianEnglishEstonianEthiopianEuropeanFijianFilipinoFinnishFrenchFrench American IndianFrench CanadianGermanGerman RussianGhanaianGreekGuamanian / ChamorroGuatemalanGuyaneseHaitianHmongHonduranHopiHoumaHungarianIcelanderIndian (Asian)IndonesianInupiatIranianIraqiIrishIroquoisIsraeliItalianJamaicanJapaneseJordanianKenyanKiowaKoreanLaotianLatvianLebaneseLiberianLithuanianLumbeeLuxembourgerMacedonianMalaysianMalteseMarshalleseMenomineeMexicanMexican American IndianMongolianMoroccanNative HawaiianNavajoNepaleseNew ZealanderNicaraguanNigerianNorthern EuropeanNorwegianOkinawanOsageOttawaPaiutePakistaniPalestinianPanamanianParaguayanPennsylvania GermanPeruvianPimaPolishPortuguesePotawatomiPuebloPuerto RicanPuget Sound SalishRomanianRussianSalvadoranSamoanScandinavianScotch-IrishScottishSeminoleSenegaleseSerbianShoshoneSierra LeoneanSiouxSlavicSlovakSloveneSomaliSouth AfricanSouth AmericanSouth American IndianSoviet UnionSpaniardSpanishSpanish AmericanSpanish American IndianSri LankanSubsaharan AfricanSudaneseSwedishSwissSyrianTaiwaneseThaiTlingit-HaidaTohono O'OdhamTonganTrinidadian and TobagonianTsimshianTurkishU.S. Virgin IslanderUgandanUkrainianUruguayanUteVenezuelanVietnameseWelshWest IndianYakamaYaquiYugoslavianYumanYup'ikZimbabwean
Ancestry (Percentage)
AfghanAfricanAlaska NativeAlaskan AthabascanAlbanianAleutAlsatianAmericanApacheArabArapahoArgentineanArmenianAssyrian / Chaldean / SyriacAustralianAustrianBahamianBangladeshiBarbadianBasqueBelgianBelizeanBermudanBhutaneseBlackfeetBolivianBrazilianBritishBritish West IndianBulgarianBurmeseCajunCambodianCanadianCape VerdeanCarpatho RusynCelticCentral AmericanCentral American IndianCherokeeCheyenneChickasawChileanChineseChippewaChoctawColombianColvilleComancheCosta RicanCreeCreekCroatianCrowCubanCypriotCzechCzechoslovakianDanishDelawareDominicanDutchDutch West IndianEastern EuropeanEcuadorianEgyptianEnglishEstonianEthiopianEuropeanFijianFilipinoFinnishFrenchFrench American IndianFrench CanadianGermanGerman RussianGhanaianGreekGuamanian / ChamorroGuatemalanGuyaneseHaitianHmongHonduranHopiHoumaHungarianIcelanderIndian (Asian)IndonesianInupiatIranianIraqiIrishIroquoisIsraeliItalianJamaicanJapaneseJordanianKenyanKiowaKoreanLaotianLatvianLebaneseLiberianLithuanianLumbeeLuxembourgerMacedonianMalaysianMalteseMarshalleseMenomineeMexicanMexican American IndianMongolianMoroccanNative HawaiianNavajoNepaleseNew ZealanderNicaraguanNigerianNorthern EuropeanNorwegianOkinawanOsageOttawaPaiutePakistaniPalestinianPanamanianParaguayanPennsylvania GermanPeruvianPimaPolishPortuguesePotawatomiPuebloPuerto RicanPuget Sound SalishRomanianRussianSalvadoranSamoanScandinavianScotch-IrishScottishSeminoleSenegaleseSerbianShoshoneSierra LeoneanSiouxSlavicSlovakSloveneSomaliSouth AfricanSouth AmericanSouth American IndianSoviet UnionSpaniardSpanishSpanish AmericanSpanish American IndianSri LankanSubsaharan AfricanSudaneseSwedishSwissSyrianTaiwaneseThaiTlingit-HaidaTohono O'OdhamTonganTrinidadian and TobagonianTsimshianTurkishU.S. Virgin IslanderUgandanUkrainianUruguayanUteVenezuelanVietnameseWelshWest IndianYakamaYaquiYugoslavianYumanYup'ikZimbabwean
Immigrant Origin (Total)
AfghanistanAfricaAlbaniaArgentinaArmeniaAsiaAustraliaAustriaAzoresBahamasBangladeshBarbadosBelarusBelgiumBelizeBoliviaBosnia and HerzegovinaBrazilBulgariaBurma / MyanmarCabo VerdeCambodiaCameroonCanadaCaribbeanCentral AmericaChileChinaColombiaCongoCosta RicaCroatiaCubaCzechoslovakiaDenmarkDominicaDominican RepublicEastern AfricaEastern AsiaEastern EuropeEcuadorEgyptEl SalvadorEnglandEritreaEthiopiaEuropeFijiFranceGermanyGhanaGreeceGrenadaGuatemalaGuyanaHaitiHondurasHong KongHungaryIndiaIndonesiaIranIraqIrelandIsraelItalyJamaicaJapanJordanKazakhstanKenyaKoreaKuwaitLaosLatin AmericaLatviaLebanonLiberiaLithuaniaMalaysiaMexicoMicronesiaMiddle AfricaMoldovaMoroccoNepalNetherlandsNicaraguaNigeriaNorth MacedoniaNorthern AfricaNorthern EuropeNorwayOceaniaPakistanPanamaPeruPhilippinesPolandPortugalRomaniaRussiaSaudi ArabiaScotlandSenegalSerbiaSierra LeoneSingaporeSomaliaSouth AfricaSouth AmericaSouth Central AsiaSouth Eastern AsiaSouthern EuropeSpainSri LankaSt. Vincent and the GrenadinesSudanSwedenSwitzerlandSyriaTaiwanThailandTrinidad and TobagoTurkeyUgandaUkraineUruguayUzbekistanVenezuelaVietnamWest IndiesWestern AfricaWestern AsiaWestern EuropeYemenZaireZimbabwe
Immigrant Origin (Percentage)
AfghanistanAfricaAlbaniaArgentinaArmeniaAsiaAustraliaAustriaAzoresBahamasBangladeshBarbadosBelarusBelgiumBelizeBoliviaBosnia and HerzegovinaBrazilBulgariaBurma / MyanmarCabo VerdeCambodiaCameroonCanadaCaribbeanCentral AmericaChileChinaColombiaCongoCosta RicaCroatiaCubaCzechoslovakiaDenmarkDominicaDominican RepublicEastern AfricaEastern AsiaEastern EuropeEcuadorEgyptEl SalvadorEnglandEritreaEthiopiaEuropeFijiFranceGermanyGhanaGreeceGrenadaGuatemalaGuyanaHaitiHondurasHong KongHungaryIndiaIndonesiaIranIraqIrelandIsraelItalyJamaicaJapanJordanKazakhstanKenyaKoreaKuwaitLaosLatin AmericaLatviaLebanonLiberiaLithuaniaMalaysiaMexicoMicronesiaMiddle AfricaMoldovaMoroccoNepalNetherlandsNicaraguaNigeriaNorth MacedoniaNorthern AfricaNorthern EuropeNorwayOceaniaPakistanPanamaPeruPhilippinesPolandPortugalRomaniaRussiaSaudi ArabiaScotlandSenegalSerbiaSierra LeoneSingaporeSomaliaSouth AfricaSouth AmericaSouth Central AsiaSouth Eastern AsiaSouthern EuropeSpainSri LankaSt. Vincent and the GrenadinesSudanSwedenSwitzerlandSyriaTaiwanThailandTrinidad and TobagoTurkeyUgandaUkraineUruguayUzbekistanVenezuelaVietnamWest IndiesWestern AfricaWestern AsiaWestern EuropeYemenZaireZimbabwe
Income
Income (Families)
Income (Households)
Poverty
Poverty (Families)
Unemployment
Employment Occupations
Employment Industries
Employer Class
Commute Time
Commute Means
School Enrollment
Education by Degree Field
Occupancy
Finances
Physical Characteristics
Indiana
Compare Cities
Comparison Subject

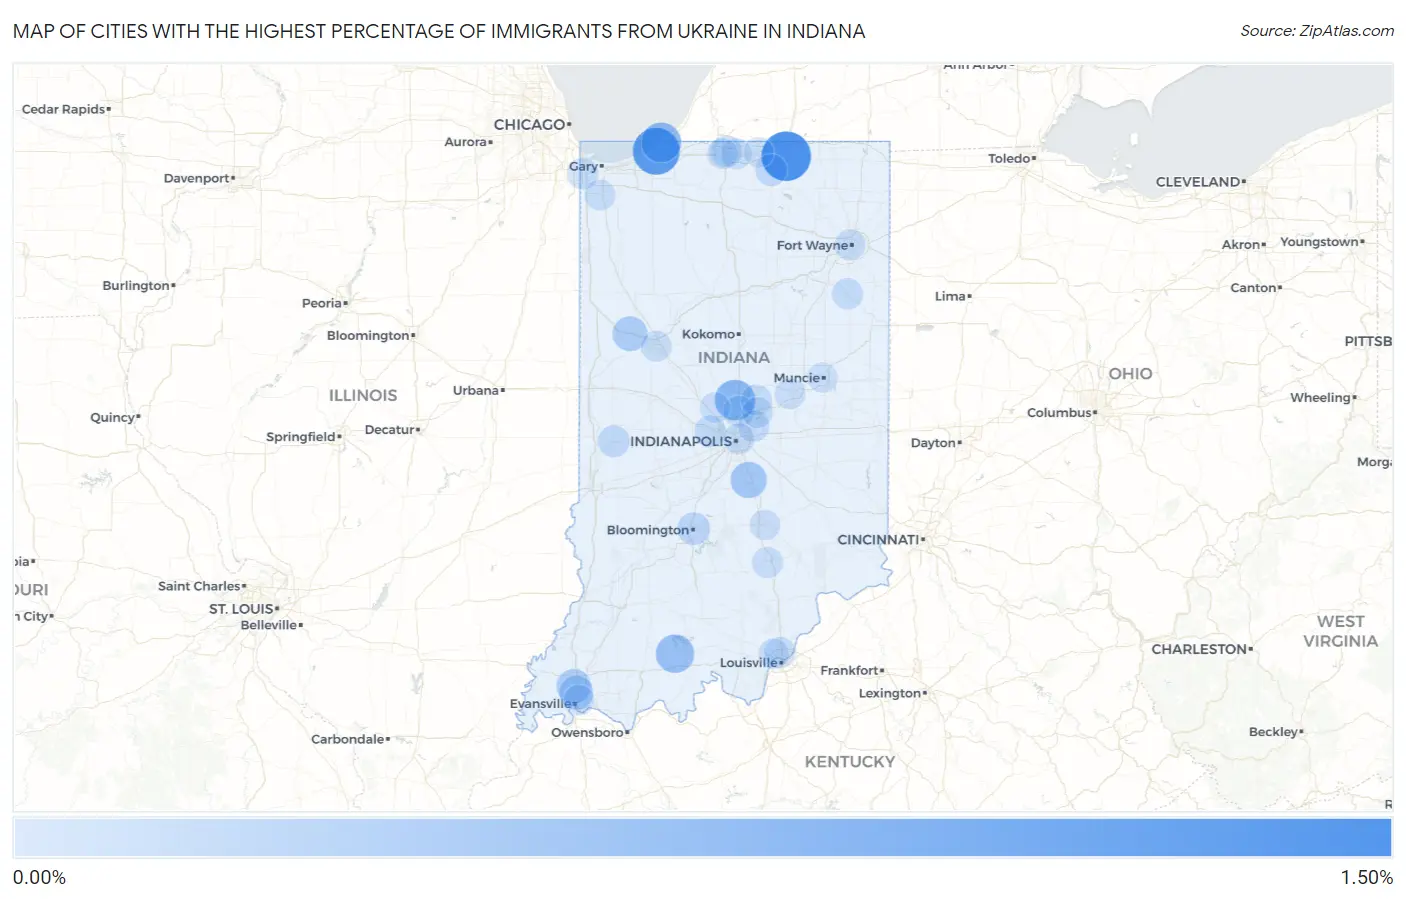
Map of Cities with the Highest Percentage of Immigrants from Ukraine in Indiana

0.00%
1.50%
Cities with the Highest Percentage of Immigrants from Ukraine in Indiana Map

Cities with the Highest Percentage of Immigrants from Ukraine in Indiana

City Ukraine vs State vs National
1.Middlebury1.44%0.036%(+1.41)#10.12%(+1.33)#229
2.Trail Creek1.24%0.036%(+1.20)#20.12%(+1.12)#277
3.Westfield0.75%0.036%(+0.714)#30.12%(+0.634)#473
4.Michiana Shores0.71%0.036%(+0.678)#40.12%(+0.599)#499
5.Birdseye0.59%0.036%(+0.552)#50.12%(+0.472)#617
6.Franklin0.44%0.036%(+0.401)#60.12%(+0.321)#814
7.Otterbein0.33%0.036%(+0.299)#70.12%(+0.219)#1,013
8.Darmstadt0.32%0.036%(+0.281)#80.12%(+0.201)#1,054
9.Highland0.29%0.036%(+0.250)#90.12%(+0.170)#1,121
10.Bloomington0.18%0.036%(+0.140)#100.12%(+0.060)#1,514
11.Goshen0.13%0.036%(+0.091)#110.12%(+0.011)#1,751
12.Rockville0.12%0.036%(+0.082)#120.12%(+0.002)#1,805
13.Notre Dame0.11%0.036%(+0.072)#130.12%(-0.008)#1,876
14.Brownsburg0.088%0.036%(+0.052)#140.12%(-0.027)#2,007
15.Munster0.067%0.036%(+0.031)#150.12%(-0.048)#2,187
16.Bluffton0.067%0.036%(+0.031)#160.12%(-0.049)#2,194
17.Carmel0.065%0.036%(+0.029)#170.12%(-0.050)#2,213
18.Lawrence0.065%0.036%(+0.029)#180.12%(-0.051)#2,218
19.Noblesville0.060%0.036%(+0.024)#190.12%(-0.056)#2,269
20.Clarksville0.059%0.036%(+0.023)#200.12%(-0.057)#2,278
21.Indianapolis0.057%0.036%(+0.021)#210.12%(-0.058)#2,288
22.Seymour0.056%0.036%(+0.020)#220.12%(-0.060)#2,297
23.Fishers0.050%0.036%(+0.014)#230.12%(-0.065)#2,352
24.Crown Point0.050%0.036%(+0.014)#240.12%(-0.065)#2,353
25.Fort Wayne0.044%0.036%(+0.008)#250.12%(-0.072)#2,411
26.Mishawaka0.041%0.036%(+0.005)#260.12%(-0.075)#2,446
27.Lafayette0.041%0.036%(+0.005)#270.12%(-0.075)#2,450
28.South Bend0.037%0.036%(+0.001)#280.12%(-0.079)#2,492
29.Anderson0.033%0.036%(-0.003)#290.12%(-0.083)#2,547
30.Evansville0.032%0.036%(-0.004)#300.12%(-0.084)#2,560
31.Zionsville0.029%0.036%(-0.007)#310.12%(-0.087)#2,589
32.New Albany0.019%0.036%(-0.017)#320.12%(-0.097)#2,710
33.Columbus0.018%0.036%(-0.018)#330.12%(-0.098)#2,722
34.Elkhart0.0056%0.036%(-0.031)#340.12%(-0.110)#2,846
35.Muncie0.0015%0.036%(-0.035)#350.12%(-0.114)#2,864

Common Questions

What are the Top 10 Cities with the Highest Percentage of Immigrants from Ukraine in Indiana?
Top 10 Cities with the Highest Percentage of Immigrants from Ukraine in Indiana are:
#1
1.44%
#2
1.24%
#3
0.75%
#4
0.71%
#5
0.59%
#6
0.44%
#7
0.33%
#8
0.32%
#9
0.29%
#10
0.18%
What city has the Highest Percentage of Immigrants from Ukraine in Indiana?
Middlebury has the Highest Percentage of Immigrants from Ukraine in Indiana with 1.44%.
What is the Percentage of Immigrants from Ukraine in the State of Indiana?
Percentage of Immigrants from Ukraine in Indiana is 0.036%.
What is the Percentage of Immigrants from Ukraine in the United States?
Percentage of Immigrants from Ukraine in the United States is 0.12%.