Cities with the Most Immigrants from Eastern Africa in Indiana
RELATED REPORTS & OPTIONS
Eastern Africa
Indiana
Compare Cities
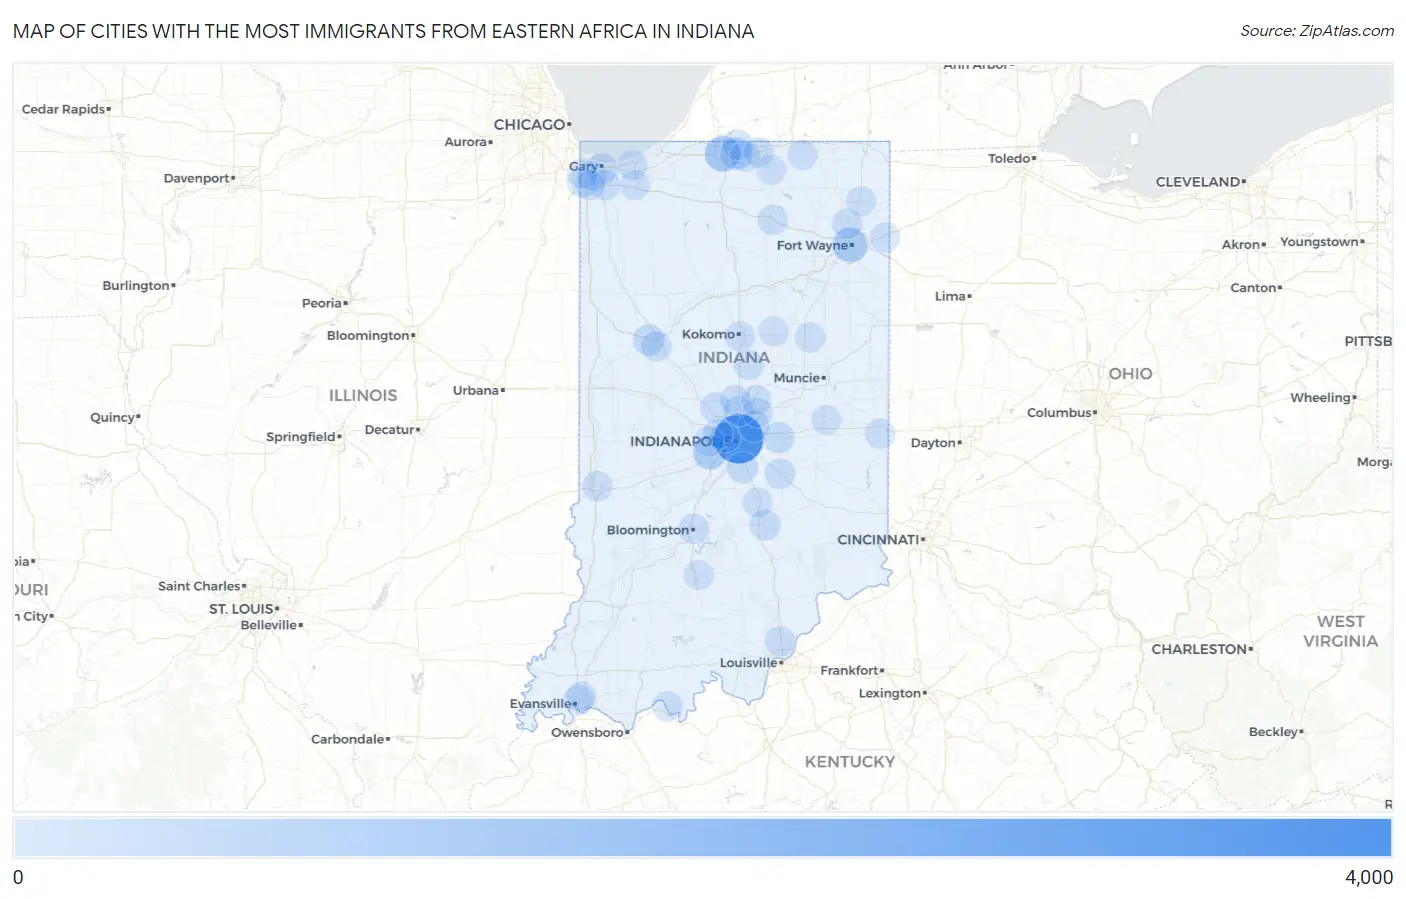
Map of Cities with the Most Immigrants from Eastern Africa in Indiana
0
4,000
Cities with the Most Immigrants from Eastern Africa in Indiana
| City | Eastern Africa | vs State | vs National | |
| 1. | Indianapolis | 3,438 | 9,576(35.90%)#1 | 752,337(0.46%)#32 |
| 2. | South Bend | 898 | 9,576(9.38%)#2 | 752,337(0.12%)#136 |
| 3. | Fort Wayne | 799 | 9,576(8.34%)#3 | 752,337(0.11%)#156 |
| 4. | Plainfield | 660 | 9,576(6.89%)#4 | 752,337(0.09%)#188 |
| 5. | Mishawaka | 374 | 9,576(3.91%)#5 | 752,337(0.05%)#306 |
| 6. | Greenfield | 224 | 9,576(2.34%)#6 | 752,337(0.03%)#488 |
| 7. | West Lafayette | 214 | 9,576(2.23%)#7 | 752,337(0.03%)#510 |
| 8. | Lawrence | 195 | 9,576(2.04%)#8 | 752,337(0.03%)#547 |
| 9. | Greenwood | 187 | 9,576(1.95%)#9 | 752,337(0.02%)#561 |
| 10. | Gary | 137 | 9,576(1.43%)#10 | 752,337(0.02%)#711 |
| 11. | Columbus | 132 | 9,576(1.38%)#11 | 752,337(0.02%)#738 |
| 12. | Shelbyville | 87 | 9,576(0.91%)#12 | 752,337(0.01%)#971 |
| 13. | Warsaw | 58 | 9,576(0.61%)#13 | 752,337(0.01%)#1,261 |
| 14. | Huntertown | 57 | 9,576(0.60%)#14 | 752,337(0.01%)#1,277 |
| 15. | Carmel | 56 | 9,576(0.58%)#15 | 752,337(0.01%)#1,280 |
| 16. | Bloomington | 56 | 9,576(0.58%)#16 | 752,337(0.01%)#1,282 |
| 17. | Lafayette | 47 | 9,576(0.49%)#17 | 752,337(0.01%)#1,418 |
| 18. | Speedway | 39 | 9,576(0.41%)#18 | 752,337(0.01%)#1,557 |
| 19. | Zionsville | 38 | 9,576(0.40%)#19 | 752,337(0.01%)#1,573 |
| 20. | Granger | 37 | 9,576(0.39%)#20 | 752,337(0.00%)#1,595 |
| 21. | Tell City | 36 | 9,576(0.38%)#21 | 752,337(0.00%)#1,626 |
| 22. | Merrillville | 34 | 9,576(0.36%)#22 | 752,337(0.00%)#1,658 |
| 23. | Avon | 34 | 9,576(0.36%)#23 | 752,337(0.00%)#1,660 |
| 24. | Kokomo | 32 | 9,576(0.33%)#24 | 752,337(0.00%)#1,707 |
| 25. | Sellersburg | 32 | 9,576(0.33%)#25 | 752,337(0.00%)#1,719 |
| 26. | Westfield | 31 | 9,576(0.32%)#26 | 752,337(0.00%)#1,729 |
| 27. | Tipton | 31 | 9,576(0.32%)#27 | 752,337(0.00%)#1,746 |
| 28. | Osceola | 29 | 9,576(0.30%)#28 | 752,337(0.00%)#1,809 |
| 29. | Evansville | 28 | 9,576(0.29%)#29 | 752,337(0.00%)#1,813 |
| 30. | Noblesville | 27 | 9,576(0.28%)#30 | 752,337(0.00%)#1,848 |
| 31. | Upland | 27 | 9,576(0.28%)#31 | 752,337(0.00%)#1,869 |
| 32. | Terre Haute | 26 | 9,576(0.27%)#32 | 752,337(0.00%)#1,883 |
| 33. | Richmond | 23 | 9,576(0.24%)#33 | 752,337(0.00%)#1,996 |
| 34. | Dyer | 20 | 9,576(0.21%)#34 | 752,337(0.00%)#2,128 |
| 35. | Elkhart | 19 | 9,576(0.20%)#35 | 752,337(0.00%)#2,149 |
| 36. | Griffith | 19 | 9,576(0.20%)#36 | 752,337(0.00%)#2,163 |
| 37. | Clermont | 16 | 9,576(0.17%)#37 | 752,337(0.00%)#2,303 |
| 38. | Goshen | 15 | 9,576(0.16%)#38 | 752,337(0.00%)#2,313 |
| 39. | Bethel | 15 | 9,576(0.16%)#39 | 752,337(0.00%)#2,368 |
| 40. | New Castle | 14 | 9,576(0.15%)#40 | 752,337(0.00%)#2,384 |
| 41. | Edinburgh | 13 | 9,576(0.14%)#41 | 752,337(0.00%)#2,460 |
| 42. | Melody Hill | 12 | 9,576(0.13%)#42 | 752,337(0.00%)#2,516 |
| 43. | Fishers | 11 | 9,576(0.11%)#43 | 752,337(0.00%)#2,533 |
| 44. | Chesterton | 9 | 9,576(0.09%)#44 | 752,337(0.00%)#2,700 |
| 45. | Munster | 7 | 9,576(0.07%)#45 | 752,337(0.00%)#2,843 |
| 46. | Schererville | 6 | 9,576(0.06%)#46 | 752,337(0.00%)#2,914 |
| 47. | Valparaiso | 5 | 9,576(0.05%)#47 | 752,337(0.00%)#3,006 |
| 48. | Bedford | 4 | 9,576(0.04%)#48 | 752,337(0.00%)#3,101 |
| 49. | Auburn | 4 | 9,576(0.04%)#49 | 752,337(0.00%)#3,102 |
| 50. | Woodburn | 3 | 9,576(0.03%)#50 | 752,337(0.00%)#3,235 |
| 51. | Shipshewana | 3 | 9,576(0.03%)#51 | 752,337(0.00%)#3,241 |
| 52. | Swayzee | 2 | 9,576(0.02%)#52 | 752,337(0.00%)#3,331 |
Common Questions
What are the Top 10 Cities with the Most Immigrants from Eastern Africa in Indiana?
Top 10 Cities with the Most Immigrants from Eastern Africa in Indiana are:
#1
3,438
#2
898
#3
799
#4
660
#5
374
#6
224
#7
214
#8
195
#9
187
#10
137
What city has the Most Immigrants from Eastern Africa in Indiana?
Indianapolis has the Most Immigrants from Eastern Africa in Indiana with 3,438.
What is the Total Immigrants from Eastern Africa in the State of Indiana?
Total Immigrants from Eastern Africa in Indiana is 9,576.
What is the Total Immigrants from Eastern Africa in the United States?
Total Immigrants from Eastern Africa in the United States is 752,337.