U.S. Virgin Islander vs Immigrants from Eastern Europe 1 or more Vehicles in Household
COMPARE
U.S. Virgin Islander
Immigrants from Eastern Europe
1 or more Vehicles in Household
1 or more Vehicles in Household Comparison
U.S. Virgin Islanders
Immigrants from Eastern Europe
84.6%
1 OR MORE VEHICLES IN HOUSEHOLD
0.0/ 100
METRIC RATING
310th/ 347
METRIC RANK
86.7%
1 OR MORE VEHICLES IN HOUSEHOLD
0.0/ 100
METRIC RATING
283rd/ 347
METRIC RANK
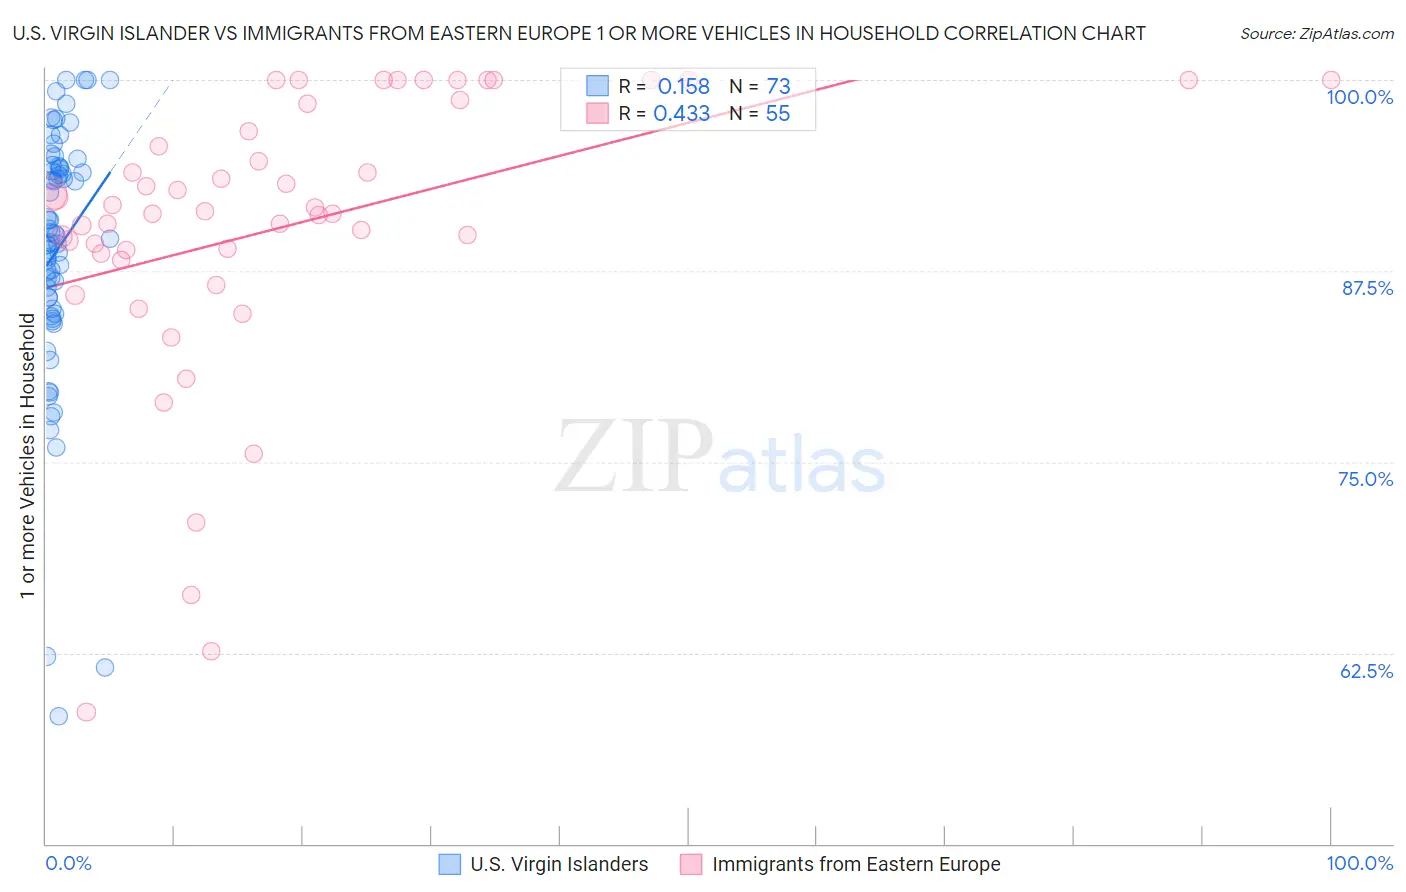
U.S. Virgin Islander vs Immigrants from Eastern Europe 1 or more Vehicles in Household Correlation Chart
The statistical analysis conducted on geographies consisting of 87,430,721 people shows a poor positive correlation between the proportion of U.S. Virgin Islanders and percentage of households with 1 or more vehicles available in the United States with a correlation coefficient (R) of 0.158 and weighted average of 84.6%. Similarly, the statistical analysis conducted on geographies consisting of 475,429,921 people shows a moderate positive correlation between the proportion of Immigrants from Eastern Europe and percentage of households with 1 or more vehicles available in the United States with a correlation coefficient (R) of 0.433 and weighted average of 86.7%, a difference of 2.5%.
1 or more Vehicles in Household Correlation Summary
| Measurement | U.S. Virgin Islander | Immigrants from Eastern Europe |
| Minimum | 58.3% | 58.6% |
| Maximum | 100.0% | 100.0% |
| Range | 41.7% | 41.4% |
| Mean | 88.9% | 90.4% |
| Median | 89.9% | 91.4% |
| Interquartile 25% (IQ1) | 85.4% | 88.6% |
| Interquartile 75% (IQ3) | 94.3% | 98.5% |
| Interquartile Range (IQR) | 8.9% | 9.8% |
| Standard Deviation (Sample) | 8.4% | 9.4% |
| Standard Deviation (Population) | 8.3% | 9.3% |
Similar Demographics by 1 or more Vehicles in Household
Demographics Similar to U.S. Virgin Islanders by 1 or more Vehicles in Household
In terms of 1 or more vehicles in household, the demographic groups most similar to U.S. Virgin Islanders are Immigrants from Haiti (84.7%, a difference of 0.030%), Immigrants from Belize (84.7%, a difference of 0.040%), Puerto Rican (84.6%, a difference of 0.040%), Tohono O'odham (84.7%, a difference of 0.070%), and Cape Verdean (84.5%, a difference of 0.15%).
| Demographics | Rating | Rank | 1 or more Vehicles in Household |
| Immigrants | Greece | 0.0 /100 | #303 | Tragic 85.4% |
| Immigrants | Ukraine | 0.0 /100 | #304 | Tragic 85.2% |
| Immigrants | China | 0.0 /100 | #305 | Tragic 84.9% |
| Immigrants | Western Africa | 0.0 /100 | #306 | Tragic 84.9% |
| Tohono O'odham | 0.0 /100 | #307 | Tragic 84.7% |
| Immigrants | Belize | 0.0 /100 | #308 | Tragic 84.7% |
| Immigrants | Haiti | 0.0 /100 | #309 | Tragic 84.7% |
| U.S. Virgin Islanders | 0.0 /100 | #310 | Tragic 84.6% |
| Puerto Ricans | 0.0 /100 | #311 | Tragic 84.6% |
| Cape Verdeans | 0.0 /100 | #312 | Tragic 84.5% |
| Immigrants | Israel | 0.0 /100 | #313 | Tragic 84.5% |
| Albanians | 0.0 /100 | #314 | Tragic 84.4% |
| Cypriots | 0.0 /100 | #315 | Tragic 84.4% |
| Alaska Natives | 0.0 /100 | #316 | Tragic 83.8% |
| Ghanaians | 0.0 /100 | #317 | Tragic 83.6% |
Demographics Similar to Immigrants from Eastern Europe by 1 or more Vehicles in Household
In terms of 1 or more vehicles in household, the demographic groups most similar to Immigrants from Eastern Europe are Central American Indian (86.7%, a difference of 0.0%), Colville (86.8%, a difference of 0.040%), Immigrants from Kazakhstan (86.6%, a difference of 0.21%), Immigrants from Eastern Asia (86.5%, a difference of 0.24%), and Mongolian (87.0%, a difference of 0.27%).
| Demographics | Rating | Rank | 1 or more Vehicles in Household |
| Immigrants | France | 0.1 /100 | #276 | Tragic 87.1% |
| Alsatians | 0.1 /100 | #277 | Tragic 87.1% |
| Immigrants | Southern Europe | 0.1 /100 | #278 | Tragic 87.1% |
| Immigrants | Albania | 0.1 /100 | #279 | Tragic 87.1% |
| Immigrants | Croatia | 0.0 /100 | #280 | Tragic 87.0% |
| Mongolians | 0.0 /100 | #281 | Tragic 87.0% |
| Colville | 0.0 /100 | #282 | Tragic 86.8% |
| Immigrants | Eastern Europe | 0.0 /100 | #283 | Tragic 86.7% |
| Central American Indians | 0.0 /100 | #284 | Tragic 86.7% |
| Immigrants | Kazakhstan | 0.0 /100 | #285 | Tragic 86.6% |
| Immigrants | Eastern Asia | 0.0 /100 | #286 | Tragic 86.5% |
| Immigrants | Malaysia | 0.0 /100 | #287 | Tragic 86.5% |
| Hopi | 0.0 /100 | #288 | Tragic 86.4% |
| Immigrants | Ireland | 0.0 /100 | #289 | Tragic 86.4% |
| Immigrants | Australia | 0.0 /100 | #290 | Tragic 86.4% |