Garfield, TX
Garfield Map
Garfield Overview
2,015
TOTAL POPULATION
896
MALE POPULATION
1,119
FEMALE POPULATION
80.07
MALES / 100 FEMALES
124.89
FEMALES / 100 MALES
36.4
MEDIAN AGE
3.3
AVG FAMILY SIZE
2.8
AVG HOUSEHOLD SIZE
$25,825
PER CAPITA INCOME
$61,900
AVG FAMILY INCOME
$54,938
AVG HOUSEHOLD INCOME
0.44
INEQUALITY / GINI INDEX
740
LABOR FORCE [ PEOPLE ]
51.0%
PERCENT IN LABOR FORCE
16.2%
UNEMPLOYMENT RATE
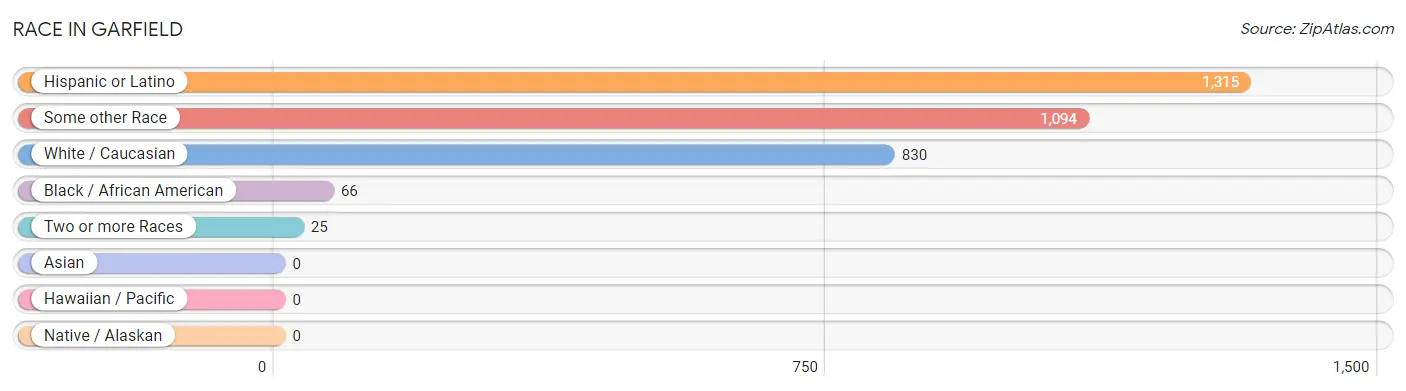
Race in Garfield
The most populous races in Garfield are Hispanic or Latino (1,315 | 65.3%), Some other Race (1,094 | 54.3%), and White / Caucasian (830 | 41.2%).
| Race | # Population | % Population |
| Asian | 0 | 0.0% |
| Black / African American | 66 | 3.3% |
| Hawaiian / Pacific | 0 | 0.0% |
| Hispanic or Latino | 1,315 | 65.3% |
| Native / Alaskan | 0 | 0.0% |
| White / Caucasian | 830 | 41.2% |
| Two or more Races | 25 | 1.2% |
| Some other Race | 1,094 | 54.3% |
| Total | 2,015 | 100.0% |
Ancestry in Garfield
The most populous ancestries reported in Garfield are Mexican (985 | 48.9%), Central American (330 | 16.4%), Honduran (330 | 16.4%), American (166 | 8.2%), and English (76 | 3.8%), together accounting for 93.6% of all Garfield residents.
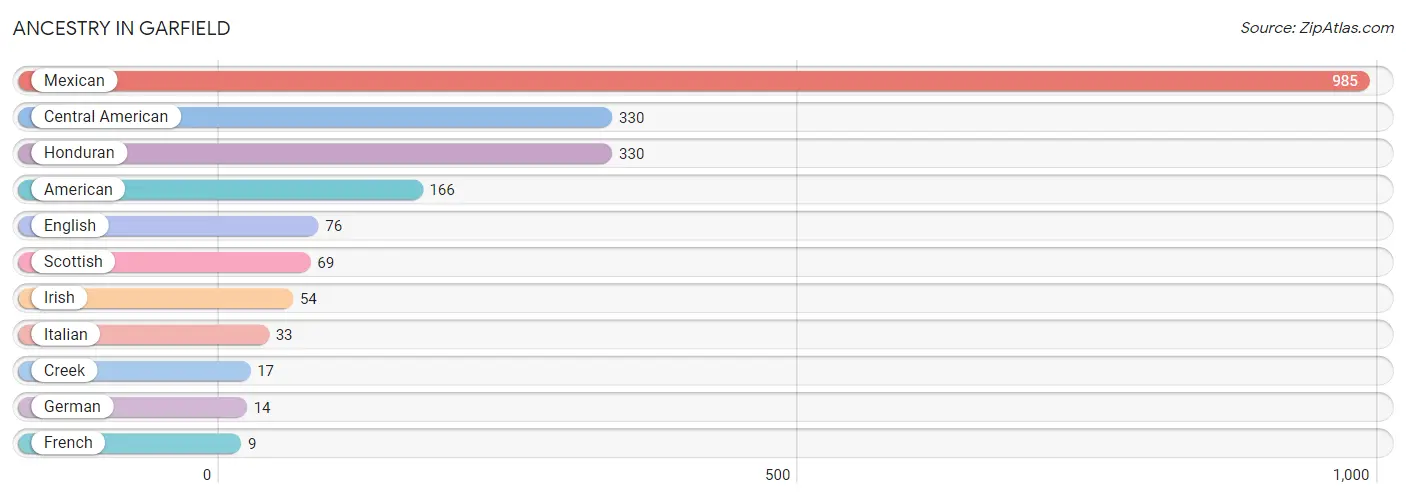
| Ancestry | # Population | % Population |
| American | 166 | 8.2% |
| Central American | 330 | 16.4% |
| Creek | 17 | 0.8% |
| English | 76 | 3.8% |
| French | 9 | 0.4% |
| German | 14 | 0.7% |
| Honduran | 330 | 16.4% |
| Irish | 54 | 2.7% |
| Italian | 33 | 1.6% |
| Mexican | 985 | 48.9% |
| Scottish | 69 | 3.4% | View All 11 Rows |
Immigrants in Garfield
The most numerous immigrant groups reported in Garfield came from Central America (145 | 7.2%), Latin America (145 | 7.2%), Mexico (145 | 7.2%), England (33 | 1.6%), and Europe (33 | 1.6%), together accounting for 24.9% of all Garfield residents.
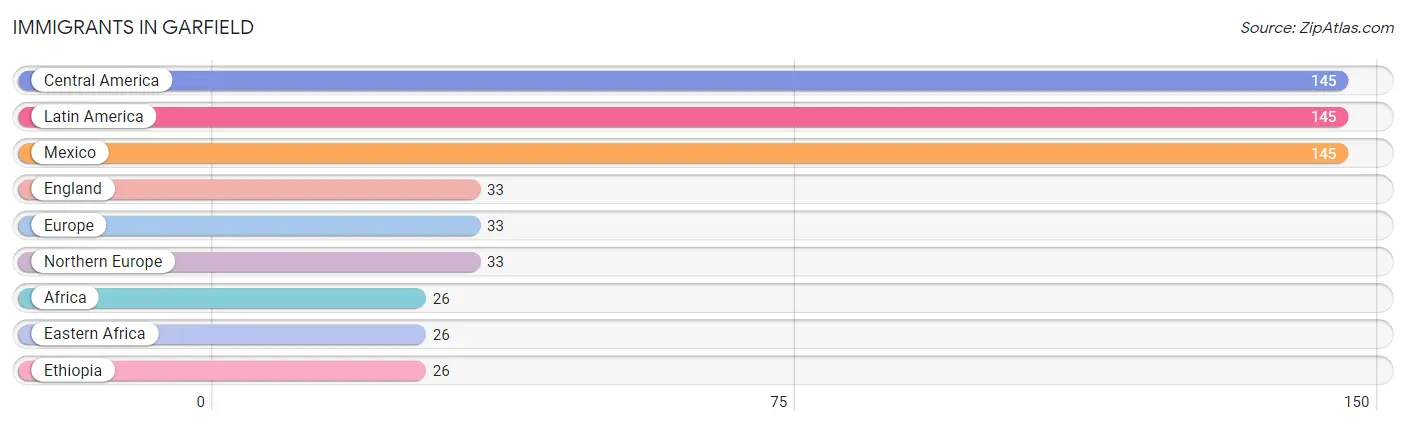
| Immigration Origin | # Population | % Population |
| Africa | 26 | 1.3% |
| Central America | 145 | 7.2% |
| Eastern Africa | 26 | 1.3% |
| England | 33 | 1.6% |
| Ethiopia | 26 | 1.3% |
| Europe | 33 | 1.6% |
| Latin America | 145 | 7.2% |
| Mexico | 145 | 7.2% |
| Northern Europe | 33 | 1.6% | View All 9 Rows |
Sex and Age in Garfield
Sex and Age in Garfield
The most populous age groups in Garfield are 10 to 14 Years (185 | 20.6%) for men and 15 to 19 Years (153 | 13.7%) for women.
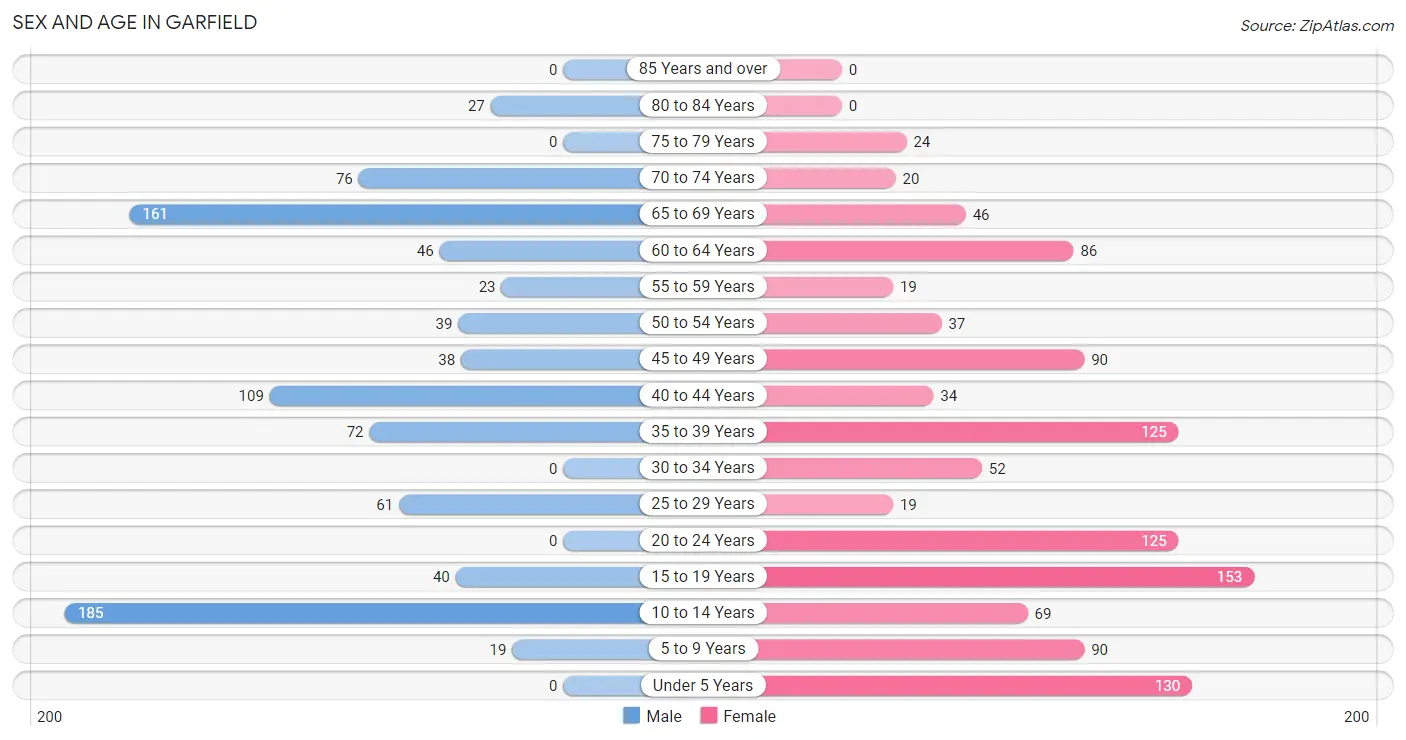
| Age Bracket | Male | Female |
| Under 5 Years | 0 (0.0%) | 130 (11.6%) |
| 5 to 9 Years | 19 (2.1%) | 90 (8.0%) |
| 10 to 14 Years | 185 (20.6%) | 69 (6.2%) |
| 15 to 19 Years | 40 (4.5%) | 153 (13.7%) |
| 20 to 24 Years | 0 (0.0%) | 125 (11.2%) |
| 25 to 29 Years | 61 (6.8%) | 19 (1.7%) |
| 30 to 34 Years | 0 (0.0%) | 52 (4.6%) |
| 35 to 39 Years | 72 (8.0%) | 125 (11.2%) |
| 40 to 44 Years | 109 (12.2%) | 34 (3.0%) |
| 45 to 49 Years | 38 (4.2%) | 90 (8.0%) |
| 50 to 54 Years | 39 (4.3%) | 37 (3.3%) |
| 55 to 59 Years | 23 (2.6%) | 19 (1.7%) |
| 60 to 64 Years | 46 (5.1%) | 86 (7.7%) |
| 65 to 69 Years | 161 (18.0%) | 46 (4.1%) |
| 70 to 74 Years | 76 (8.5%) | 20 (1.8%) |
| 75 to 79 Years | 0 (0.0%) | 24 (2.1%) |
| 80 to 84 Years | 27 (3.0%) | 0 (0.0%) |
| 85 Years and over | 0 (0.0%) | 0 (0.0%) |
| Total | 896 (100.0%) | 1,119 (100.0%) |
Families and Households in Garfield
Median Family Size in Garfield
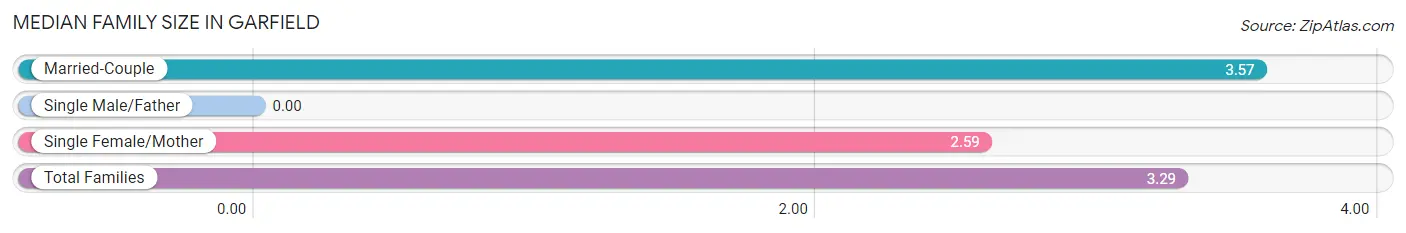
| Family Type | # Families | Family Size |
| Married-Couple | 406 (71.5%) | 3.57 |
| Single Male/Father | 0 (0.0%) | - |
| Single Female/Mother | 162 (28.5%) | 2.59 |
| Total Families | 568 (100.0%) | 3.29 |
Median Household Size in Garfield
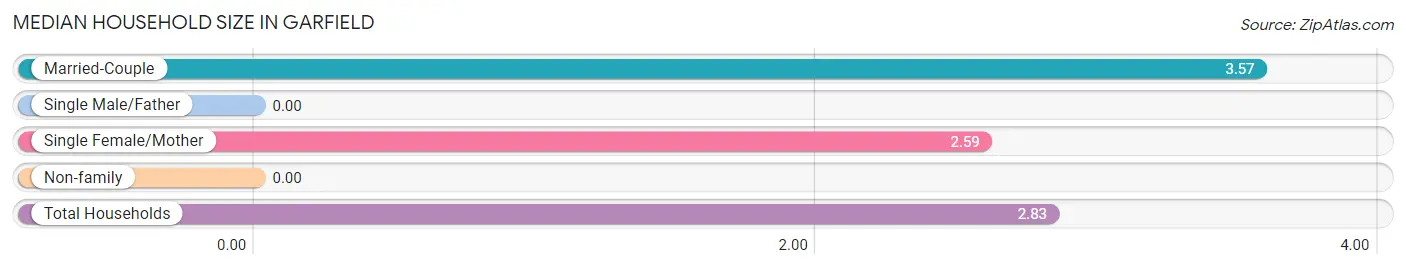
| Household Type | # Households | Household Size |
| Married-Couple | 406 (56.9%) | 3.57 |
| Single Male/Father | 0 (0.0%) | - |
| Single Female/Mother | 162 (22.7%) | 2.59 |
| Non-family | 145 (20.3%) | - |
| Total Households | 713 (100.0%) | 2.83 |
Household Size by Marriage Status in Garfield
Out of a total of 713 households in Garfield, 568 (79.7%) are family households, while 145 (20.3%) are nonfamily households. The most numerous type of family households are 2-person households, comprising 275, and the most common type of nonfamily households are 1-person households, comprising 145.
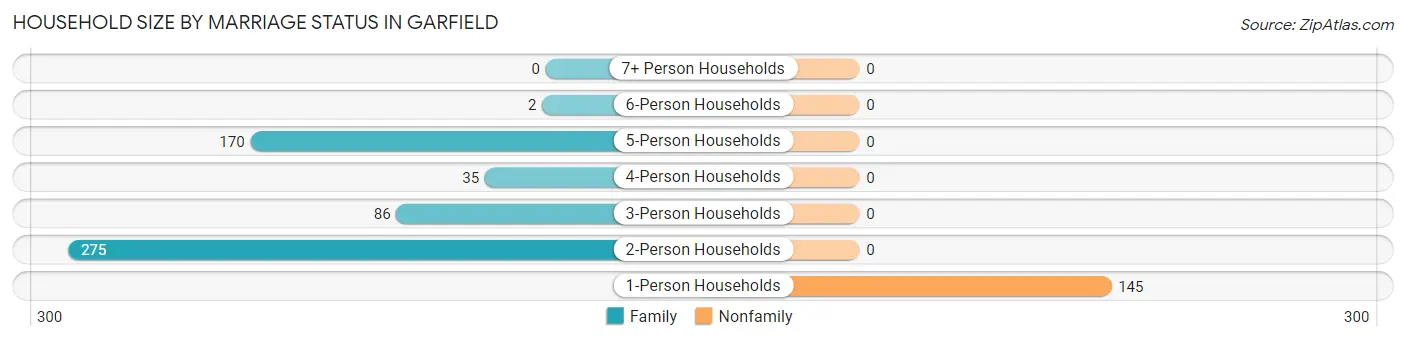
| Household Size | Family Households | Nonfamily Households |
| 1-Person Households | - | 145 (20.3%) |
| 2-Person Households | 275 (38.6%) | 0 (0.0%) |
| 3-Person Households | 86 (12.1%) | 0 (0.0%) |
| 4-Person Households | 35 (4.9%) | 0 (0.0%) |
| 5-Person Households | 170 (23.8%) | 0 (0.0%) |
| 6-Person Households | 2 (0.3%) | 0 (0.0%) |
| 7+ Person Households | 0 (0.0%) | 0 (0.0%) |
| Total | 568 (79.7%) | 145 (20.3%) |
Female Fertility in Garfield
Fertility by Age in Garfield
Average fertility rate in Garfield is 85.0 births per 1,000 women. Women in the age bracket of 20 to 34 years have the highest fertility rate with 260.0 births per 1,000 women. Women in the age bracket of 20 to 34 years acount for 100.0% of all women with births.
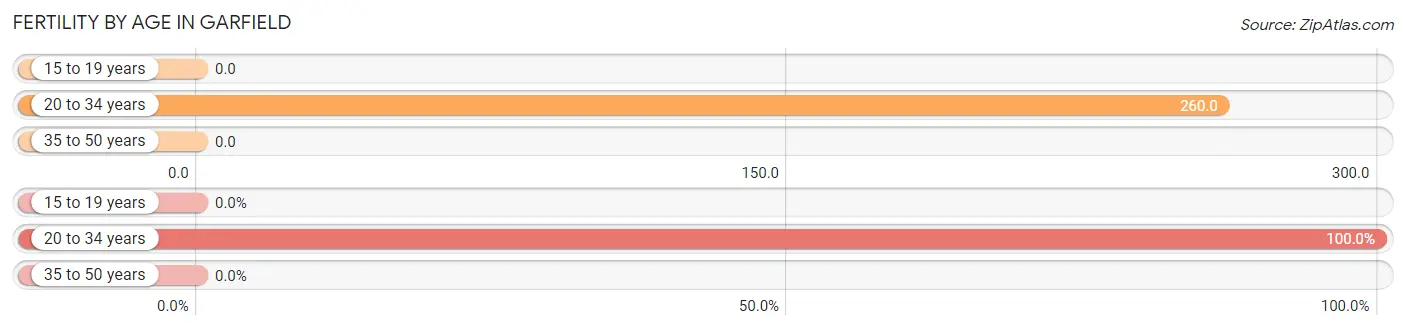
| Age Bracket | Women with Births | Births / 1,000 Women |
| 15 to 19 years | 0 (0.0%) | 0.0 |
| 20 to 34 years | 51 (100.0%) | 260.0 |
| 35 to 50 years | 0 (0.0%) | 0.0 |
| Total | 51 (100.0%) | 85.0 |
Fertility by Age by Marriage Status in Garfield
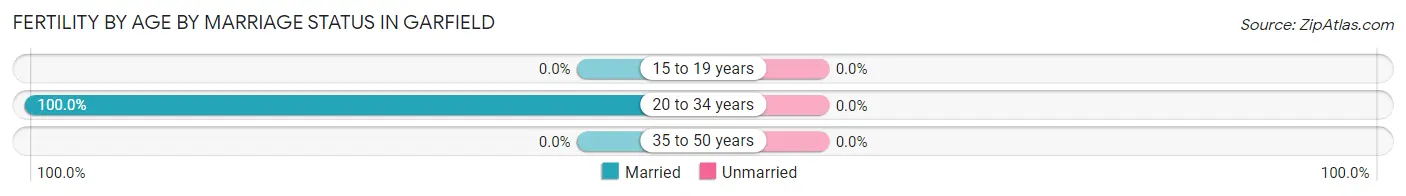
| Age Bracket | Married | Unmarried |
| 15 to 19 years | 0 (0.0%) | 0 (0.0%) |
| 20 to 34 years | 51 (100.0%) | 0 (0.0%) |
| 35 to 50 years | 0 (0.0%) | 0 (0.0%) |
| Total | 51 (100.0%) | 0 (0.0%) |
Fertility by Education in Garfield
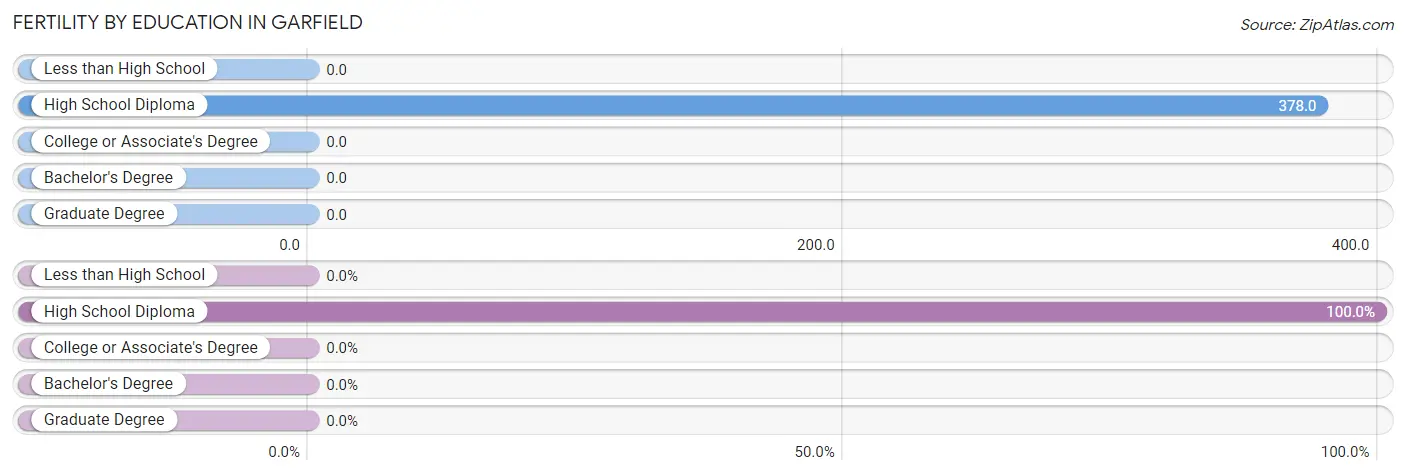
| Educational Attainment | Women with Births | Births / 1,000 Women |
| Less than High School | 0 (0.0%) | 0.0 |
| High School Diploma | 51 (100.0%) | 378.0 |
| College or Associate's Degree | 0 (0.0%) | 0.0 |
| Bachelor's Degree | 0 (0.0%) | 0.0 |
| Graduate Degree | 0 (0.0%) | 0.0 |
| Total | 51 (100.0%) | 85.0 |
Fertility by Education by Marriage Status in Garfield
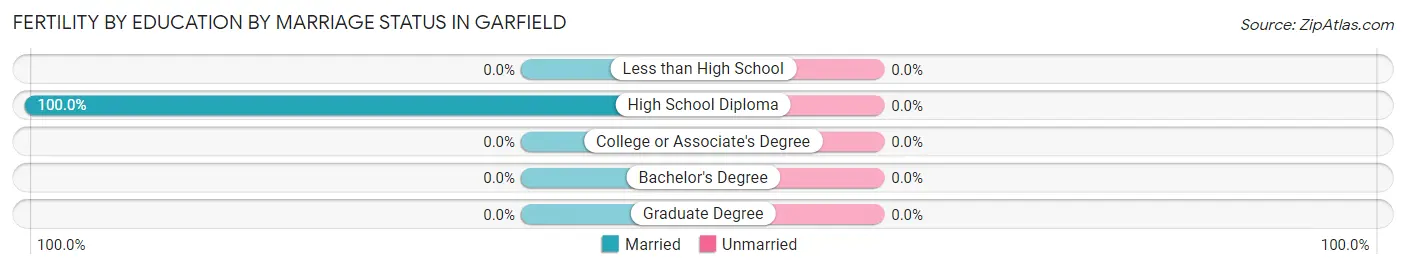
| Educational Attainment | Married | Unmarried |
| Less than High School | 0 (0.0%) | 0 (0.0%) |
| High School Diploma | 51 (100.0%) | 0 (0.0%) |
| College or Associate's Degree | 0 (0.0%) | 0 (0.0%) |
| Bachelor's Degree | 0 (0.0%) | 0 (0.0%) |
| Graduate Degree | 0 (0.0%) | 0 (0.0%) |
| Total | 51 (100.0%) | 0 (0.0%) |
Income in Garfield
Income Overview in Garfield
Per Capita Income in Garfield is $25,825, while median incomes of families and households are $61,900 and $54,938 respectively.
| Characteristic | Number | Measure |
| Per Capita Income | 2,015 | $25,825 |
| Median Family Income | 568 | $61,900 |
| Mean Family Income | 568 | $82,931 |
| Median Household Income | 713 | $54,938 |
| Mean Household Income | 713 | $70,168 |
| Income Deficit | 568 | $0 |
| Wage / Income Gap (%) | 2,015 | 0.00% |
| Wage / Income Gap ($) | 2,015 | 100.00¢ per $1 |
| Gini / Inequality Index | 2,015 | 0.44 |
Earnings by Sex in Garfield
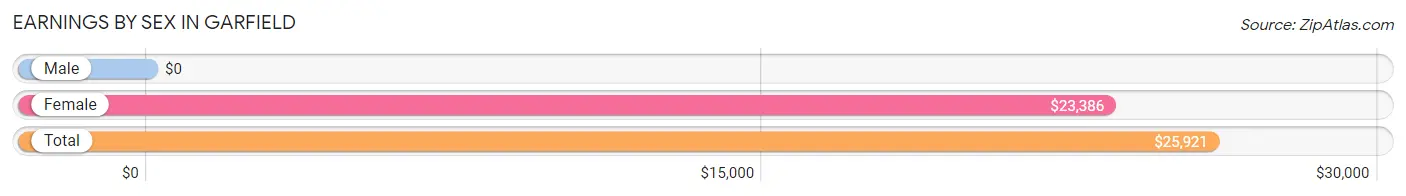
| Sex | Number | Average Earnings |
| Male | 417 (55.3%) | $0 |
| Female | 337 (44.7%) | $23,386 |
| Total | 754 (100.0%) | $25,921 |
Earnings by Sex by Income Bracket in Garfield
The most common earnings brackets in Garfield are $75,000 to $99,999 for men (104 | 24.9%) and $7,500 to $9,999 for women (86 | 25.5%).
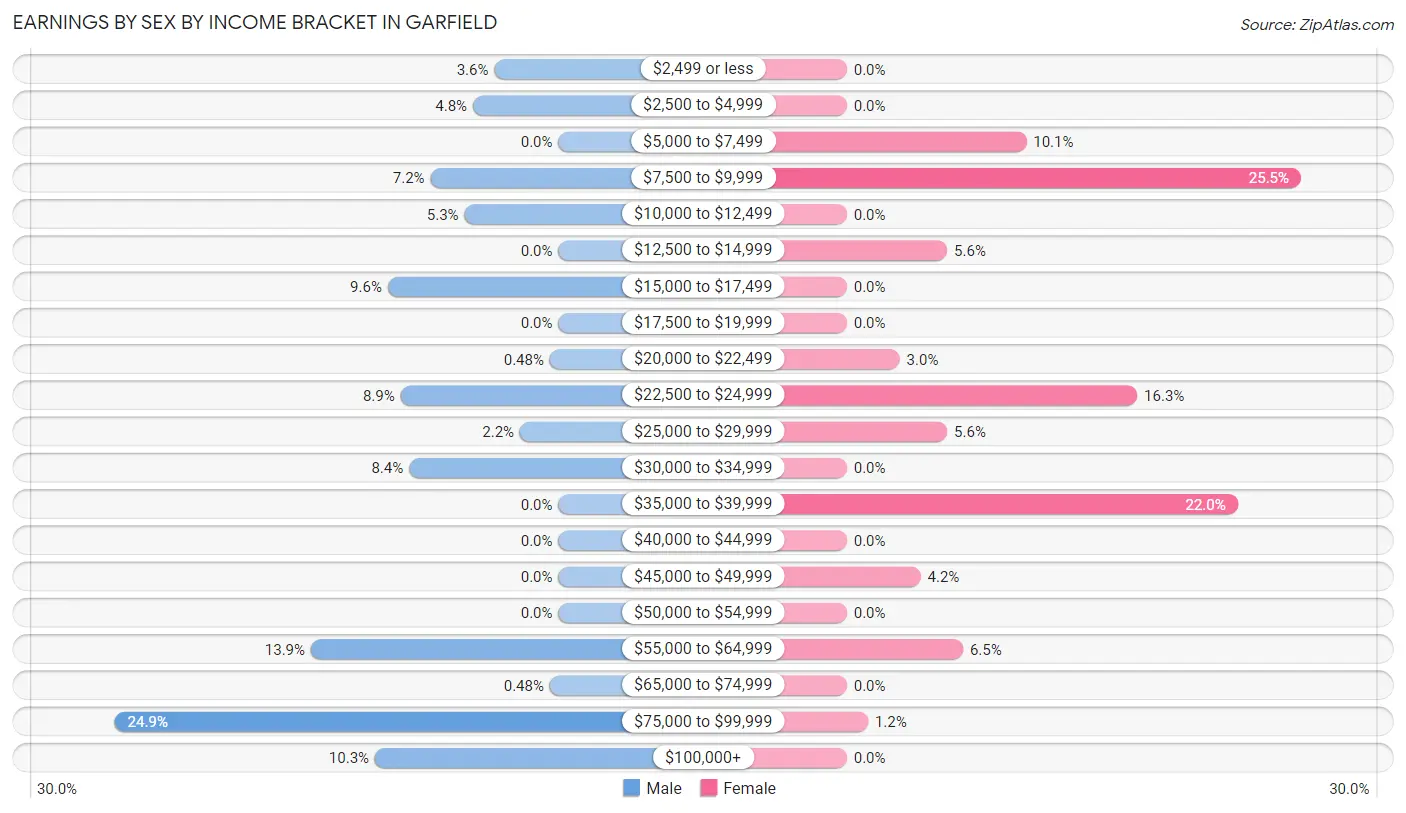
| Income | Male | Female |
| $2,499 or less | 15 (3.6%) | 0 (0.0%) |
| $2,500 to $4,999 | 20 (4.8%) | 0 (0.0%) |
| $5,000 to $7,499 | 0 (0.0%) | 34 (10.1%) |
| $7,500 to $9,999 | 30 (7.2%) | 86 (25.5%) |
| $10,000 to $12,499 | 22 (5.3%) | 0 (0.0%) |
| $12,500 to $14,999 | 0 (0.0%) | 19 (5.6%) |
| $15,000 to $17,499 | 40 (9.6%) | 0 (0.0%) |
| $17,500 to $19,999 | 0 (0.0%) | 0 (0.0%) |
| $20,000 to $22,499 | 2 (0.5%) | 10 (3.0%) |
| $22,500 to $24,999 | 37 (8.9%) | 55 (16.3%) |
| $25,000 to $29,999 | 9 (2.2%) | 19 (5.6%) |
| $30,000 to $34,999 | 35 (8.4%) | 0 (0.0%) |
| $35,000 to $39,999 | 0 (0.0%) | 74 (22.0%) |
| $40,000 to $44,999 | 0 (0.0%) | 0 (0.0%) |
| $45,000 to $49,999 | 0 (0.0%) | 14 (4.2%) |
| $50,000 to $54,999 | 0 (0.0%) | 0 (0.0%) |
| $55,000 to $64,999 | 58 (13.9%) | 22 (6.5%) |
| $65,000 to $74,999 | 2 (0.5%) | 0 (0.0%) |
| $75,000 to $99,999 | 104 (24.9%) | 4 (1.2%) |
| $100,000+ | 43 (10.3%) | 0 (0.0%) |
| Total | 417 (100.0%) | 337 (100.0%) |
Earnings by Sex by Educational Attainment in Garfield
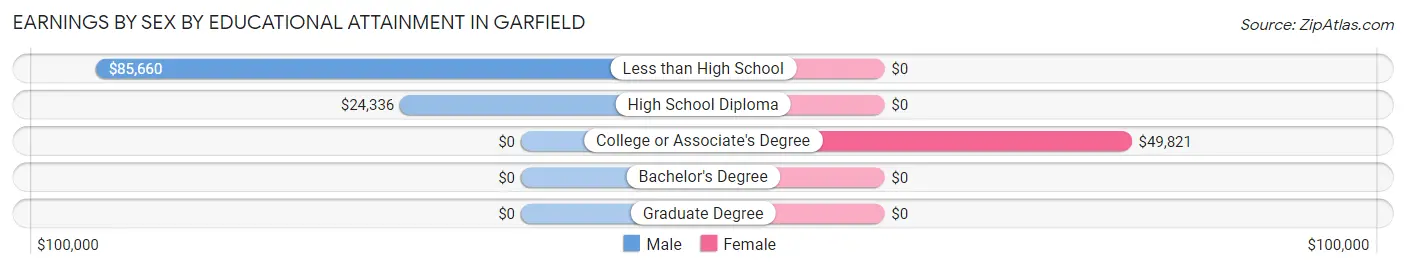
| Educational Attainment | Male Income | Female Income |
| Less than High School | $85,660 | $0 |
| High School Diploma | $24,336 | $0 |
| College or Associate's Degree | - | - |
| Bachelor's Degree | - | - |
| Graduate Degree | - | - |
| Total | $58,058 | $0 |
Family Income in Garfield
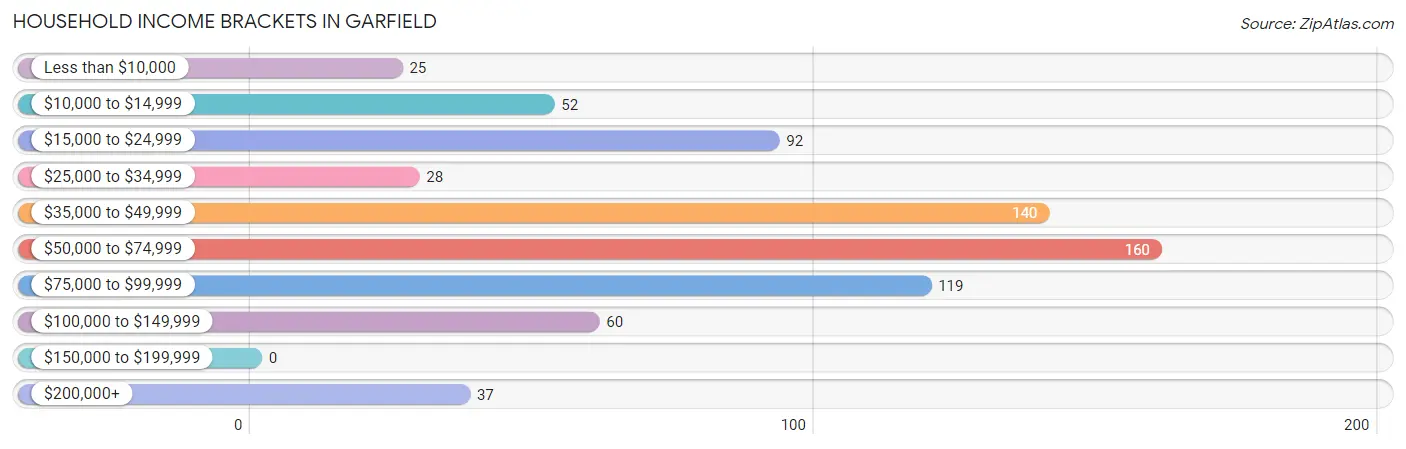
Family Income Brackets in Garfield
According to the Garfield family income data, there are 160 families falling into the $50,000 to $74,999 income range, which is the most common income bracket and makes up 28.2% of all families.
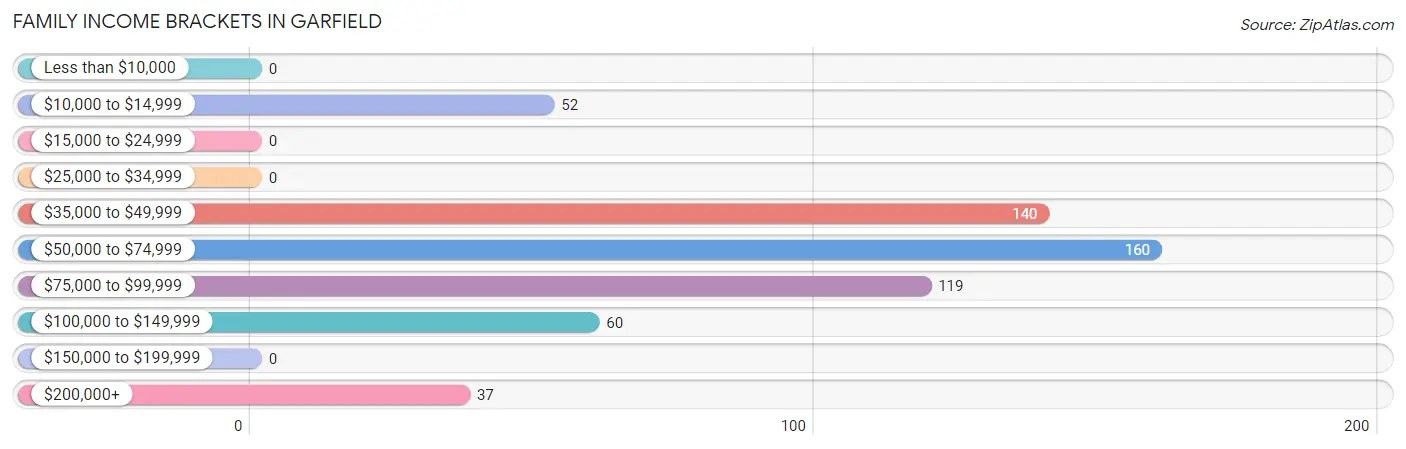
| Income Bracket | # Families | % Families |
| Less than $10,000 | 0 | 0.0% |
| $10,000 to $14,999 | 52 | 9.2% |
| $15,000 to $24,999 | 0 | 0.0% |
| $25,000 to $34,999 | 0 | 0.0% |
| $35,000 to $49,999 | 140 | 24.6% |
| $50,000 to $74,999 | 160 | 28.2% |
| $75,000 to $99,999 | 119 | 21.0% |
| $100,000 to $149,999 | 60 | 10.6% |
| $150,000 to $199,999 | 0 | 0.0% |
| $200,000+ | 37 | 6.5% |
Family Income by Famaliy Size in Garfield
5-person families (170 | 29.9%) account for the highest median family income in Garfield with $85,423 per family, while 2-person families (275 | 48.4%) have the highest median income of $33,942 per family member.
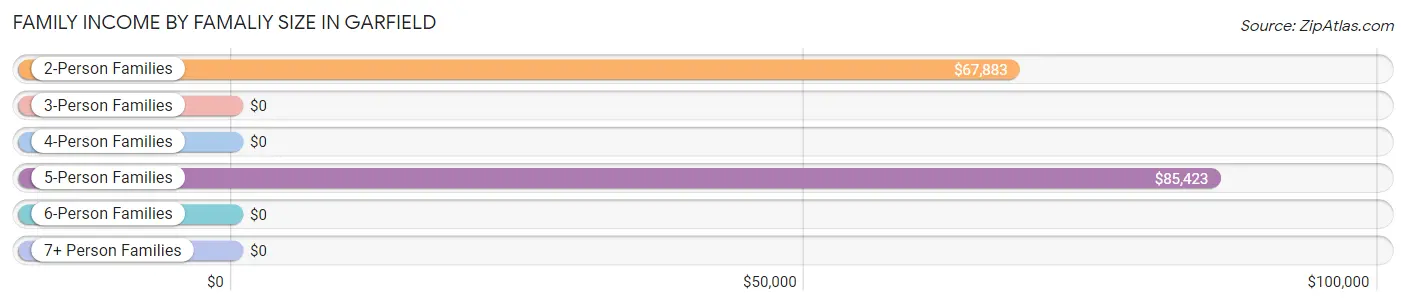
| Income Bracket | # Families | Median Income |
| 2-Person Families | 275 (48.4%) | $67,883 |
| 3-Person Families | 86 (15.1%) | $0 |
| 4-Person Families | 35 (6.2%) | $0 |
| 5-Person Families | 170 (29.9%) | $85,423 |
| 6-Person Families | 2 (0.4%) | $0 |
| 7+ Person Families | 0 (0.0%) | $0 |
| Total | 568 (100.0%) | $61,900 |
Family Income by Number of Earners in Garfield
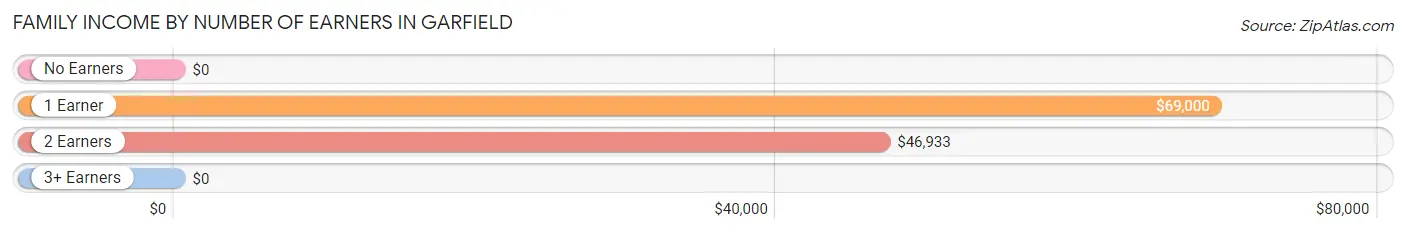
| Number of Earners | # Families | Median Income |
| No Earners | 80 (14.1%) | $0 |
| 1 Earner | 276 (48.6%) | $69,000 |
| 2 Earners | 179 (31.5%) | $46,933 |
| 3+ Earners | 33 (5.8%) | $0 |
| Total | 568 (100.0%) | $61,900 |
Household Income in Garfield
Household Income Brackets in Garfield
With 160 households falling in the category, the $50,000 to $74,999 income range is the most frequent in Garfield, accounting for 22.4% of all households.
| Income Bracket | # Households | % Households |
| Less than $10,000 | 25 | 3.5% |
| $10,000 to $14,999 | 52 | 7.3% |
| $15,000 to $24,999 | 92 | 12.9% |
| $25,000 to $34,999 | 28 | 3.9% |
| $35,000 to $49,999 | 140 | 19.6% |
| $50,000 to $74,999 | 160 | 22.4% |
| $75,000 to $99,999 | 119 | 16.7% |
| $100,000 to $149,999 | 60 | 8.4% |
| $150,000 to $199,999 | 0 | 0.0% |
| $200,000+ | 37 | 5.2% |
Household Income by Householder Age in Garfield
The median household income in Garfield is $54,938, with the highest median household income of $47,326 found in the 45 to 64 years age bracket for the primary householder. A total of 224 households (31.4%) fall into this category. Meanwhile, the 15 to 24 years age bracket for the primary householder has the lowest median household income of $0, with 51 households (7.1%) in this group.
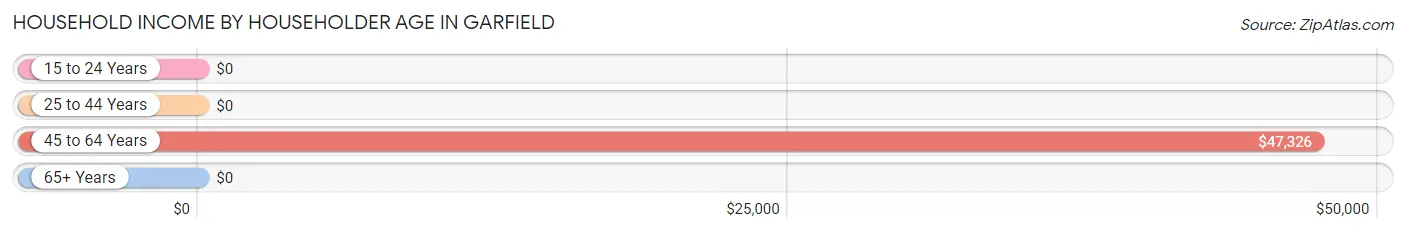
| Income Bracket | # Households | Median Income |
| 15 to 24 Years | 51 (7.1%) | $0 |
| 25 to 44 Years | 177 (24.8%) | $0 |
| 45 to 64 Years | 224 (31.4%) | $47,326 |
| 65+ Years | 261 (36.6%) | $0 |
| Total | 713 (100.0%) | $54,938 |
Poverty in Garfield
Income Below Poverty by Sex and Age in Garfield
With 2.8% poverty level for males and 11.1% for females among the residents of Garfield, 65 to 74 year old males and 15 year old females are the most vulnerable to poverty, with 25 males (10.5%) and 72 females (100.0%) in their respective age groups living below the poverty level.
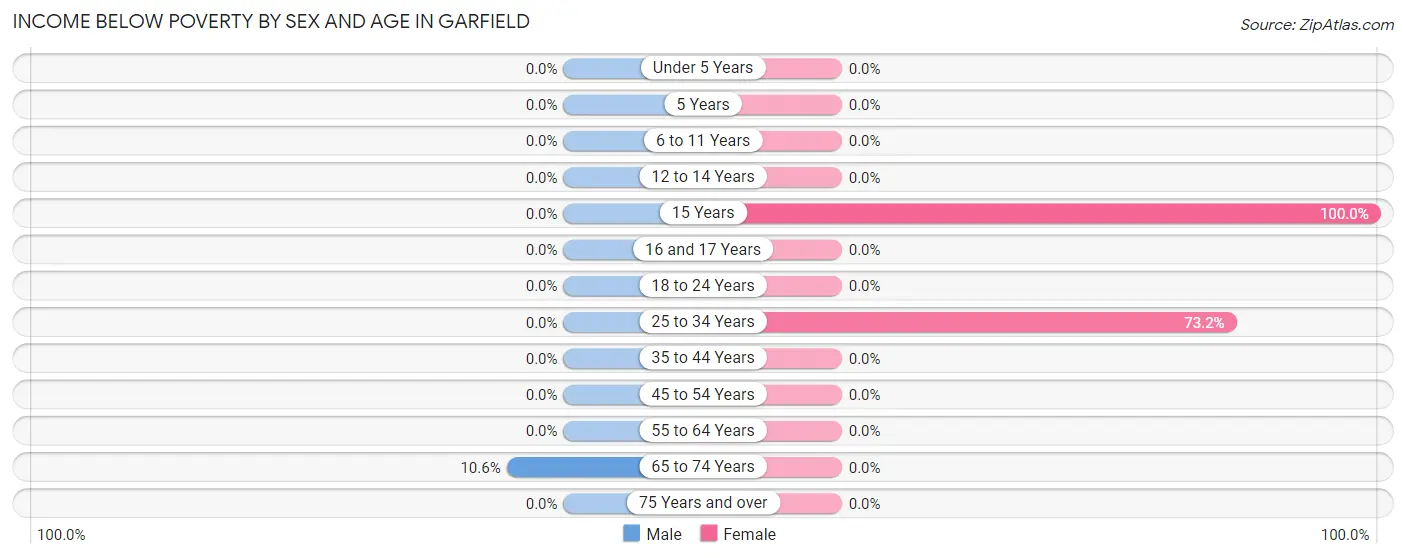
| Age Bracket | Male | Female |
| Under 5 Years | 0 (0.0%) | 0 (0.0%) |
| 5 Years | 0 (0.0%) | 0 (0.0%) |
| 6 to 11 Years | 0 (0.0%) | 0 (0.0%) |
| 12 to 14 Years | 0 (0.0%) | 0 (0.0%) |
| 15 Years | 0 (0.0%) | 72 (100.0%) |
| 16 and 17 Years | 0 (0.0%) | 0 (0.0%) |
| 18 to 24 Years | 0 (0.0%) | 0 (0.0%) |
| 25 to 34 Years | 0 (0.0%) | 52 (73.2%) |
| 35 to 44 Years | 0 (0.0%) | 0 (0.0%) |
| 45 to 54 Years | 0 (0.0%) | 0 (0.0%) |
| 55 to 64 Years | 0 (0.0%) | 0 (0.0%) |
| 65 to 74 Years | 25 (10.5%) | 0 (0.0%) |
| 75 Years and over | 0 (0.0%) | 0 (0.0%) |
| Total | 25 (2.8%) | 124 (11.1%) |
Income Above Poverty by Sex and Age in Garfield
According to the poverty statistics in Garfield, males aged 6 to 11 years and females aged under 5 years are the age groups that are most secure financially, with 100.0% of males and 100.0% of females in these age groups living above the poverty line.
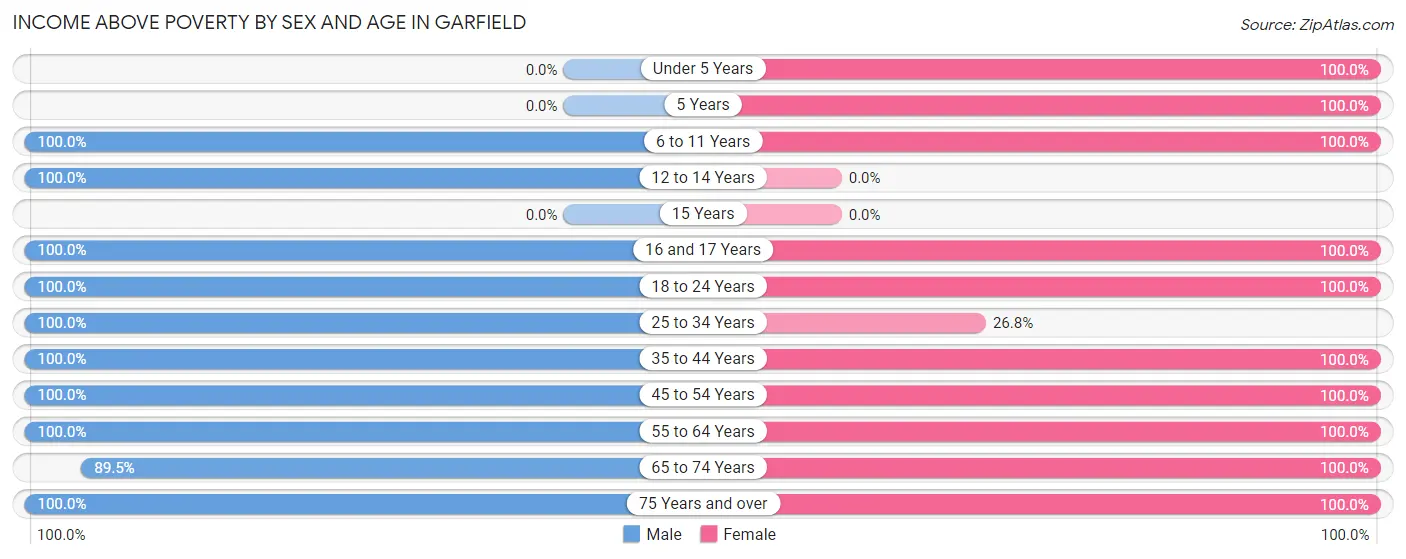
| Age Bracket | Male | Female |
| Under 5 Years | 0 (0.0%) | 130 (100.0%) |
| 5 Years | 0 (0.0%) | 20 (100.0%) |
| 6 to 11 Years | 139 (100.0%) | 139 (100.0%) |
| 12 to 14 Years | 65 (100.0%) | 0 (0.0%) |
| 15 Years | 0 (0.0%) | 0 (0.0%) |
| 16 and 17 Years | 8 (100.0%) | 81 (100.0%) |
| 18 to 24 Years | 32 (100.0%) | 125 (100.0%) |
| 25 to 34 Years | 61 (100.0%) | 19 (26.8%) |
| 35 to 44 Years | 181 (100.0%) | 159 (100.0%) |
| 45 to 54 Years | 77 (100.0%) | 127 (100.0%) |
| 55 to 64 Years | 69 (100.0%) | 105 (100.0%) |
| 65 to 74 Years | 212 (89.4%) | 66 (100.0%) |
| 75 Years and over | 27 (100.0%) | 24 (100.0%) |
| Total | 871 (97.2%) | 995 (88.9%) |
Income Below Poverty Among Married-Couple Families in Garfield
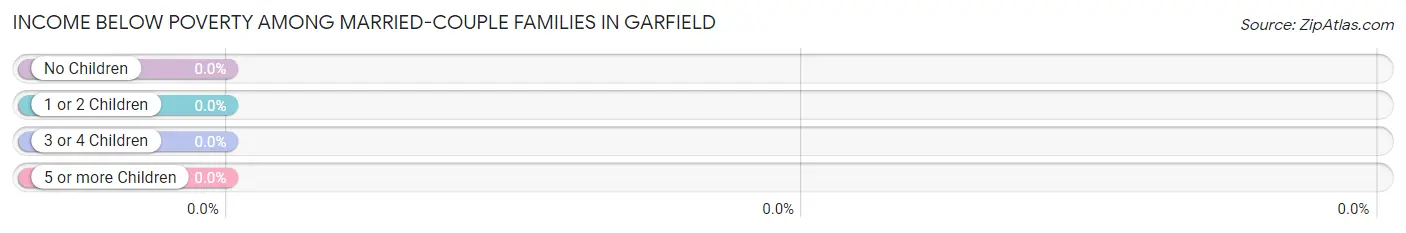
| Children | Above Poverty | Below Poverty |
| No Children | 199 (100.0%) | 0 (0.0%) |
| 1 or 2 Children | 89 (100.0%) | 0 (0.0%) |
| 3 or 4 Children | 118 (100.0%) | 0 (0.0%) |
| 5 or more Children | 0 (0.0%) | 0 (0.0%) |
| Total | 406 (100.0%) | 0 (0.0%) |
Income Below Poverty Among Single-Parent Households in Garfield
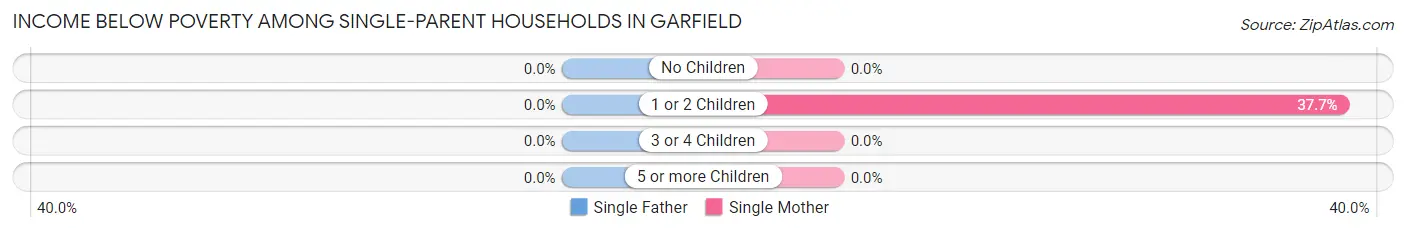
| Children | Single Father | Single Mother |
| No Children | 0 (0.0%) | 0 (0.0%) |
| 1 or 2 Children | 0 (0.0%) | 52 (37.7%) |
| 3 or 4 Children | 0 (0.0%) | 0 (0.0%) |
| 5 or more Children | 0 (0.0%) | 0 (0.0%) |
| Total | 0 (0.0%) | 52 (32.1%) |
Income Below Poverty Among Married-Couple vs Single-Parent Households in Garfield
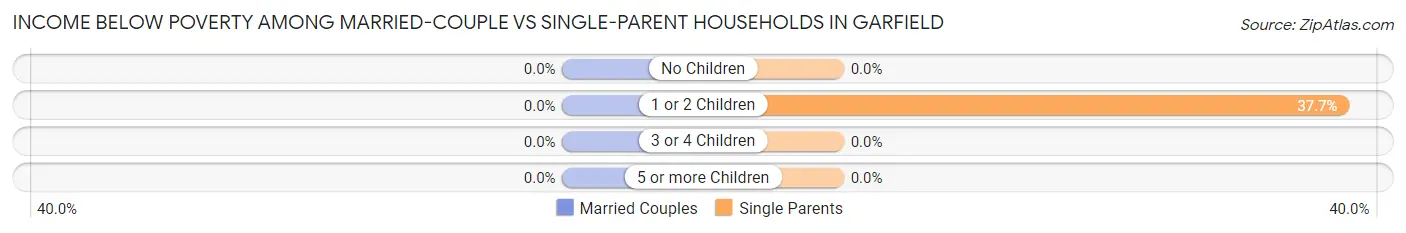
| Children | Married-Couple Families | Single-Parent Households |
| No Children | 0 (0.0%) | 0 (0.0%) |
| 1 or 2 Children | 0 (0.0%) | 52 (37.7%) |
| 3 or 4 Children | 0 (0.0%) | 0 (0.0%) |
| 5 or more Children | 0 (0.0%) | 0 (0.0%) |
| Total | 0 (0.0%) | 52 (32.1%) |
Employment Characteristics in Garfield
Employment by Class of Employer in Garfield
Among the 619 employed individuals in Garfield, private company employees (372 | 60.1%), self-employed (not incorporated) (108 | 17.4%), and self-employed (incorporated) (98 | 15.8%) make up the most common classes of employment.
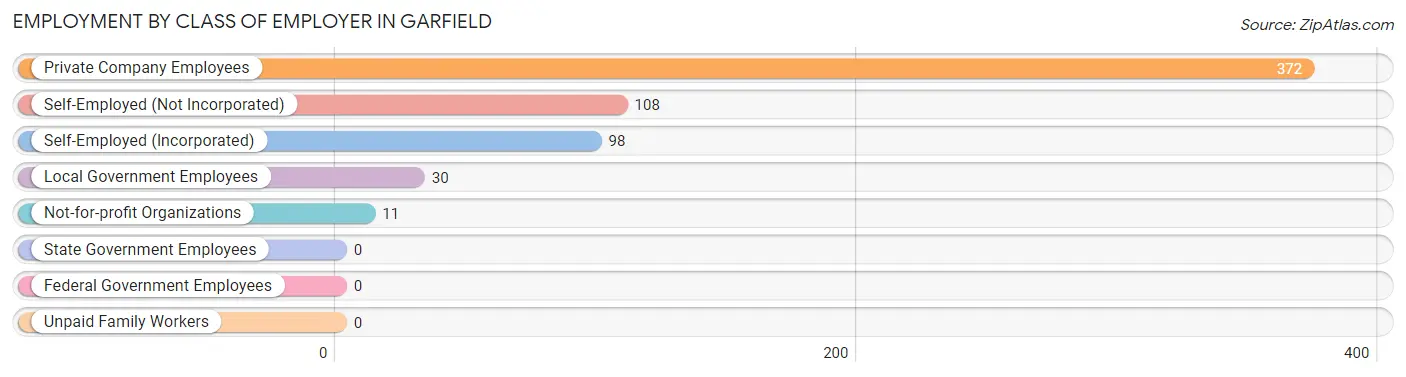
| Employer Class | # Employees | % Employees |
| Private Company Employees | 372 | 60.1% |
| Self-Employed (Incorporated) | 98 | 15.8% |
| Self-Employed (Not Incorporated) | 108 | 17.4% |
| Not-for-profit Organizations | 11 | 1.8% |
| Local Government Employees | 30 | 4.9% |
| State Government Employees | 0 | 0.0% |
| Federal Government Employees | 0 | 0.0% |
| Unpaid Family Workers | 0 | 0.0% |
| Total | 619 | 100.0% |
Employment Status by Age in Garfield
According to the labor force statistics for Garfield, out of the total population over 16 years of age (1,450), 51.0% or 740 individuals are in the labor force, with 16.2% or 120 of them unemployed. The age group with the highest labor force participation rate is 25 to 29 years, with 100.0% or 80 individuals in the labor force. Within the labor force, the 35 to 44 years age range has the highest percentage of unemployed individuals, with 30.3% or 74 of them being unemployed.
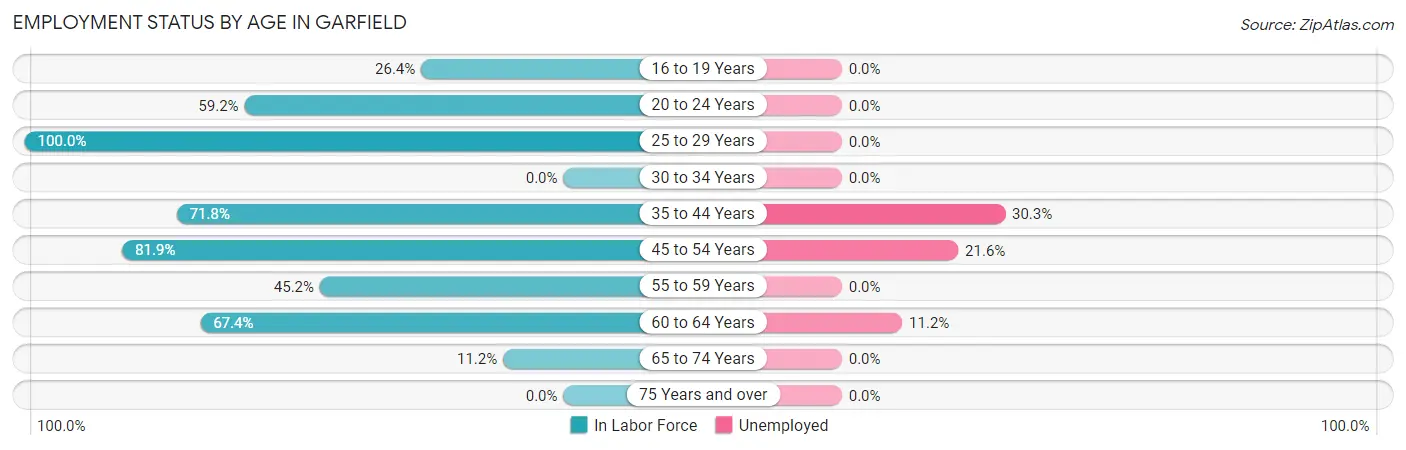
| Age Bracket | In Labor Force | Unemployed |
| 16 to 19 Years | 32 (26.4%) | 0 (0.0%) |
| 20 to 24 Years | 74 (59.2%) | 0 (0.0%) |
| 25 to 29 Years | 80 (100.0%) | 0 (0.0%) |
| 30 to 34 Years | 0 (0.0%) | 0 (0.0%) |
| 35 to 44 Years | 244 (71.8%) | 74 (30.3%) |
| 45 to 54 Years | 167 (81.9%) | 36 (21.6%) |
| 55 to 59 Years | 19 (45.2%) | 0 (0.0%) |
| 60 to 64 Years | 89 (67.4%) | 10 (11.2%) |
| 65 to 74 Years | 34 (11.2%) | 0 (0.0%) |
| 75 Years and over | 0 (0.0%) | 0 (0.0%) |
| Total | 740 (51.0%) | 120 (16.2%) |
Employment Status by Educational Attainment in Garfield
According to labor force statistics for Garfield, 70.5% of individuals (599) out of the total population between 25 and 64 years of age (850) are in the labor force, with 20.0% or 120 of them being unemployed. The group with the highest labor force participation rate are those with the educational attainment of less than high school, with 90.6% or 240 individuals in the labor force. Within the labor force, individuals with college / associate degree education have the highest percentage of unemployment, with 65.2% or 86 of them being unemployed.
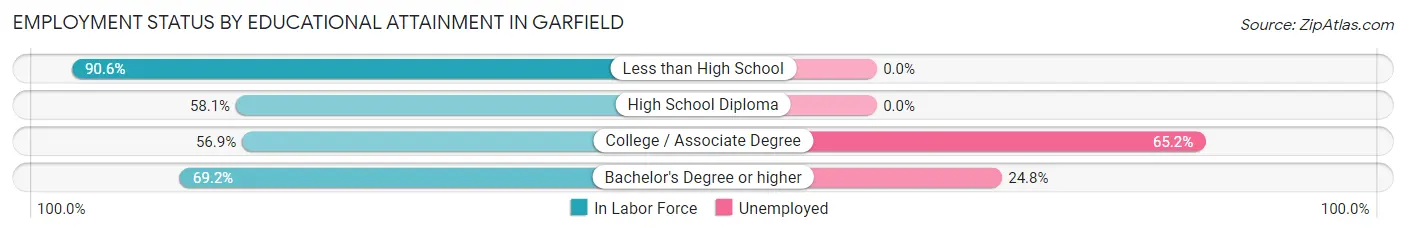
| Educational Attainment | In Labor Force | Unemployed |
| Less than High School | 240 (90.6%) | 0 (0.0%) |
| High School Diploma | 90 (58.1%) | 0 (0.0%) |
| College / Associate Degree | 132 (56.9%) | 151 (65.2%) |
| Bachelor's Degree or higher | 137 (69.2%) | 49 (24.8%) |
| Total | 599 (70.5%) | 170 (20.0%) |
Employment Occupations by Sex in Garfield
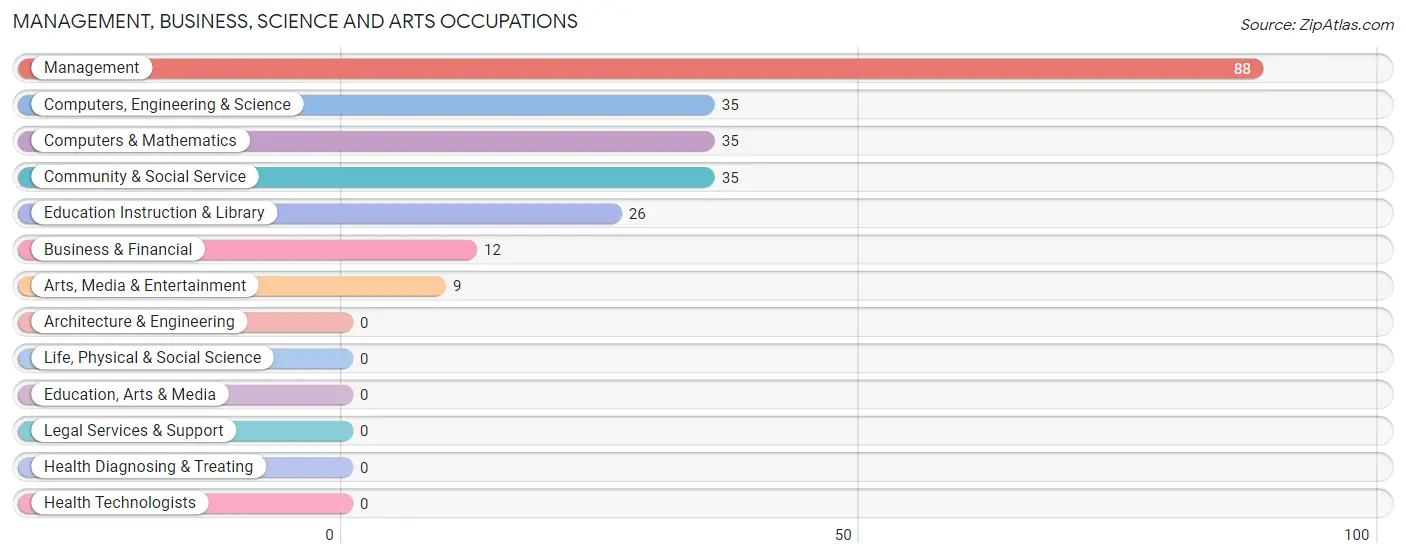
Management, Business, Science and Arts Occupations
The most common Management, Business, Science and Arts occupations in Garfield are Management (88 | 14.2%), Computers, Engineering & Science (35 | 5.7%), Computers & Mathematics (35 | 5.7%), Community & Social Service (35 | 5.7%), and Education Instruction & Library (26 | 4.2%).
Management, Business, Science and Arts Occupations by Sex
Within the Management, Business, Science and Arts occupations in Garfield, the most male-oriented occupations are Management (100.0%), Business & Financial (100.0%), and Computers, Engineering & Science (100.0%), while the most female-oriented occupations are Education Instruction & Library (100.0%), and Community & Social Service (74.3%).
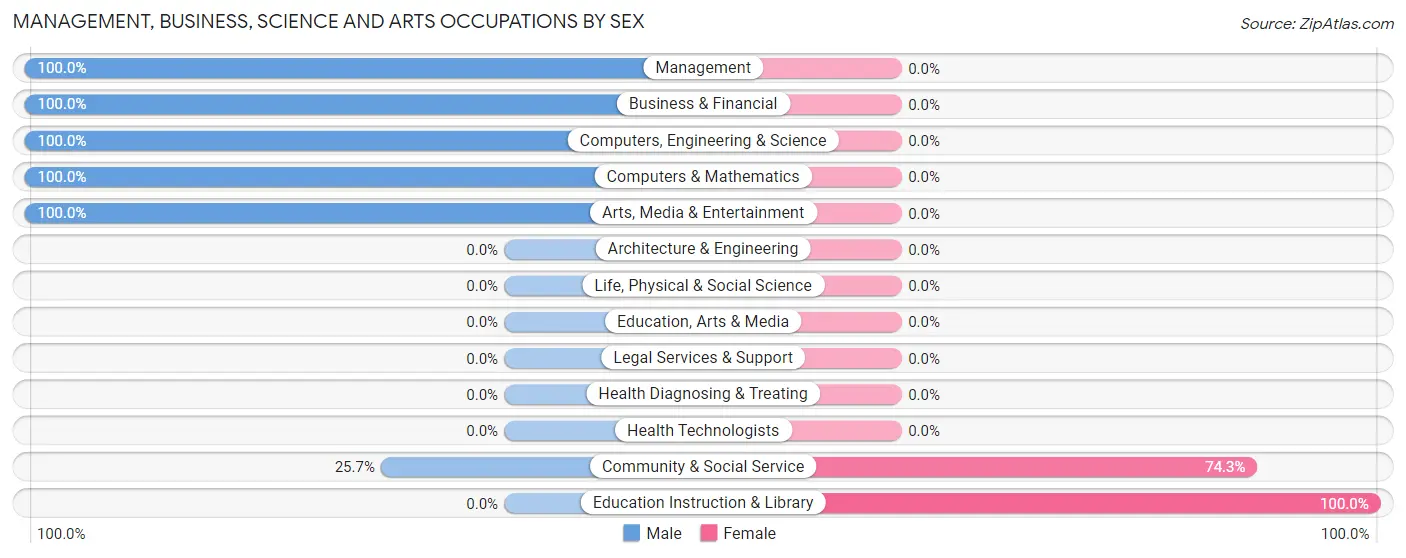
| Occupation | Male | Female |
| Management | 88 (100.0%) | 0 (0.0%) |
| Business & Financial | 12 (100.0%) | 0 (0.0%) |
| Computers, Engineering & Science | 35 (100.0%) | 0 (0.0%) |
| Computers & Mathematics | 35 (100.0%) | 0 (0.0%) |
| Architecture & Engineering | 0 (0.0%) | 0 (0.0%) |
| Life, Physical & Social Science | 0 (0.0%) | 0 (0.0%) |
| Community & Social Service | 9 (25.7%) | 26 (74.3%) |
| Education, Arts & Media | 0 (0.0%) | 0 (0.0%) |
| Legal Services & Support | 0 (0.0%) | 0 (0.0%) |
| Education Instruction & Library | 0 (0.0%) | 26 (100.0%) |
| Arts, Media & Entertainment | 9 (100.0%) | 0 (0.0%) |
| Health Diagnosing & Treating | 0 (0.0%) | 0 (0.0%) |
| Health Technologists | 0 (0.0%) | 0 (0.0%) |
| Total (Category) | 144 (84.7%) | 26 (15.3%) |
| Total (Overall) | 326 (52.7%) | 293 (47.3%) |
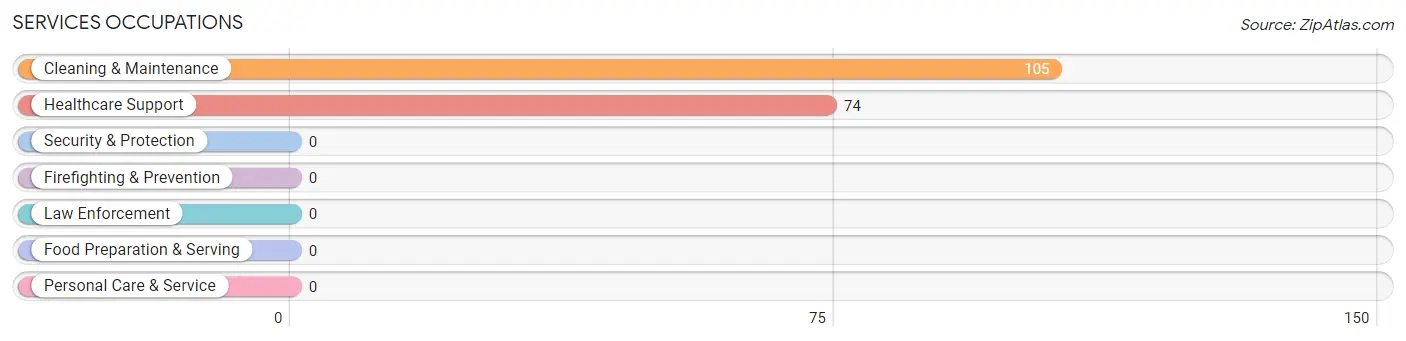
Services Occupations
The most common Services occupations in Garfield are Cleaning & Maintenance (105 | 17.0%), and Healthcare Support (74 | 11.9%).
Services Occupations by Sex
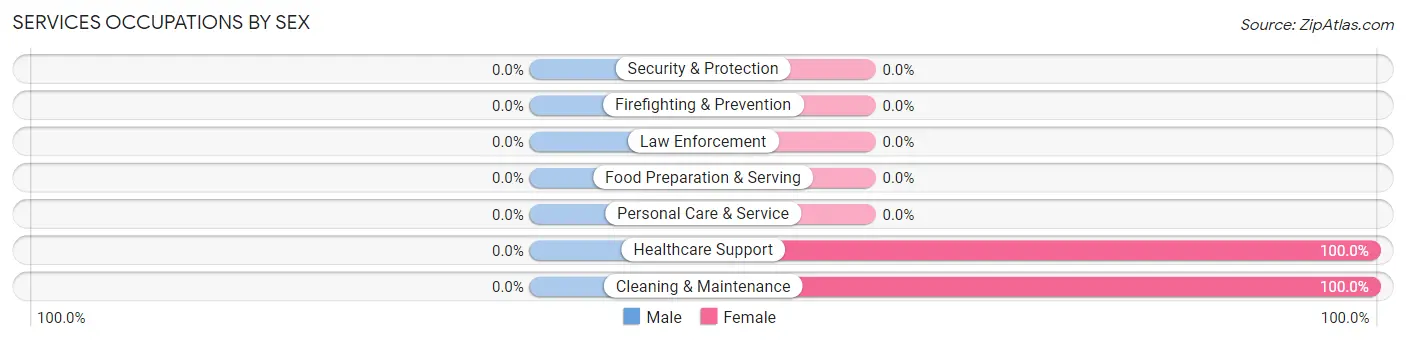
| Occupation | Male | Female |
| Healthcare Support | 0 (0.0%) | 74 (100.0%) |
| Security & Protection | 0 (0.0%) | 0 (0.0%) |
| Firefighting & Prevention | 0 (0.0%) | 0 (0.0%) |
| Law Enforcement | 0 (0.0%) | 0 (0.0%) |
| Food Preparation & Serving | 0 (0.0%) | 0 (0.0%) |
| Cleaning & Maintenance | 0 (0.0%) | 105 (100.0%) |
| Personal Care & Service | 0 (0.0%) | 0 (0.0%) |
| Total (Category) | 0 (0.0%) | 179 (100.0%) |
| Total (Overall) | 326 (52.7%) | 293 (47.3%) |
Sales and Office Occupations
The most common Sales and Office occupations in Garfield are Office & Administration (74 | 11.9%), and Sales & Related (44 | 7.1%).
Sales and Office Occupations by Sex

| Occupation | Male | Female |
| Sales & Related | 30 (68.2%) | 14 (31.8%) |
| Office & Administration | 0 (0.0%) | 74 (100.0%) |
| Total (Category) | 30 (25.4%) | 88 (74.6%) |
| Total (Overall) | 326 (52.7%) | 293 (47.3%) |
Natural Resources, Construction and Maintenance Occupations
The most common Natural Resources, Construction and Maintenance occupations in Garfield are Installation, Maintenance & Repair (4 | 0.6%), and Construction & Extraction (2 | 0.3%).
Natural Resources, Construction and Maintenance Occupations by Sex
| Occupation | Male | Female |
| Farming, Fishing & Forestry | 0 (0.0%) | 0 (0.0%) |
| Construction & Extraction | 2 (100.0%) | 0 (0.0%) |
| Installation, Maintenance & Repair | 4 (100.0%) | 0 (0.0%) |
| Total (Category) | 6 (100.0%) | 0 (0.0%) |
| Total (Overall) | 326 (52.7%) | 293 (47.3%) |
Production, Transportation and Moving Occupations
The most common Production, Transportation and Moving occupations in Garfield are Production (72 | 11.6%), Transportation (54 | 8.7%), and Material Moving (20 | 3.2%).
Production, Transportation and Moving Occupations by Sex
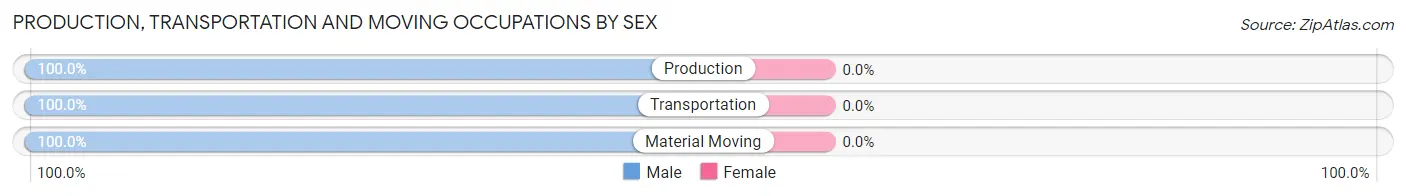
| Occupation | Male | Female |
| Production | 72 (100.0%) | 0 (0.0%) |
| Transportation | 54 (100.0%) | 0 (0.0%) |
| Material Moving | 20 (100.0%) | 0 (0.0%) |
| Total (Category) | 146 (100.0%) | 0 (0.0%) |
| Total (Overall) | 326 (52.7%) | 293 (47.3%) |
Employment Industries by Sex in Garfield
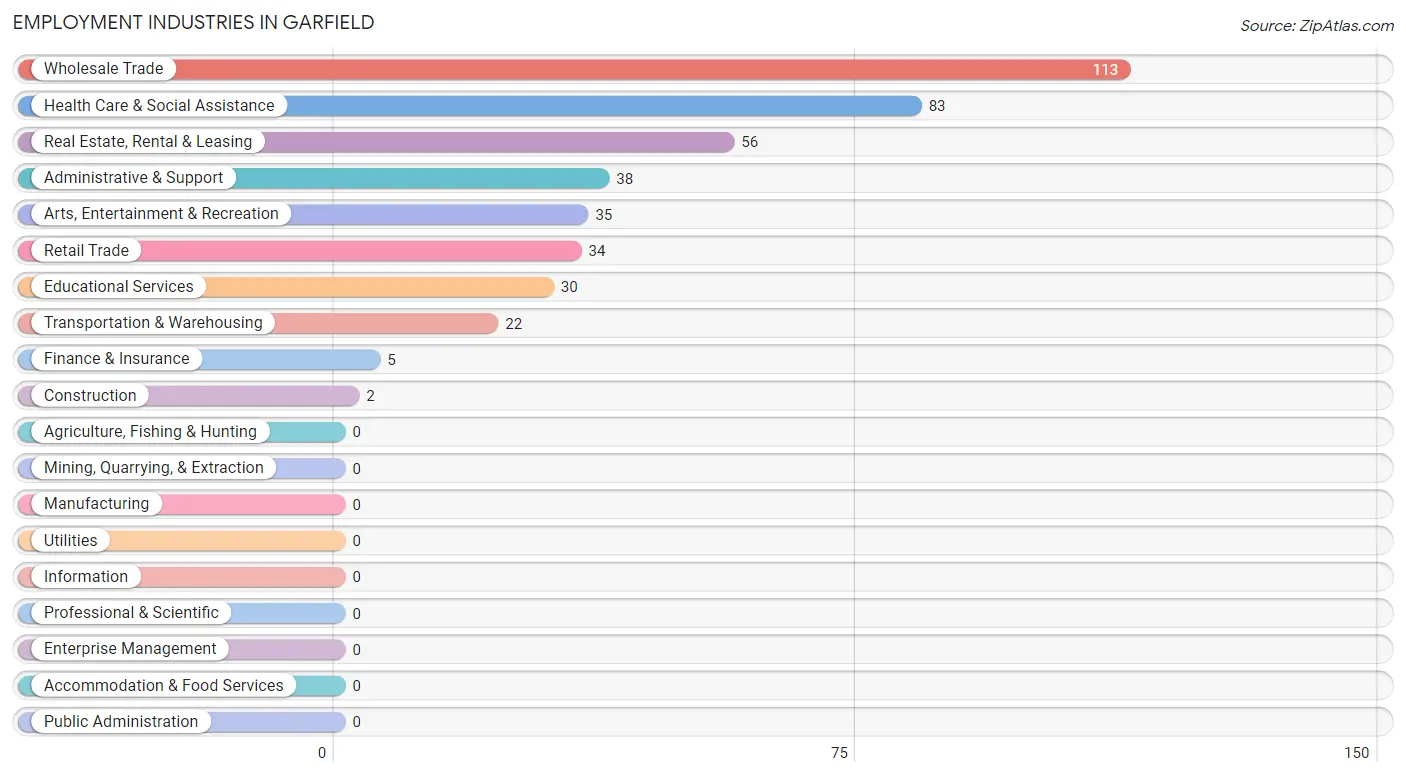
Employment Industries in Garfield
The major employment industries in Garfield include Wholesale Trade (113 | 18.3%), Health Care & Social Assistance (83 | 13.4%), Real Estate, Rental & Leasing (56 | 9.0%), Administrative & Support (38 | 6.1%), and Arts, Entertainment & Recreation (35 | 5.7%).
Employment Industries by Sex in Garfield
The Garfield industries that see more men than women are Construction (100.0%), Transportation & Warehousing (100.0%), and Finance & Insurance (100.0%), whereas the industries that tend to have a higher number of women are Administrative & Support (100.0%), Educational Services (100.0%), and Health Care & Social Assistance (89.2%).
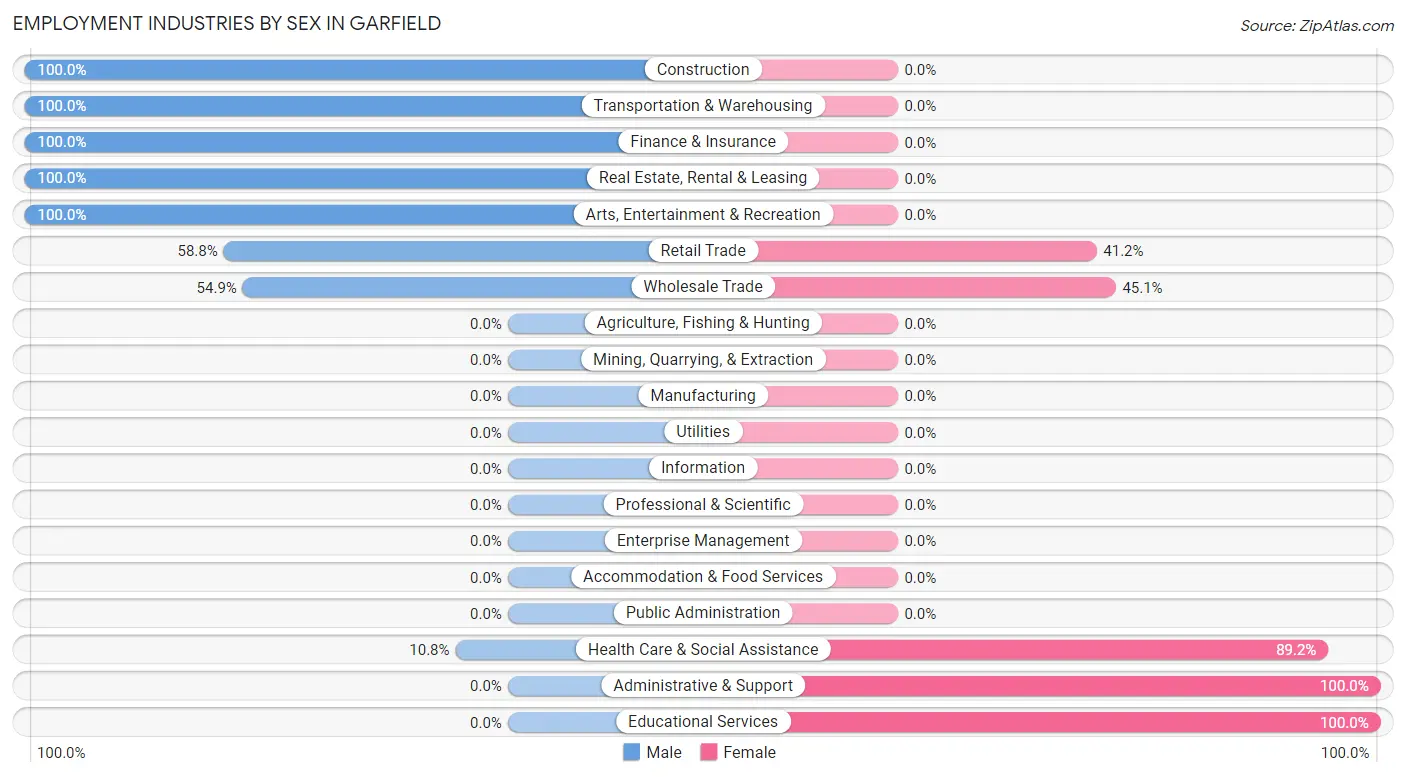
| Industry | Male | Female |
| Agriculture, Fishing & Hunting | 0 (0.0%) | 0 (0.0%) |
| Mining, Quarrying, & Extraction | 0 (0.0%) | 0 (0.0%) |
| Construction | 2 (100.0%) | 0 (0.0%) |
| Manufacturing | 0 (0.0%) | 0 (0.0%) |
| Wholesale Trade | 62 (54.9%) | 51 (45.1%) |
| Retail Trade | 20 (58.8%) | 14 (41.2%) |
| Transportation & Warehousing | 22 (100.0%) | 0 (0.0%) |
| Utilities | 0 (0.0%) | 0 (0.0%) |
| Information | 0 (0.0%) | 0 (0.0%) |
| Finance & Insurance | 5 (100.0%) | 0 (0.0%) |
| Real Estate, Rental & Leasing | 56 (100.0%) | 0 (0.0%) |
| Professional & Scientific | 0 (0.0%) | 0 (0.0%) |
| Enterprise Management | 0 (0.0%) | 0 (0.0%) |
| Administrative & Support | 0 (0.0%) | 38 (100.0%) |
| Educational Services | 0 (0.0%) | 30 (100.0%) |
| Health Care & Social Assistance | 9 (10.8%) | 74 (89.2%) |
| Arts, Entertainment & Recreation | 35 (100.0%) | 0 (0.0%) |
| Accommodation & Food Services | 0 (0.0%) | 0 (0.0%) |
| Public Administration | 0 (0.0%) | 0 (0.0%) |
| Total | 326 (52.7%) | 293 (47.3%) |
Education in Garfield
School Enrollment in Garfield
The most common levels of schooling among the 650 students in Garfield are elementary school (177 | 27.2%), middle school (163 | 25.1%), and high school (161 | 24.8%).
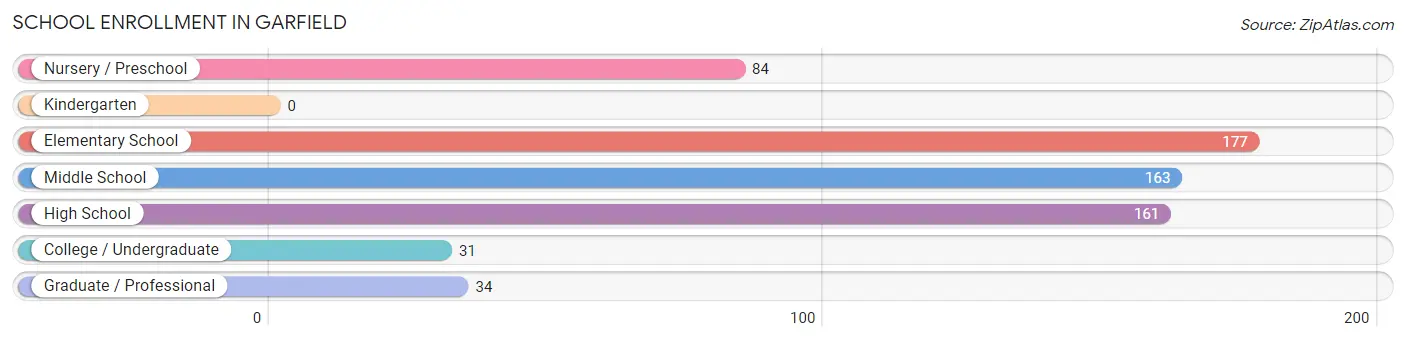
| School Level | # Students | % Students |
| Nursery / Preschool | 84 | 12.9% |
| Kindergarten | 0 | 0.0% |
| Elementary School | 177 | 27.2% |
| Middle School | 163 | 25.1% |
| High School | 161 | 24.8% |
| College / Undergraduate | 31 | 4.8% |
| Graduate / Professional | 34 | 5.2% |
| Total | 650 | 100.0% |
School Enrollment by Age by Funding Source in Garfield
Out of a total of 650 students who are enrolled in schools in Garfield, 98 (15.1%) attend a private institution, while the remaining 552 (84.9%) are enrolled in public schools. The age group of 3 to 4 year olds has the highest likelihood of being enrolled in private schools, with 64 (100.0% in the age bracket) enrolled. Conversely, the age group of 5 to 9 year old has the lowest likelihood of being enrolled in a private school, with 107 (100.0% in the age bracket) attending a public institution.
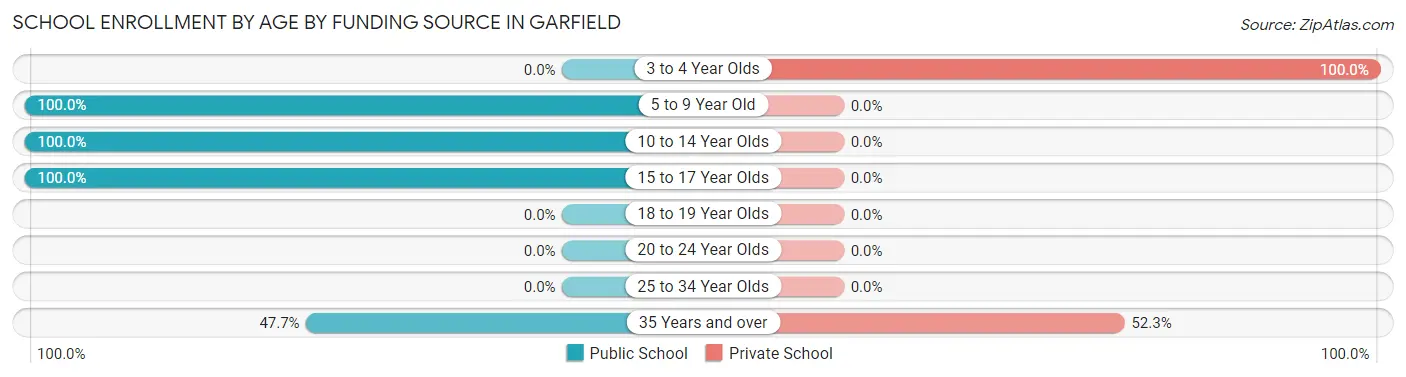
| Age Bracket | Public School | Private School |
| 3 to 4 Year Olds | 0 (0.0%) | 64 (100.0%) |
| 5 to 9 Year Old | 107 (100.0%) | 0 (0.0%) |
| 10 to 14 Year Olds | 253 (100.0%) | 0 (0.0%) |
| 15 to 17 Year Olds | 161 (100.0%) | 0 (0.0%) |
| 18 to 19 Year Olds | 0 (0.0%) | 0 (0.0%) |
| 20 to 24 Year Olds | 0 (0.0%) | 0 (0.0%) |
| 25 to 34 Year Olds | 0 (0.0%) | 0 (0.0%) |
| 35 Years and over | 31 (47.7%) | 34 (52.3%) |
| Total | 552 (84.9%) | 98 (15.1%) |
Educational Attainment by Field of Study in Garfield
Communications (56 | 23.5%), engineering (40 | 16.8%), business (39 | 16.4%), arts & humanities (33 | 13.9%), and science & technology (28 | 11.8%) are the most common fields of study among 238 individuals in Garfield who have obtained a bachelor's degree or higher.
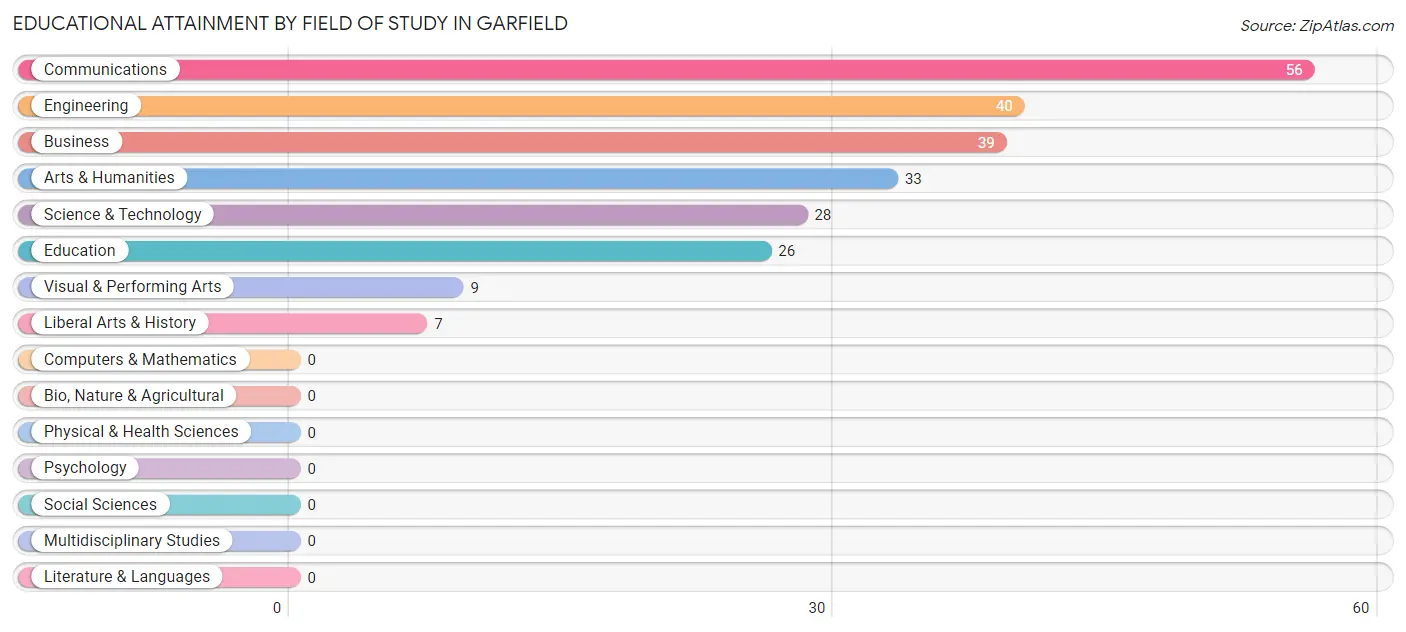
| Field of Study | # Graduates | % Graduates |
| Computers & Mathematics | 0 | 0.0% |
| Bio, Nature & Agricultural | 0 | 0.0% |
| Physical & Health Sciences | 0 | 0.0% |
| Psychology | 0 | 0.0% |
| Social Sciences | 0 | 0.0% |
| Engineering | 40 | 16.8% |
| Multidisciplinary Studies | 0 | 0.0% |
| Science & Technology | 28 | 11.8% |
| Business | 39 | 16.4% |
| Education | 26 | 10.9% |
| Literature & Languages | 0 | 0.0% |
| Liberal Arts & History | 7 | 2.9% |
| Visual & Performing Arts | 9 | 3.8% |
| Communications | 56 | 23.5% |
| Arts & Humanities | 33 | 13.9% |
| Total | 238 | 100.0% |
Transportation & Commute in Garfield
Vehicle Availability by Sex in Garfield
The most prevalent vehicle ownership categories in Garfield are males with 2 vehicles (159, accounting for 48.8%) and females with 2 vehicles (160, making up 54.3%).
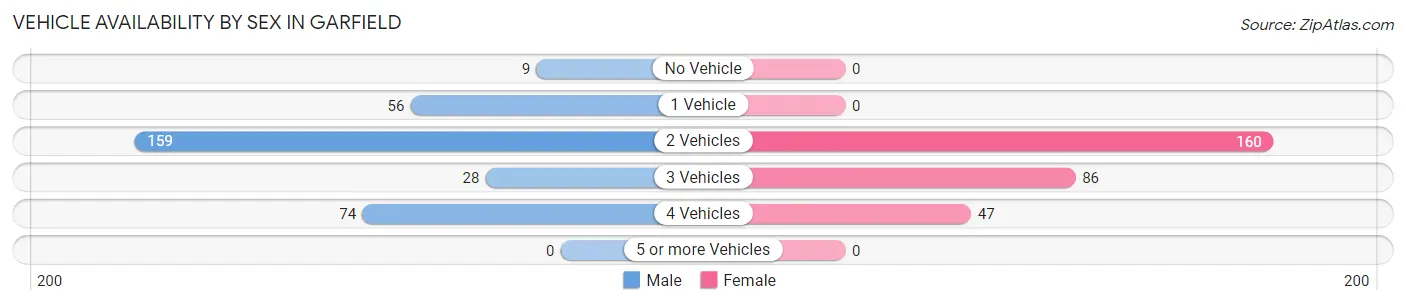
| Vehicles Available | Male | Female |
| No Vehicle | 9 (2.8%) | 0 (0.0%) |
| 1 Vehicle | 56 (17.2%) | 0 (0.0%) |
| 2 Vehicles | 159 (48.8%) | 160 (54.6%) |
| 3 Vehicles | 28 (8.6%) | 86 (29.3%) |
| 4 Vehicles | 74 (22.7%) | 47 (16.0%) |
| 5 or more Vehicles | 0 (0.0%) | 0 (0.0%) |
| Total | 326 (100.0%) | 293 (100.0%) |
Commute Time in Garfield
The most frequently occuring commute durations in Garfield are 45 to 59 minutes (139 commuters, 22.5%), 30 to 34 minutes (134 commuters, 21.6%), and 15 to 19 minutes (127 commuters, 20.5%).
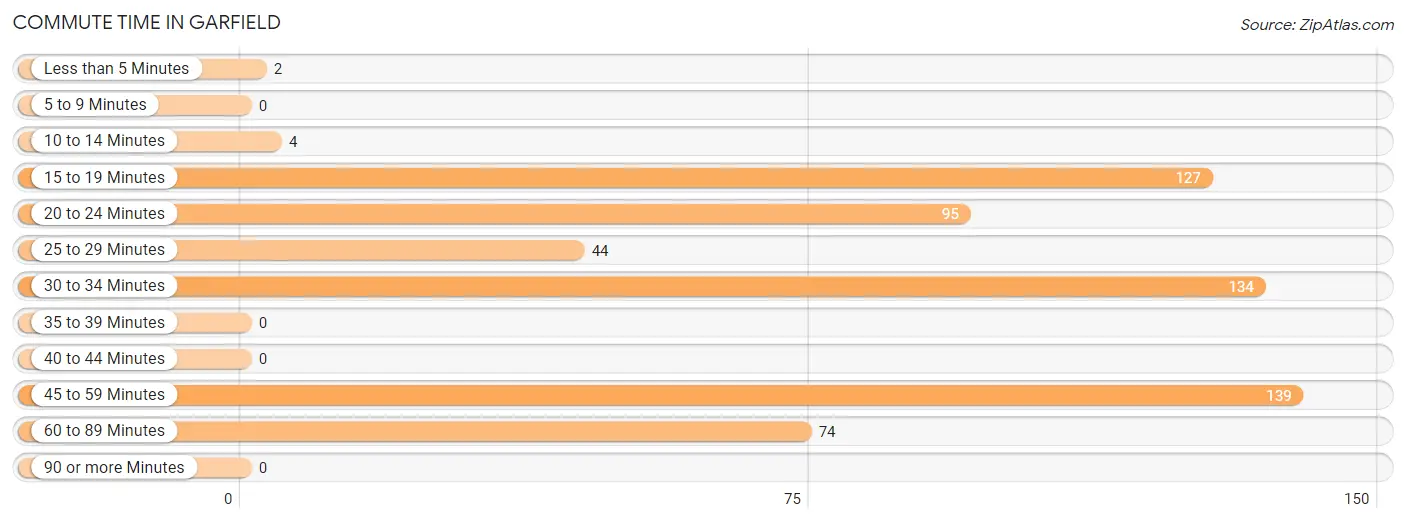
| Commute Time | # Commuters | % Commuters |
| Less than 5 Minutes | 2 | 0.3% |
| 5 to 9 Minutes | 0 | 0.0% |
| 10 to 14 Minutes | 4 | 0.6% |
| 15 to 19 Minutes | 127 | 20.5% |
| 20 to 24 Minutes | 95 | 15.3% |
| 25 to 29 Minutes | 44 | 7.1% |
| 30 to 34 Minutes | 134 | 21.6% |
| 35 to 39 Minutes | 0 | 0.0% |
| 40 to 44 Minutes | 0 | 0.0% |
| 45 to 59 Minutes | 139 | 22.5% |
| 60 to 89 Minutes | 74 | 11.9% |
| 90 or more Minutes | 0 | 0.0% |
Commute Time by Sex in Garfield
The most common commute times in Garfield are 20 to 24 minutes (95 commuters, 29.1%) for males and 30 to 34 minutes (134 commuters, 45.7%) for females.
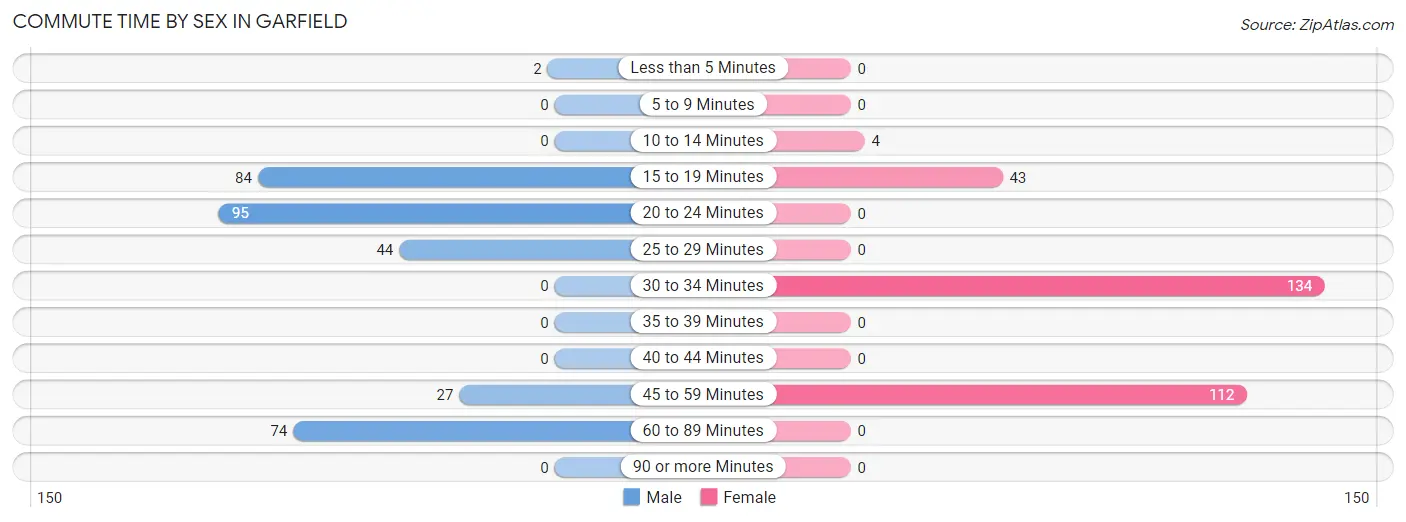
| Commute Time | Male | Female |
| Less than 5 Minutes | 2 (0.6%) | 0 (0.0%) |
| 5 to 9 Minutes | 0 (0.0%) | 0 (0.0%) |
| 10 to 14 Minutes | 0 (0.0%) | 4 (1.4%) |
| 15 to 19 Minutes | 84 (25.8%) | 43 (14.7%) |
| 20 to 24 Minutes | 95 (29.1%) | 0 (0.0%) |
| 25 to 29 Minutes | 44 (13.5%) | 0 (0.0%) |
| 30 to 34 Minutes | 0 (0.0%) | 134 (45.7%) |
| 35 to 39 Minutes | 0 (0.0%) | 0 (0.0%) |
| 40 to 44 Minutes | 0 (0.0%) | 0 (0.0%) |
| 45 to 59 Minutes | 27 (8.3%) | 112 (38.2%) |
| 60 to 89 Minutes | 74 (22.7%) | 0 (0.0%) |
| 90 or more Minutes | 0 (0.0%) | 0 (0.0%) |
Time of Departure to Work by Sex in Garfield
The most frequent times of departure to work in Garfield are 12:00 AM to 4:59 AM (88, 27.0%) for males and 7:30 AM to 7:59 AM (112, 38.2%) for females.
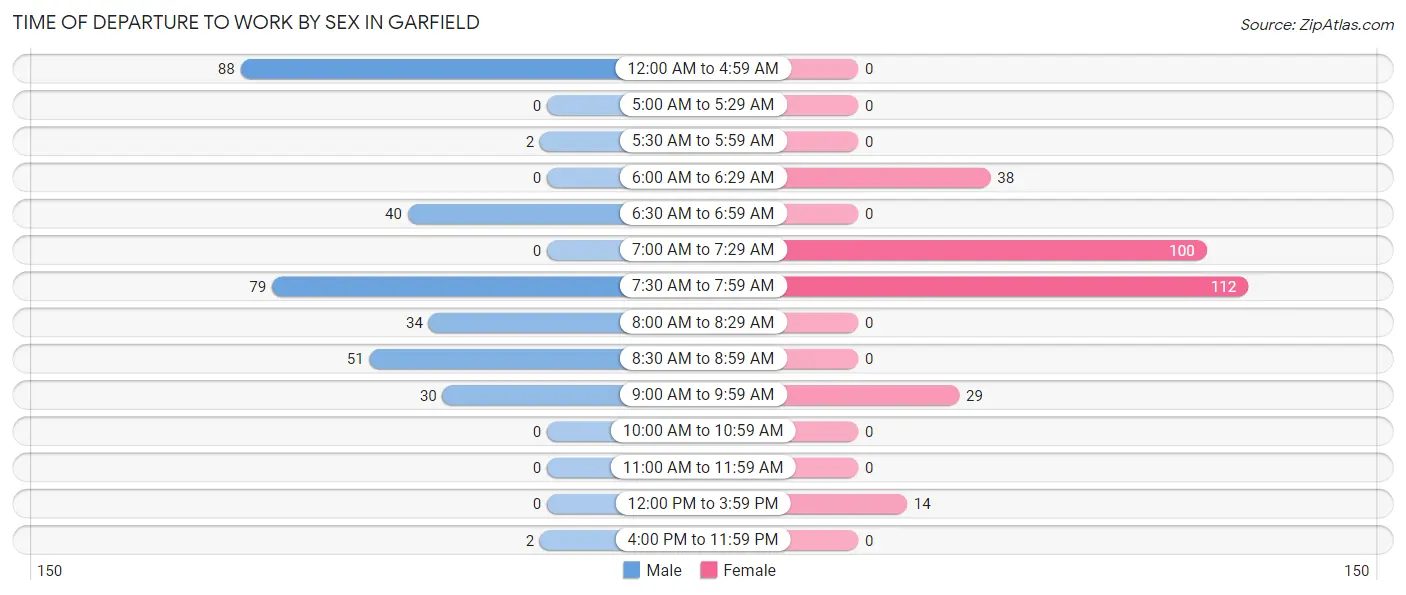
| Time of Departure | Male | Female |
| 12:00 AM to 4:59 AM | 88 (27.0%) | 0 (0.0%) |
| 5:00 AM to 5:29 AM | 0 (0.0%) | 0 (0.0%) |
| 5:30 AM to 5:59 AM | 2 (0.6%) | 0 (0.0%) |
| 6:00 AM to 6:29 AM | 0 (0.0%) | 38 (13.0%) |
| 6:30 AM to 6:59 AM | 40 (12.3%) | 0 (0.0%) |
| 7:00 AM to 7:29 AM | 0 (0.0%) | 100 (34.1%) |
| 7:30 AM to 7:59 AM | 79 (24.2%) | 112 (38.2%) |
| 8:00 AM to 8:29 AM | 34 (10.4%) | 0 (0.0%) |
| 8:30 AM to 8:59 AM | 51 (15.6%) | 0 (0.0%) |
| 9:00 AM to 9:59 AM | 30 (9.2%) | 29 (9.9%) |
| 10:00 AM to 10:59 AM | 0 (0.0%) | 0 (0.0%) |
| 11:00 AM to 11:59 AM | 0 (0.0%) | 0 (0.0%) |
| 12:00 PM to 3:59 PM | 0 (0.0%) | 14 (4.8%) |
| 4:00 PM to 11:59 PM | 2 (0.6%) | 0 (0.0%) |
| Total | 326 (100.0%) | 293 (100.0%) |
Housing Occupancy in Garfield
Occupancy by Ownership in Garfield
Of the total 713 dwellings in Garfield, owner-occupied units account for 582 (81.6%), while renter-occupied units make up 131 (18.4%).
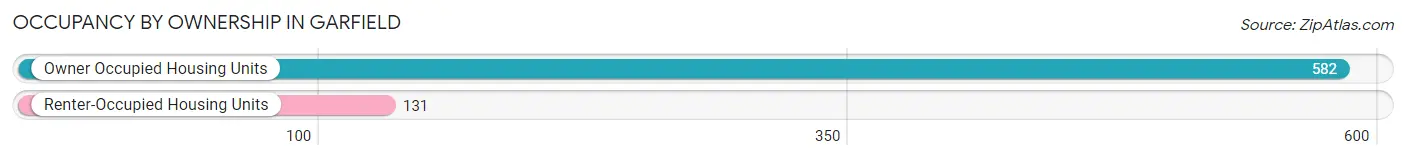
| Occupancy | # Housing Units | % Housing Units |
| Owner Occupied Housing Units | 582 | 81.6% |
| Renter-Occupied Housing Units | 131 | 18.4% |
| Total Occupied Housing Units | 713 | 100.0% |
Occupancy by Household Size in Garfield
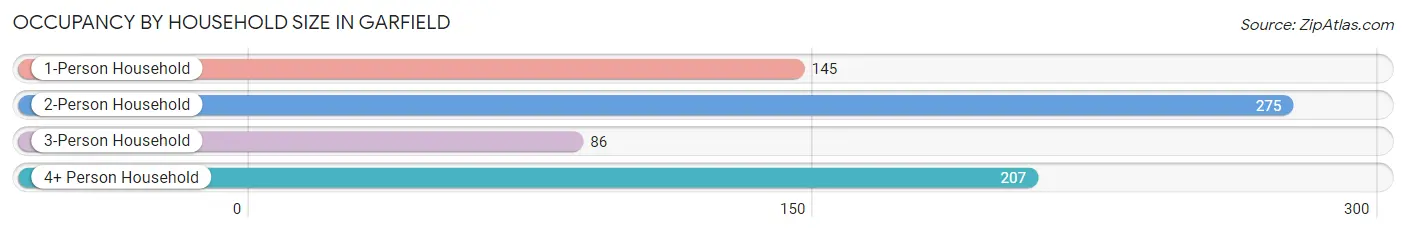
| Household Size | # Housing Units | % Housing Units |
| 1-Person Household | 145 | 20.3% |
| 2-Person Household | 275 | 38.6% |
| 3-Person Household | 86 | 12.1% |
| 4+ Person Household | 207 | 29.0% |
| Total Housing Units | 713 | 100.0% |
Occupancy by Ownership by Household Size in Garfield
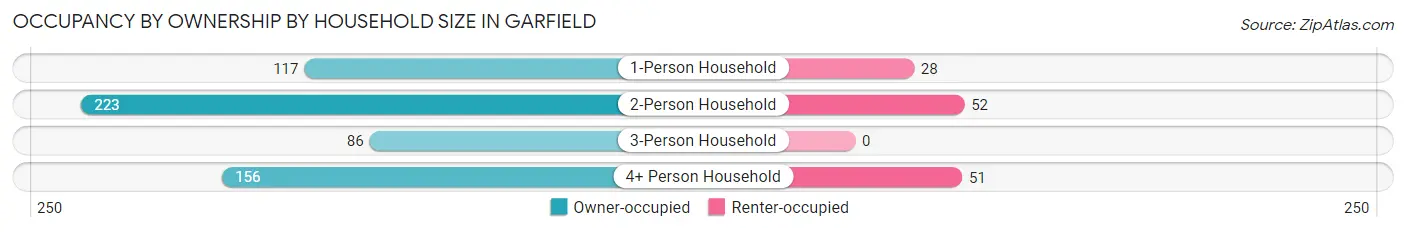
| Household Size | Owner-occupied | Renter-occupied |
| 1-Person Household | 117 (80.7%) | 28 (19.3%) |
| 2-Person Household | 223 (81.1%) | 52 (18.9%) |
| 3-Person Household | 86 (100.0%) | 0 (0.0%) |
| 4+ Person Household | 156 (75.4%) | 51 (24.6%) |
| Total Housing Units | 582 (81.6%) | 131 (18.4%) |
Occupancy by Educational Attainment in Garfield
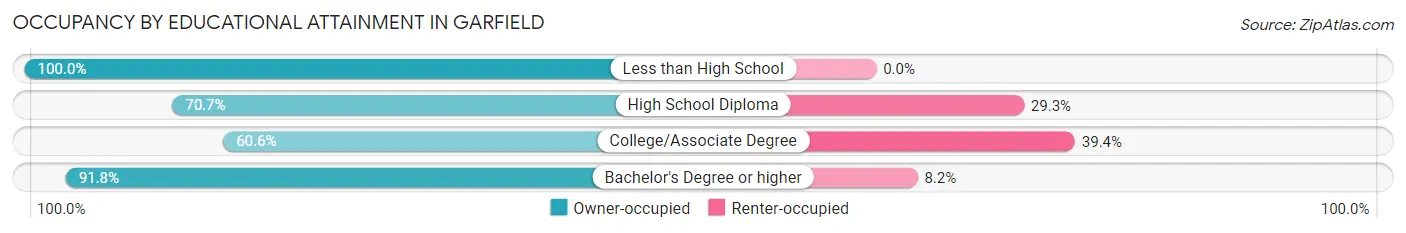
| Household Size | Owner-occupied | Renter-occupied |
| Less than High School | 232 (100.0%) | 0 (0.0%) |
| High School Diploma | 169 (70.7%) | 70 (29.3%) |
| College/Associate Degree | 80 (60.6%) | 52 (39.4%) |
| Bachelor's Degree or higher | 101 (91.8%) | 9 (8.2%) |
Occupancy by Age of Householder in Garfield
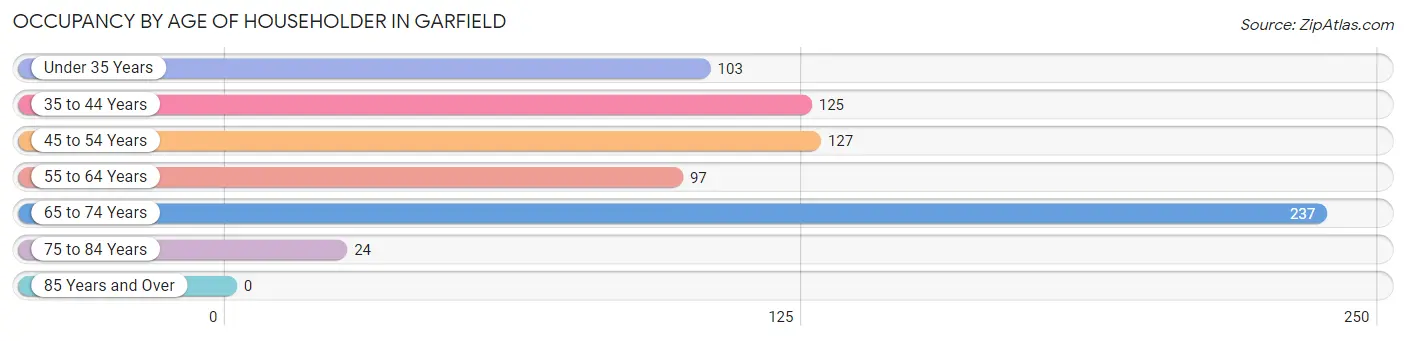
| Age Bracket | # Households | % Households |
| Under 35 Years | 103 | 14.4% |
| 35 to 44 Years | 125 | 17.5% |
| 45 to 54 Years | 127 | 17.8% |
| 55 to 64 Years | 97 | 13.6% |
| 65 to 74 Years | 237 | 33.2% |
| 75 to 84 Years | 24 | 3.4% |
| 85 Years and Over | 0 | 0.0% |
| Total | 713 | 100.0% |
Housing Finances in Garfield
Median Income by Occupancy in Garfield
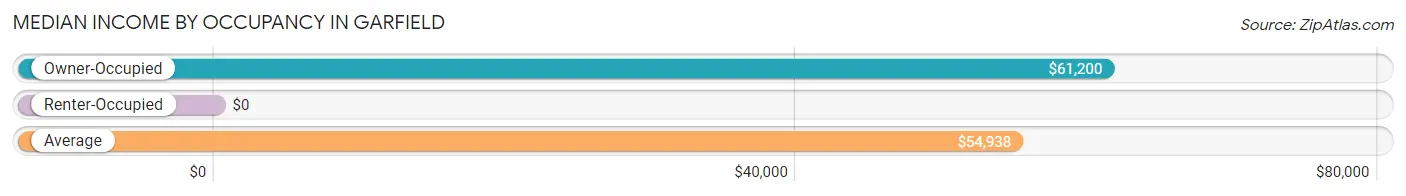
| Occupancy Type | # Households | Median Income |
| Owner-Occupied | 582 (81.6%) | $61,200 |
| Renter-Occupied | 131 (18.4%) | $0 |
| Average | 713 (100.0%) | $54,938 |
Occupancy by Householder Income Bracket in Garfield
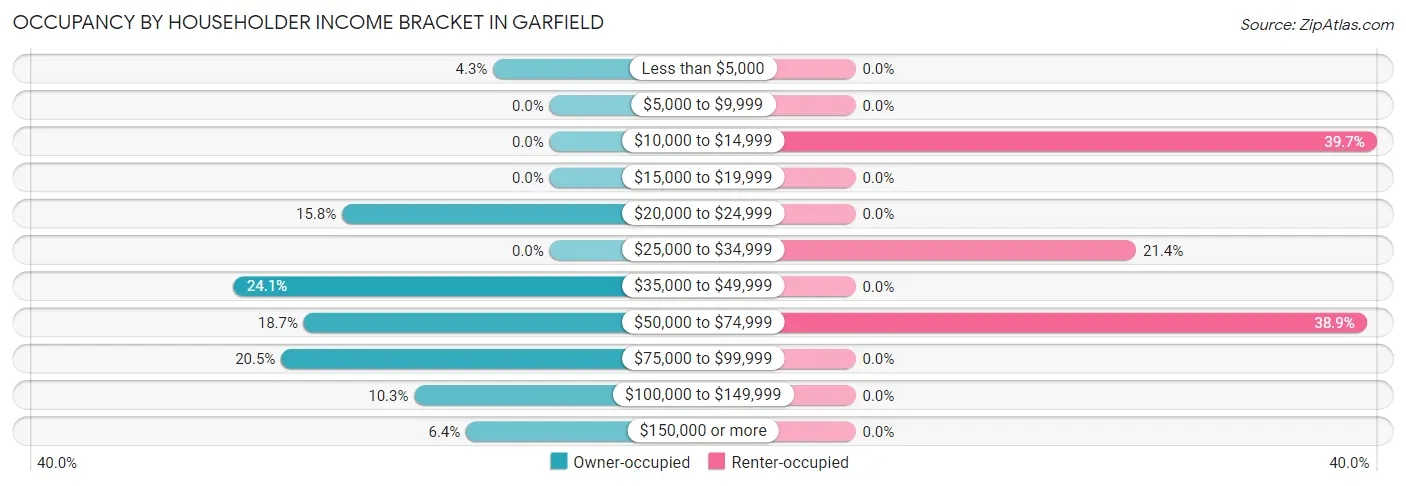
| Income Bracket | Owner-occupied | Renter-occupied |
| Less than $5,000 | 25 (4.3%) | 0 (0.0%) |
| $5,000 to $9,999 | 0 (0.0%) | 0 (0.0%) |
| $10,000 to $14,999 | 0 (0.0%) | 52 (39.7%) |
| $15,000 to $19,999 | 0 (0.0%) | 0 (0.0%) |
| $20,000 to $24,999 | 92 (15.8%) | 0 (0.0%) |
| $25,000 to $34,999 | 0 (0.0%) | 28 (21.4%) |
| $35,000 to $49,999 | 140 (24.0%) | 0 (0.0%) |
| $50,000 to $74,999 | 109 (18.7%) | 51 (38.9%) |
| $75,000 to $99,999 | 119 (20.4%) | 0 (0.0%) |
| $100,000 to $149,999 | 60 (10.3%) | 0 (0.0%) |
| $150,000 or more | 37 (6.4%) | 0 (0.0%) |
| Total | 582 (100.0%) | 131 (100.0%) |
Monthly Housing Cost Tiers in Garfield
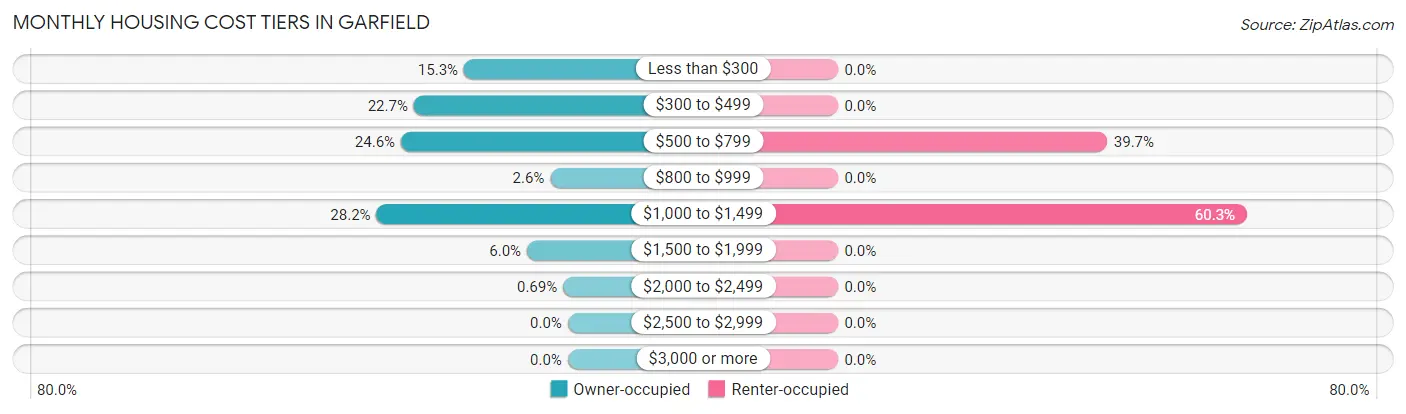
| Monthly Cost | Owner-occupied | Renter-occupied |
| Less than $300 | 89 (15.3%) | 0 (0.0%) |
| $300 to $499 | 132 (22.7%) | 0 (0.0%) |
| $500 to $799 | 143 (24.6%) | 52 (39.7%) |
| $800 to $999 | 15 (2.6%) | 0 (0.0%) |
| $1,000 to $1,499 | 164 (28.2%) | 79 (60.3%) |
| $1,500 to $1,999 | 35 (6.0%) | 0 (0.0%) |
| $2,000 to $2,499 | 4 (0.7%) | 0 (0.0%) |
| $2,500 to $2,999 | 0 (0.0%) | 0 (0.0%) |
| $3,000 or more | 0 (0.0%) | 0 (0.0%) |
| Total | 582 (100.0%) | 131 (100.0%) |
Physical Housing Characteristics in Garfield
Housing Structures in Garfield
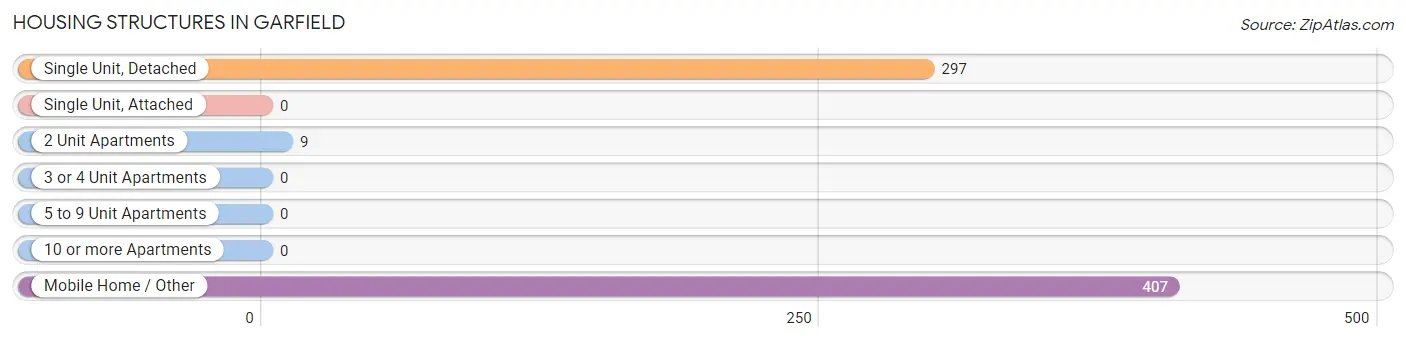
| Structure Type | # Housing Units | % Housing Units |
| Single Unit, Detached | 297 | 41.6% |
| Single Unit, Attached | 0 | 0.0% |
| 2 Unit Apartments | 9 | 1.3% |
| 3 or 4 Unit Apartments | 0 | 0.0% |
| 5 to 9 Unit Apartments | 0 | 0.0% |
| 10 or more Apartments | 0 | 0.0% |
| Mobile Home / Other | 407 | 57.1% |
| Total | 713 | 100.0% |
Housing Structures by Occupancy in Garfield
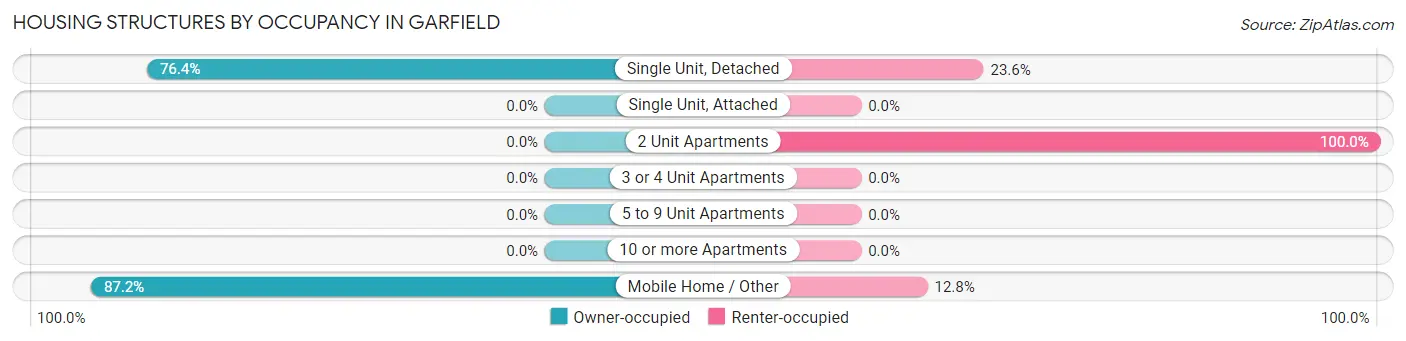
| Structure Type | Owner-occupied | Renter-occupied |
| Single Unit, Detached | 227 (76.4%) | 70 (23.6%) |
| Single Unit, Attached | 0 (0.0%) | 0 (0.0%) |
| 2 Unit Apartments | 0 (0.0%) | 9 (100.0%) |
| 3 or 4 Unit Apartments | 0 (0.0%) | 0 (0.0%) |
| 5 to 9 Unit Apartments | 0 (0.0%) | 0 (0.0%) |
| 10 or more Apartments | 0 (0.0%) | 0 (0.0%) |
| Mobile Home / Other | 355 (87.2%) | 52 (12.8%) |
| Total | 582 (81.6%) | 131 (18.4%) |
Housing Structures by Number of Rooms in Garfield
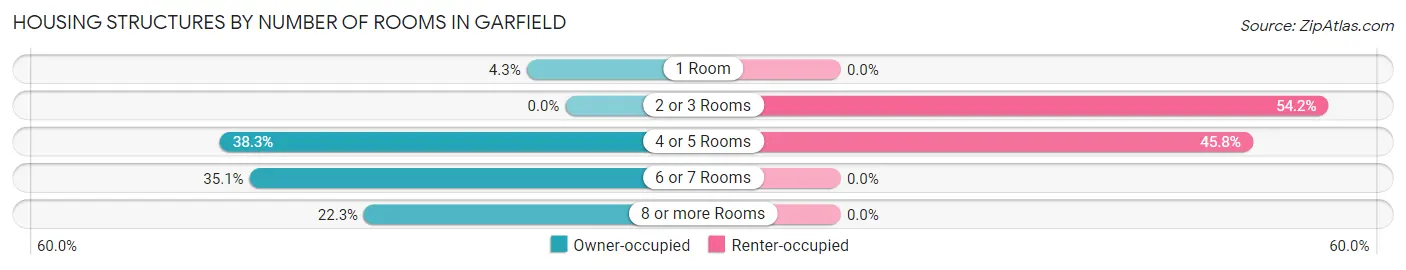
| Number of Rooms | Owner-occupied | Renter-occupied |
| 1 Room | 25 (4.3%) | 0 (0.0%) |
| 2 or 3 Rooms | 0 (0.0%) | 71 (54.2%) |
| 4 or 5 Rooms | 223 (38.3%) | 60 (45.8%) |
| 6 or 7 Rooms | 204 (35.0%) | 0 (0.0%) |
| 8 or more Rooms | 130 (22.3%) | 0 (0.0%) |
| Total | 582 (100.0%) | 131 (100.0%) |
Housing Structure by Heating Type in Garfield
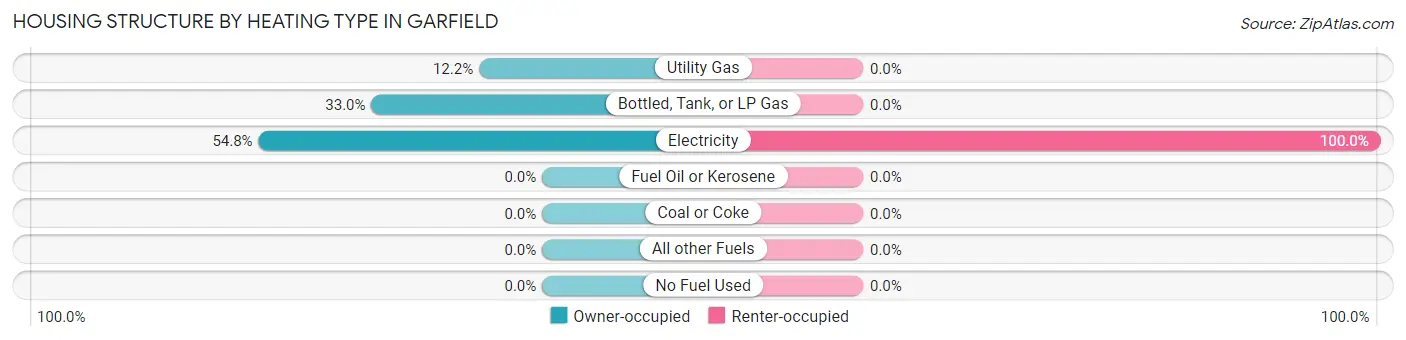
| Heating Type | Owner-occupied | Renter-occupied |
| Utility Gas | 71 (12.2%) | 0 (0.0%) |
| Bottled, Tank, or LP Gas | 192 (33.0%) | 0 (0.0%) |
| Electricity | 319 (54.8%) | 131 (100.0%) |
| Fuel Oil or Kerosene | 0 (0.0%) | 0 (0.0%) |
| Coal or Coke | 0 (0.0%) | 0 (0.0%) |
| All other Fuels | 0 (0.0%) | 0 (0.0%) |
| No Fuel Used | 0 (0.0%) | 0 (0.0%) |
| Total | 582 (100.0%) | 131 (100.0%) |
Household Vehicle Usage in Garfield
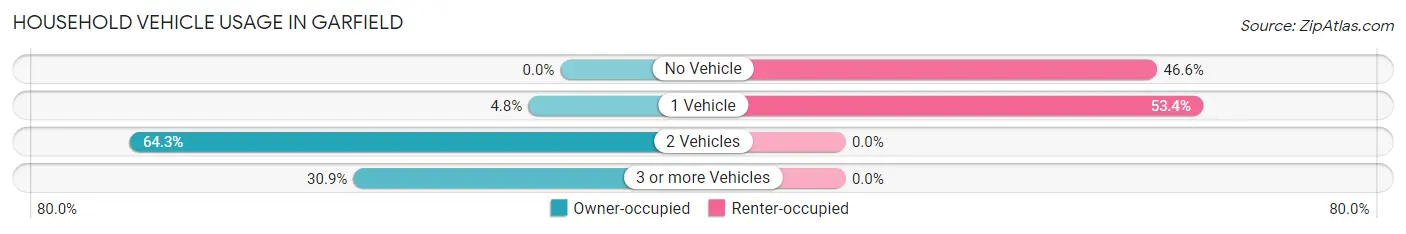
| Vehicles per Household | Owner-occupied | Renter-occupied |
| No Vehicle | 0 (0.0%) | 61 (46.6%) |
| 1 Vehicle | 28 (4.8%) | 70 (53.4%) |
| 2 Vehicles | 374 (64.3%) | 0 (0.0%) |
| 3 or more Vehicles | 180 (30.9%) | 0 (0.0%) |
| Total | 582 (100.0%) | 131 (100.0%) |
Real Estate & Mortgages in Garfield
Real Estate and Mortgage Overview in Garfield
| Characteristic | Without Mortgage | With Mortgage |
| Housing Units | 333 | 249 |
| Median Property Value | $190,800 | $0 |
| Median Household Income | $42,011 | $37 |
| Monthly Housing Costs | $602 | $0 |
| Real Estate Taxes | - | - |
Property Value by Mortgage Status in Garfield
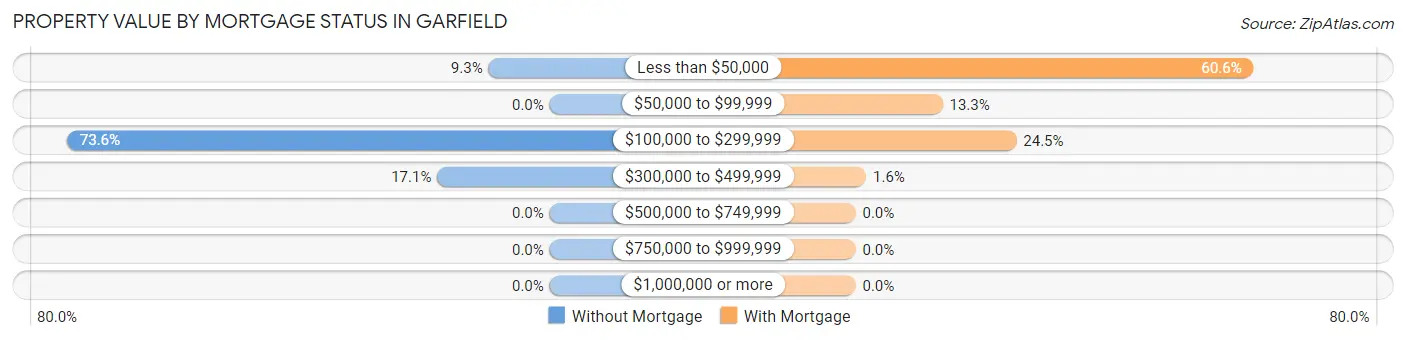
| Property Value | Without Mortgage | With Mortgage |
| Less than $50,000 | 31 (9.3%) | 151 (60.6%) |
| $50,000 to $99,999 | 0 (0.0%) | 33 (13.3%) |
| $100,000 to $299,999 | 245 (73.6%) | 61 (24.5%) |
| $300,000 to $499,999 | 57 (17.1%) | 4 (1.6%) |
| $500,000 to $749,999 | 0 (0.0%) | 0 (0.0%) |
| $750,000 to $999,999 | 0 (0.0%) | 0 (0.0%) |
| $1,000,000 or more | 0 (0.0%) | 0 (0.0%) |
| Total | 333 (100.0%) | 249 (100.0%) |
Household Income by Mortgage Status in Garfield
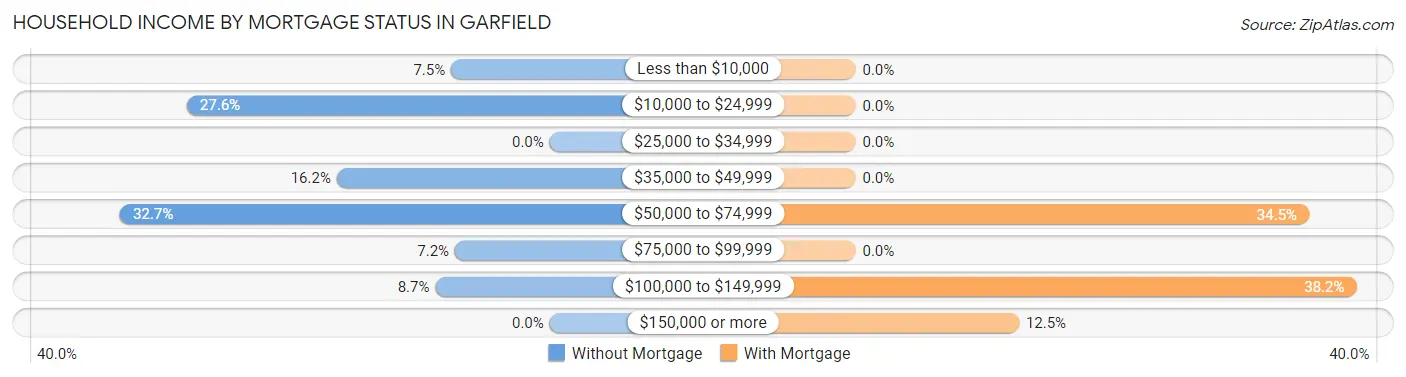
| Household Income | Without Mortgage | With Mortgage |
| Less than $10,000 | 25 (7.5%) | 0 (0.0%) |
| $10,000 to $24,999 | 92 (27.6%) | 0 (0.0%) |
| $25,000 to $34,999 | 0 (0.0%) | 0 (0.0%) |
| $35,000 to $49,999 | 54 (16.2%) | 0 (0.0%) |
| $50,000 to $74,999 | 109 (32.7%) | 86 (34.5%) |
| $75,000 to $99,999 | 24 (7.2%) | 0 (0.0%) |
| $100,000 to $149,999 | 29 (8.7%) | 95 (38.2%) |
| $150,000 or more | 0 (0.0%) | 31 (12.4%) |
| Total | 333 (100.0%) | 249 (100.0%) |
Property Value to Household Income Ratio in Garfield
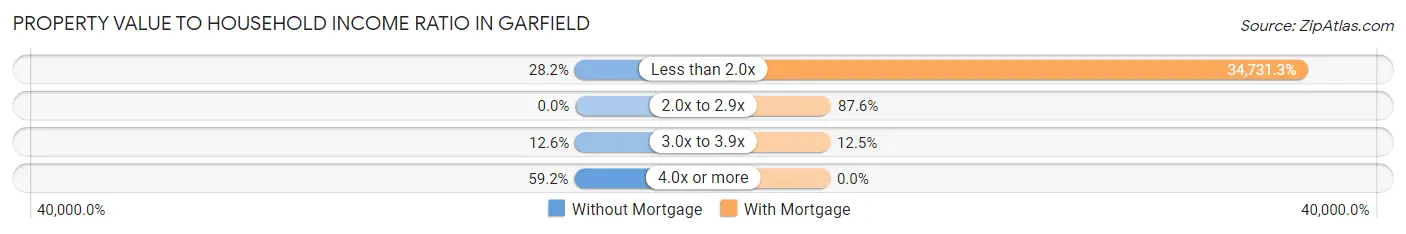
| Value-to-Income Ratio | Without Mortgage | With Mortgage |
| Less than 2.0x | 94 (28.2%) | 86,481 (34,731.3%) |
| 2.0x to 2.9x | 0 (0.0%) | 218 (87.5%) |
| 3.0x to 3.9x | 42 (12.6%) | 31 (12.4%) |
| 4.0x or more | 197 (59.2%) | 0 (0.0%) |
| Total | 333 (100.0%) | 249 (100.0%) |
Real Estate Taxes by Mortgage Status in Garfield
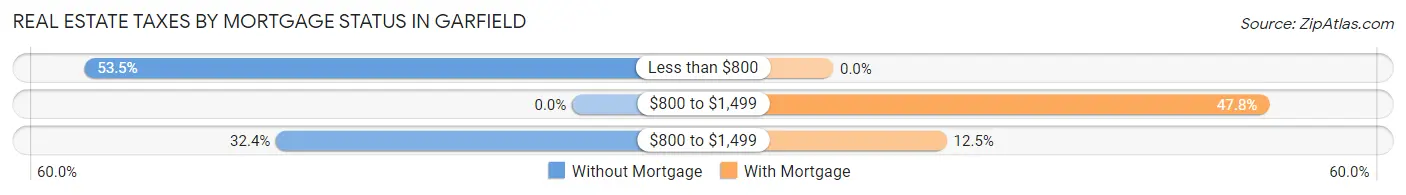
| Property Taxes | Without Mortgage | With Mortgage |
| Less than $800 | 178 (53.4%) | 0 (0.0%) |
| $800 to $1,499 | 0 (0.0%) | 119 (47.8%) |
| $800 to $1,499 | 108 (32.4%) | 31 (12.4%) |
| Total | 333 (100.0%) | 249 (100.0%) |
Health & Disability in Garfield
Health Insurance Coverage by Age in Garfield
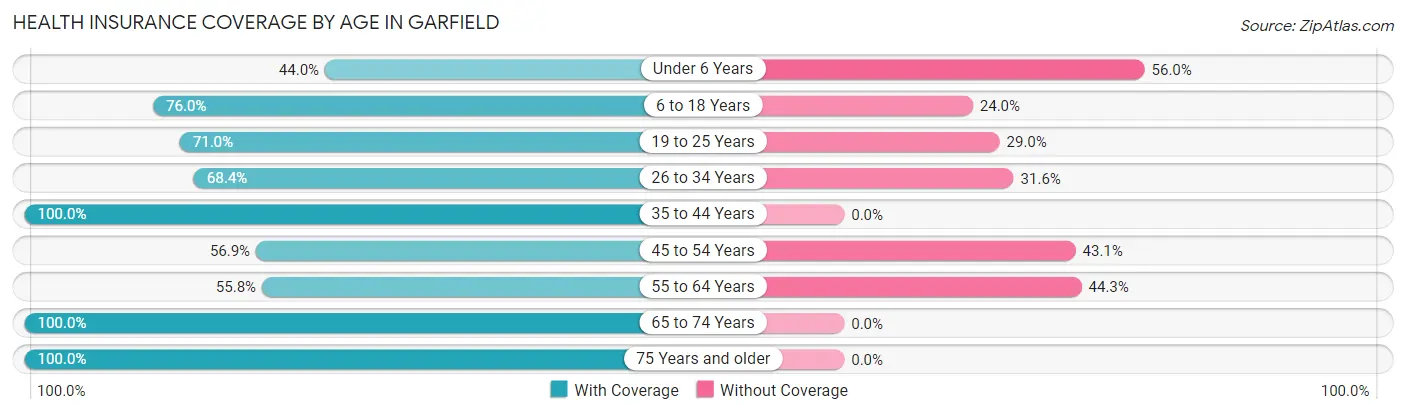
| Age Bracket | With Coverage | Without Coverage |
| Under 6 Years | 66 (44.0%) | 84 (56.0%) |
| 6 to 18 Years | 406 (76.0%) | 128 (24.0%) |
| 19 to 25 Years | 130 (71.0%) | 53 (29.0%) |
| 26 to 34 Years | 52 (68.4%) | 24 (31.6%) |
| 35 to 44 Years | 340 (100.0%) | 0 (0.0%) |
| 45 to 54 Years | 116 (56.9%) | 88 (43.1%) |
| 55 to 64 Years | 97 (55.7%) | 77 (44.3%) |
| 65 to 74 Years | 303 (100.0%) | 0 (0.0%) |
| 75 Years and older | 51 (100.0%) | 0 (0.0%) |
| Total | 1,561 (77.5%) | 454 (22.5%) |
Health Insurance Coverage by Citizenship Status in Garfield
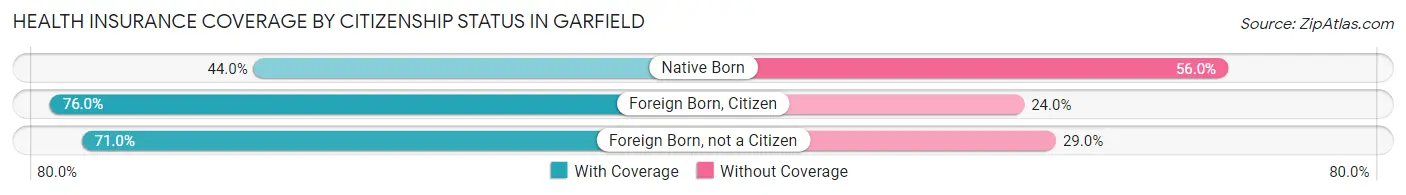
| Citizenship Status | With Coverage | Without Coverage |
| Native Born | 66 (44.0%) | 84 (56.0%) |
| Foreign Born, Citizen | 406 (76.0%) | 128 (24.0%) |
| Foreign Born, not a Citizen | 130 (71.0%) | 53 (29.0%) |
Health Insurance Coverage by Household Income in Garfield
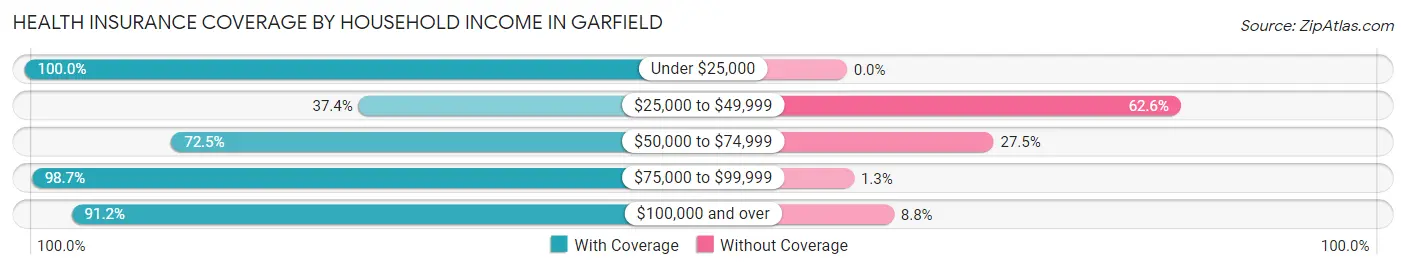
| Household Income | With Coverage | Without Coverage |
| Under $25,000 | 241 (100.0%) | 0 (0.0%) |
| $25,000 to $49,999 | 164 (37.4%) | 274 (62.6%) |
| $50,000 to $74,999 | 372 (72.5%) | 141 (27.5%) |
| $75,000 to $99,999 | 443 (98.7%) | 6 (1.3%) |
| $100,000 and over | 341 (91.2%) | 33 (8.8%) |
Public vs Private Health Insurance Coverage by Age in Garfield
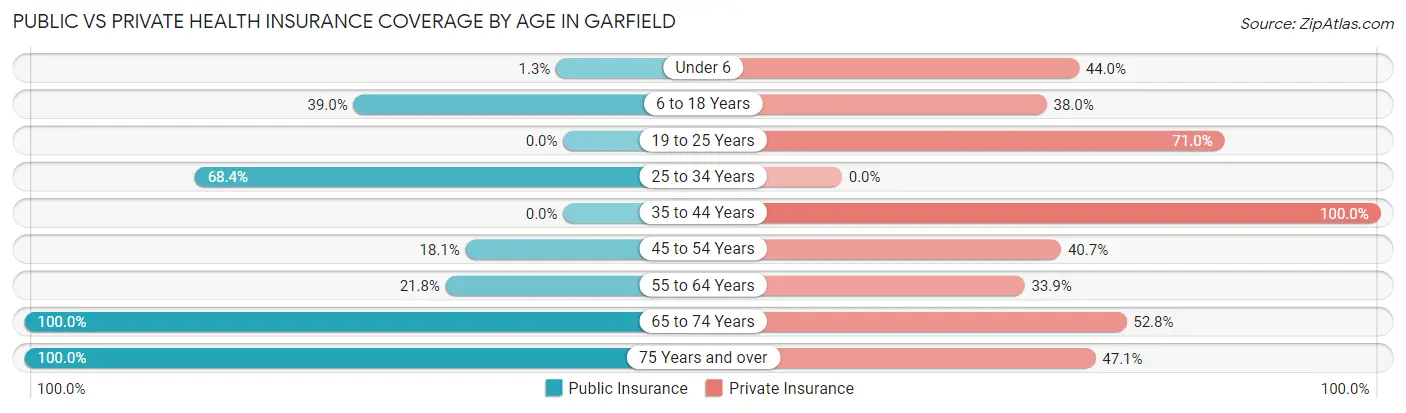
| Age Bracket | Public Insurance | Private Insurance |
| Under 6 | 2 (1.3%) | 66 (44.0%) |
| 6 to 18 Years | 208 (39.0%) | 203 (38.0%) |
| 19 to 25 Years | 0 (0.0%) | 130 (71.0%) |
| 25 to 34 Years | 52 (68.4%) | 0 (0.0%) |
| 35 to 44 Years | 0 (0.0%) | 340 (100.0%) |
| 45 to 54 Years | 37 (18.1%) | 83 (40.7%) |
| 55 to 64 Years | 38 (21.8%) | 59 (33.9%) |
| 65 to 74 Years | 303 (100.0%) | 160 (52.8%) |
| 75 Years and over | 51 (100.0%) | 24 (47.1%) |
| Total | 691 (34.3%) | 1,065 (52.8%) |
Disability Status by Sex by Age in Garfield
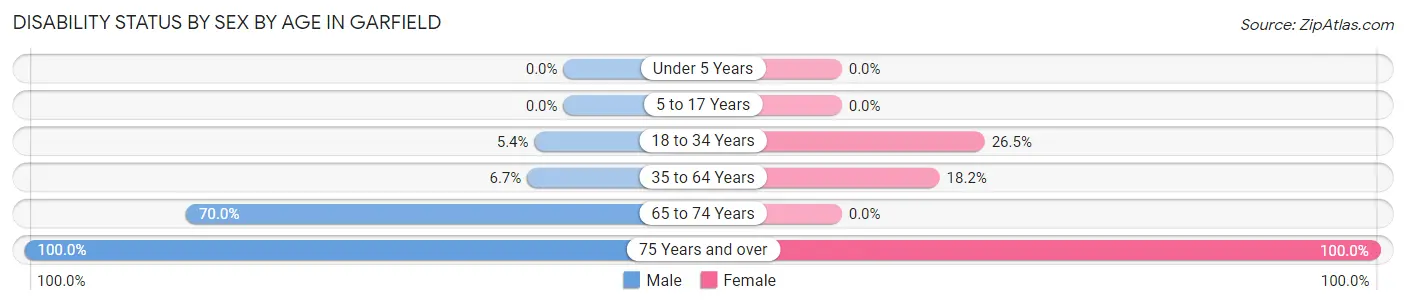
| Age Bracket | Male | Female |
| Under 5 Years | 0 (0.0%) | 0 (0.0%) |
| 5 to 17 Years | 0 (0.0%) | 0 (0.0%) |
| 18 to 34 Years | 5 (5.4%) | 52 (26.5%) |
| 35 to 64 Years | 22 (6.7%) | 71 (18.2%) |
| 65 to 74 Years | 166 (70.0%) | 0 (0.0%) |
| 75 Years and over | 27 (100.0%) | 24 (100.0%) |
Disability Class by Sex by Age in Garfield
Disability Class: Hearing Difficulty
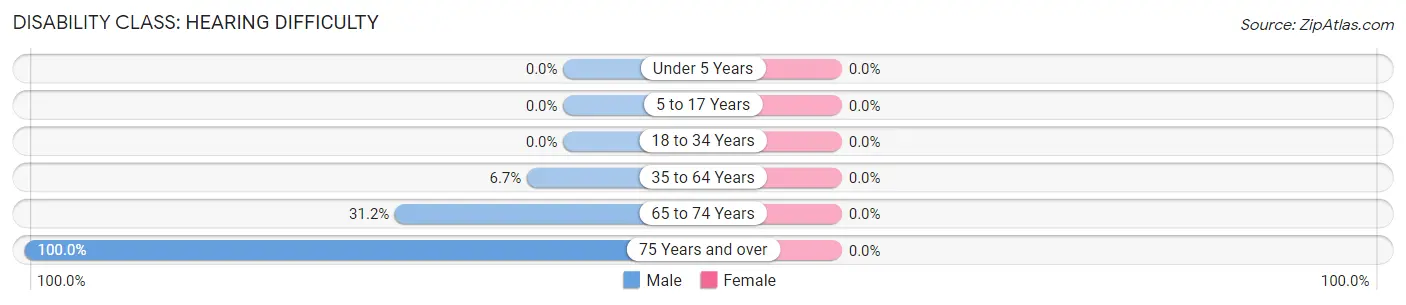
| Age Bracket | Male | Female |
| Under 5 Years | 0 (0.0%) | 0 (0.0%) |
| 5 to 17 Years | 0 (0.0%) | 0 (0.0%) |
| 18 to 34 Years | 0 (0.0%) | 0 (0.0%) |
| 35 to 64 Years | 22 (6.7%) | 0 (0.0%) |
| 65 to 74 Years | 74 (31.2%) | 0 (0.0%) |
| 75 Years and over | 27 (100.0%) | 0 (0.0%) |
Disability Class: Vision Difficulty
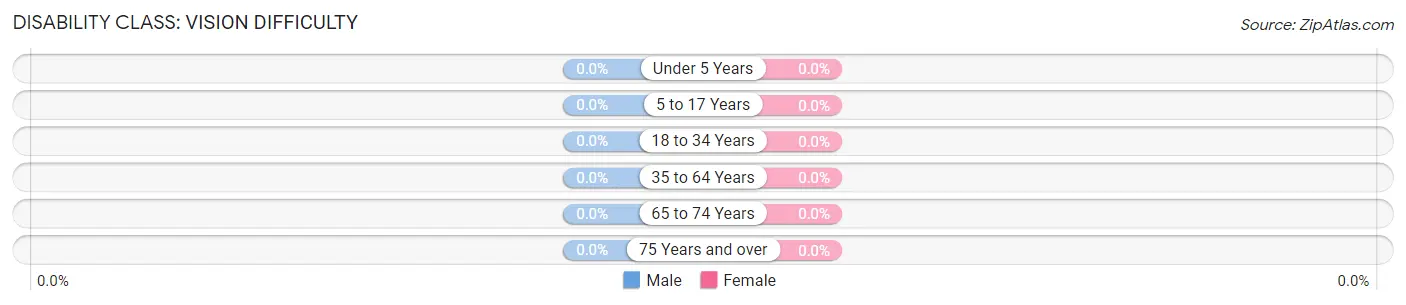
| Age Bracket | Male | Female |
| Under 5 Years | 0 (0.0%) | 0 (0.0%) |
| 5 to 17 Years | 0 (0.0%) | 0 (0.0%) |
| 18 to 34 Years | 0 (0.0%) | 0 (0.0%) |
| 35 to 64 Years | 0 (0.0%) | 0 (0.0%) |
| 65 to 74 Years | 0 (0.0%) | 0 (0.0%) |
| 75 Years and over | 0 (0.0%) | 0 (0.0%) |
Disability Class: Cognitive Difficulty
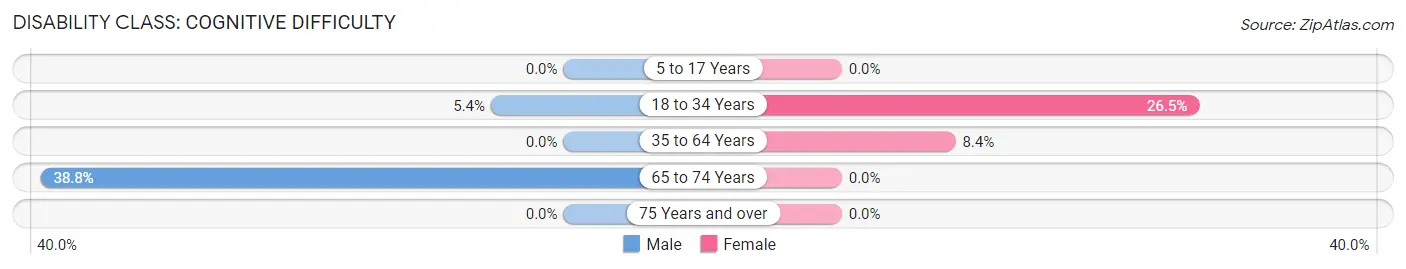
| Age Bracket | Male | Female |
| 5 to 17 Years | 0 (0.0%) | 0 (0.0%) |
| 18 to 34 Years | 5 (5.4%) | 52 (26.5%) |
| 35 to 64 Years | 0 (0.0%) | 33 (8.4%) |
| 65 to 74 Years | 92 (38.8%) | 0 (0.0%) |
| 75 Years and over | 0 (0.0%) | 0 (0.0%) |
Disability Class: Ambulatory Difficulty
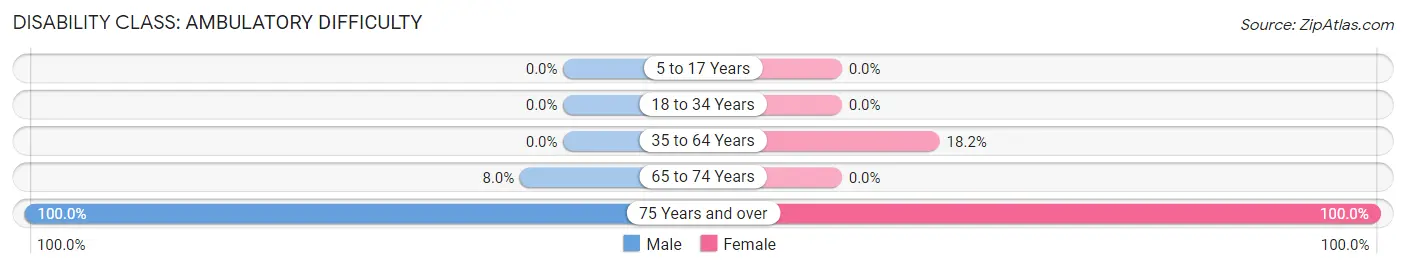
| Age Bracket | Male | Female |
| 5 to 17 Years | 0 (0.0%) | 0 (0.0%) |
| 18 to 34 Years | 0 (0.0%) | 0 (0.0%) |
| 35 to 64 Years | 0 (0.0%) | 71 (18.2%) |
| 65 to 74 Years | 19 (8.0%) | 0 (0.0%) |
| 75 Years and over | 27 (100.0%) | 24 (100.0%) |
Disability Class: Self-Care Difficulty
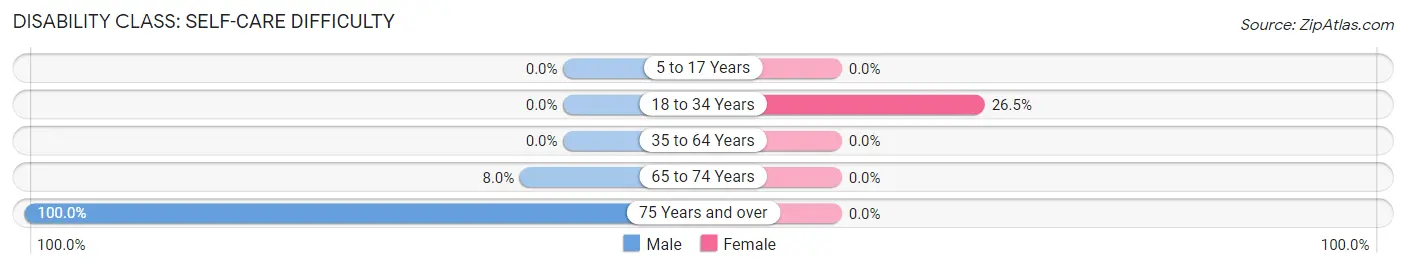
| Age Bracket | Male | Female |
| 5 to 17 Years | 0 (0.0%) | 0 (0.0%) |
| 18 to 34 Years | 0 (0.0%) | 52 (26.5%) |
| 35 to 64 Years | 0 (0.0%) | 0 (0.0%) |
| 65 to 74 Years | 19 (8.0%) | 0 (0.0%) |
| 75 Years and over | 27 (100.0%) | 0 (0.0%) |
Technology Access in Garfield
Computing Device Access in Garfield
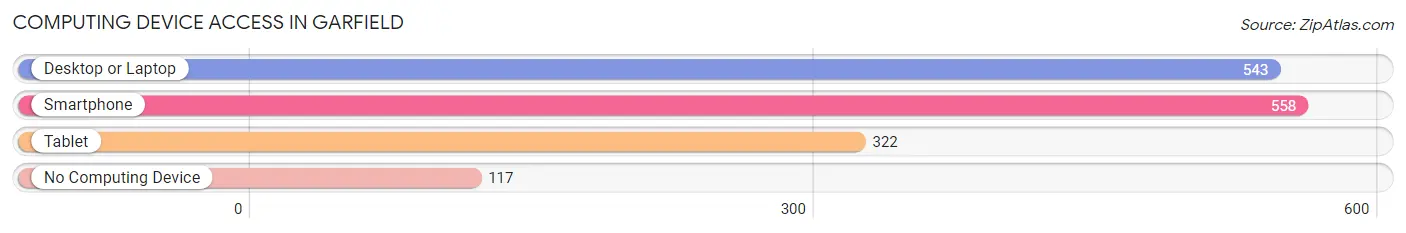
| Device Type | # Households | % Households |
| Desktop or Laptop | 543 | 76.2% |
| Smartphone | 558 | 78.3% |
| Tablet | 322 | 45.2% |
| No Computing Device | 117 | 16.4% |
| Total | 713 | 100.0% |
Internet Access in Garfield
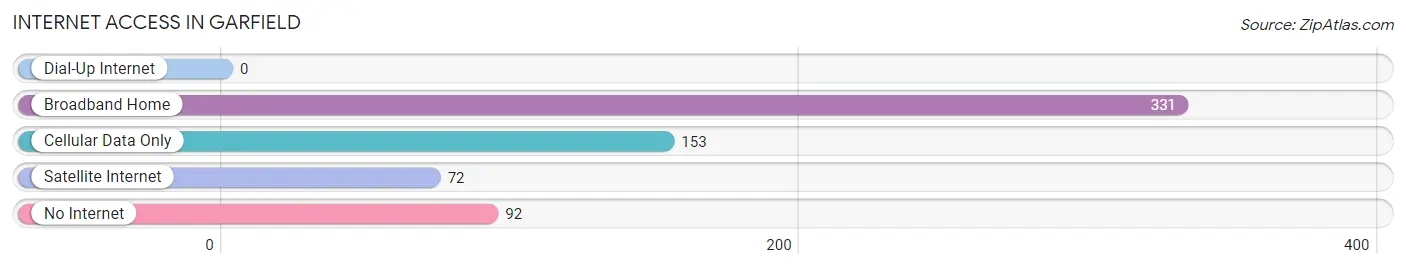
| Internet Type | # Households | % Households |
| Dial-Up Internet | 0 | 0.0% |
| Broadband Home | 331 | 46.4% |
| Cellular Data Only | 153 | 21.5% |
| Satellite Internet | 72 | 10.1% |
| No Internet | 92 | 12.9% |
| Total | 713 | 100.0% |
Garfield Summary
Garfield, Texas is a small town located in the eastern part of Texas, in the county of Panola. It is situated about 25 miles south of the city of Longview and about 30 miles north of the city of Marshall. The population of Garfield was estimated to be around 1,000 people in 2020.
History
Garfield was founded in 1873 by a group of settlers from the nearby town of Marshall. The town was named after President James A. Garfield, who had recently been assassinated. The town was originally a farming community, and the main crops grown were cotton and corn. The town also had a few small businesses, such as a general store, a blacksmith shop, and a post office.
In the early 1900s, the town began to grow and develop. The railroad came to town in 1906, and this helped to spur economic growth. The town also had a school, a bank, and a few other businesses.
Geography
Garfield is located in the eastern part of Texas, in the county of Panola. It is situated about 25 miles south of the city of Longview and about 30 miles north of the city of Marshall. The town is located in a rural area, and the terrain is mostly flat. The climate is humid subtropical, with hot summers and mild winters.
Economy
The economy of Garfield is largely based on agriculture. The main crops grown in the area are cotton, corn, and soybeans. The town also has a few small businesses, such as a general store, a blacksmith shop, and a post office.
Demographics
As of the 2020 census, the population of Garfield was estimated to be around 1,000 people. The racial makeup of the town was 94.2% White, 2.2% African American, 0.7% Native American, 0.3% Asian, and 2.6% from other races. The median household income was $37,500, and the median home value was $90,000.
Conclusion
Garfield, Texas is a small town located in the eastern part of Texas, in the county of Panola. It is situated about 25 miles south of the city of Longview and about 30 miles north of the city of Marshall. The population of Garfield was estimated to be around 1,000 people in 2020. The economy of Garfield is largely based on agriculture, and the main crops grown in the area are cotton, corn, and soybeans. The racial makeup of the town was 94.2% White, 2.2% African American, 0.7% Native American, 0.3% Asian, and 2.6% from other races. The median household income was $37,500, and the median home value was $90,000.
Common Questions
What is the Total Population of Garfield?
Total Population of Garfield is 2,015.
What is the Total Male Population of Garfield?
Total Male Population of Garfield is 896.
What is the Total Female Population of Garfield?
Total Female Population of Garfield is 1,119.
What is the Ratio of Males per 100 Females in Garfield?
There are 80.07 Males per 100 Females in Garfield.
What is the Ratio of Females per 100 Males in Garfield?
There are 124.89 Females per 100 Males in Garfield.
What is the Median Population Age in Garfield?
Median Population Age in Garfield is 36.4 Years.
What is the Average Family Size in Garfield
Average Family Size in Garfield is 3.3 People.
What is the Average Household Size in Garfield
Average Household Size in Garfield is 2.8 People.
What is Per Capita Income in Garfield?
Per Capita income in Garfield is $25,825.
What is the Median Family Income in Garfield?
Median Family Income in Garfield is $61,900.
What is the Median Household income in Garfield?
Median Household Income in Garfield is $54,938.
What is Inequality or Gini Index in Garfield?
Inequality or Gini Index in Garfield is 0.44.
How Large is the Labor Force in Garfield?
There are 740 People in the Labor Forcein in Garfield.
What is the Percentage of People in the Labor Force in Garfield?
51.0% of People are in the Labor Force in Garfield.
What is the Unemployment Rate in Garfield?
Unemployment Rate in Garfield is 16.2%.