Nina, TX
Nina Map
Nina Overview
852
TOTAL POPULATION
544
MALE POPULATION
308
FEMALE POPULATION
176.62
MALES / 100 FEMALES
56.62
FEMALES / 100 MALES
30.6
MEDIAN AGE
4.5
AVG FAMILY SIZE
4.5
AVG HOUSEHOLD SIZE
$11,252
PER CAPITA INCOME
$40,754
AVG FAMILY INCOME
$40,754
AVG HOUSEHOLD INCOME
0.19
INEQUALITY / GINI INDEX
306
LABOR FORCE [ PEOPLE ]
51.9%
PERCENT IN LABOR FORCE
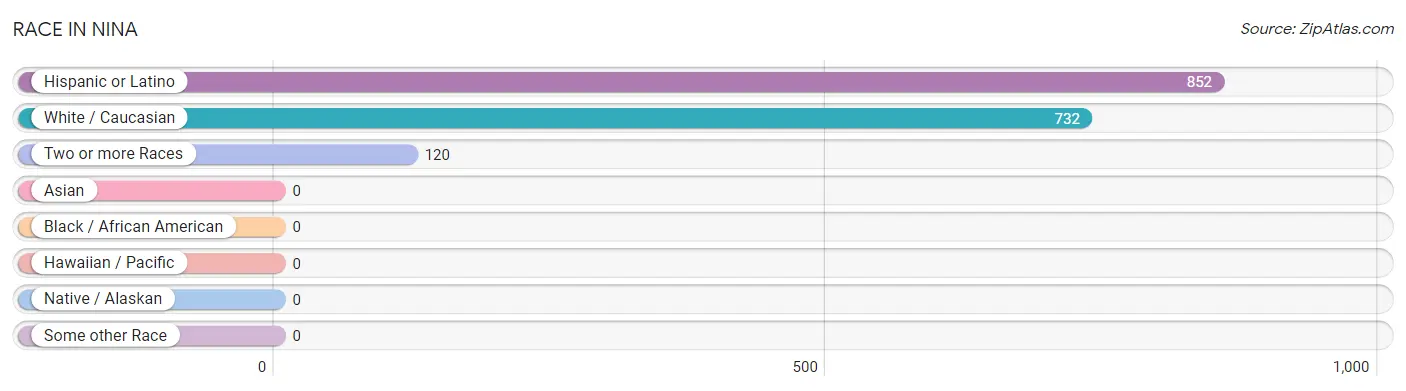
Race in Nina
The most populous races in Nina are Hispanic or Latino (852 | 100.0%), White / Caucasian (732 | 85.9%), and Two or more Races (120 | 14.1%).
| Race | # Population | % Population |
| Asian | 0 | 0.0% |
| Black / African American | 0 | 0.0% |
| Hawaiian / Pacific | 0 | 0.0% |
| Hispanic or Latino | 852 | 100.0% |
| Native / Alaskan | 0 | 0.0% |
| White / Caucasian | 732 | 85.9% |
| Two or more Races | 120 | 14.1% |
| Some other Race | 0 | 0.0% |
| Total | 852 | 100.0% |
Ancestry in Nina
The most populous ancestries reported in Nina are , and Mexican (852 | 100.0%), together accounting for 100.0% of all Nina residents.

| Ancestry | # Population | % Population |
| Mexican | 852 | 100.0% | View All 1 Rows |
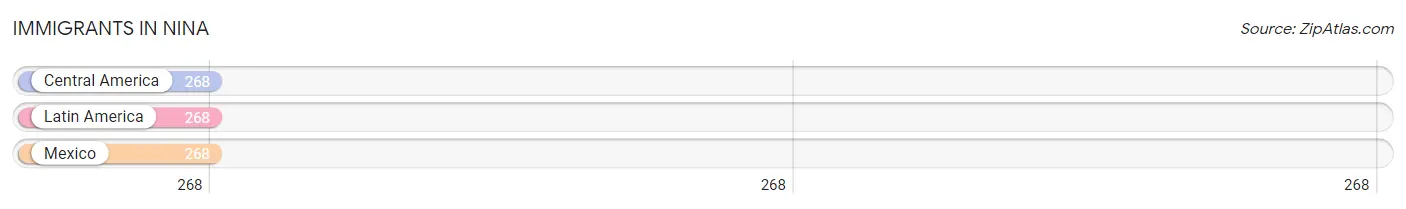
Immigrants in Nina
The most numerous immigrant groups reported in Nina came from Central America (268 | 31.5%), Latin America (268 | 31.5%), and Mexico (268 | 31.5%), together accounting for 94.4% of all Nina residents.
| Immigration Origin | # Population | % Population |
| Central America | 268 | 31.5% |
| Latin America | 268 | 31.5% |
| Mexico | 268 | 31.5% | View All 3 Rows |
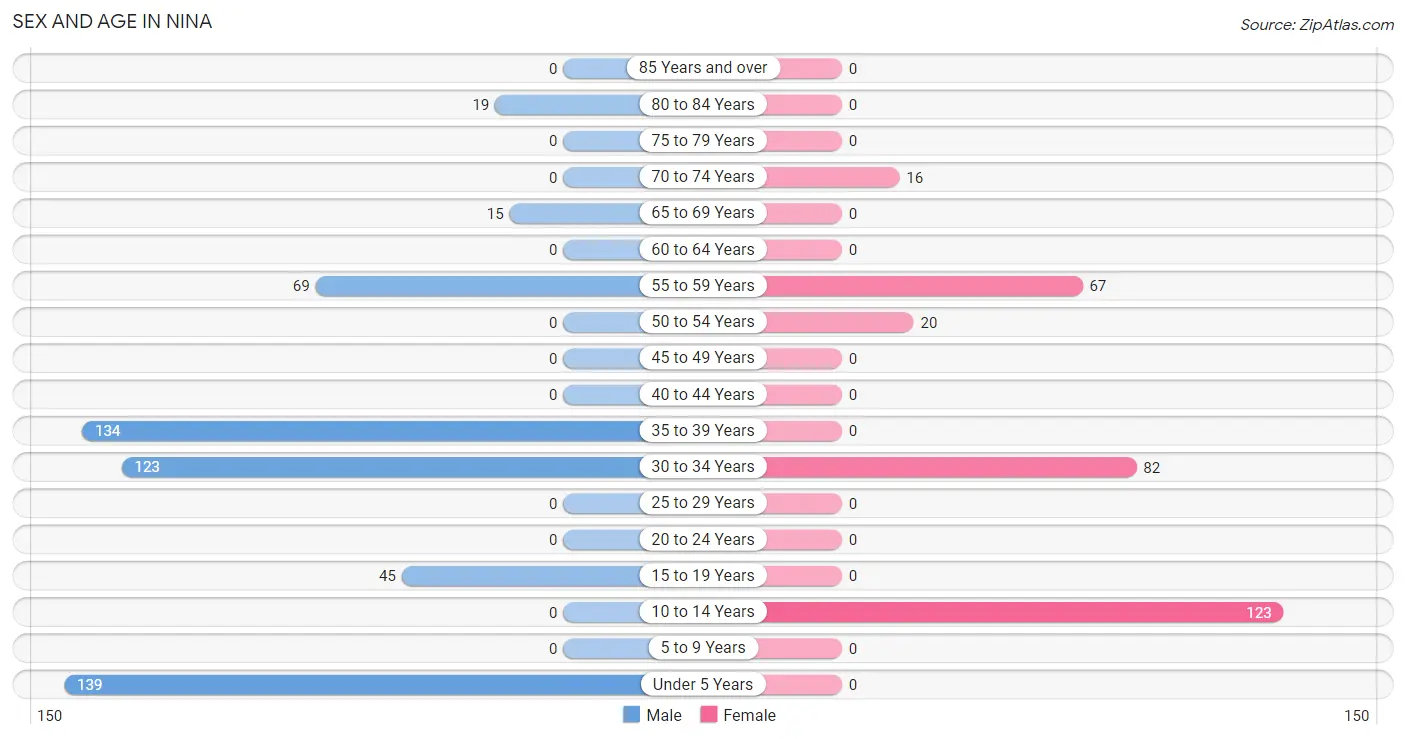
Sex and Age in Nina
Sex and Age in Nina
The most populous age groups in Nina are Under 5 Years (139 | 25.6%) for men and 10 to 14 Years (123 | 39.9%) for women.
| Age Bracket | Male | Female |
| Under 5 Years | 139 (25.6%) | 0 (0.0%) |
| 5 to 9 Years | 0 (0.0%) | 0 (0.0%) |
| 10 to 14 Years | 0 (0.0%) | 123 (39.9%) |
| 15 to 19 Years | 45 (8.3%) | 0 (0.0%) |
| 20 to 24 Years | 0 (0.0%) | 0 (0.0%) |
| 25 to 29 Years | 0 (0.0%) | 0 (0.0%) |
| 30 to 34 Years | 123 (22.6%) | 82 (26.6%) |
| 35 to 39 Years | 134 (24.6%) | 0 (0.0%) |
| 40 to 44 Years | 0 (0.0%) | 0 (0.0%) |
| 45 to 49 Years | 0 (0.0%) | 0 (0.0%) |
| 50 to 54 Years | 0 (0.0%) | 20 (6.5%) |
| 55 to 59 Years | 69 (12.7%) | 67 (21.7%) |
| 60 to 64 Years | 0 (0.0%) | 0 (0.0%) |
| 65 to 69 Years | 15 (2.8%) | 0 (0.0%) |
| 70 to 74 Years | 0 (0.0%) | 16 (5.2%) |
| 75 to 79 Years | 0 (0.0%) | 0 (0.0%) |
| 80 to 84 Years | 19 (3.5%) | 0 (0.0%) |
| 85 Years and over | 0 (0.0%) | 0 (0.0%) |
| Total | 544 (100.0%) | 308 (100.0%) |
Families and Households in Nina
Median Family Size in Nina
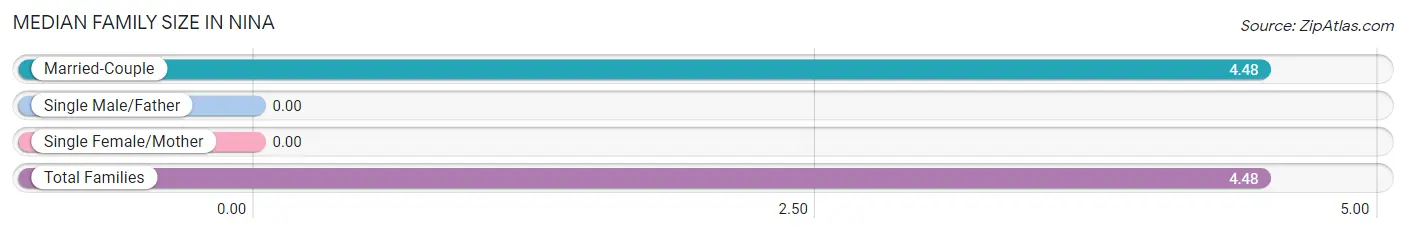
| Family Type | # Families | Family Size |
| Married-Couple | 190 (100.0%) | 4.48 |
| Single Male/Father | 0 (0.0%) | - |
| Single Female/Mother | 0 (0.0%) | - |
| Total Families | 190 (100.0%) | 4.48 |
Median Household Size in Nina
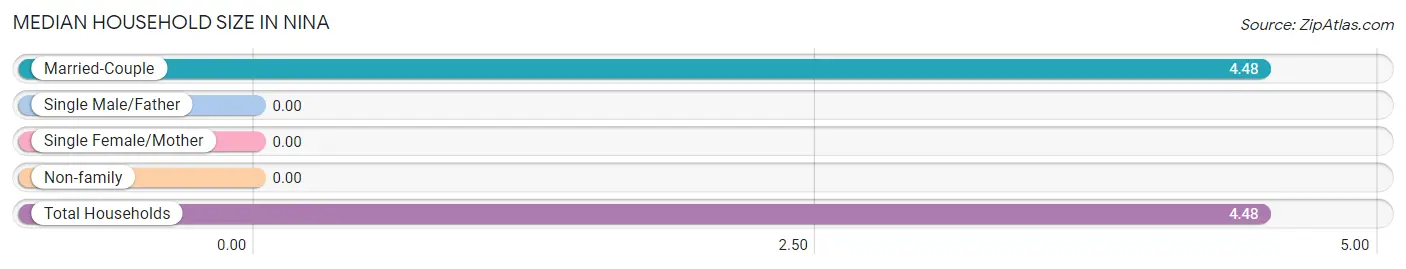
| Household Type | # Households | Household Size |
| Married-Couple | 190 (100.0%) | 4.48 |
| Single Male/Father | 0 (0.0%) | - |
| Single Female/Mother | 0 (0.0%) | - |
| Non-family | 0 (0.0%) | - |
| Total Households | 190 (100.0%) | 4.48 |
Household Size by Marriage Status in Nina
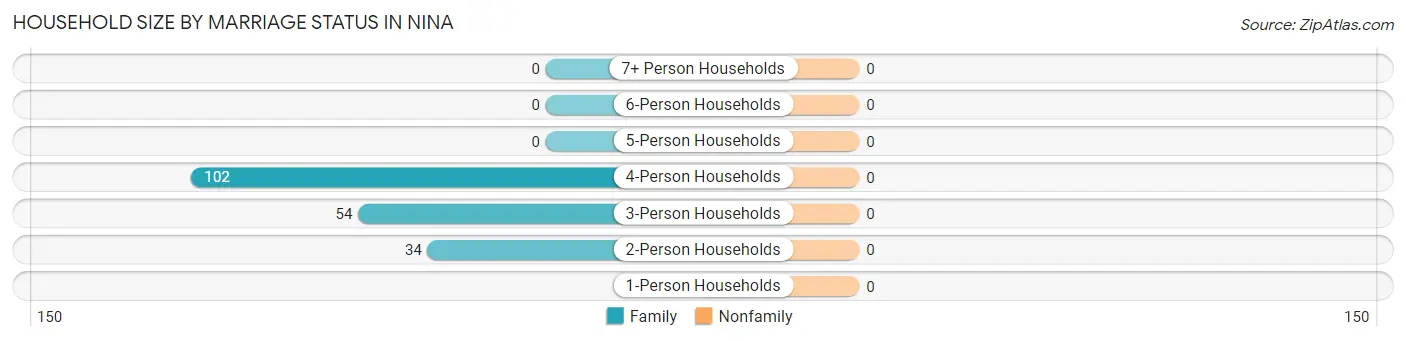
| Household Size | Family Households | Nonfamily Households |
| 1-Person Households | - | 0 (0.0%) |
| 2-Person Households | 34 (17.9%) | 0 (0.0%) |
| 3-Person Households | 54 (28.4%) | 0 (0.0%) |
| 4-Person Households | 102 (53.7%) | 0 (0.0%) |
| 5-Person Households | 0 (0.0%) | 0 (0.0%) |
| 6-Person Households | 0 (0.0%) | 0 (0.0%) |
| 7+ Person Households | 0 (0.0%) | 0 (0.0%) |
| Total | 190 (100.0%) | 0 (0.0%) |
Female Fertility in Nina
Fertility by Age in Nina
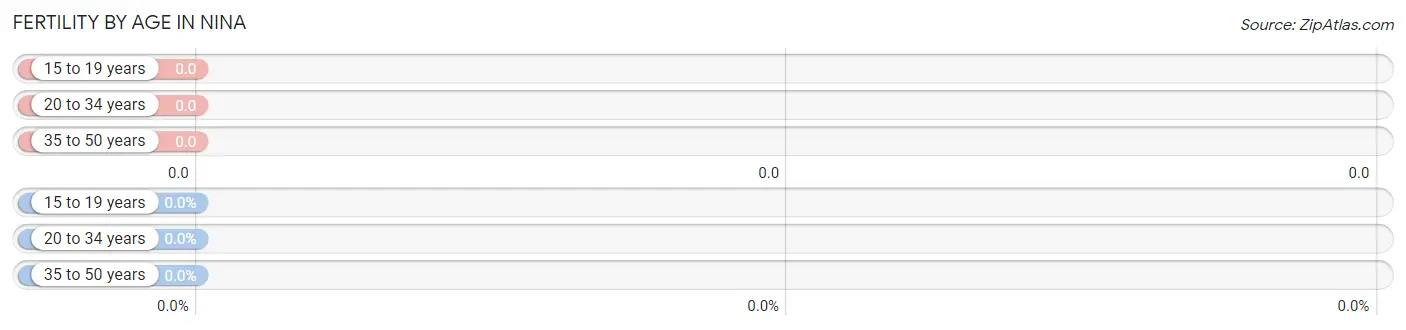
| Age Bracket | Women with Births | Births / 1,000 Women |
| 15 to 19 years | 0 (0.0%) | 0.0 |
| 20 to 34 years | 0 (0.0%) | 0.0 |
| 35 to 50 years | 0 (0.0%) | 0.0 |
| Total | 0 (0.0%) | 0.0 |
Fertility by Age by Marriage Status in Nina
| Age Bracket | Married | Unmarried |
| 15 to 19 years | 0 (0.0%) | 0 (0.0%) |
| 20 to 34 years | 0 (0.0%) | 0 (0.0%) |
| 35 to 50 years | 0 (0.0%) | 0 (0.0%) |
| Total | 0 (0.0%) | 0 (0.0%) |
Fertility by Education in Nina
| Educational Attainment | Women with Births | Births / 1,000 Women |
| Less than High School | 0 (0.0%) | 0.0 |
| High School Diploma | 0 (0.0%) | 0.0 |
| College or Associate's Degree | 0 (0.0%) | 0.0 |
| Bachelor's Degree | 0 (0.0%) | 0.0 |
| Graduate Degree | 0 (0.0%) | 0.0 |
| Total | 0 (0.0%) | 0.0 |
Fertility by Education by Marriage Status in Nina
| Educational Attainment | Married | Unmarried |
| Less than High School | 0 (0.0%) | 0 (0.0%) |
| High School Diploma | 0 (0.0%) | 0 (0.0%) |
| College or Associate's Degree | 0 (0.0%) | 0 (0.0%) |
| Bachelor's Degree | 0 (0.0%) | 0 (0.0%) |
| Graduate Degree | 0 (0.0%) | 0 (0.0%) |
| Total | 0 (0.0%) | 0 (0.0%) |
Income in Nina
Income Overview in Nina
Per Capita Income in Nina is $11,252, while median incomes of families and households are $40,754 and $40,754 respectively.
| Characteristic | Number | Measure |
| Per Capita Income | 852 | $11,252 |
| Median Family Income | 190 | $40,754 |
| Mean Family Income | 190 | $32,924 |
| Median Household Income | 190 | $40,754 |
| Mean Household Income | 190 | $32,924 |
| Income Deficit | 190 | $0 |
| Wage / Income Gap (%) | 852 | 0.00% |
| Wage / Income Gap ($) | 852 | 100.00¢ per $1 |
| Gini / Inequality Index | 852 | 0.19 |
Earnings by Sex in Nina
| Sex | Number | Average Earnings |
| Male | 306 (100.0%) | $0 |
| Female | 0 (0.0%) | $0 |
| Total | 306 (100.0%) | $0 |
Earnings by Sex by Income Bracket in Nina
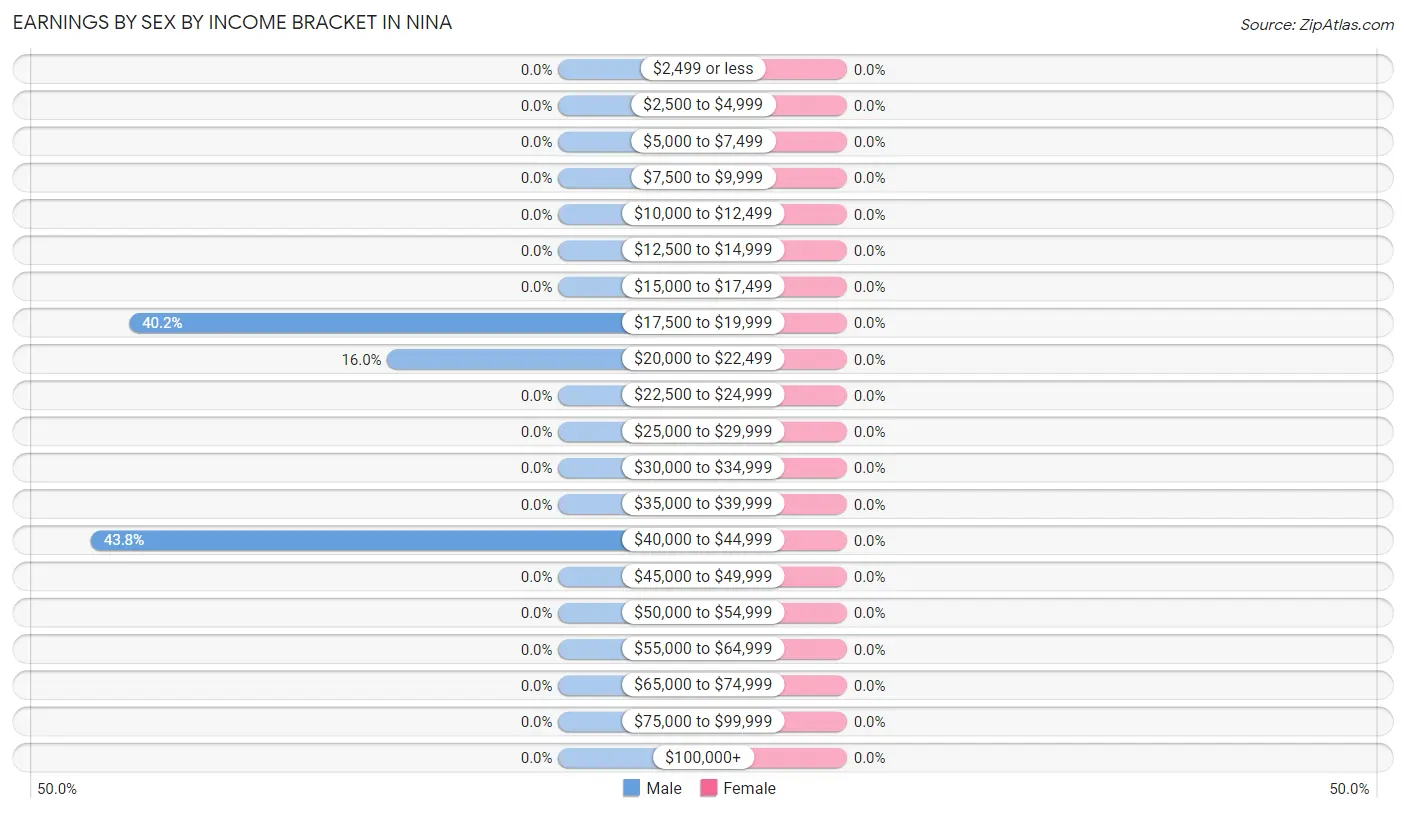
| Income | Male | Female |
| $2,499 or less | 0 (0.0%) | 0 (0.0%) |
| $2,500 to $4,999 | 0 (0.0%) | 0 (0.0%) |
| $5,000 to $7,499 | 0 (0.0%) | 0 (0.0%) |
| $7,500 to $9,999 | 0 (0.0%) | 0 (0.0%) |
| $10,000 to $12,499 | 0 (0.0%) | 0 (0.0%) |
| $12,500 to $14,999 | 0 (0.0%) | 0 (0.0%) |
| $15,000 to $17,499 | 0 (0.0%) | 0 (0.0%) |
| $17,500 to $19,999 | 123 (40.2%) | 0 (0.0%) |
| $20,000 to $22,499 | 49 (16.0%) | 0 (0.0%) |
| $22,500 to $24,999 | 0 (0.0%) | 0 (0.0%) |
| $25,000 to $29,999 | 0 (0.0%) | 0 (0.0%) |
| $30,000 to $34,999 | 0 (0.0%) | 0 (0.0%) |
| $35,000 to $39,999 | 0 (0.0%) | 0 (0.0%) |
| $40,000 to $44,999 | 134 (43.8%) | 0 (0.0%) |
| $45,000 to $49,999 | 0 (0.0%) | 0 (0.0%) |
| $50,000 to $54,999 | 0 (0.0%) | 0 (0.0%) |
| $55,000 to $64,999 | 0 (0.0%) | 0 (0.0%) |
| $65,000 to $74,999 | 0 (0.0%) | 0 (0.0%) |
| $75,000 to $99,999 | 0 (0.0%) | 0 (0.0%) |
| $100,000+ | 0 (0.0%) | 0 (0.0%) |
| Total | 306 (100.0%) | 0 (0.0%) |
Earnings by Sex by Educational Attainment in Nina
| Educational Attainment | Male Income | Female Income |
| Less than High School | - | - |
| High School Diploma | - | - |
| College or Associate's Degree | - | - |
| Bachelor's Degree | - | - |
| Graduate Degree | - | - |
| Total | - | - |
Family Income in Nina
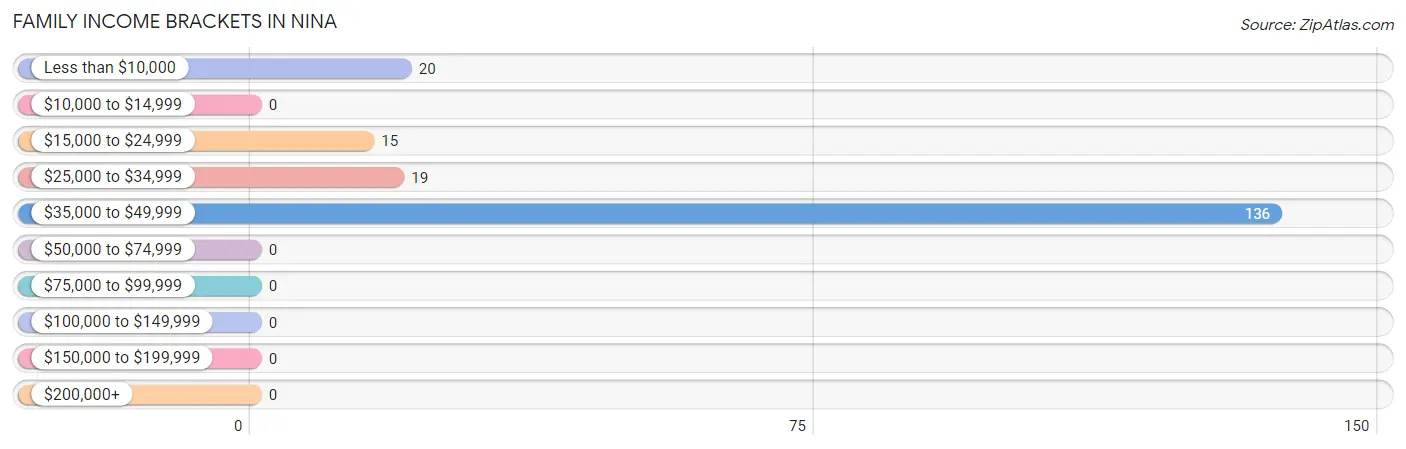
Family Income Brackets in Nina
According to the Nina family income data, there are 136 families falling into the $35,000 to $49,999 income range, which is the most common income bracket and makes up 71.6% of all families.
| Income Bracket | # Families | % Families |
| Less than $10,000 | 20 | 10.5% |
| $10,000 to $14,999 | 0 | 0.0% |
| $15,000 to $24,999 | 15 | 7.9% |
| $25,000 to $34,999 | 19 | 10.0% |
| $35,000 to $49,999 | 136 | 71.6% |
| $50,000 to $74,999 | 0 | 0.0% |
| $75,000 to $99,999 | 0 | 0.0% |
| $100,000 to $149,999 | 0 | 0.0% |
| $150,000 to $199,999 | 0 | 0.0% |
| $200,000+ | 0 | 0.0% |
Family Income by Famaliy Size in Nina
| Income Bracket | # Families | Median Income |
| 2-Person Families | 34 (17.9%) | $0 |
| 3-Person Families | 54 (28.4%) | $0 |
| 4-Person Families | 102 (53.7%) | $0 |
| 5-Person Families | 0 (0.0%) | $0 |
| 6-Person Families | 0 (0.0%) | $0 |
| 7+ Person Families | 0 (0.0%) | $0 |
| Total | 190 (100.0%) | $40,754 |
Family Income by Number of Earners in Nina
| Number of Earners | # Families | Median Income |
| No Earners | 54 (28.4%) | $0 |
| 1 Earner | 82 (43.2%) | $0 |
| 2 Earners | 54 (28.4%) | $0 |
| 3+ Earners | 0 (0.0%) | $0 |
| Total | 190 (100.0%) | $40,754 |
Household Income in Nina
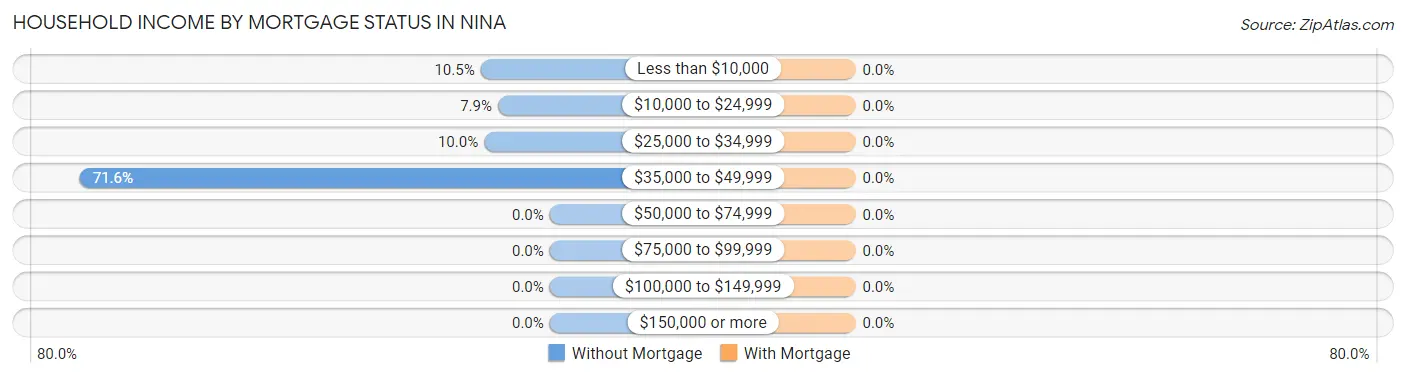
Household Income Brackets in Nina
With 136 households falling in the category, the $35,000 to $49,999 income range is the most frequent in Nina, accounting for 71.6% of all households.
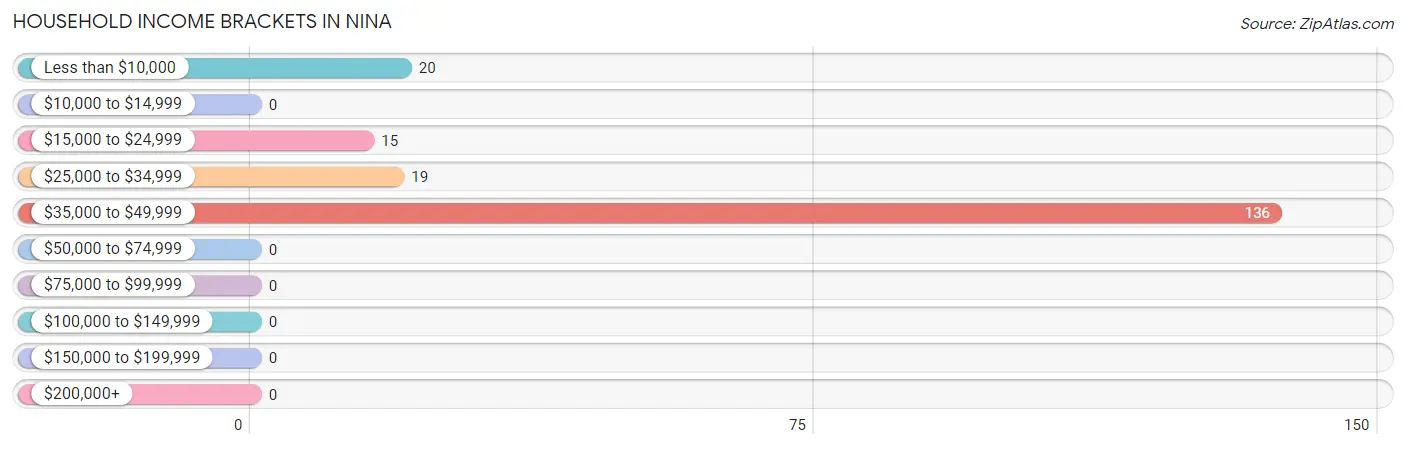
| Income Bracket | # Households | % Households |
| Less than $10,000 | 20 | 10.5% |
| $10,000 to $14,999 | 0 | 0.0% |
| $15,000 to $24,999 | 15 | 7.9% |
| $25,000 to $34,999 | 19 | 10.0% |
| $35,000 to $49,999 | 136 | 71.6% |
| $50,000 to $74,999 | 0 | 0.0% |
| $75,000 to $99,999 | 0 | 0.0% |
| $100,000 to $149,999 | 0 | 0.0% |
| $150,000 to $199,999 | 0 | 0.0% |
| $200,000+ | 0 | 0.0% |
Household Income by Householder Age in Nina
| Income Bracket | # Households | Median Income |
| 15 to 24 Years | 0 (0.0%) | $0 |
| 25 to 44 Years | 82 (43.2%) | $0 |
| 45 to 64 Years | 74 (39.0%) | $0 |
| 65+ Years | 34 (17.9%) | $0 |
| Total | 190 (100.0%) | $40,754 |
Poverty in Nina
Income Below Poverty by Sex and Age in Nina
With 14.7% poverty level for males and 10.7% for females among the residents of Nina, 16 and 17 year old males and 45 to 54 year old females are the most vulnerable to poverty, with 45 males (100.0%) and 20 females (100.0%) in their respective age groups living below the poverty level.
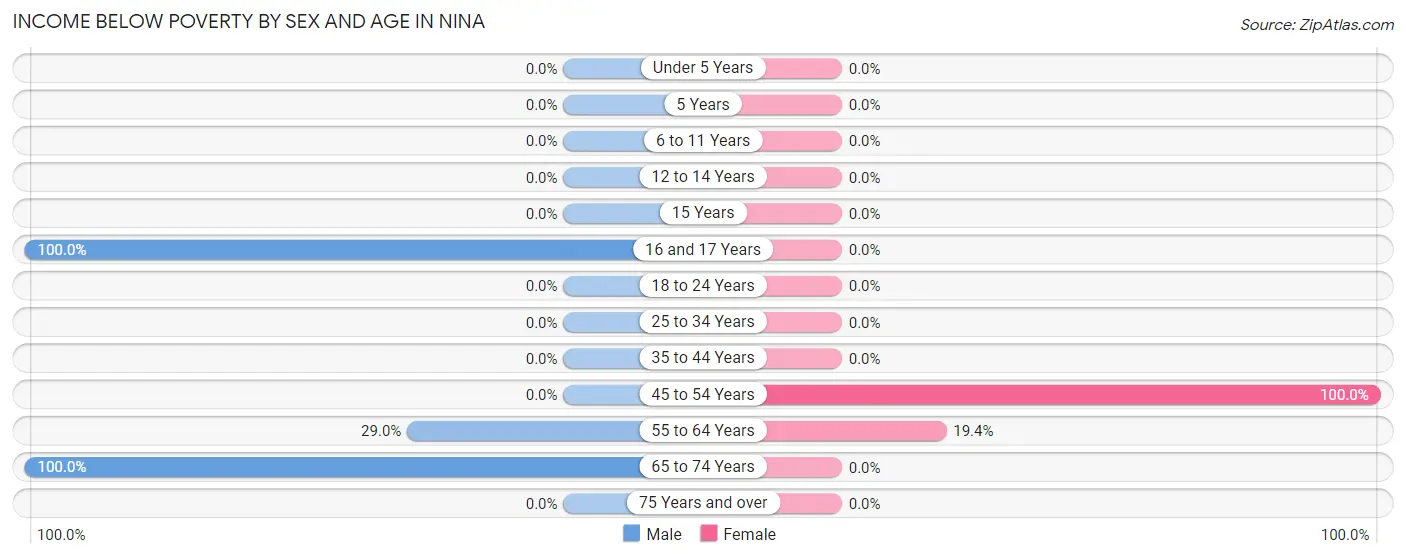
| Age Bracket | Male | Female |
| Under 5 Years | 0 (0.0%) | 0 (0.0%) |
| 5 Years | 0 (0.0%) | 0 (0.0%) |
| 6 to 11 Years | 0 (0.0%) | 0 (0.0%) |
| 12 to 14 Years | 0 (0.0%) | 0 (0.0%) |
| 15 Years | 0 (0.0%) | 0 (0.0%) |
| 16 and 17 Years | 45 (100.0%) | 0 (0.0%) |
| 18 to 24 Years | 0 (0.0%) | 0 (0.0%) |
| 25 to 34 Years | 0 (0.0%) | 0 (0.0%) |
| 35 to 44 Years | 0 (0.0%) | 0 (0.0%) |
| 45 to 54 Years | 0 (0.0%) | 20 (100.0%) |
| 55 to 64 Years | 20 (29.0%) | 13 (19.4%) |
| 65 to 74 Years | 15 (100.0%) | 0 (0.0%) |
| 75 Years and over | 0 (0.0%) | 0 (0.0%) |
| Total | 80 (14.7%) | 33 (10.7%) |
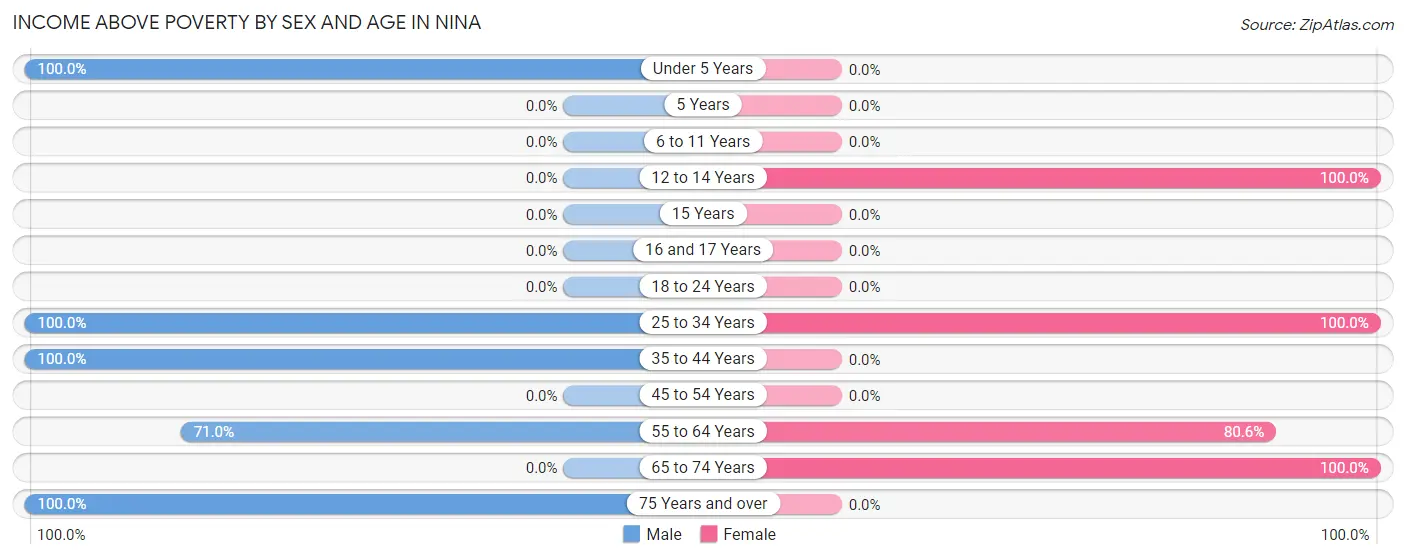
Income Above Poverty by Sex and Age in Nina
According to the poverty statistics in Nina, males aged under 5 years and females aged 12 to 14 years are the age groups that are most secure financially, with 100.0% of males and 100.0% of females in these age groups living above the poverty line.
| Age Bracket | Male | Female |
| Under 5 Years | 139 (100.0%) | 0 (0.0%) |
| 5 Years | 0 (0.0%) | 0 (0.0%) |
| 6 to 11 Years | 0 (0.0%) | 0 (0.0%) |
| 12 to 14 Years | 0 (0.0%) | 123 (100.0%) |
| 15 Years | 0 (0.0%) | 0 (0.0%) |
| 16 and 17 Years | 0 (0.0%) | 0 (0.0%) |
| 18 to 24 Years | 0 (0.0%) | 0 (0.0%) |
| 25 to 34 Years | 123 (100.0%) | 82 (100.0%) |
| 35 to 44 Years | 134 (100.0%) | 0 (0.0%) |
| 45 to 54 Years | 0 (0.0%) | 0 (0.0%) |
| 55 to 64 Years | 49 (71.0%) | 54 (80.6%) |
| 65 to 74 Years | 0 (0.0%) | 16 (100.0%) |
| 75 Years and over | 19 (100.0%) | 0 (0.0%) |
| Total | 464 (85.3%) | 275 (89.3%) |
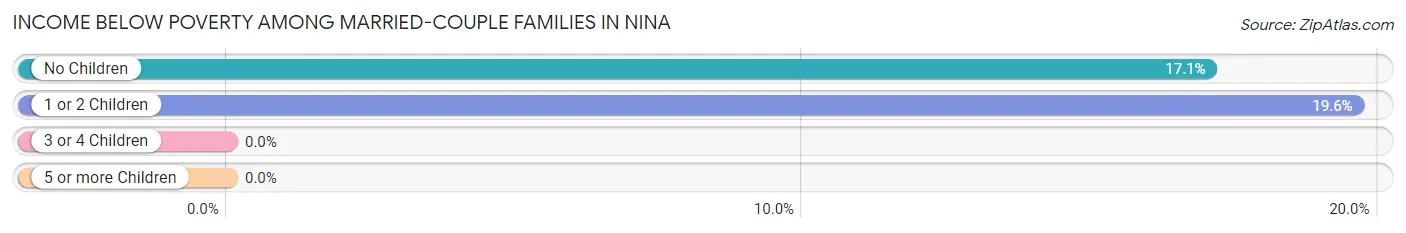
Income Below Poverty Among Married-Couple Families in Nina
The poverty statistics for married-couple families in Nina show that 18.4% or 35 of the total 190 families live below the poverty line. Families with 1 or 2 children have the highest poverty rate of 19.6%, comprising of 20 families. On the other hand, families with no children have the lowest poverty rate of 17.1%, which includes 15 families.
| Children | Above Poverty | Below Poverty |
| No Children | 73 (83.0%) | 15 (17.1%) |
| 1 or 2 Children | 82 (80.4%) | 20 (19.6%) |
| 3 or 4 Children | 0 (0.0%) | 0 (0.0%) |
| 5 or more Children | 0 (0.0%) | 0 (0.0%) |
| Total | 155 (81.6%) | 35 (18.4%) |
Income Below Poverty Among Single-Parent Households in Nina
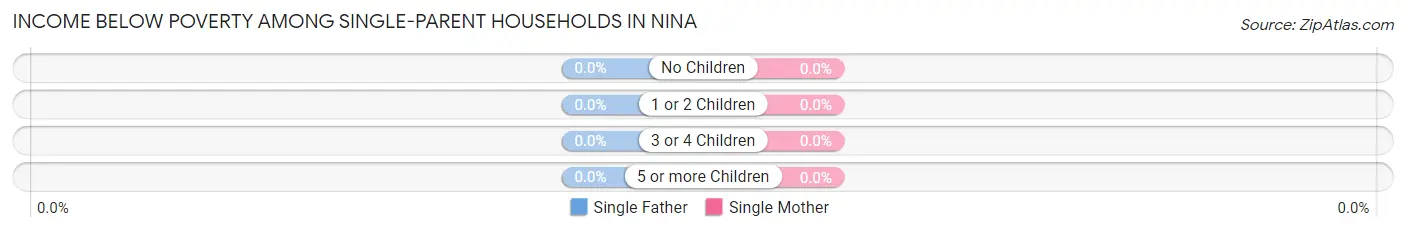
| Children | Single Father | Single Mother |
| No Children | 0 (0.0%) | 0 (0.0%) |
| 1 or 2 Children | 0 (0.0%) | 0 (0.0%) |
| 3 or 4 Children | 0 (0.0%) | 0 (0.0%) |
| 5 or more Children | 0 (0.0%) | 0 (0.0%) |
| Total | 0 (0.0%) | 0 (0.0%) |
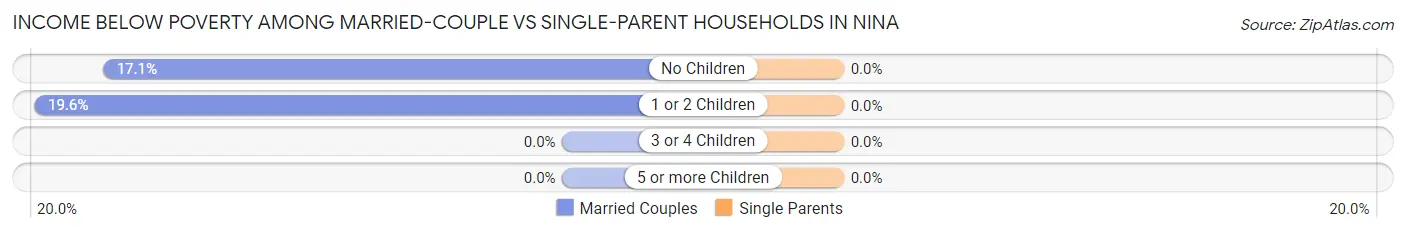
Income Below Poverty Among Married-Couple vs Single-Parent Households in Nina
| Children | Married-Couple Families | Single-Parent Households |
| No Children | 15 (17.1%) | 0 (0.0%) |
| 1 or 2 Children | 20 (19.6%) | 0 (0.0%) |
| 3 or 4 Children | 0 (0.0%) | 0 (0.0%) |
| 5 or more Children | 0 (0.0%) | 0 (0.0%) |
| Total | 35 (18.4%) | 0 (0.0%) |
Employment Characteristics in Nina
Employment by Class of Employer in Nina
Among the 306 employed individuals in Nina, , and private company employees (306 | 100.0%) make up the most common classes of employment.
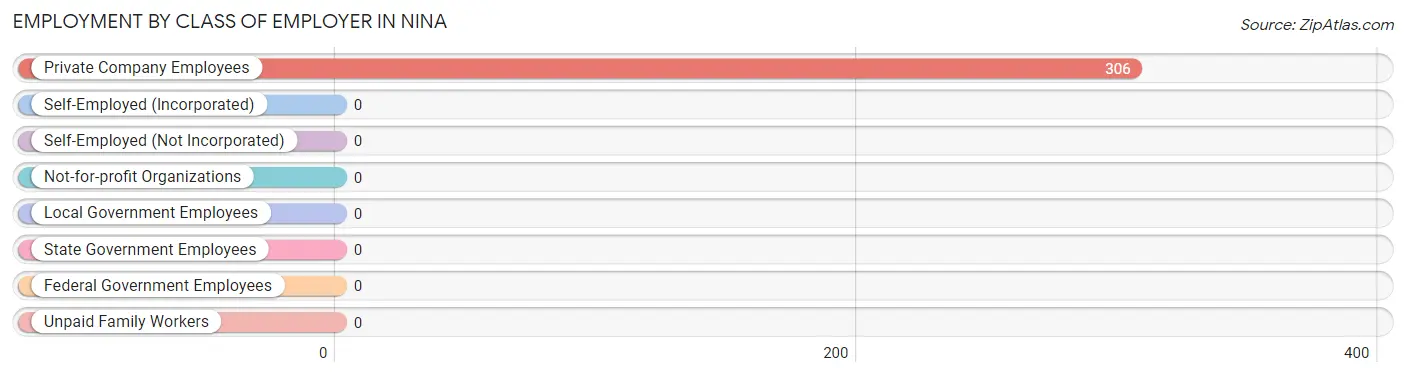
| Employer Class | # Employees | % Employees |
| Private Company Employees | 306 | 100.0% |
| Self-Employed (Incorporated) | 0 | 0.0% |
| Self-Employed (Not Incorporated) | 0 | 0.0% |
| Not-for-profit Organizations | 0 | 0.0% |
| Local Government Employees | 0 | 0.0% |
| State Government Employees | 0 | 0.0% |
| Federal Government Employees | 0 | 0.0% |
| Unpaid Family Workers | 0 | 0.0% |
| Total | 306 | 100.0% |
Employment Status by Age in Nina
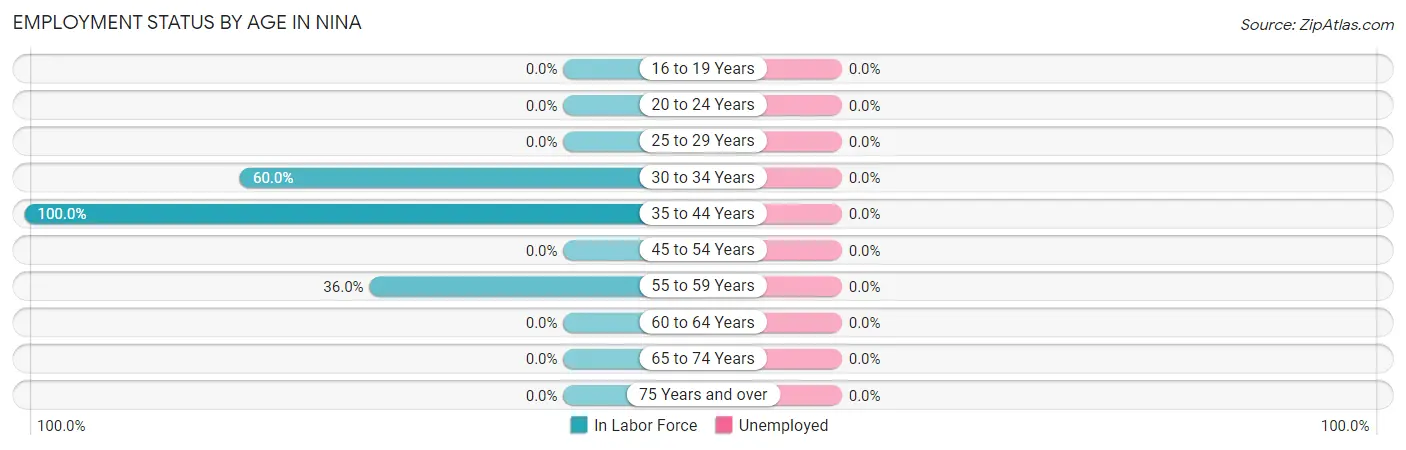
| Age Bracket | In Labor Force | Unemployed |
| 16 to 19 Years | 0 (0.0%) | 0 (0.0%) |
| 20 to 24 Years | 0 (0.0%) | 0 (0.0%) |
| 25 to 29 Years | 0 (0.0%) | 0 (0.0%) |
| 30 to 34 Years | 123 (60.0%) | 0 (0.0%) |
| 35 to 44 Years | 134 (100.0%) | 0 (0.0%) |
| 45 to 54 Years | 0 (0.0%) | 0 (0.0%) |
| 55 to 59 Years | 49 (36.0%) | 0 (0.0%) |
| 60 to 64 Years | 0 (0.0%) | 0 (0.0%) |
| 65 to 74 Years | 0 (0.0%) | 0 (0.0%) |
| 75 Years and over | 0 (0.0%) | 0 (0.0%) |
| Total | 306 (51.9%) | 0 (0.0%) |
Employment Status by Educational Attainment in Nina
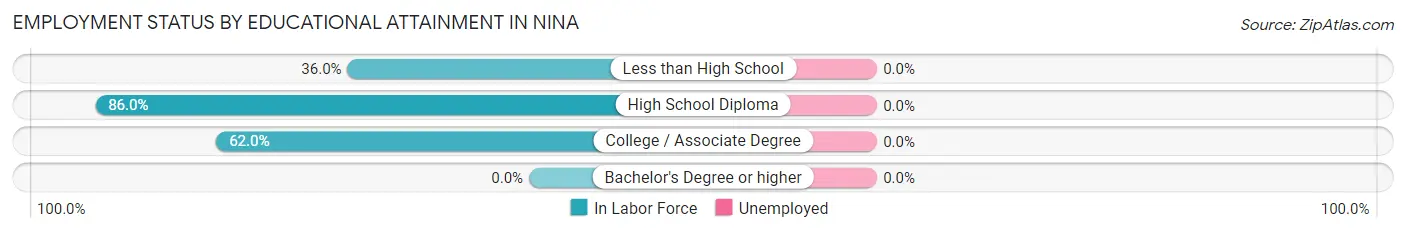
| Educational Attainment | In Labor Force | Unemployed |
| Less than High School | 49 (36.0%) | 0 (0.0%) |
| High School Diploma | 123 (86.0%) | 0 (0.0%) |
| College / Associate Degree | 134 (62.0%) | 0 (0.0%) |
| Bachelor's Degree or higher | 0 (0.0%) | 0 (0.0%) |
| Total | 306 (61.8%) | 0 (0.0%) |
Employment Occupations by Sex in Nina
Management, Business, Science and Arts Occupations
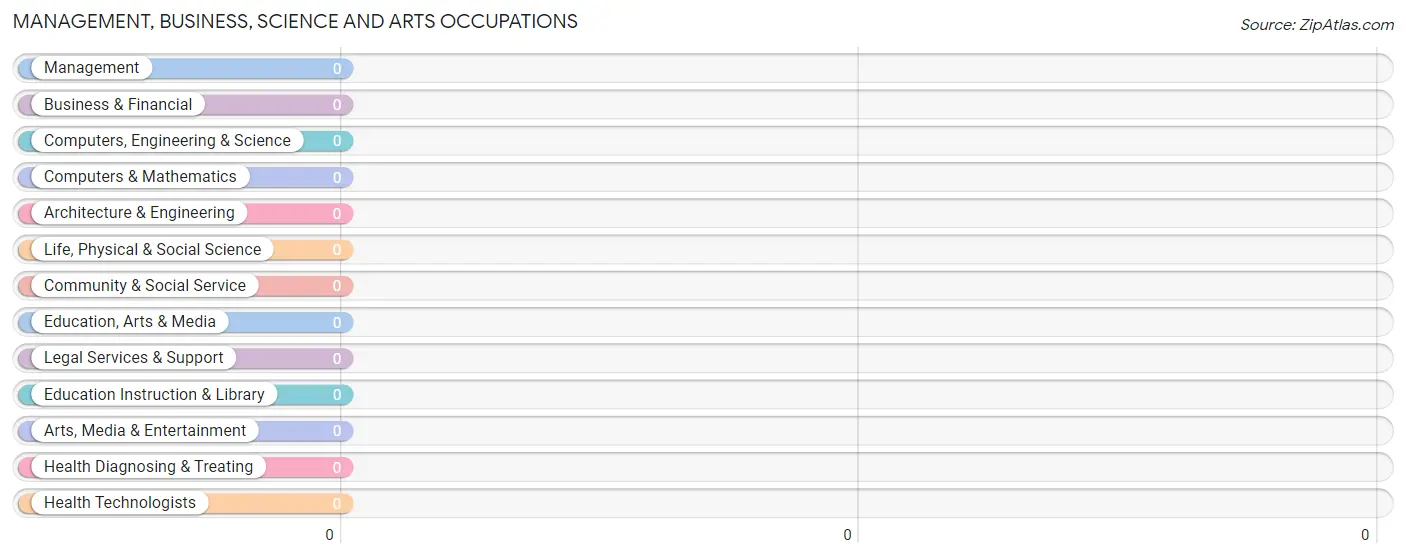
Management, Business, Science and Arts Occupations by Sex
| Occupation | Male | Female |
| Management | 0 (0.0%) | 0 (0.0%) |
| Business & Financial | 0 (0.0%) | 0 (0.0%) |
| Computers, Engineering & Science | 0 (0.0%) | 0 (0.0%) |
| Computers & Mathematics | 0 (0.0%) | 0 (0.0%) |
| Architecture & Engineering | 0 (0.0%) | 0 (0.0%) |
| Life, Physical & Social Science | 0 (0.0%) | 0 (0.0%) |
| Community & Social Service | 0 (0.0%) | 0 (0.0%) |
| Education, Arts & Media | 0 (0.0%) | 0 (0.0%) |
| Legal Services & Support | 0 (0.0%) | 0 (0.0%) |
| Education Instruction & Library | 0 (0.0%) | 0 (0.0%) |
| Arts, Media & Entertainment | 0 (0.0%) | 0 (0.0%) |
| Health Diagnosing & Treating | 0 (0.0%) | 0 (0.0%) |
| Health Technologists | 0 (0.0%) | 0 (0.0%) |
| Total (Category) | 0 (0.0%) | 0 (0.0%) |
| Total (Overall) | 306 (100.0%) | 0 (0.0%) |
Services Occupations
Services Occupations by Sex
| Occupation | Male | Female |
| Healthcare Support | 0 (0.0%) | 0 (0.0%) |
| Security & Protection | 0 (0.0%) | 0 (0.0%) |
| Firefighting & Prevention | 0 (0.0%) | 0 (0.0%) |
| Law Enforcement | 0 (0.0%) | 0 (0.0%) |
| Food Preparation & Serving | 0 (0.0%) | 0 (0.0%) |
| Cleaning & Maintenance | 0 (0.0%) | 0 (0.0%) |
| Personal Care & Service | 0 (0.0%) | 0 (0.0%) |
| Total (Category) | 0 (0.0%) | 0 (0.0%) |
| Total (Overall) | 306 (100.0%) | 0 (0.0%) |
Sales and Office Occupations
Sales and Office Occupations by Sex
| Occupation | Male | Female |
| Sales & Related | 0 (0.0%) | 0 (0.0%) |
| Office & Administration | 0 (0.0%) | 0 (0.0%) |
| Total (Category) | 0 (0.0%) | 0 (0.0%) |
| Total (Overall) | 306 (100.0%) | 0 (0.0%) |
Natural Resources, Construction and Maintenance Occupations
The most common Natural Resources, Construction and Maintenance occupations in Nina are , and Construction & Extraction (172 | 56.2%).
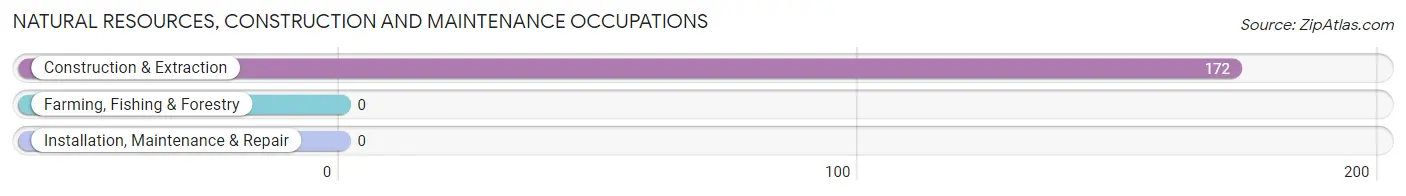
Natural Resources, Construction and Maintenance Occupations by Sex
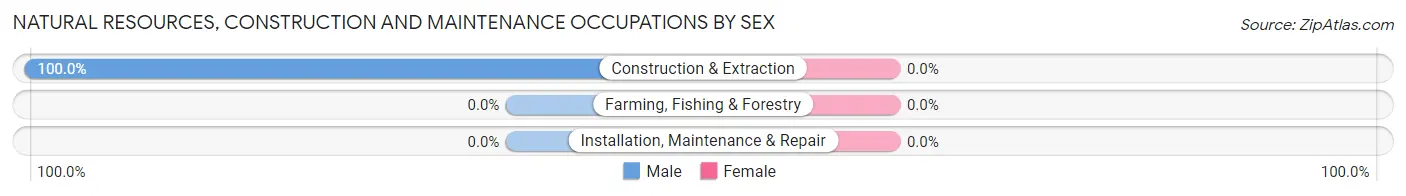
| Occupation | Male | Female |
| Farming, Fishing & Forestry | 0 (0.0%) | 0 (0.0%) |
| Construction & Extraction | 172 (100.0%) | 0 (0.0%) |
| Installation, Maintenance & Repair | 0 (0.0%) | 0 (0.0%) |
| Total (Category) | 172 (100.0%) | 0 (0.0%) |
| Total (Overall) | 306 (100.0%) | 0 (0.0%) |
Production, Transportation and Moving Occupations
The most common Production, Transportation and Moving occupations in Nina are , and Production (134 | 43.8%).
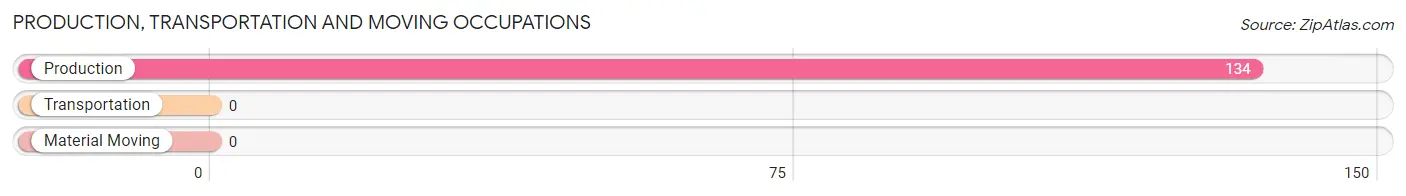
Production, Transportation and Moving Occupations by Sex
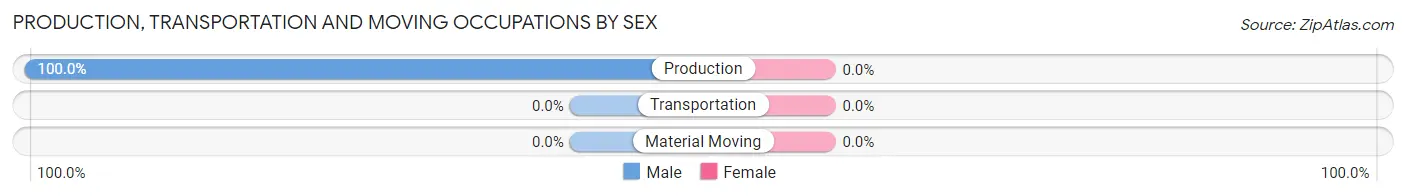
| Occupation | Male | Female |
| Production | 134 (100.0%) | 0 (0.0%) |
| Transportation | 0 (0.0%) | 0 (0.0%) |
| Material Moving | 0 (0.0%) | 0 (0.0%) |
| Total (Category) | 134 (100.0%) | 0 (0.0%) |
| Total (Overall) | 306 (100.0%) | 0 (0.0%) |
Employment Industries by Sex in Nina
Employment Industries in Nina
The major employment industries in Nina include Construction (172 | 56.2%), and Manufacturing (134 | 43.8%).
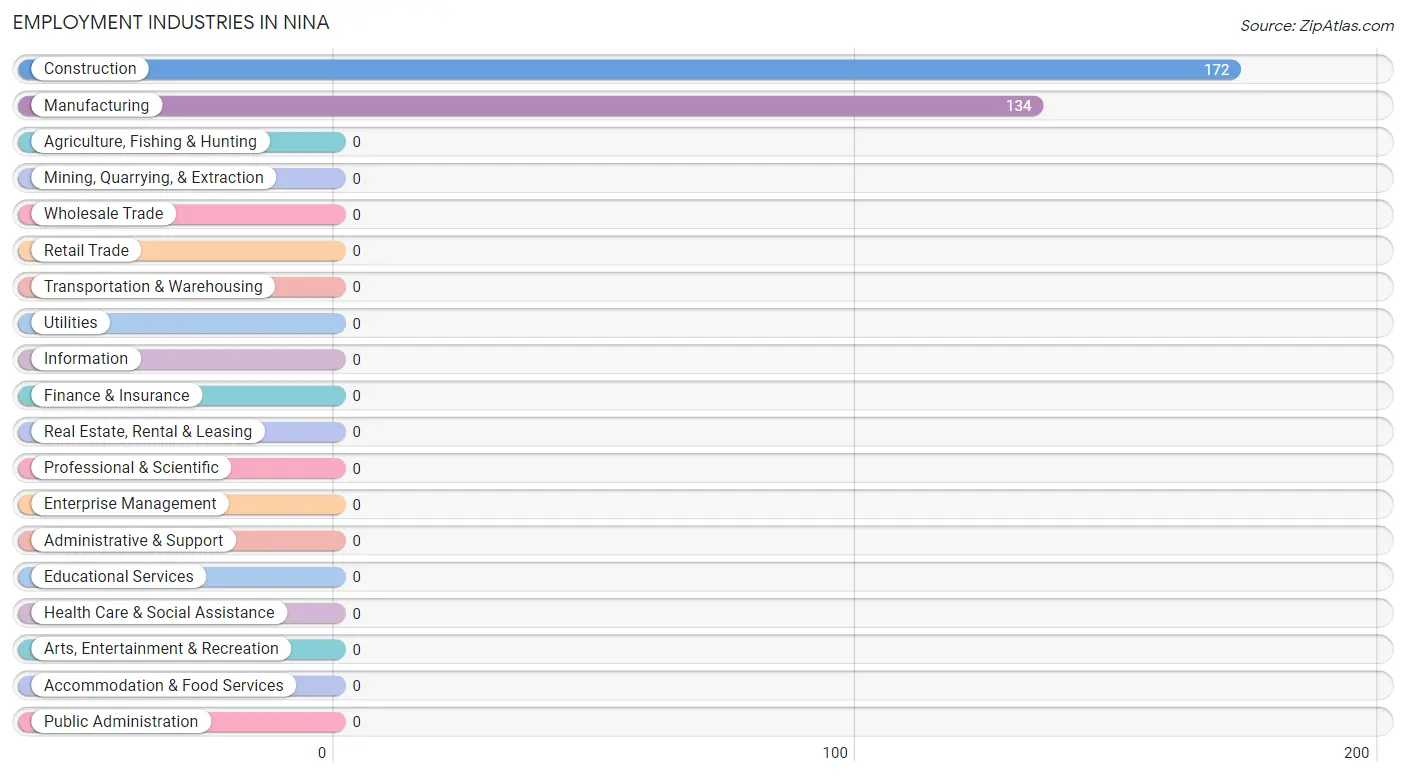
Employment Industries by Sex in Nina
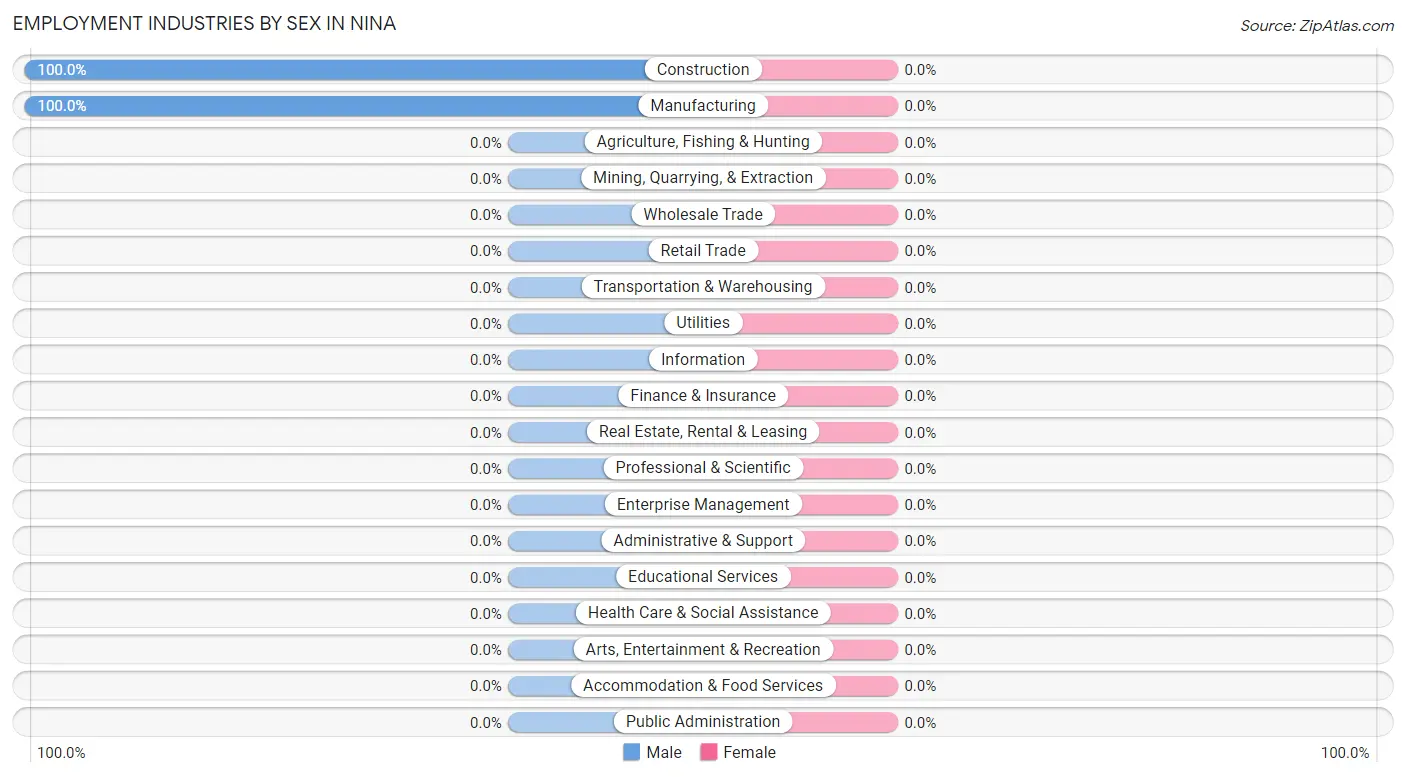
| Industry | Male | Female |
| Agriculture, Fishing & Hunting | 0 (0.0%) | 0 (0.0%) |
| Mining, Quarrying, & Extraction | 0 (0.0%) | 0 (0.0%) |
| Construction | 172 (100.0%) | 0 (0.0%) |
| Manufacturing | 134 (100.0%) | 0 (0.0%) |
| Wholesale Trade | 0 (0.0%) | 0 (0.0%) |
| Retail Trade | 0 (0.0%) | 0 (0.0%) |
| Transportation & Warehousing | 0 (0.0%) | 0 (0.0%) |
| Utilities | 0 (0.0%) | 0 (0.0%) |
| Information | 0 (0.0%) | 0 (0.0%) |
| Finance & Insurance | 0 (0.0%) | 0 (0.0%) |
| Real Estate, Rental & Leasing | 0 (0.0%) | 0 (0.0%) |
| Professional & Scientific | 0 (0.0%) | 0 (0.0%) |
| Enterprise Management | 0 (0.0%) | 0 (0.0%) |
| Administrative & Support | 0 (0.0%) | 0 (0.0%) |
| Educational Services | 0 (0.0%) | 0 (0.0%) |
| Health Care & Social Assistance | 0 (0.0%) | 0 (0.0%) |
| Arts, Entertainment & Recreation | 0 (0.0%) | 0 (0.0%) |
| Accommodation & Food Services | 0 (0.0%) | 0 (0.0%) |
| Public Administration | 0 (0.0%) | 0 (0.0%) |
| Total | 306 (100.0%) | 0 (0.0%) |
Education in Nina
School Enrollment in Nina
The most common levels of schooling among the 168 students in Nina are middle school (123 | 73.2%), and high school (45 | 26.8%).
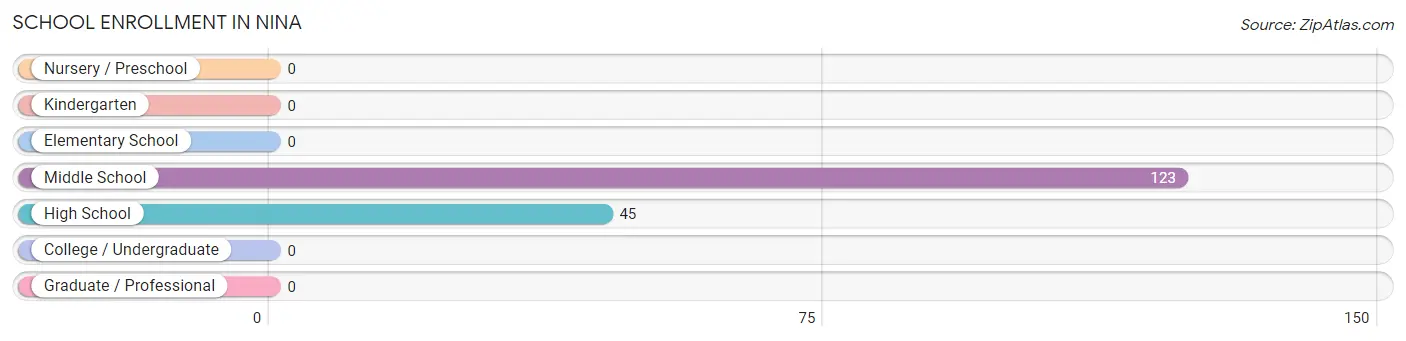
| School Level | # Students | % Students |
| Nursery / Preschool | 0 | 0.0% |
| Kindergarten | 0 | 0.0% |
| Elementary School | 0 | 0.0% |
| Middle School | 123 | 73.2% |
| High School | 45 | 26.8% |
| College / Undergraduate | 0 | 0.0% |
| Graduate / Professional | 0 | 0.0% |
| Total | 168 | 100.0% |
School Enrollment by Age by Funding Source in Nina
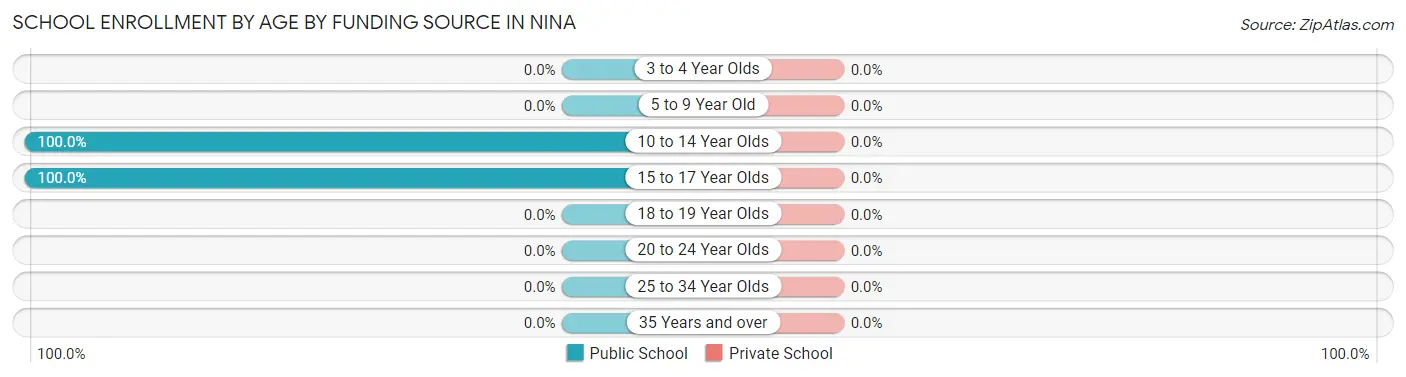
| Age Bracket | Public School | Private School |
| 3 to 4 Year Olds | 0 (0.0%) | 0 (0.0%) |
| 5 to 9 Year Old | 0 (0.0%) | 0 (0.0%) |
| 10 to 14 Year Olds | 123 (100.0%) | 0 (0.0%) |
| 15 to 17 Year Olds | 45 (100.0%) | 0 (0.0%) |
| 18 to 19 Year Olds | 0 (0.0%) | 0 (0.0%) |
| 20 to 24 Year Olds | 0 (0.0%) | 0 (0.0%) |
| 25 to 34 Year Olds | 0 (0.0%) | 0 (0.0%) |
| 35 Years and over | 0 (0.0%) | 0 (0.0%) |
| Total | 168 (100.0%) | 0 (0.0%) |
Educational Attainment by Field of Study in Nina
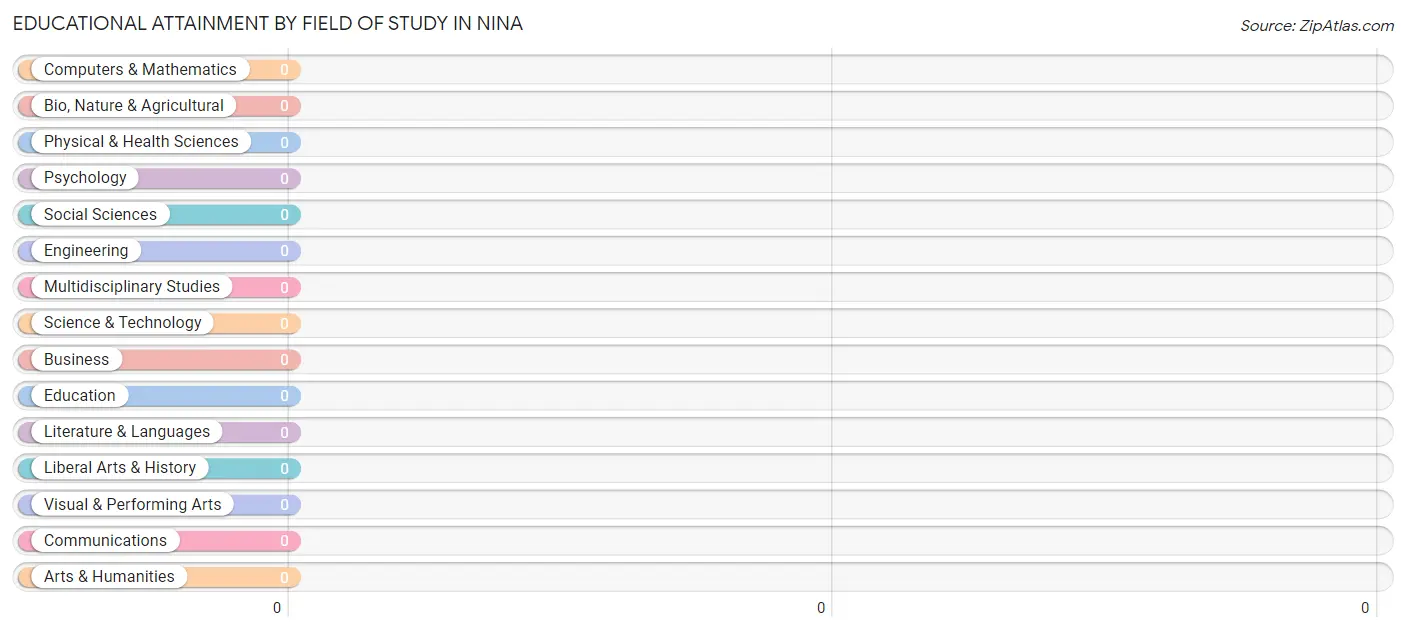
| Field of Study | # Graduates | % Graduates |
| Computers & Mathematics | 0 | 0.0% |
| Bio, Nature & Agricultural | 0 | 0.0% |
| Physical & Health Sciences | 0 | 0.0% |
| Psychology | 0 | 0.0% |
| Social Sciences | 0 | 0.0% |
| Engineering | 0 | 0.0% |
| Multidisciplinary Studies | 0 | 0.0% |
| Science & Technology | 0 | 0.0% |
| Business | 0 | 0.0% |
| Education | 0 | 0.0% |
| Literature & Languages | 0 | 0.0% |
| Liberal Arts & History | 0 | 0.0% |
| Visual & Performing Arts | 0 | 0.0% |
| Communications | 0 | 0.0% |
| Arts & Humanities | 0 | 0.0% |
| Total | 0 | 0.0% |
Transportation & Commute in Nina
Vehicle Availability by Sex in Nina
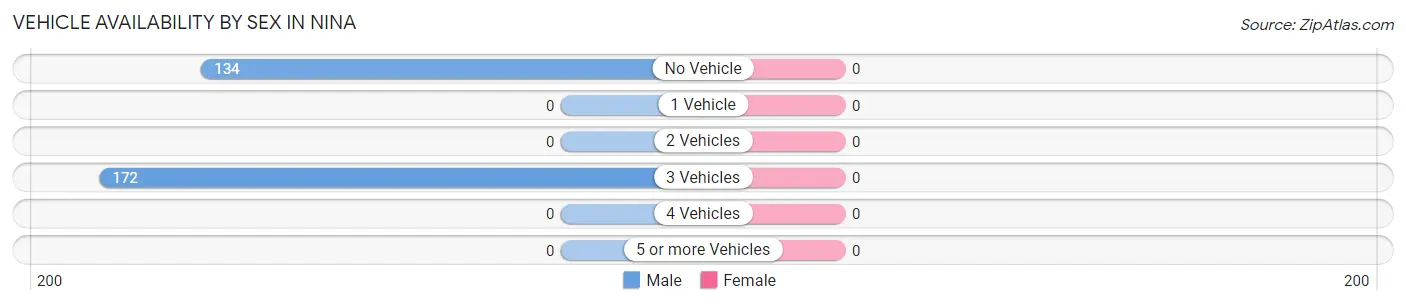
| Vehicles Available | Male | Female |
| No Vehicle | 134 (43.8%) | 0 (0.0%) |
| 1 Vehicle | 0 (0.0%) | 0 (0.0%) |
| 2 Vehicles | 0 (0.0%) | 0 (0.0%) |
| 3 Vehicles | 172 (56.2%) | 0 (0.0%) |
| 4 Vehicles | 0 (0.0%) | 0 (0.0%) |
| 5 or more Vehicles | 0 (0.0%) | 0 (0.0%) |
| Total | 306 (100.0%) | 0 (0.0%) |
Commute Time in Nina
The most frequently occuring commute durations in Nina are less than 5 minutes (134 commuters, 43.8%), 10 to 14 minutes (123 commuters, 40.2%), and 25 to 29 minutes (49 commuters, 16.0%).
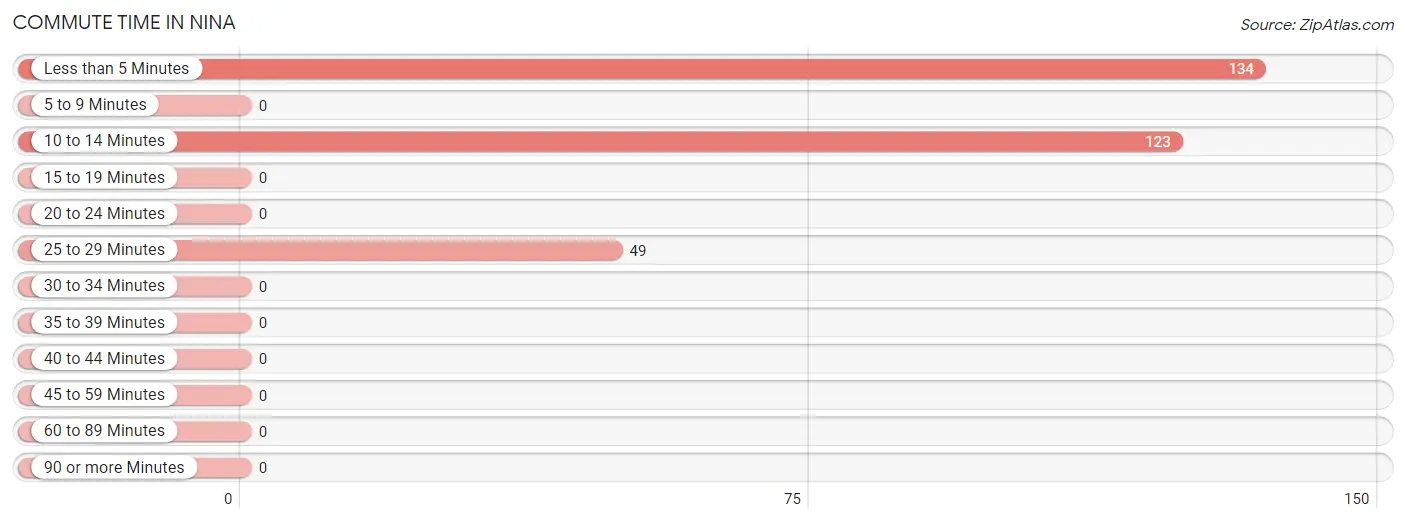
| Commute Time | # Commuters | % Commuters |
| Less than 5 Minutes | 134 | 43.8% |
| 5 to 9 Minutes | 0 | 0.0% |
| 10 to 14 Minutes | 123 | 40.2% |
| 15 to 19 Minutes | 0 | 0.0% |
| 20 to 24 Minutes | 0 | 0.0% |
| 25 to 29 Minutes | 49 | 16.0% |
| 30 to 34 Minutes | 0 | 0.0% |
| 35 to 39 Minutes | 0 | 0.0% |
| 40 to 44 Minutes | 0 | 0.0% |
| 45 to 59 Minutes | 0 | 0.0% |
| 60 to 89 Minutes | 0 | 0.0% |
| 90 or more Minutes | 0 | 0.0% |
Commute Time by Sex in Nina
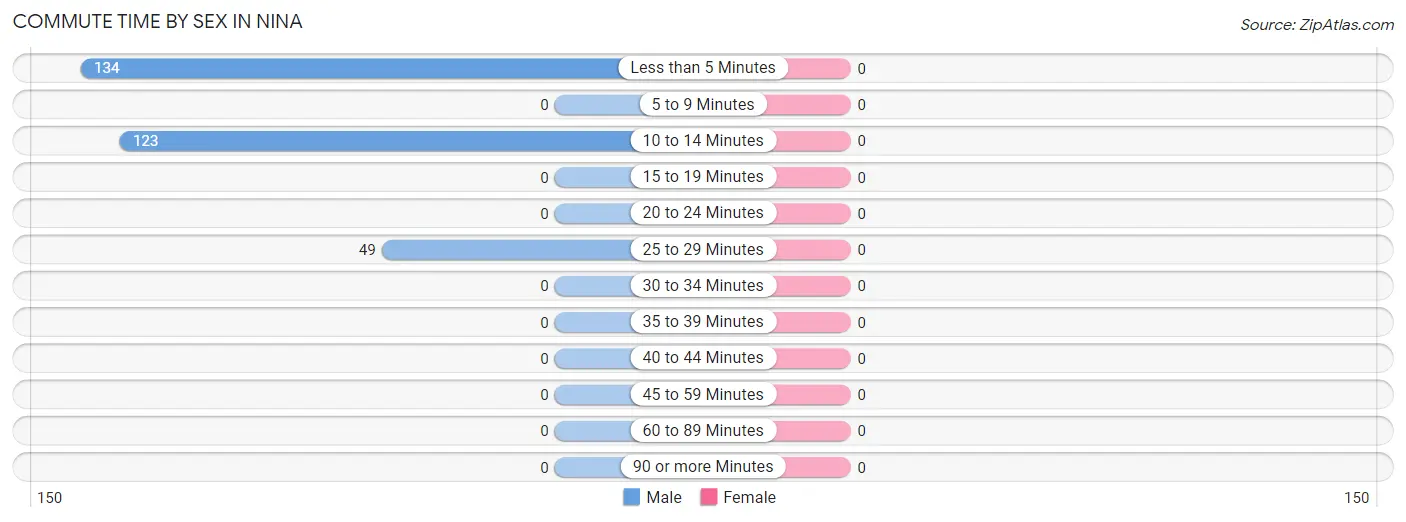
| Commute Time | Male | Female |
| Less than 5 Minutes | 134 (43.8%) | 0 (0.0%) |
| 5 to 9 Minutes | 0 (0.0%) | 0 (0.0%) |
| 10 to 14 Minutes | 123 (40.2%) | 0 (0.0%) |
| 15 to 19 Minutes | 0 (0.0%) | 0 (0.0%) |
| 20 to 24 Minutes | 0 (0.0%) | 0 (0.0%) |
| 25 to 29 Minutes | 49 (16.0%) | 0 (0.0%) |
| 30 to 34 Minutes | 0 (0.0%) | 0 (0.0%) |
| 35 to 39 Minutes | 0 (0.0%) | 0 (0.0%) |
| 40 to 44 Minutes | 0 (0.0%) | 0 (0.0%) |
| 45 to 59 Minutes | 0 (0.0%) | 0 (0.0%) |
| 60 to 89 Minutes | 0 (0.0%) | 0 (0.0%) |
| 90 or more Minutes | 0 (0.0%) | 0 (0.0%) |
Time of Departure to Work by Sex in Nina
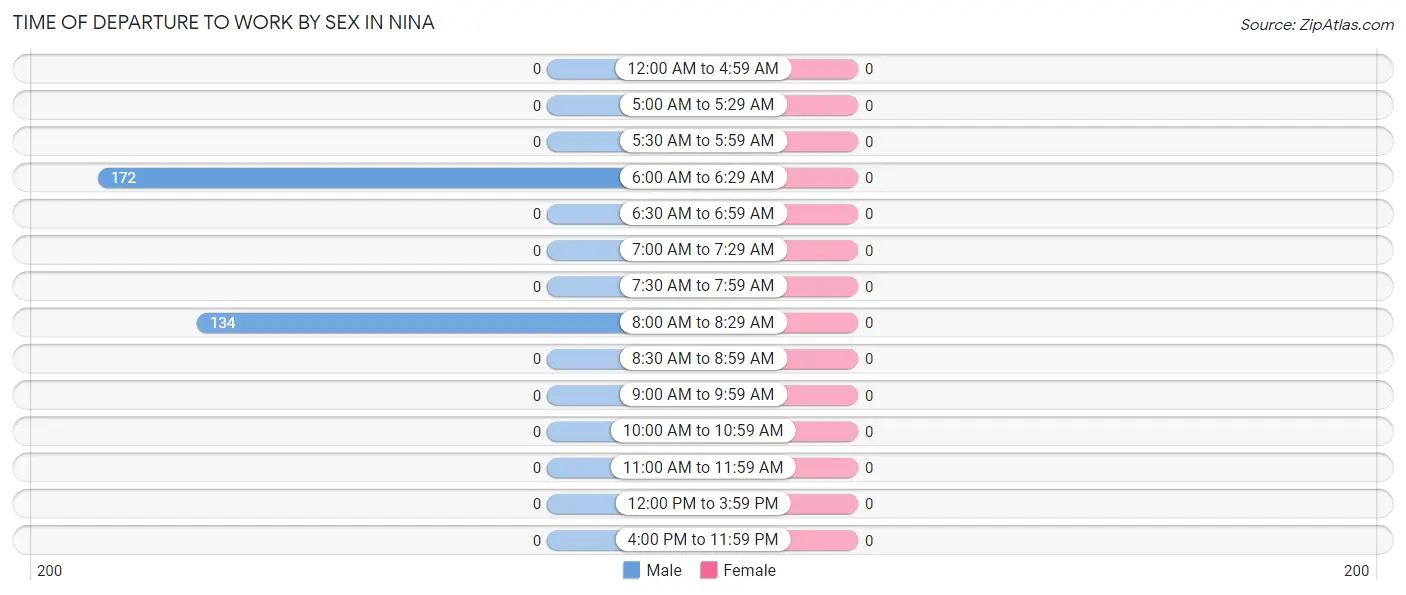
| Time of Departure | Male | Female |
| 12:00 AM to 4:59 AM | 0 (0.0%) | 0 (0.0%) |
| 5:00 AM to 5:29 AM | 0 (0.0%) | 0 (0.0%) |
| 5:30 AM to 5:59 AM | 0 (0.0%) | 0 (0.0%) |
| 6:00 AM to 6:29 AM | 172 (56.2%) | 0 (0.0%) |
| 6:30 AM to 6:59 AM | 0 (0.0%) | 0 (0.0%) |
| 7:00 AM to 7:29 AM | 0 (0.0%) | 0 (0.0%) |
| 7:30 AM to 7:59 AM | 0 (0.0%) | 0 (0.0%) |
| 8:00 AM to 8:29 AM | 134 (43.8%) | 0 (0.0%) |
| 8:30 AM to 8:59 AM | 0 (0.0%) | 0 (0.0%) |
| 9:00 AM to 9:59 AM | 0 (0.0%) | 0 (0.0%) |
| 10:00 AM to 10:59 AM | 0 (0.0%) | 0 (0.0%) |
| 11:00 AM to 11:59 AM | 0 (0.0%) | 0 (0.0%) |
| 12:00 PM to 3:59 PM | 0 (0.0%) | 0 (0.0%) |
| 4:00 PM to 11:59 PM | 0 (0.0%) | 0 (0.0%) |
| Total | 306 (100.0%) | 0 (0.0%) |
Housing Occupancy in Nina
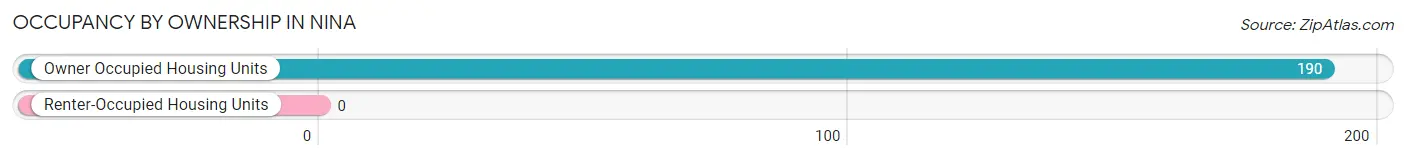
Occupancy by Ownership in Nina
Of the total 190 dwellings in Nina, owner-occupied units account for 190 (100.0%), while renter-occupied units make up 0 (0.0%).
| Occupancy | # Housing Units | % Housing Units |
| Owner Occupied Housing Units | 190 | 100.0% |
| Renter-Occupied Housing Units | 0 | 0.0% |
| Total Occupied Housing Units | 190 | 100.0% |
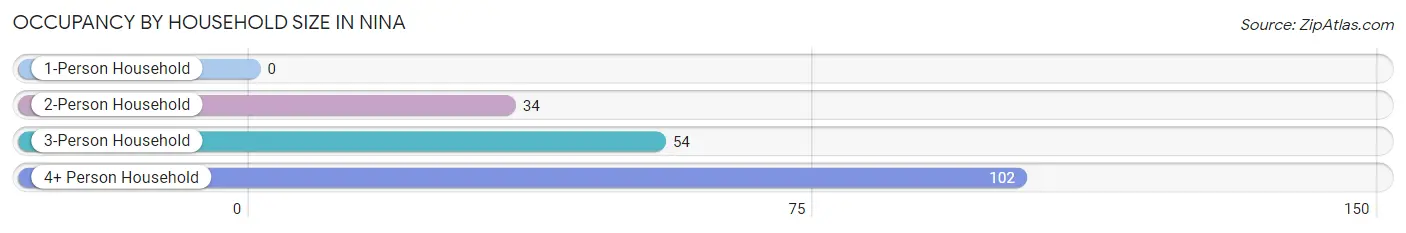
Occupancy by Household Size in Nina
| Household Size | # Housing Units | % Housing Units |
| 1-Person Household | 0 | 0.0% |
| 2-Person Household | 34 | 17.9% |
| 3-Person Household | 54 | 28.4% |
| 4+ Person Household | 102 | 53.7% |
| Total Housing Units | 190 | 100.0% |
Occupancy by Ownership by Household Size in Nina
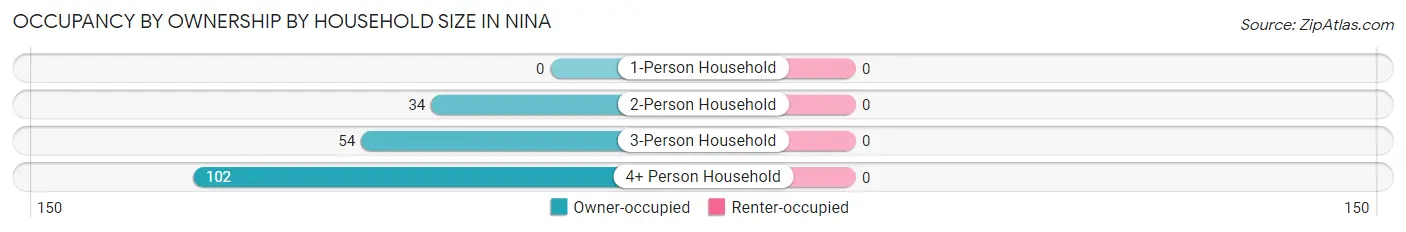
| Household Size | Owner-occupied | Renter-occupied |
| 1-Person Household | 0 (0.0%) | 0 (0.0%) |
| 2-Person Household | 34 (100.0%) | 0 (0.0%) |
| 3-Person Household | 54 (100.0%) | 0 (0.0%) |
| 4+ Person Household | 102 (100.0%) | 0 (0.0%) |
| Total Housing Units | 190 (100.0%) | 0 (0.0%) |
Occupancy by Educational Attainment in Nina
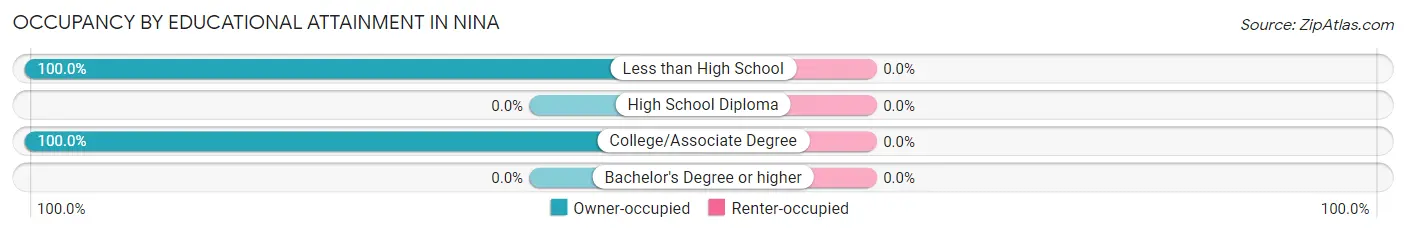
| Household Size | Owner-occupied | Renter-occupied |
| Less than High School | 108 (100.0%) | 0 (0.0%) |
| High School Diploma | 0 (0.0%) | 0 (0.0%) |
| College/Associate Degree | 82 (100.0%) | 0 (0.0%) |
| Bachelor's Degree or higher | 0 (0.0%) | 0 (0.0%) |
Occupancy by Age of Householder in Nina
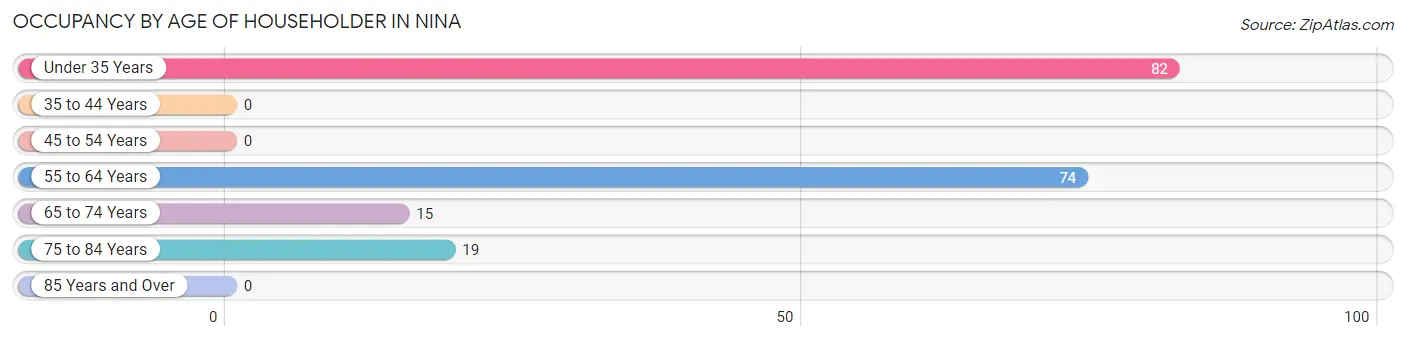
| Age Bracket | # Households | % Households |
| Under 35 Years | 82 | 43.2% |
| 35 to 44 Years | 0 | 0.0% |
| 45 to 54 Years | 0 | 0.0% |
| 55 to 64 Years | 74 | 39.0% |
| 65 to 74 Years | 15 | 7.9% |
| 75 to 84 Years | 19 | 10.0% |
| 85 Years and Over | 0 | 0.0% |
| Total | 190 | 100.0% |
Housing Finances in Nina
Median Income by Occupancy in Nina
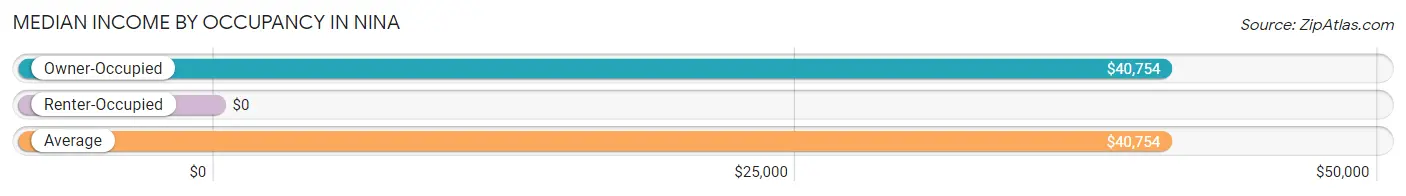
| Occupancy Type | # Households | Median Income |
| Owner-Occupied | 190 (100.0%) | $40,754 |
| Renter-Occupied | 0 (0.0%) | $0 |
| Average | 190 (100.0%) | $40,754 |
Occupancy by Householder Income Bracket in Nina
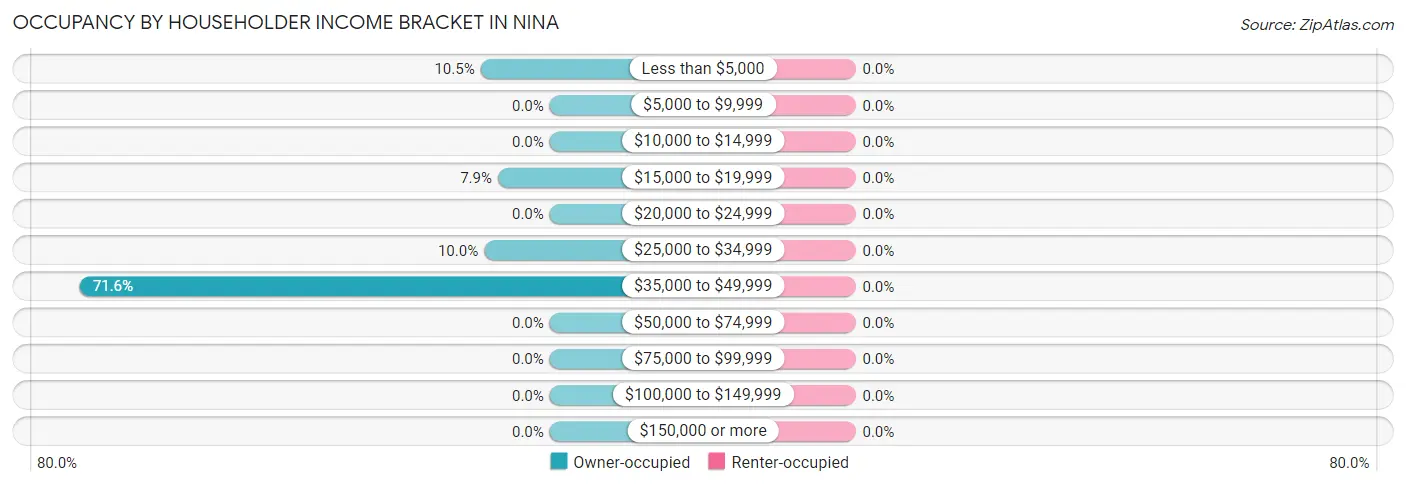
| Income Bracket | Owner-occupied | Renter-occupied |
| Less than $5,000 | 20 (10.5%) | 0 (0.0%) |
| $5,000 to $9,999 | 0 (0.0%) | 0 (0.0%) |
| $10,000 to $14,999 | 0 (0.0%) | 0 (0.0%) |
| $15,000 to $19,999 | 15 (7.9%) | 0 (0.0%) |
| $20,000 to $24,999 | 0 (0.0%) | 0 (0.0%) |
| $25,000 to $34,999 | 19 (10.0%) | 0 (0.0%) |
| $35,000 to $49,999 | 136 (71.6%) | 0 (0.0%) |
| $50,000 to $74,999 | 0 (0.0%) | 0 (0.0%) |
| $75,000 to $99,999 | 0 (0.0%) | 0 (0.0%) |
| $100,000 to $149,999 | 0 (0.0%) | 0 (0.0%) |
| $150,000 or more | 0 (0.0%) | 0 (0.0%) |
| Total | 190 (100.0%) | 0 (0.0%) |
Monthly Housing Cost Tiers in Nina
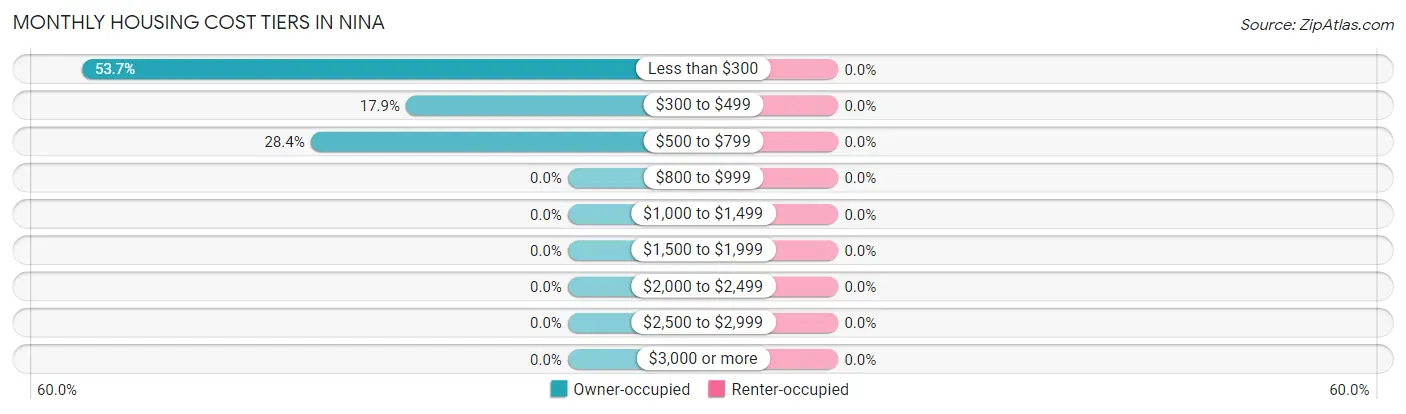
| Monthly Cost | Owner-occupied | Renter-occupied |
| Less than $300 | 102 (53.7%) | 0 (0.0%) |
| $300 to $499 | 34 (17.9%) | 0 (0.0%) |
| $500 to $799 | 54 (28.4%) | 0 (0.0%) |
| $800 to $999 | 0 (0.0%) | 0 (0.0%) |
| $1,000 to $1,499 | 0 (0.0%) | 0 (0.0%) |
| $1,500 to $1,999 | 0 (0.0%) | 0 (0.0%) |
| $2,000 to $2,499 | 0 (0.0%) | 0 (0.0%) |
| $2,500 to $2,999 | 0 (0.0%) | 0 (0.0%) |
| $3,000 or more | 0 (0.0%) | 0 (0.0%) |
| Total | 190 (100.0%) | 0 (0.0%) |
Physical Housing Characteristics in Nina
Housing Structures in Nina
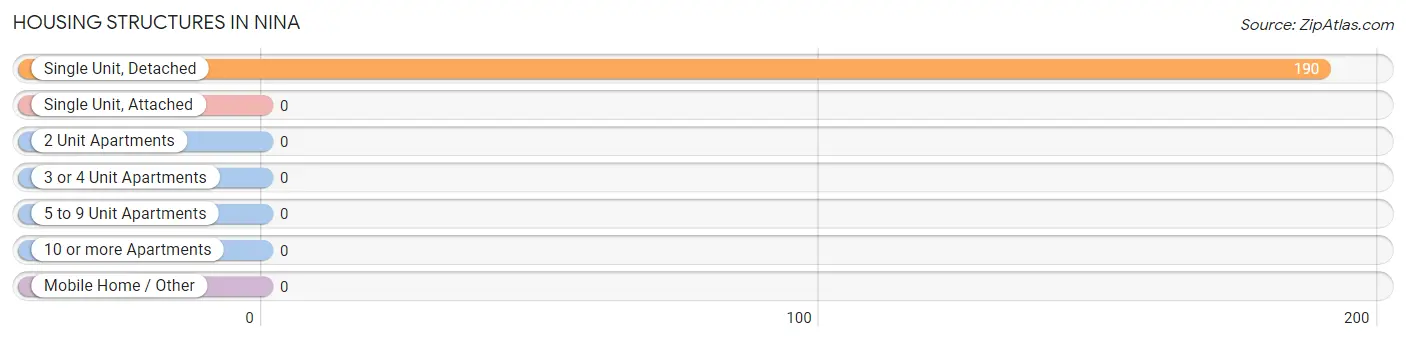
| Structure Type | # Housing Units | % Housing Units |
| Single Unit, Detached | 190 | 100.0% |
| Single Unit, Attached | 0 | 0.0% |
| 2 Unit Apartments | 0 | 0.0% |
| 3 or 4 Unit Apartments | 0 | 0.0% |
| 5 to 9 Unit Apartments | 0 | 0.0% |
| 10 or more Apartments | 0 | 0.0% |
| Mobile Home / Other | 0 | 0.0% |
| Total | 190 | 100.0% |
Housing Structures by Occupancy in Nina
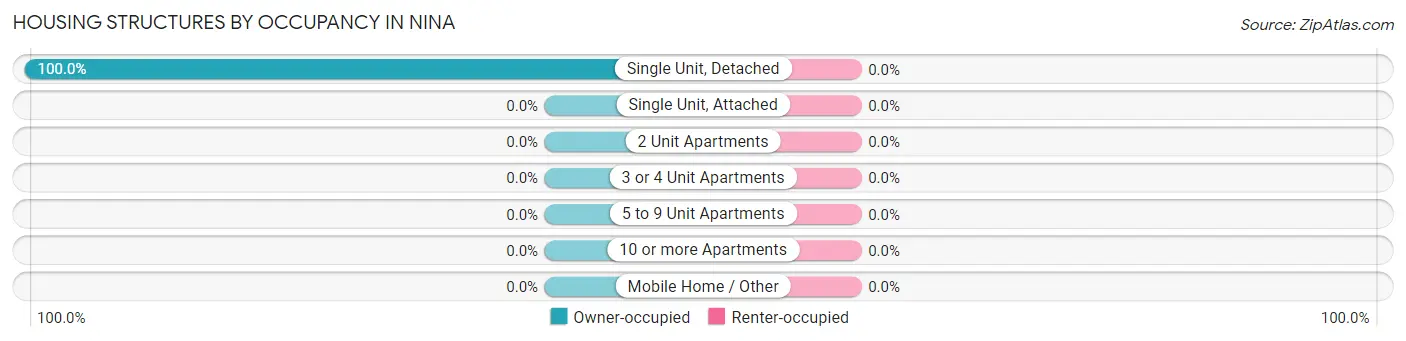
| Structure Type | Owner-occupied | Renter-occupied |
| Single Unit, Detached | 190 (100.0%) | 0 (0.0%) |
| Single Unit, Attached | 0 (0.0%) | 0 (0.0%) |
| 2 Unit Apartments | 0 (0.0%) | 0 (0.0%) |
| 3 or 4 Unit Apartments | 0 (0.0%) | 0 (0.0%) |
| 5 to 9 Unit Apartments | 0 (0.0%) | 0 (0.0%) |
| 10 or more Apartments | 0 (0.0%) | 0 (0.0%) |
| Mobile Home / Other | 0 (0.0%) | 0 (0.0%) |
| Total | 190 (100.0%) | 0 (0.0%) |
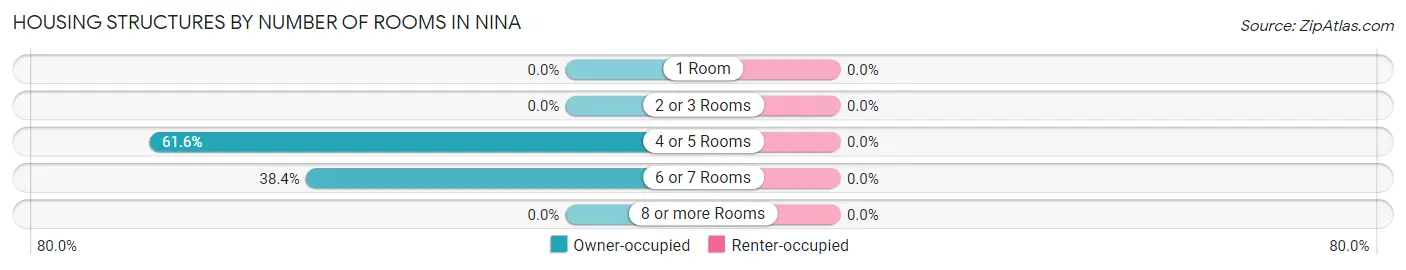
Housing Structures by Number of Rooms in Nina
| Number of Rooms | Owner-occupied | Renter-occupied |
| 1 Room | 0 (0.0%) | 0 (0.0%) |
| 2 or 3 Rooms | 0 (0.0%) | 0 (0.0%) |
| 4 or 5 Rooms | 117 (61.6%) | 0 (0.0%) |
| 6 or 7 Rooms | 73 (38.4%) | 0 (0.0%) |
| 8 or more Rooms | 0 (0.0%) | 0 (0.0%) |
| Total | 190 (100.0%) | 0 (0.0%) |
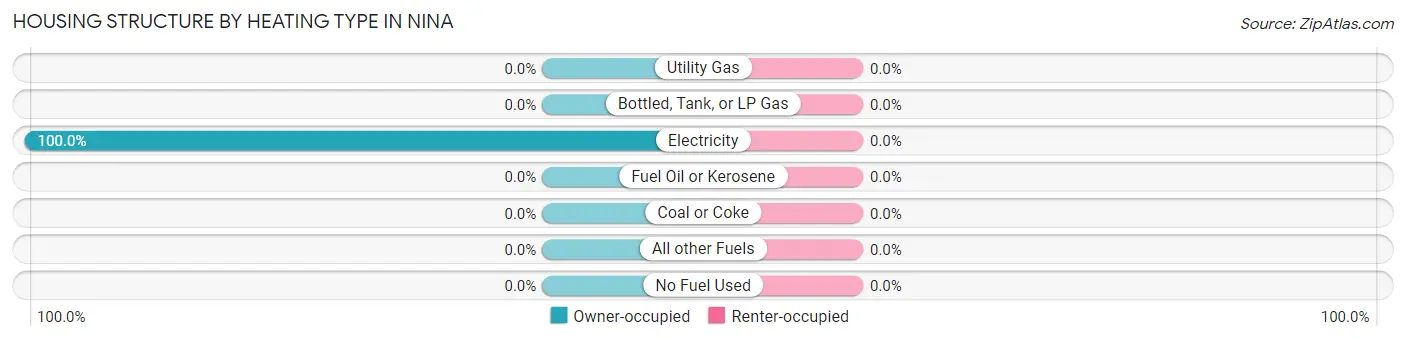
Housing Structure by Heating Type in Nina
| Heating Type | Owner-occupied | Renter-occupied |
| Utility Gas | 0 (0.0%) | 0 (0.0%) |
| Bottled, Tank, or LP Gas | 0 (0.0%) | 0 (0.0%) |
| Electricity | 190 (100.0%) | 0 (0.0%) |
| Fuel Oil or Kerosene | 0 (0.0%) | 0 (0.0%) |
| Coal or Coke | 0 (0.0%) | 0 (0.0%) |
| All other Fuels | 0 (0.0%) | 0 (0.0%) |
| No Fuel Used | 0 (0.0%) | 0 (0.0%) |
| Total | 190 (100.0%) | 0 (0.0%) |
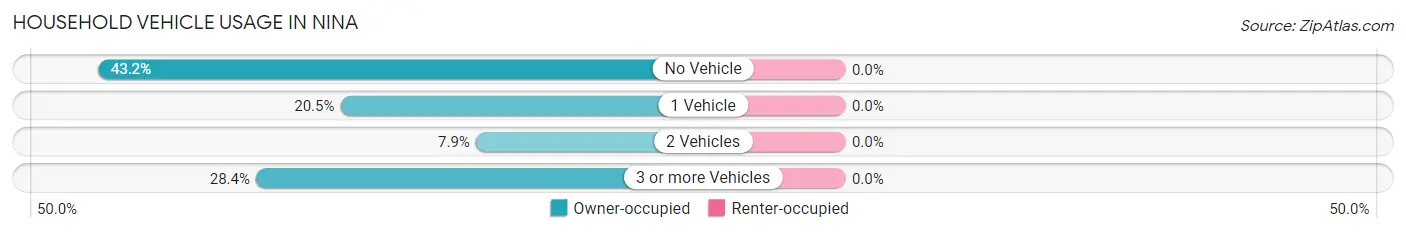
Household Vehicle Usage in Nina
| Vehicles per Household | Owner-occupied | Renter-occupied |
| No Vehicle | 82 (43.2%) | 0 (0.0%) |
| 1 Vehicle | 39 (20.5%) | 0 (0.0%) |
| 2 Vehicles | 15 (7.9%) | 0 (0.0%) |
| 3 or more Vehicles | 54 (28.4%) | 0 (0.0%) |
| Total | 190 (100.0%) | 0 (0.0%) |
Real Estate & Mortgages in Nina
Real Estate and Mortgage Overview in Nina
| Characteristic | Without Mortgage | With Mortgage |
| Housing Units | 190 | 0 |
| Median Property Value | - | - |
| Median Household Income | $40,754 | $0 |
| Monthly Housing Costs | $297 | $0 |
| Real Estate Taxes | $1,151 | $0 |
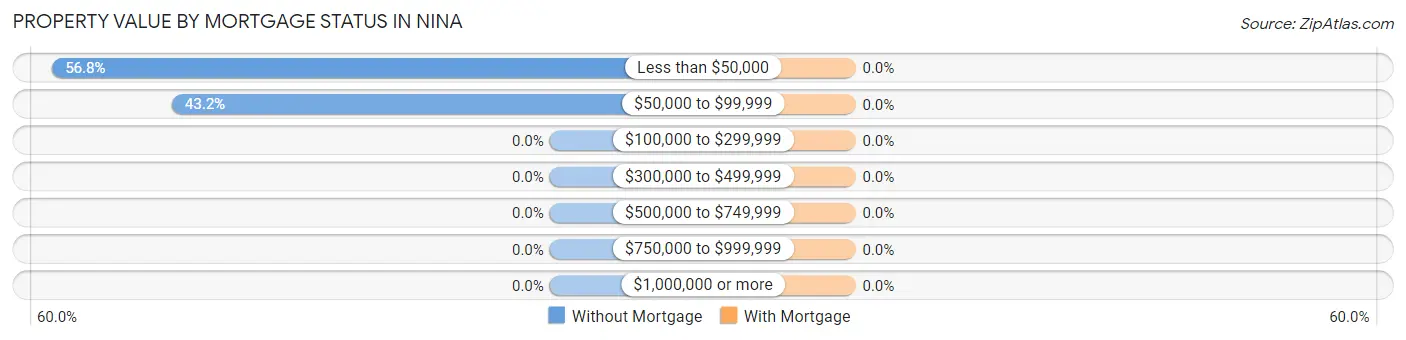
Property Value by Mortgage Status in Nina
| Property Value | Without Mortgage | With Mortgage |
| Less than $50,000 | 108 (56.8%) | 0 (0.0%) |
| $50,000 to $99,999 | 82 (43.2%) | 0 (0.0%) |
| $100,000 to $299,999 | 0 (0.0%) | 0 (0.0%) |
| $300,000 to $499,999 | 0 (0.0%) | 0 (0.0%) |
| $500,000 to $749,999 | 0 (0.0%) | 0 (0.0%) |
| $750,000 to $999,999 | 0 (0.0%) | 0 (0.0%) |
| $1,000,000 or more | 0 (0.0%) | 0 (0.0%) |
| Total | 190 (100.0%) | 0 (0.0%) |
Household Income by Mortgage Status in Nina
| Household Income | Without Mortgage | With Mortgage |
| Less than $10,000 | 20 (10.5%) | 0 (0.0%) |
| $10,000 to $24,999 | 15 (7.9%) | 0 (0.0%) |
| $25,000 to $34,999 | 19 (10.0%) | 0 (0.0%) |
| $35,000 to $49,999 | 136 (71.6%) | 0 (0.0%) |
| $50,000 to $74,999 | 0 (0.0%) | 0 (0.0%) |
| $75,000 to $99,999 | 0 (0.0%) | 0 (0.0%) |
| $100,000 to $149,999 | 0 (0.0%) | 0 (0.0%) |
| $150,000 or more | 0 (0.0%) | 0 (0.0%) |
| Total | 190 (100.0%) | 0 (0.0%) |
Property Value to Household Income Ratio in Nina
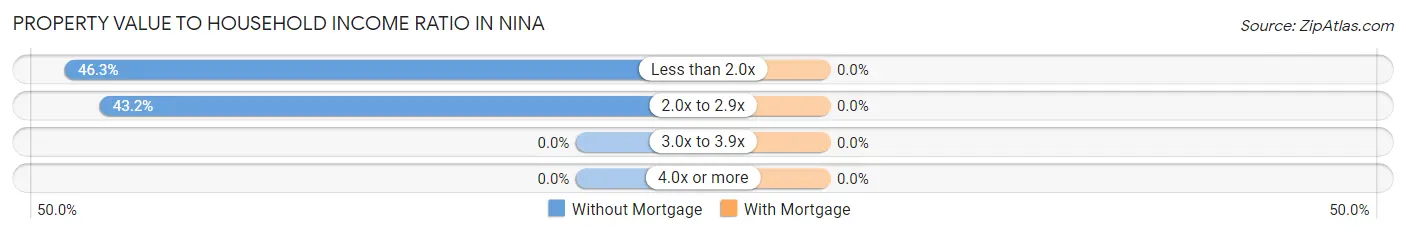
| Value-to-Income Ratio | Without Mortgage | With Mortgage |
| Less than 2.0x | 88 (46.3%) | 0 (0.0%) |
| 2.0x to 2.9x | 82 (43.2%) | 0 (0.0%) |
| 3.0x to 3.9x | 0 (0.0%) | 0 (0.0%) |
| 4.0x or more | 0 (0.0%) | 0 (0.0%) |
| Total | 190 (100.0%) | 0 (0.0%) |
Real Estate Taxes by Mortgage Status in Nina
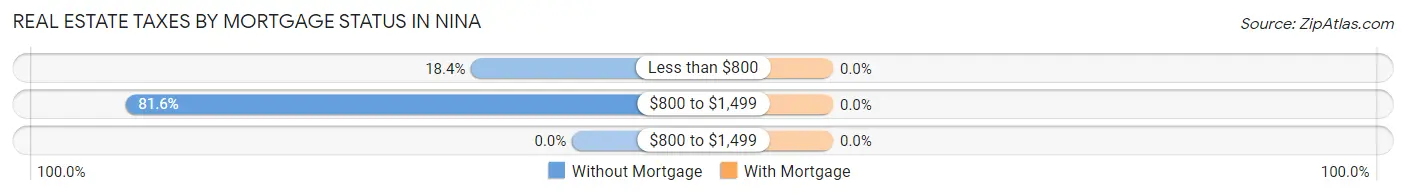
| Property Taxes | Without Mortgage | With Mortgage |
| Less than $800 | 35 (18.4%) | 0 (0.0%) |
| $800 to $1,499 | 155 (81.6%) | 0 (0.0%) |
| $800 to $1,499 | 0 (0.0%) | 0 (0.0%) |
| Total | 190 (100.0%) | 0 (0.0%) |
Health & Disability in Nina
Health Insurance Coverage by Age in Nina
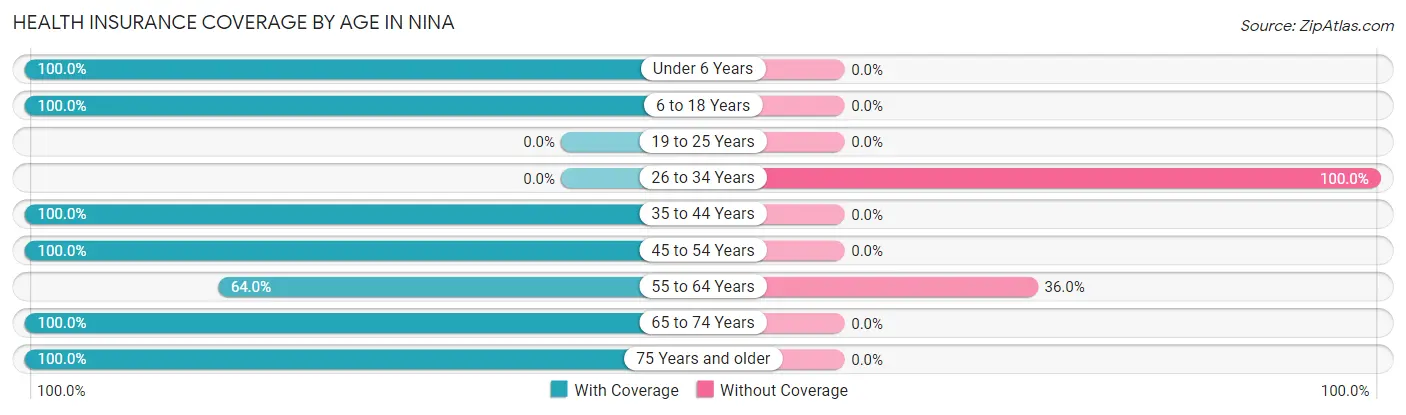
| Age Bracket | With Coverage | Without Coverage |
| Under 6 Years | 139 (100.0%) | 0 (0.0%) |
| 6 to 18 Years | 168 (100.0%) | 0 (0.0%) |
| 19 to 25 Years | 0 (0.0%) | 0 (0.0%) |
| 26 to 34 Years | 0 (0.0%) | 205 (100.0%) |
| 35 to 44 Years | 134 (100.0%) | 0 (0.0%) |
| 45 to 54 Years | 20 (100.0%) | 0 (0.0%) |
| 55 to 64 Years | 87 (64.0%) | 49 (36.0%) |
| 65 to 74 Years | 31 (100.0%) | 0 (0.0%) |
| 75 Years and older | 19 (100.0%) | 0 (0.0%) |
| Total | 598 (70.2%) | 254 (29.8%) |
Health Insurance Coverage by Citizenship Status in Nina
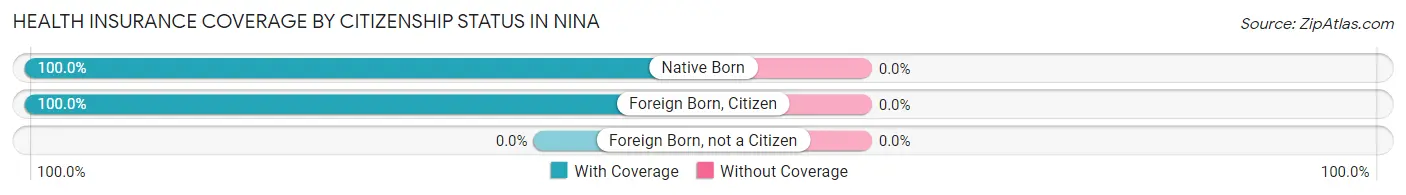
| Citizenship Status | With Coverage | Without Coverage |
| Native Born | 139 (100.0%) | 0 (0.0%) |
| Foreign Born, Citizen | 168 (100.0%) | 0 (0.0%) |
| Foreign Born, not a Citizen | 0 (0.0%) | 0 (0.0%) |
Health Insurance Coverage by Household Income in Nina
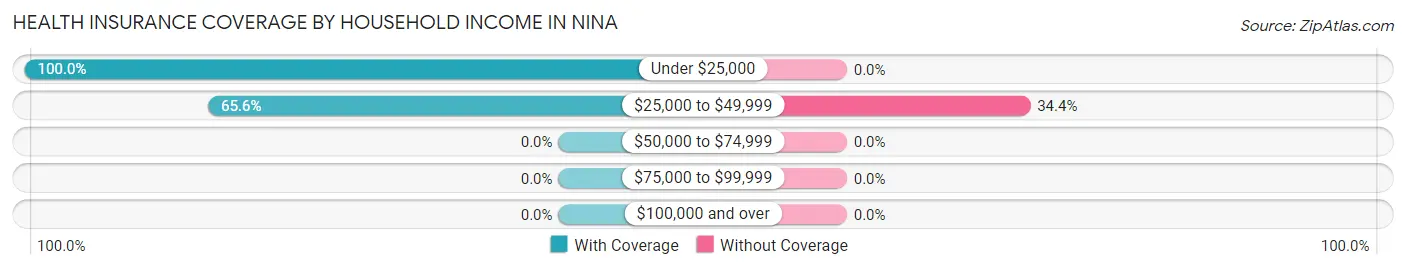
| Household Income | With Coverage | Without Coverage |
| Under $25,000 | 113 (100.0%) | 0 (0.0%) |
| $25,000 to $49,999 | 485 (65.6%) | 254 (34.4%) |
| $50,000 to $74,999 | 0 (0.0%) | 0 (0.0%) |
| $75,000 to $99,999 | 0 (0.0%) | 0 (0.0%) |
| $100,000 and over | 0 (0.0%) | 0 (0.0%) |
Public vs Private Health Insurance Coverage by Age in Nina
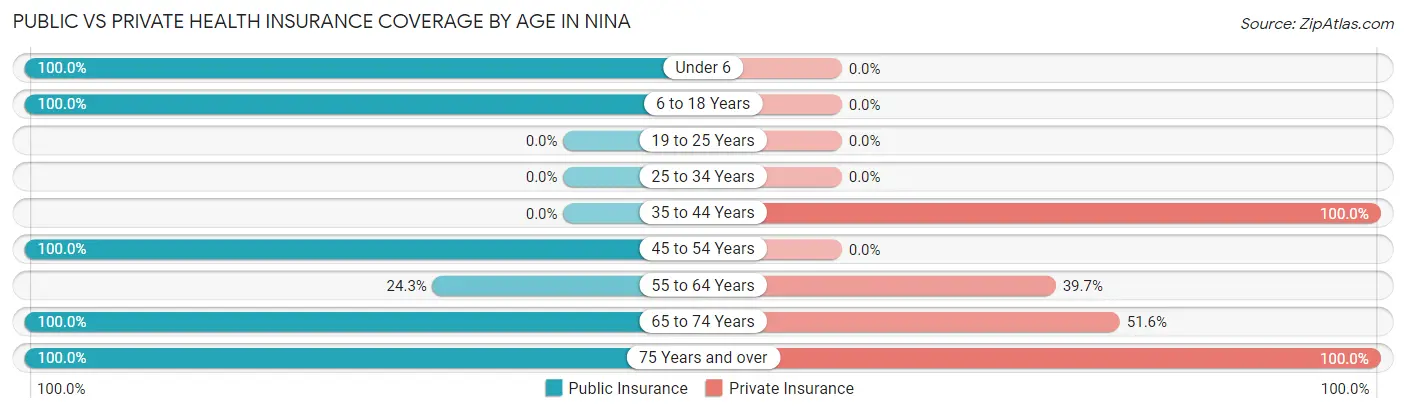
| Age Bracket | Public Insurance | Private Insurance |
| Under 6 | 139 (100.0%) | 0 (0.0%) |
| 6 to 18 Years | 168 (100.0%) | 0 (0.0%) |
| 19 to 25 Years | 0 (0.0%) | 0 (0.0%) |
| 25 to 34 Years | 0 (0.0%) | 0 (0.0%) |
| 35 to 44 Years | 0 (0.0%) | 134 (100.0%) |
| 45 to 54 Years | 20 (100.0%) | 0 (0.0%) |
| 55 to 64 Years | 33 (24.3%) | 54 (39.7%) |
| 65 to 74 Years | 31 (100.0%) | 16 (51.6%) |
| 75 Years and over | 19 (100.0%) | 19 (100.0%) |
| Total | 410 (48.1%) | 223 (26.2%) |
Disability Status by Sex by Age in Nina
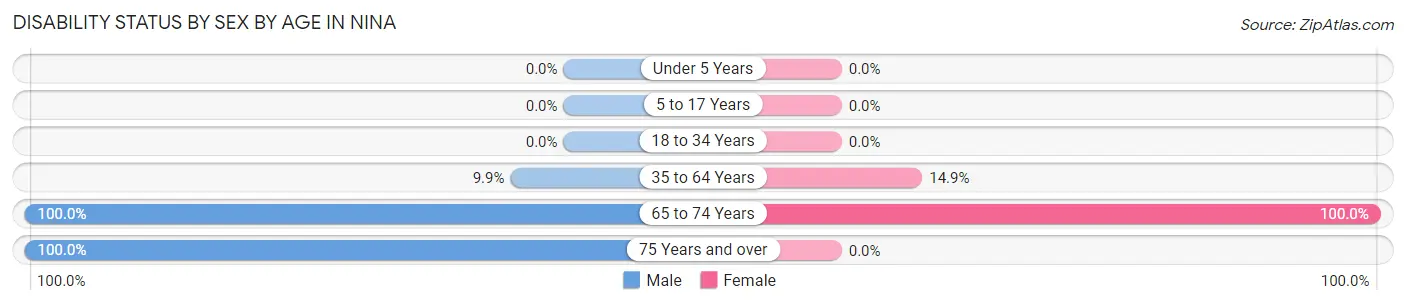
| Age Bracket | Male | Female |
| Under 5 Years | 0 (0.0%) | 0 (0.0%) |
| 5 to 17 Years | 0 (0.0%) | 0 (0.0%) |
| 18 to 34 Years | 0 (0.0%) | 0 (0.0%) |
| 35 to 64 Years | 20 (9.9%) | 13 (14.9%) |
| 65 to 74 Years | 15 (100.0%) | 16 (100.0%) |
| 75 Years and over | 19 (100.0%) | 0 (0.0%) |
Disability Class by Sex by Age in Nina
Disability Class: Hearing Difficulty
| Age Bracket | Male | Female |
| Under 5 Years | 0 (0.0%) | 0 (0.0%) |
| 5 to 17 Years | 0 (0.0%) | 0 (0.0%) |
| 18 to 34 Years | 0 (0.0%) | 0 (0.0%) |
| 35 to 64 Years | 0 (0.0%) | 0 (0.0%) |
| 65 to 74 Years | 0 (0.0%) | 0 (0.0%) |
| 75 Years and over | 0 (0.0%) | 0 (0.0%) |
Disability Class: Vision Difficulty
| Age Bracket | Male | Female |
| Under 5 Years | 0 (0.0%) | 0 (0.0%) |
| 5 to 17 Years | 0 (0.0%) | 0 (0.0%) |
| 18 to 34 Years | 0 (0.0%) | 0 (0.0%) |
| 35 to 64 Years | 20 (9.9%) | 13 (14.9%) |
| 65 to 74 Years | 0 (0.0%) | 0 (0.0%) |
| 75 Years and over | 19 (100.0%) | 0 (0.0%) |
Disability Class: Cognitive Difficulty
| Age Bracket | Male | Female |
| 5 to 17 Years | 0 (0.0%) | 0 (0.0%) |
| 18 to 34 Years | 0 (0.0%) | 0 (0.0%) |
| 35 to 64 Years | 20 (9.9%) | 13 (14.9%) |
| 65 to 74 Years | 0 (0.0%) | 16 (100.0%) |
| 75 Years and over | 19 (100.0%) | 0 (0.0%) |
Disability Class: Ambulatory Difficulty
| Age Bracket | Male | Female |
| 5 to 17 Years | 0 (0.0%) | 0 (0.0%) |
| 18 to 34 Years | 0 (0.0%) | 0 (0.0%) |
| 35 to 64 Years | 20 (9.9%) | 13 (14.9%) |
| 65 to 74 Years | 15 (100.0%) | 16 (100.0%) |
| 75 Years and over | 19 (100.0%) | 0 (0.0%) |
Disability Class: Self-Care Difficulty
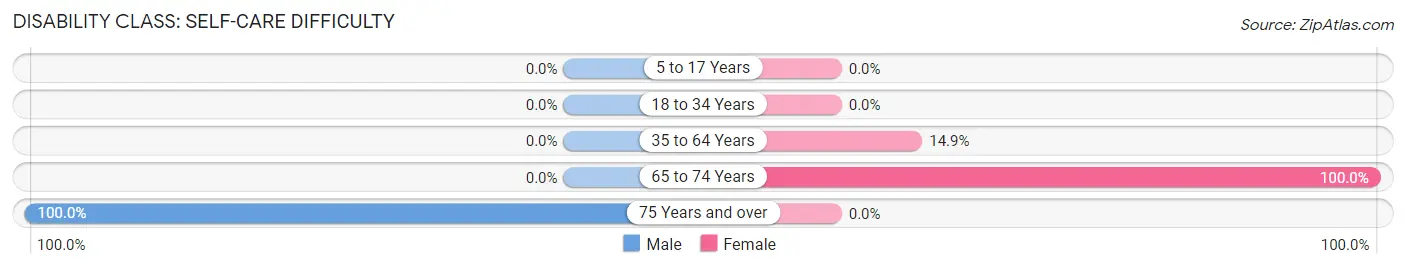
| Age Bracket | Male | Female |
| 5 to 17 Years | 0 (0.0%) | 0 (0.0%) |
| 18 to 34 Years | 0 (0.0%) | 0 (0.0%) |
| 35 to 64 Years | 0 (0.0%) | 13 (14.9%) |
| 65 to 74 Years | 0 (0.0%) | 16 (100.0%) |
| 75 Years and over | 19 (100.0%) | 0 (0.0%) |
Technology Access in Nina
Computing Device Access in Nina
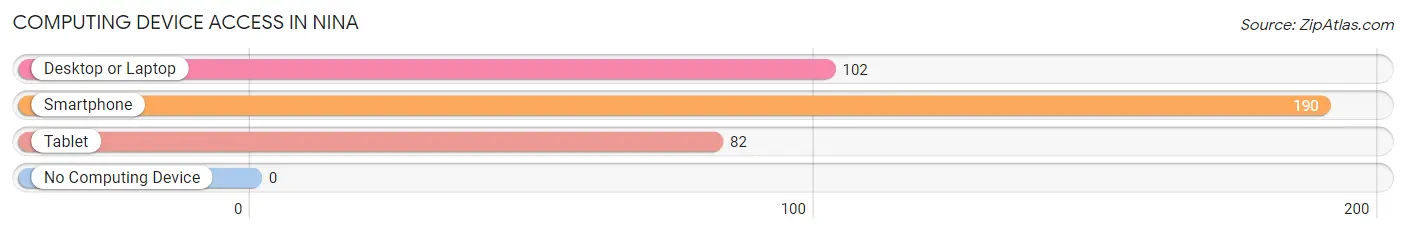
| Device Type | # Households | % Households |
| Desktop or Laptop | 102 | 53.7% |
| Smartphone | 190 | 100.0% |
| Tablet | 82 | 43.2% |
| No Computing Device | 0 | 0.0% |
| Total | 190 | 100.0% |
Internet Access in Nina
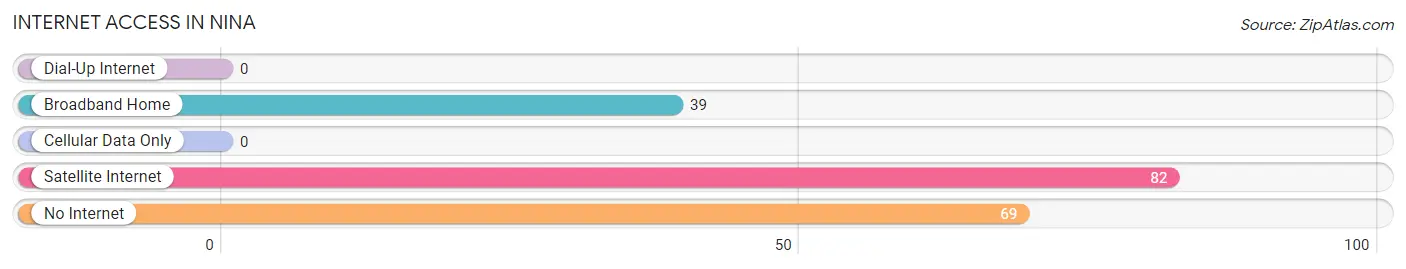
| Internet Type | # Households | % Households |
| Dial-Up Internet | 0 | 0.0% |
| Broadband Home | 39 | 20.5% |
| Cellular Data Only | 0 | 0.0% |
| Satellite Internet | 82 | 43.2% |
| No Internet | 69 | 36.3% |
| Total | 190 | 100.0% |
Nina Summary
Nina is a small town located in the state of Texas, in the United States. It is situated in the county of Collin, and is part of the Dallas-Fort Worth-Arlington metropolitan area. The town has a population of approximately 1,000 people, and is located about 30 miles northeast of Dallas.
Geography
Nina is located in the northeast corner of Collin County, Texas. It is situated on the banks of the Trinity River, and is surrounded by rolling hills and wooded areas. The town is located at an elevation of 745 feet above sea level. The climate in Nina is characterized by hot summers and mild winters. The average annual temperature is around 70 degrees Fahrenheit.
Economy
Nina’s economy is largely based on agriculture and ranching. The town is home to several farms and ranches, which produce a variety of crops and livestock. The town also has a few small businesses, including a grocery store, a hardware store, and a few restaurants.
Demographics
As of the 2010 census, the population of Nina was 1,000 people. The racial makeup of the town was 97.2% White, 0.7% African American, 0.3% Native American, 0.3% Asian, 0.1% Pacific Islander, and 1.5% from other races. The median household income in Nina was $45,000, and the median family income was $50,000.
History
Nina was founded in 1845 by a group of settlers from Tennessee. The town was named after the daughter of one of the settlers, and was originally known as “Nina’s Settlement.” The town grew slowly over the years, and by the early 1900s, it had become a thriving agricultural community. In the 1950s, the town began to experience a population boom, as many people moved to the area to take advantage of the booming economy. Today, Nina is a small, rural town with a population of around 1,000 people.
Nina is a small town with a rich history and a vibrant economy. It is a great place to live, work, and raise a family. The town is home to a variety of businesses, farms, and ranches, and is a great place to experience the beauty of the Texas countryside.
Common Questions
What is the Total Population of Nina?
Total Population of Nina is 852.
What is the Total Male Population of Nina?
Total Male Population of Nina is 544.
What is the Total Female Population of Nina?
Total Female Population of Nina is 308.
What is the Ratio of Males per 100 Females in Nina?
There are 176.62 Males per 100 Females in Nina.
What is the Ratio of Females per 100 Males in Nina?
There are 56.62 Females per 100 Males in Nina.
What is the Median Population Age in Nina?
Median Population Age in Nina is 30.6 Years.
What is the Average Family Size in Nina
Average Family Size in Nina is 4.5 People.
What is the Average Household Size in Nina
Average Household Size in Nina is 4.5 People.
What is Per Capita Income in Nina?
Per Capita income in Nina is $11,252.
What is the Median Family Income in Nina?
Median Family Income in Nina is $40,754.
What is the Median Household income in Nina?
Median Household Income in Nina is $40,754.
What is Inequality or Gini Index in Nina?
Inequality or Gini Index in Nina is 0.19.
How Large is the Labor Force in Nina?
There are 306 People in the Labor Forcein in Nina.
What is the Percentage of People in the Labor Force in Nina?
51.9% of People are in the Labor Force in Nina.