Farmingville, NY
Farmingville Map
Farmingville Overview
16,889
TOTAL POPULATION
9,192
MALE POPULATION
7,697
FEMALE POPULATION
119.42
MALES / 100 FEMALES
83.74
FEMALES / 100 MALES
35.0
MEDIAN AGE
3.6
AVG FAMILY SIZE
3.4
AVG HOUSEHOLD SIZE
$45,453
PER CAPITA INCOME
$131,500
AVG FAMILY INCOME
$128,302
AVG HOUSEHOLD INCOME
10.0%
WAGE / INCOME GAP [ % ]
90.0¢/ $1
WAGE / INCOME GAP [ $ ]
0.35
INEQUALITY / GINI INDEX
9,726
LABOR FORCE [ PEOPLE ]
70.8%
PERCENT IN LABOR FORCE
4.0%
UNEMPLOYMENT RATE
Farmingville Zip Codes
Farmingville Area Codes
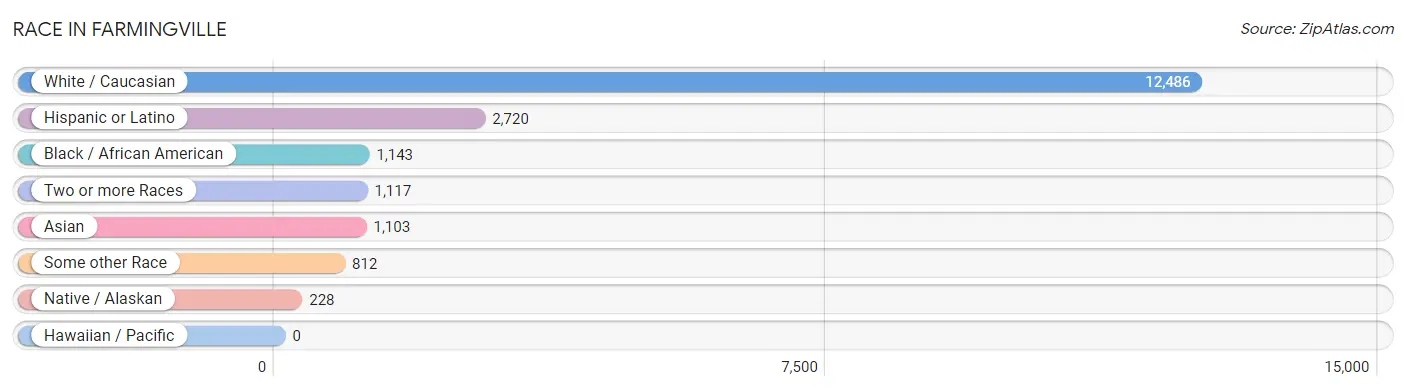
Race in Farmingville
The most populous races in Farmingville are White / Caucasian (12,486 | 73.9%), Hispanic or Latino (2,720 | 16.1%), and Black / African American (1,143 | 6.8%).
| Race | # Population | % Population |
| Asian | 1,103 | 6.5% |
| Black / African American | 1,143 | 6.8% |
| Hawaiian / Pacific | 0 | 0.0% |
| Hispanic or Latino | 2,720 | 16.1% |
| Native / Alaskan | 228 | 1.3% |
| White / Caucasian | 12,486 | 73.9% |
| Two or more Races | 1,117 | 6.6% |
| Some other Race | 812 | 4.8% |
| Total | 16,889 | 100.0% |
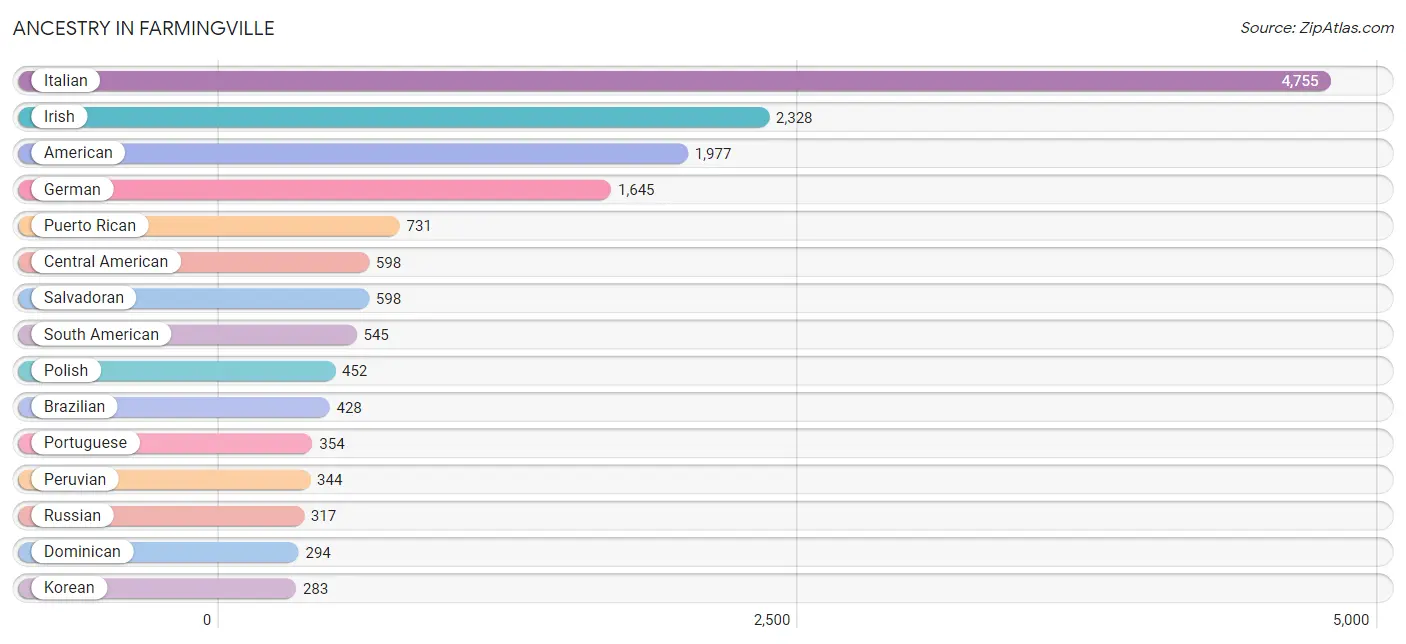
Ancestry in Farmingville
The most populous ancestries reported in Farmingville are Italian (4,755 | 28.1%), Irish (2,328 | 13.8%), American (1,977 | 11.7%), German (1,645 | 9.7%), and Puerto Rican (731 | 4.3%), together accounting for 67.7% of all Farmingville residents.
| Ancestry | # Population | % Population |
| African | 15 | 0.1% |
| Albanian | 28 | 0.2% |
| American | 1,977 | 11.7% |
| Arab | 13 | 0.1% |
| Armenian | 13 | 0.1% |
| Austrian | 7 | 0.0% |
| Bhutanese | 42 | 0.3% |
| Bolivian | 81 | 0.5% |
| Brazilian | 428 | 2.5% |
| British | 24 | 0.1% |
| Burmese | 14 | 0.1% |
| Canadian | 63 | 0.4% |
| Central American | 598 | 3.5% |
| Central American Indian | 21 | 0.1% |
| Colombian | 35 | 0.2% |
| Croatian | 23 | 0.1% |
| Czech | 15 | 0.1% |
| Czechoslovakian | 61 | 0.4% |
| Dominican | 294 | 1.7% |
| Dutch | 10 | 0.1% |
| Eastern European | 25 | 0.2% |
| Ecuadorian | 85 | 0.5% |
| English | 254 | 1.5% |
| Estonian | 22 | 0.1% |
| European | 14 | 0.1% |
| Finnish | 13 | 0.1% |
| French | 96 | 0.6% |
| French Canadian | 34 | 0.2% |
| German | 1,645 | 9.7% |
| Greek | 229 | 1.4% |
| Guyanese | 99 | 0.6% |
| Haitian | 215 | 1.3% |
| Indian (Asian) | 102 | 0.6% |
| Indonesian | 52 | 0.3% |
| Irish | 2,328 | 13.8% |
| Iroquois | 16 | 0.1% |
| Italian | 4,755 | 28.1% |
| Jamaican | 7 | 0.0% |
| Korean | 283 | 1.7% |
| Laotian | 49 | 0.3% |
| Latvian | 24 | 0.1% |
| Lithuanian | 25 | 0.2% |
| Luxembourger | 16 | 0.1% |
| Malaysian | 27 | 0.2% |
| Maltese | 12 | 0.1% |
| Mexican | 207 | 1.2% |
| Mexican American Indian | 207 | 1.2% |
| Norwegian | 33 | 0.2% |
| Peruvian | 344 | 2.0% |
| Polish | 452 | 2.7% |
| Portuguese | 354 | 2.1% |
| Puerto Rican | 731 | 4.3% |
| Romanian | 11 | 0.1% |
| Russian | 317 | 1.9% |
| Salvadoran | 598 | 3.5% |
| Scandinavian | 175 | 1.0% |
| Scotch-Irish | 59 | 0.4% |
| Scottish | 280 | 1.7% |
| Slovak | 44 | 0.3% |
| South American | 545 | 3.2% |
| Spaniard | 239 | 1.4% |
| Sri Lankan | 10 | 0.1% |
| Subsaharan African | 15 | 0.1% |
| Swedish | 29 | 0.2% |
| Syrian | 13 | 0.1% |
| Thai | 220 | 1.3% |
| Turkish | 207 | 1.2% |
| Ukrainian | 74 | 0.4% |
| Vietnamese | 38 | 0.2% | View All 69 Rows |
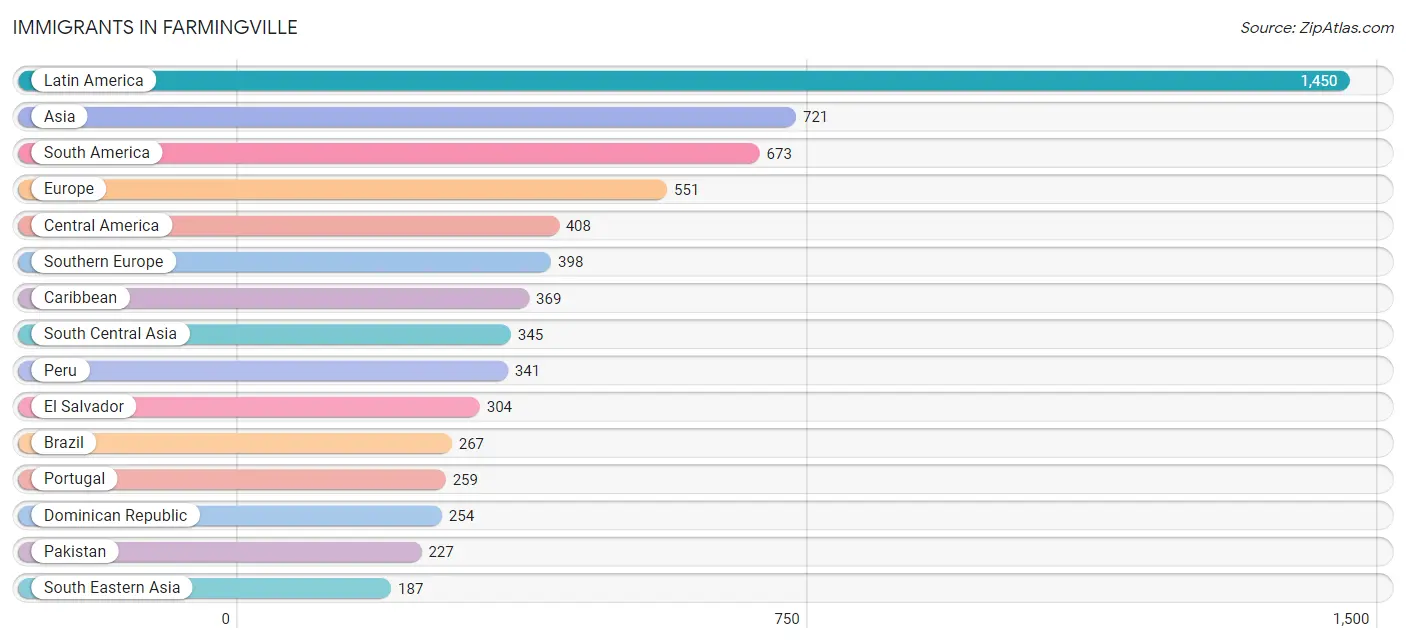
Immigrants in Farmingville
The most numerous immigrant groups reported in Farmingville came from Latin America (1,450 | 8.6%), Asia (721 | 4.3%), South America (673 | 4.0%), Europe (551 | 3.3%), and Central America (408 | 2.4%), together accounting for 22.5% of all Farmingville residents.
| Immigration Origin | # Population | % Population |
| Afghanistan | 10 | 0.1% |
| Africa | 98 | 0.6% |
| Argentina | 19 | 0.1% |
| Asia | 721 | 4.3% |
| Bangladesh | 64 | 0.4% |
| Brazil | 267 | 1.6% |
| Caribbean | 369 | 2.2% |
| Central America | 408 | 2.4% |
| Chile | 3 | 0.0% |
| China | 26 | 0.2% |
| Colombia | 14 | 0.1% |
| Croatia | 23 | 0.1% |
| Cuba | 16 | 0.1% |
| Czechoslovakia | 13 | 0.1% |
| Dominican Republic | 254 | 1.5% |
| Eastern Asia | 77 | 0.5% |
| Eastern Europe | 49 | 0.3% |
| Ecuador | 12 | 0.1% |
| El Salvador | 304 | 1.8% |
| England | 63 | 0.4% |
| Europe | 551 | 3.3% |
| Guatemala | 17 | 0.1% |
| Guyana | 17 | 0.1% |
| Haiti | 75 | 0.4% |
| Honduras | 3 | 0.0% |
| India | 44 | 0.3% |
| Israel | 3 | 0.0% |
| Italy | 44 | 0.3% |
| Japan | 1 | 0.0% |
| Korea | 50 | 0.3% |
| Laos | 9 | 0.1% |
| Latin America | 1,450 | 8.6% |
| Liberia | 11 | 0.1% |
| Lithuania | 9 | 0.1% |
| Mexico | 84 | 0.5% |
| Northern Europe | 104 | 0.6% |
| Pakistan | 227 | 1.3% |
| Peru | 341 | 2.0% |
| Philippines | 141 | 0.8% |
| Poland | 4 | 0.0% |
| Portugal | 259 | 1.5% |
| Scotland | 3 | 0.0% |
| South America | 673 | 4.0% |
| South Central Asia | 345 | 2.0% |
| South Eastern Asia | 187 | 1.1% |
| Southern Europe | 398 | 2.4% |
| Spain | 95 | 0.6% |
| St. Vincent and the Grenadines | 12 | 0.1% |
| Trinidad and Tobago | 12 | 0.1% |
| Turkey | 109 | 0.6% |
| Vietnam | 19 | 0.1% |
| Western Africa | 26 | 0.2% |
| Western Asia | 112 | 0.7% | View All 53 Rows |
Sex and Age in Farmingville
Sex and Age in Farmingville
The most populous age groups in Farmingville are 30 to 34 Years (970 | 10.5%) for men and 45 to 49 Years (810 | 10.5%) for women.
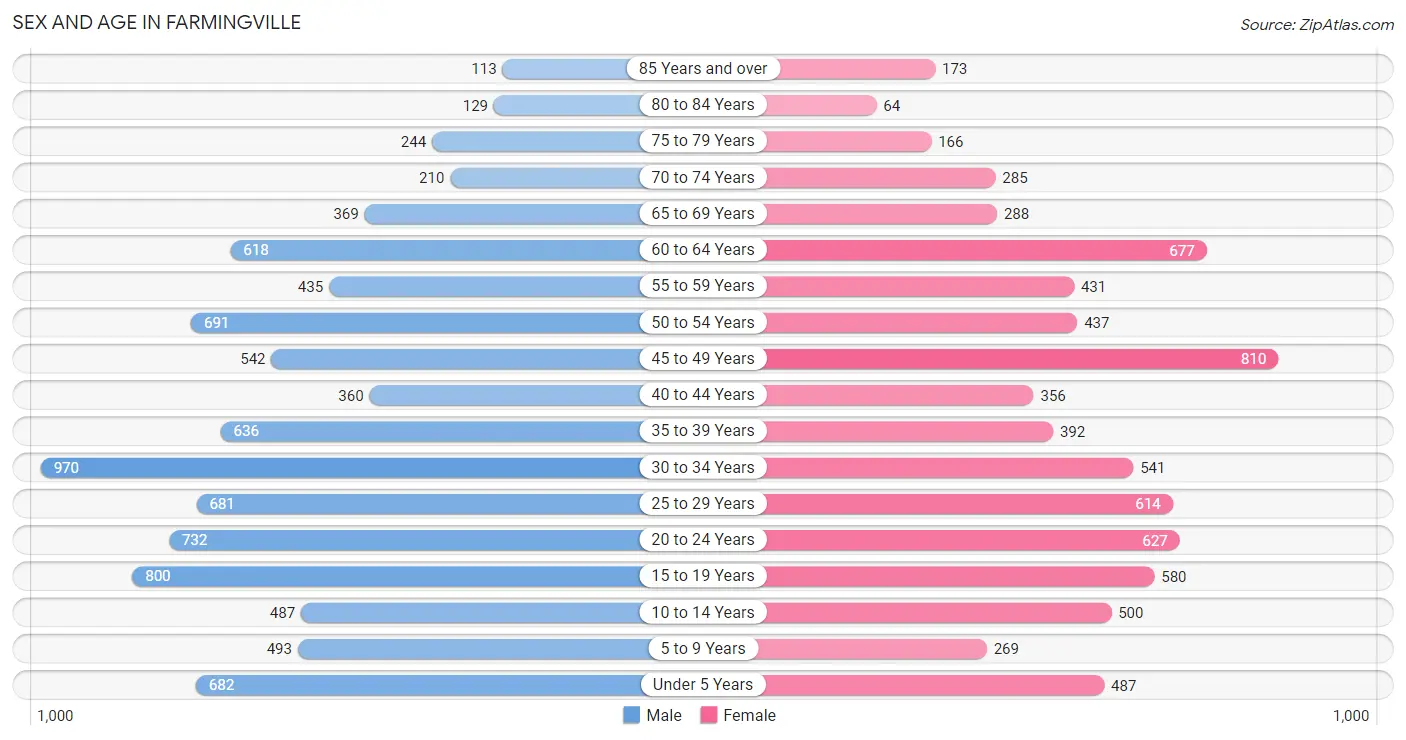
| Age Bracket | Male | Female |
| Under 5 Years | 682 (7.4%) | 487 (6.3%) |
| 5 to 9 Years | 493 (5.4%) | 269 (3.5%) |
| 10 to 14 Years | 487 (5.3%) | 500 (6.5%) |
| 15 to 19 Years | 800 (8.7%) | 580 (7.5%) |
| 20 to 24 Years | 732 (8.0%) | 627 (8.2%) |
| 25 to 29 Years | 681 (7.4%) | 614 (8.0%) |
| 30 to 34 Years | 970 (10.5%) | 541 (7.0%) |
| 35 to 39 Years | 636 (6.9%) | 392 (5.1%) |
| 40 to 44 Years | 360 (3.9%) | 356 (4.6%) |
| 45 to 49 Years | 542 (5.9%) | 810 (10.5%) |
| 50 to 54 Years | 691 (7.5%) | 437 (5.7%) |
| 55 to 59 Years | 435 (4.7%) | 431 (5.6%) |
| 60 to 64 Years | 618 (6.7%) | 677 (8.8%) |
| 65 to 69 Years | 369 (4.0%) | 288 (3.7%) |
| 70 to 74 Years | 210 (2.3%) | 285 (3.7%) |
| 75 to 79 Years | 244 (2.6%) | 166 (2.2%) |
| 80 to 84 Years | 129 (1.4%) | 64 (0.8%) |
| 85 Years and over | 113 (1.2%) | 173 (2.2%) |
| Total | 9,192 (100.0%) | 7,697 (100.0%) |
Families and Households in Farmingville
Median Family Size in Farmingville
The median family size in Farmingville is 3.62 persons per family, with single female/mother families (576 | 14.1%) accounting for the largest median family size of 3.98 persons per family. On the other hand, single male/father families (472 | 11.6%) represent the smallest median family size with 2.49 persons per family.
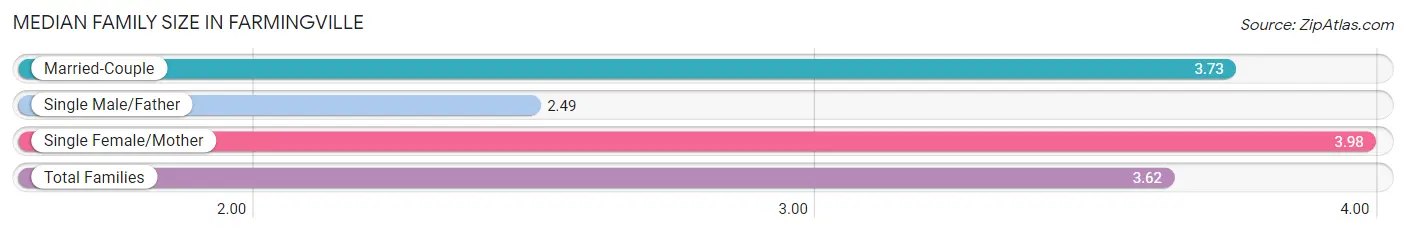
| Family Type | # Families | Family Size |
| Married-Couple | 3,038 (74.4%) | 3.73 |
| Single Male/Father | 472 (11.6%) | 2.49 |
| Single Female/Mother | 576 (14.1%) | 3.98 |
| Total Families | 4,086 (100.0%) | 3.62 |
Median Household Size in Farmingville
The median household size in Farmingville is 3.41 persons per household, with single female/mother households (576 | 11.8%) accounting for the largest median household size of 4.31 persons per household. non-family households (803 | 16.4%) represent the smallest median household size with 1.35 persons per household.
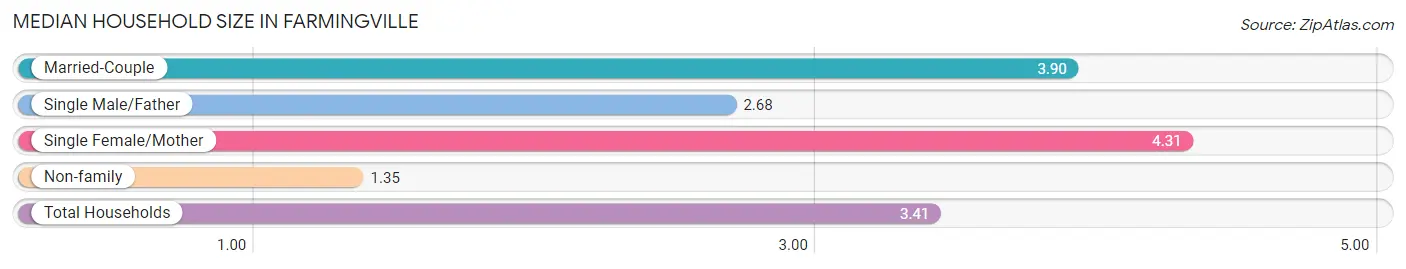
| Household Type | # Households | Household Size |
| Married-Couple | 3,038 (62.1%) | 3.90 |
| Single Male/Father | 472 (9.7%) | 2.68 |
| Single Female/Mother | 576 (11.8%) | 4.31 |
| Non-family | 803 (16.4%) | 1.35 |
| Total Households | 4,889 (100.0%) | 3.41 |
Household Size by Marriage Status in Farmingville
Out of a total of 4,889 households in Farmingville, 4,086 (83.6%) are family households, while 803 (16.4%) are nonfamily households. The most numerous type of family households are 4-person households, comprising 1,216, and the most common type of nonfamily households are 1-person households, comprising 586.
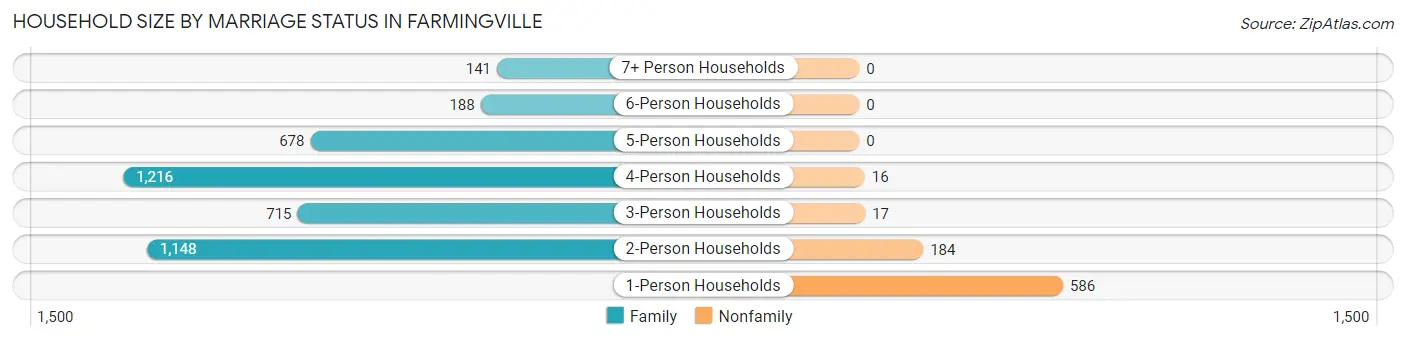
| Household Size | Family Households | Nonfamily Households |
| 1-Person Households | - | 586 (12.0%) |
| 2-Person Households | 1,148 (23.5%) | 184 (3.8%) |
| 3-Person Households | 715 (14.6%) | 17 (0.4%) |
| 4-Person Households | 1,216 (24.9%) | 16 (0.3%) |
| 5-Person Households | 678 (13.9%) | 0 (0.0%) |
| 6-Person Households | 188 (3.8%) | 0 (0.0%) |
| 7+ Person Households | 141 (2.9%) | 0 (0.0%) |
| Total | 4,086 (83.6%) | 803 (16.4%) |
Female Fertility in Farmingville
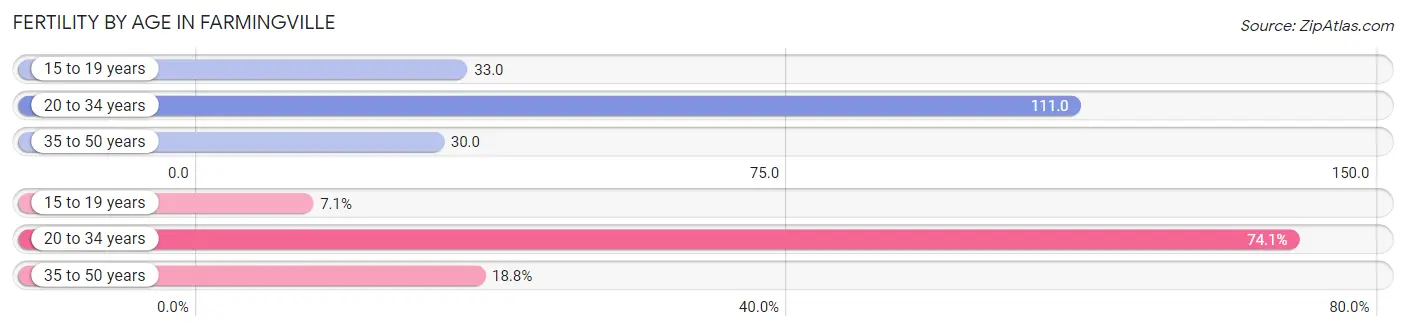
Fertility by Age in Farmingville
Average fertility rate in Farmingville is 66.0 births per 1,000 women. Women in the age bracket of 20 to 34 years have the highest fertility rate with 111.0 births per 1,000 women. Women in the age bracket of 20 to 34 years acount for 74.1% of all women with births.
| Age Bracket | Women with Births | Births / 1,000 Women |
| 15 to 19 years | 19 (7.1%) | 33.0 |
| 20 to 34 years | 197 (74.1%) | 111.0 |
| 35 to 50 years | 50 (18.8%) | 30.0 |
| Total | 266 (100.0%) | 66.0 |
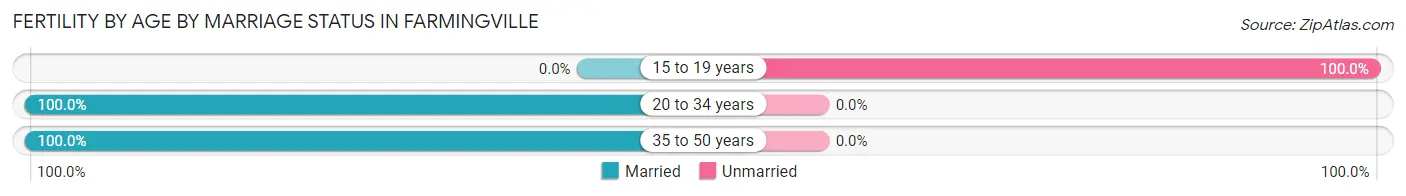
Fertility by Age by Marriage Status in Farmingville
92.9% of women with births (266) in Farmingville are married. The highest percentage of unmarried women with births falls into 15 to 19 years age bracket with 100.0% of them unmarried at the time of birth, while the lowest percentage of unmarried women with births belong to 20 to 34 years age bracket with 0.0% of them unmarried.
| Age Bracket | Married | Unmarried |
| 15 to 19 years | 0 (0.0%) | 19 (100.0%) |
| 20 to 34 years | 197 (100.0%) | 0 (0.0%) |
| 35 to 50 years | 50 (100.0%) | 0 (0.0%) |
| Total | 247 (92.9%) | 19 (7.1%) |
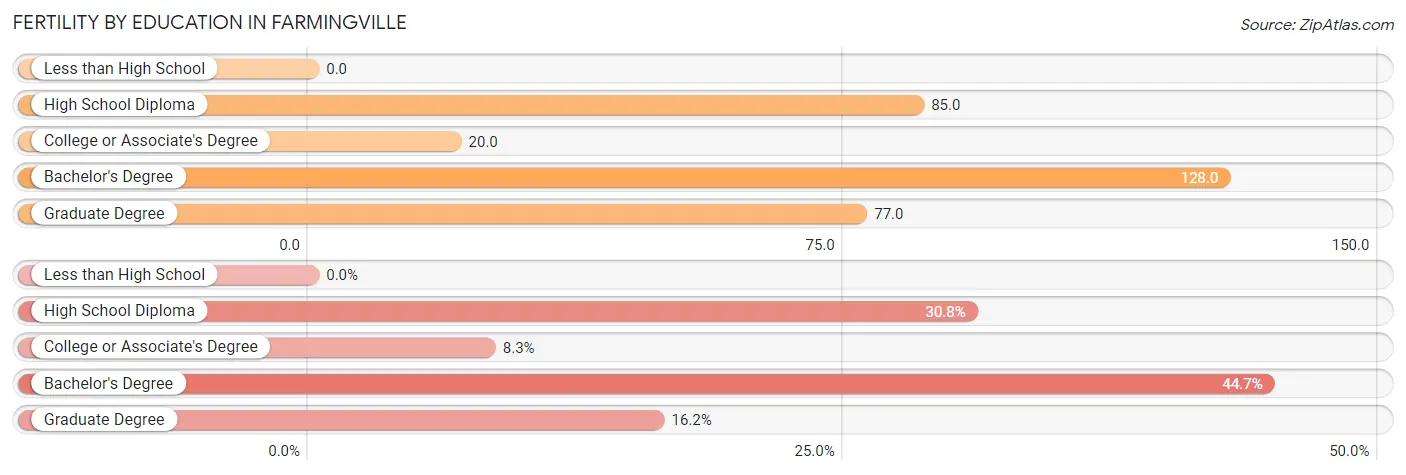
Fertility by Education in Farmingville
| Educational Attainment | Women with Births | Births / 1,000 Women |
| Less than High School | 0 (0.0%) | 0.0 |
| High School Diploma | 82 (30.8%) | 85.0 |
| College or Associate's Degree | 22 (8.3%) | 20.0 |
| Bachelor's Degree | 119 (44.7%) | 128.0 |
| Graduate Degree | 43 (16.2%) | 77.0 |
| Total | 266 (100.0%) | 66.0 |
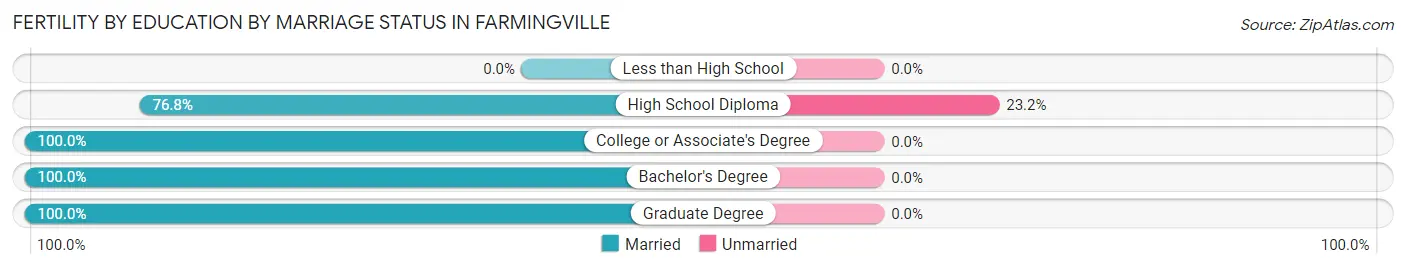
Fertility by Education by Marriage Status in Farmingville
7.1% of women with births in Farmingville are unmarried. Women with the educational attainment of college or associate's degree are most likely to be married with 100.0% of them married at childbirth, while women with the educational attainment of high school diploma are least likely to be married with 23.2% of them unmarried at childbirth.
| Educational Attainment | Married | Unmarried |
| Less than High School | 0 (0.0%) | 0 (0.0%) |
| High School Diploma | 63 (76.8%) | 19 (23.2%) |
| College or Associate's Degree | 22 (100.0%) | 0 (0.0%) |
| Bachelor's Degree | 119 (100.0%) | 0 (0.0%) |
| Graduate Degree | 43 (100.0%) | 0 (0.0%) |
| Total | 247 (92.9%) | 19 (7.1%) |
Income in Farmingville
Income Overview in Farmingville
Per Capita Income in Farmingville is $45,453, while median incomes of families and households are $131,500 and $128,302 respectively.
| Characteristic | Number | Measure |
| Per Capita Income | 16,889 | $45,453 |
| Median Family Income | 4,086 | $131,500 |
| Mean Family Income | 4,086 | $156,486 |
| Median Household Income | 4,889 | $128,302 |
| Mean Household Income | 4,889 | $152,424 |
| Income Deficit | 4,086 | $0 |
| Wage / Income Gap (%) | 16,889 | 10.04% |
| Wage / Income Gap ($) | 16,889 | 89.96¢ per $1 |
| Gini / Inequality Index | 16,889 | 0.35 |
Earnings by Sex in Farmingville
Average Earnings in Farmingville are $52,379, $56,377 for men and $50,714 for women, a difference of 10.0%.
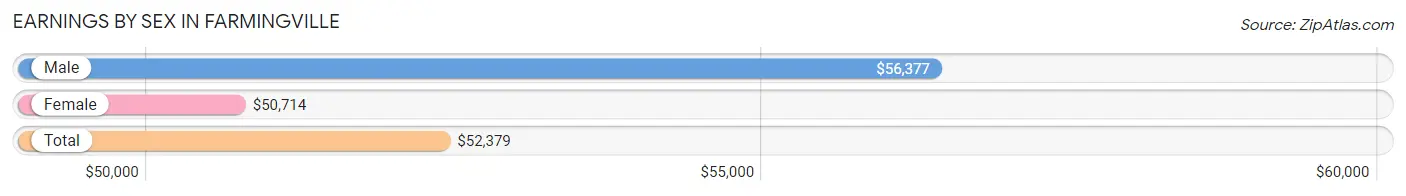
| Sex | Number | Average Earnings |
| Male | 5,704 (56.8%) | $56,377 |
| Female | 4,342 (43.2%) | $50,714 |
| Total | 10,046 (100.0%) | $52,379 |
Earnings by Sex by Income Bracket in Farmingville
The most common earnings brackets in Farmingville are $100,000+ for men (1,580 | 27.7%) and $100,000+ for women (781 | 18.0%).
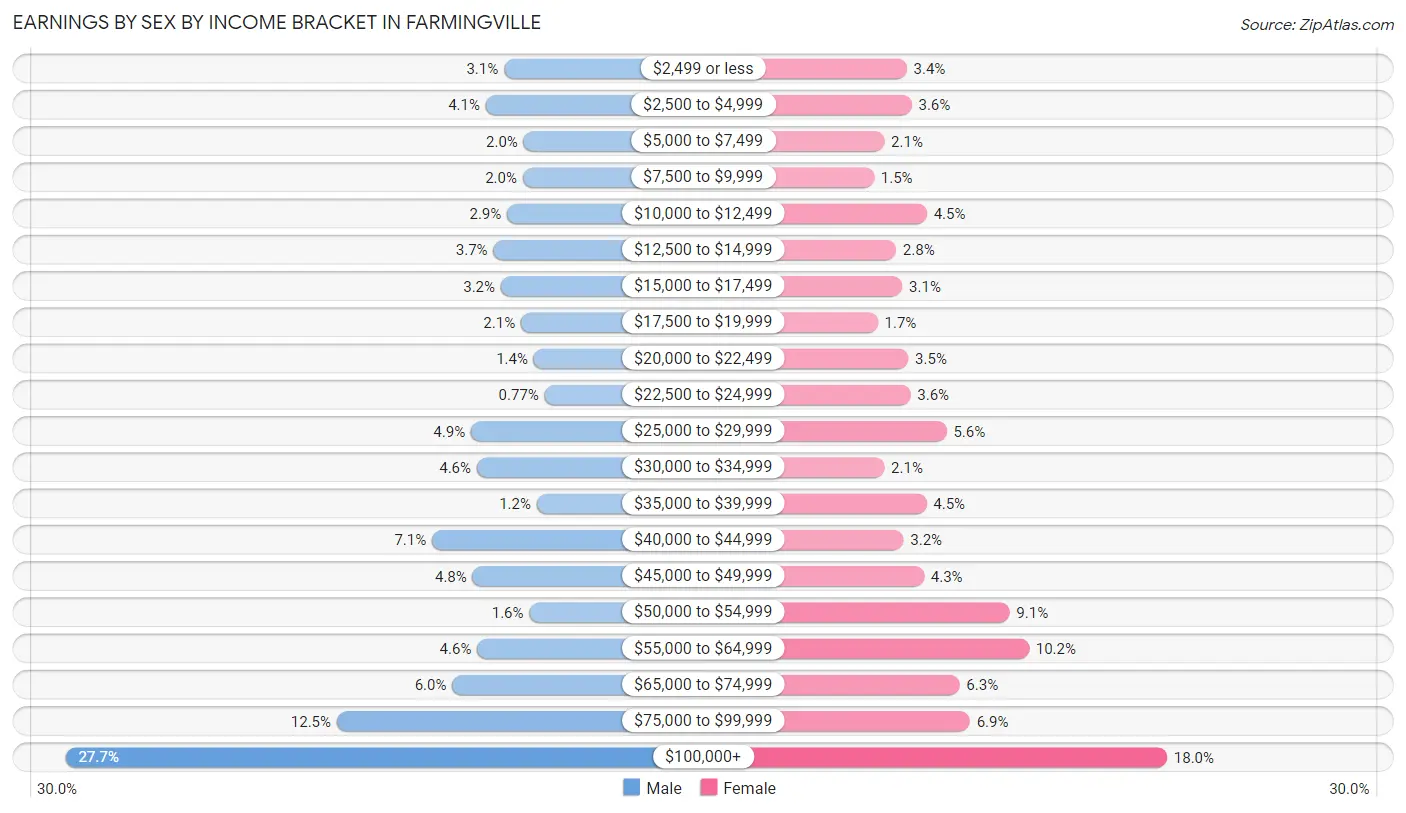
| Income | Male | Female |
| $2,499 or less | 174 (3.0%) | 146 (3.4%) |
| $2,500 to $4,999 | 233 (4.1%) | 158 (3.6%) |
| $5,000 to $7,499 | 111 (1.9%) | 91 (2.1%) |
| $7,500 to $9,999 | 114 (2.0%) | 66 (1.5%) |
| $10,000 to $12,499 | 164 (2.9%) | 195 (4.5%) |
| $12,500 to $14,999 | 208 (3.6%) | 120 (2.8%) |
| $15,000 to $17,499 | 184 (3.2%) | 135 (3.1%) |
| $17,500 to $19,999 | 120 (2.1%) | 75 (1.7%) |
| $20,000 to $22,499 | 79 (1.4%) | 150 (3.5%) |
| $22,500 to $24,999 | 44 (0.8%) | 155 (3.6%) |
| $25,000 to $29,999 | 280 (4.9%) | 243 (5.6%) |
| $30,000 to $34,999 | 261 (4.6%) | 91 (2.1%) |
| $35,000 to $39,999 | 69 (1.2%) | 194 (4.5%) |
| $40,000 to $44,999 | 405 (7.1%) | 138 (3.2%) |
| $45,000 to $49,999 | 275 (4.8%) | 188 (4.3%) |
| $50,000 to $54,999 | 93 (1.6%) | 397 (9.1%) |
| $55,000 to $64,999 | 260 (4.6%) | 444 (10.2%) |
| $65,000 to $74,999 | 340 (6.0%) | 275 (6.3%) |
| $75,000 to $99,999 | 710 (12.4%) | 300 (6.9%) |
| $100,000+ | 1,580 (27.7%) | 781 (18.0%) |
| Total | 5,704 (100.0%) | 4,342 (100.0%) |
Earnings by Sex by Educational Attainment in Farmingville
Average earnings in Farmingville are $73,030 for men and $54,543 for women, a difference of 25.3%. Men with an educational attainment of high school diploma enjoy the highest average annual earnings of $98,333, while those with less than high school education earn the least with $29,006. Women with an educational attainment of bachelor's degree earn the most with the average annual earnings of $75,441, while those with high school diploma education have the smallest earnings of $45,234.
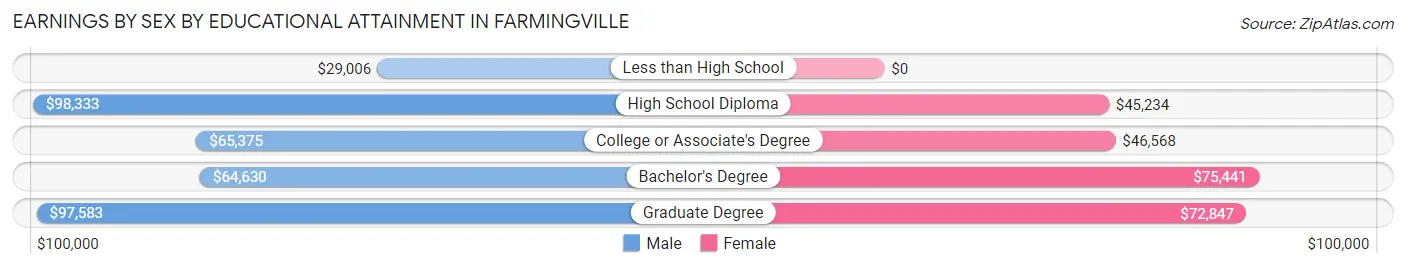
| Educational Attainment | Male Income | Female Income |
| Less than High School | $29,006 | $0 |
| High School Diploma | $98,333 | $45,234 |
| College or Associate's Degree | $65,375 | $46,568 |
| Bachelor's Degree | $64,630 | $75,441 |
| Graduate Degree | $97,583 | $72,847 |
| Total | $73,030 | $54,543 |
Family Income in Farmingville
Family Income Brackets in Farmingville
According to the Farmingville family income data, there are 1,136 families falling into the $100,000 to $149,999 income range, which is the most common income bracket and makes up 27.8% of all families.
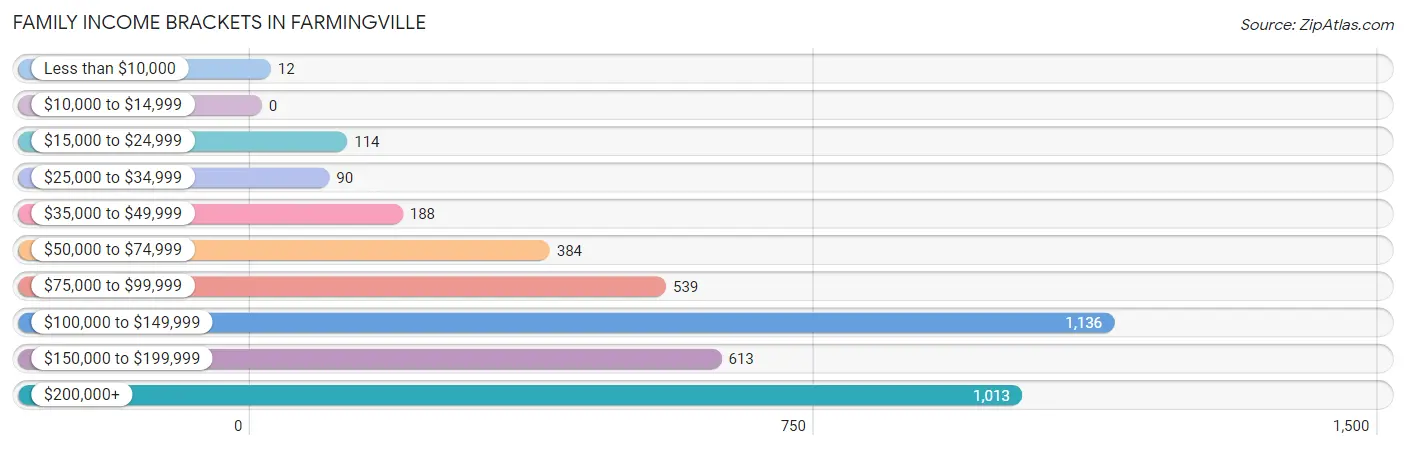
| Income Bracket | # Families | % Families |
| Less than $10,000 | 12 | 0.3% |
| $10,000 to $14,999 | 0 | 0.0% |
| $15,000 to $24,999 | 114 | 2.8% |
| $25,000 to $34,999 | 90 | 2.2% |
| $35,000 to $49,999 | 188 | 4.6% |
| $50,000 to $74,999 | 384 | 9.4% |
| $75,000 to $99,999 | 539 | 13.2% |
| $100,000 to $149,999 | 1,136 | 27.8% |
| $150,000 to $199,999 | 613 | 15.0% |
| $200,000+ | 1,013 | 24.8% |
Family Income by Famaliy Size in Farmingville
6-person families (144 | 3.5%) account for the highest median family income in Farmingville with $250,001 per family, while 2-person families (1,198 | 29.3%) have the highest median income of $47,322 per family member.
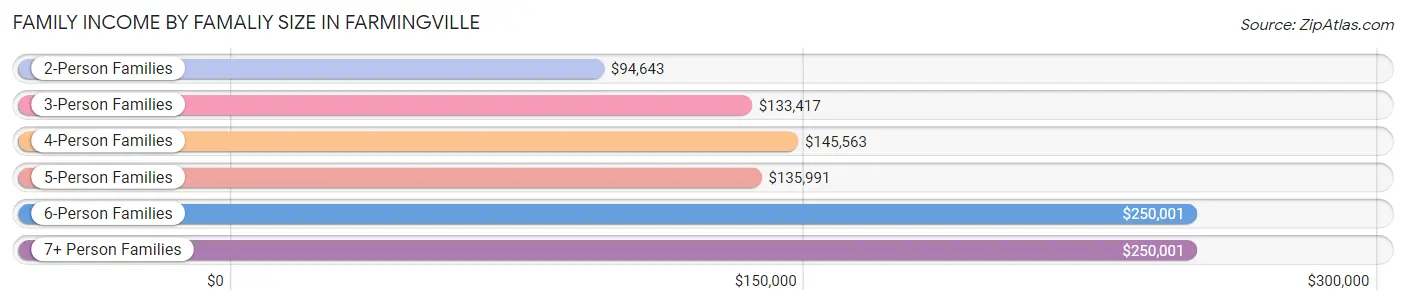
| Income Bracket | # Families | Median Income |
| 2-Person Families | 1,198 (29.3%) | $94,643 |
| 3-Person Families | 823 (20.1%) | $133,417 |
| 4-Person Families | 1,294 (31.7%) | $145,563 |
| 5-Person Families | 538 (13.2%) | $135,991 |
| 6-Person Families | 144 (3.5%) | $250,001 |
| 7+ Person Families | 89 (2.2%) | $250,001 |
| Total | 4,086 (100.0%) | $131,500 |
Family Income by Number of Earners in Farmingville
The median family income in Farmingville is $131,500, with families comprising 3+ earners (1,236) having the highest median family income of $179,148, while families with no earners (367) have the lowest median family income of $91,250, accounting for 30.2% and 9.0% of families, respectively.
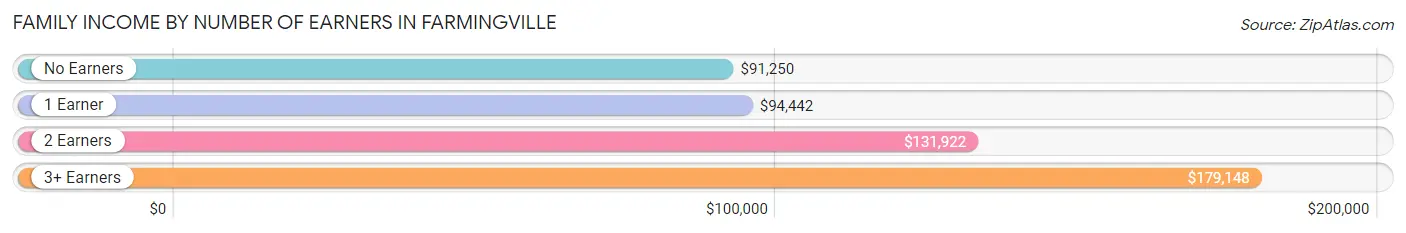
| Number of Earners | # Families | Median Income |
| No Earners | 367 (9.0%) | $91,250 |
| 1 Earner | 944 (23.1%) | $94,442 |
| 2 Earners | 1,539 (37.7%) | $131,922 |
| 3+ Earners | 1,236 (30.2%) | $179,148 |
| Total | 4,086 (100.0%) | $131,500 |
Household Income in Farmingville
Household Income Brackets in Farmingville
With 1,388 households falling in the category, the $100,000 to $149,999 income range is the most frequent in Farmingville, accounting for 28.4% of all households.
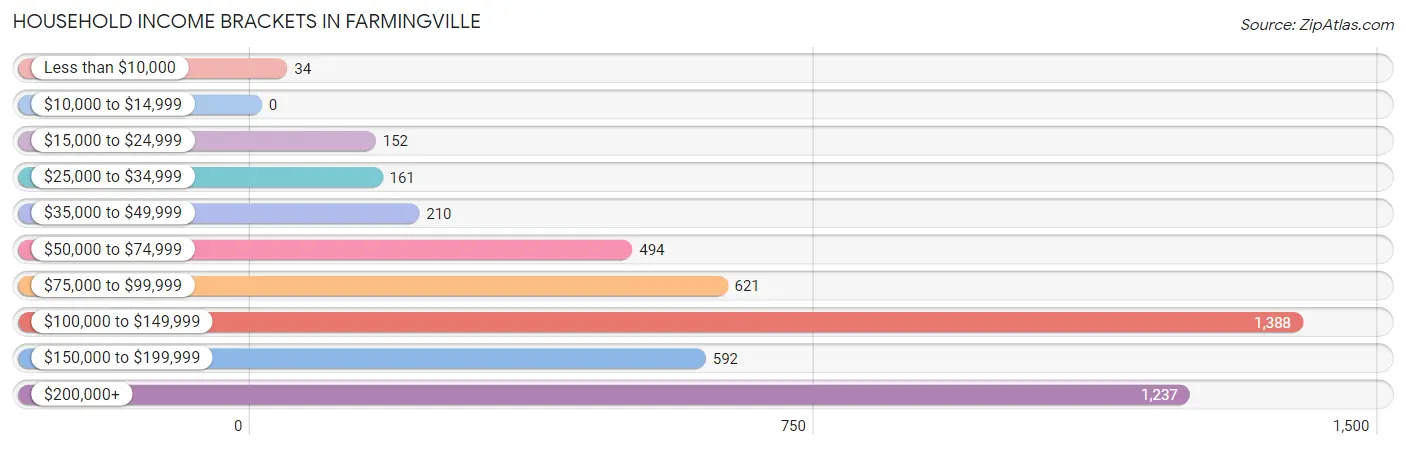
| Income Bracket | # Households | % Households |
| Less than $10,000 | 34 | 0.7% |
| $10,000 to $14,999 | 0 | 0.0% |
| $15,000 to $24,999 | 152 | 3.1% |
| $25,000 to $34,999 | 161 | 3.3% |
| $35,000 to $49,999 | 210 | 4.3% |
| $50,000 to $74,999 | 494 | 10.1% |
| $75,000 to $99,999 | 621 | 12.7% |
| $100,000 to $149,999 | 1,388 | 28.4% |
| $150,000 to $199,999 | 592 | 12.1% |
| $200,000+ | 1,237 | 25.3% |
Household Income by Householder Age in Farmingville
The median household income in Farmingville is $128,302, with the highest median household income of $142,336 found in the 45 to 64 years age bracket for the primary householder. A total of 2,439 households (49.9%) fall into this category. Meanwhile, the 15 to 24 years age bracket for the primary householder has the lowest median household income of $0, with 78 households (1.6%) in this group.
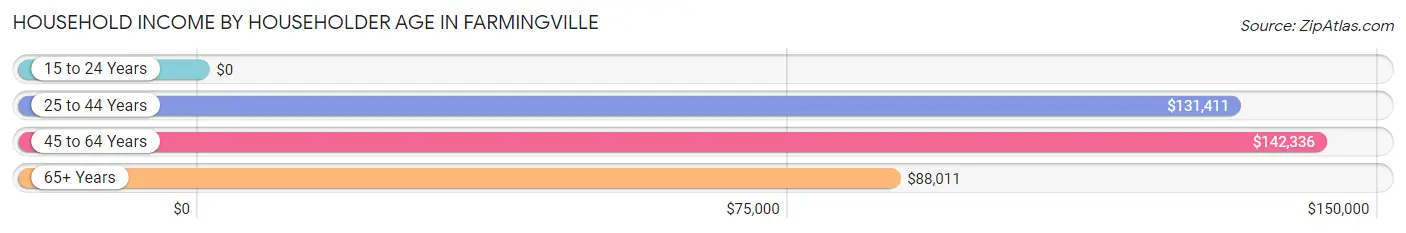
| Income Bracket | # Households | Median Income |
| 15 to 24 Years | 78 (1.6%) | $0 |
| 25 to 44 Years | 1,447 (29.6%) | $131,411 |
| 45 to 64 Years | 2,439 (49.9%) | $142,336 |
| 65+ Years | 925 (18.9%) | $88,011 |
| Total | 4,889 (100.0%) | $128,302 |
Poverty in Farmingville
Income Below Poverty by Sex and Age in Farmingville
With 4.4% poverty level for males and 5.3% for females among the residents of Farmingville, 16 and 17 year old males and 5 year old females are the most vulnerable to poverty, with 58 males (15.3%) and 8 females (20.0%) in their respective age groups living below the poverty level.
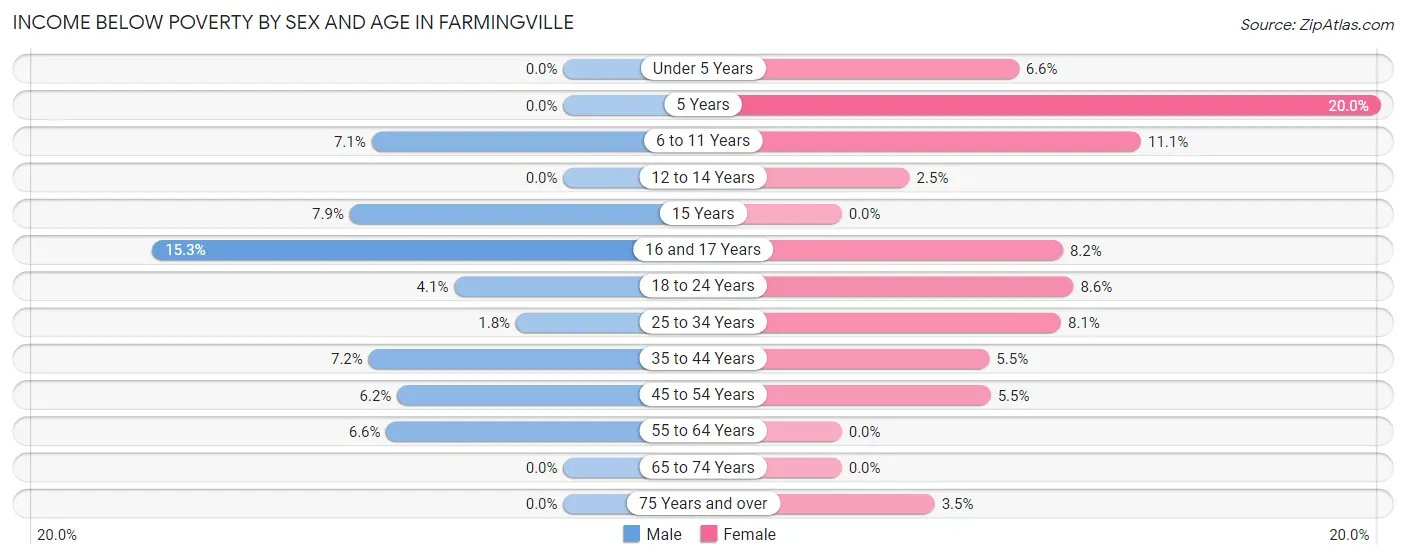
| Age Bracket | Male | Female |
| Under 5 Years | 0 (0.0%) | 32 (6.6%) |
| 5 Years | 0 (0.0%) | 8 (20.0%) |
| 6 to 11 Years | 28 (7.1%) | 45 (11.1%) |
| 12 to 14 Years | 0 (0.0%) | 8 (2.5%) |
| 15 Years | 13 (7.9%) | 0 (0.0%) |
| 16 and 17 Years | 58 (15.3%) | 16 (8.2%) |
| 18 to 24 Years | 40 (4.1%) | 81 (8.6%) |
| 25 to 34 Years | 29 (1.8%) | 94 (8.1%) |
| 35 to 44 Years | 72 (7.2%) | 41 (5.5%) |
| 45 to 54 Years | 76 (6.2%) | 69 (5.5%) |
| 55 to 64 Years | 69 (6.6%) | 0 (0.0%) |
| 65 to 74 Years | 0 (0.0%) | 0 (0.0%) |
| 75 Years and over | 0 (0.0%) | 12 (3.5%) |
| Total | 385 (4.4%) | 406 (5.3%) |
Income Above Poverty by Sex and Age in Farmingville
According to the poverty statistics in Farmingville, males aged under 5 years and females aged 15 years are the age groups that are most secure financially, with 100.0% of males and 100.0% of females in these age groups living above the poverty line.
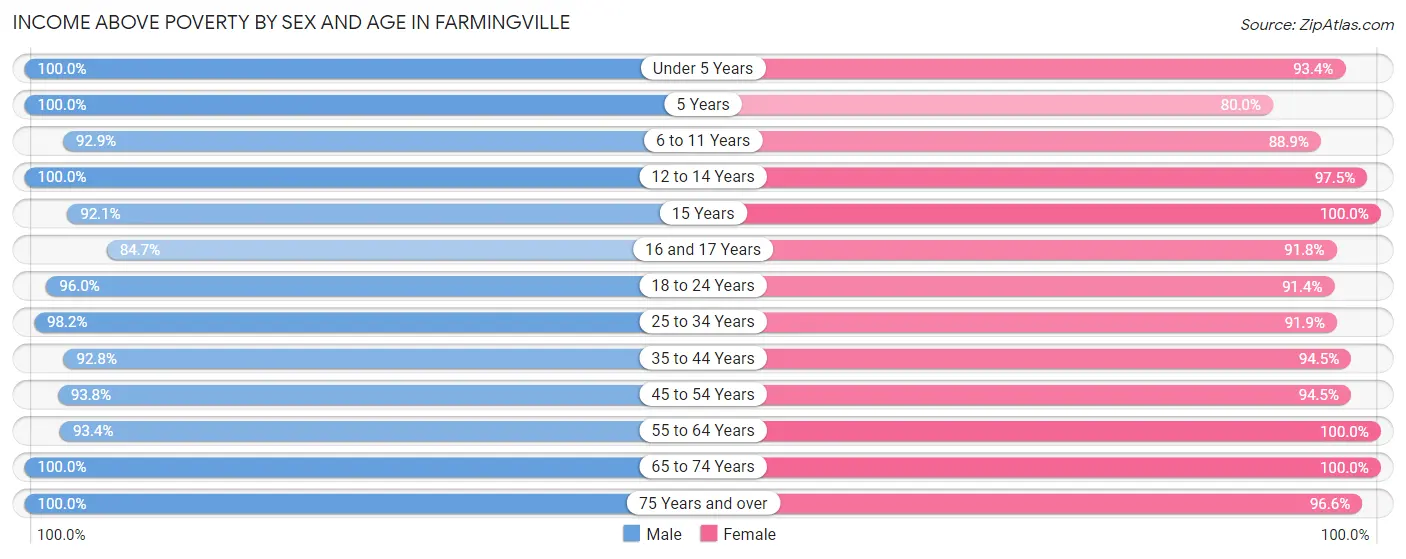
| Age Bracket | Male | Female |
| Under 5 Years | 581 (100.0%) | 455 (93.4%) |
| 5 Years | 141 (100.0%) | 32 (80.0%) |
| 6 to 11 Years | 365 (92.9%) | 360 (88.9%) |
| 12 to 14 Years | 255 (100.0%) | 309 (97.5%) |
| 15 Years | 151 (92.1%) | 70 (100.0%) |
| 16 and 17 Years | 322 (84.7%) | 179 (91.8%) |
| 18 to 24 Years | 948 (96.0%) | 861 (91.4%) |
| 25 to 34 Years | 1,622 (98.2%) | 1,061 (91.9%) |
| 35 to 44 Years | 924 (92.8%) | 707 (94.5%) |
| 45 to 54 Years | 1,155 (93.8%) | 1,178 (94.5%) |
| 55 to 64 Years | 981 (93.4%) | 1,105 (100.0%) |
| 65 to 74 Years | 575 (100.0%) | 560 (100.0%) |
| 75 Years and over | 417 (100.0%) | 336 (96.6%) |
| Total | 8,437 (95.6%) | 7,213 (94.7%) |
Income Below Poverty Among Married-Couple Families in Farmingville
The poverty statistics for married-couple families in Farmingville show that 3.9% or 119 of the total 3,038 families live below the poverty line. Families with 1 or 2 children have the highest poverty rate of 8.7%, comprising of 110 families. On the other hand, families with no children have the lowest poverty rate of 0.0%, which includes 0 families.
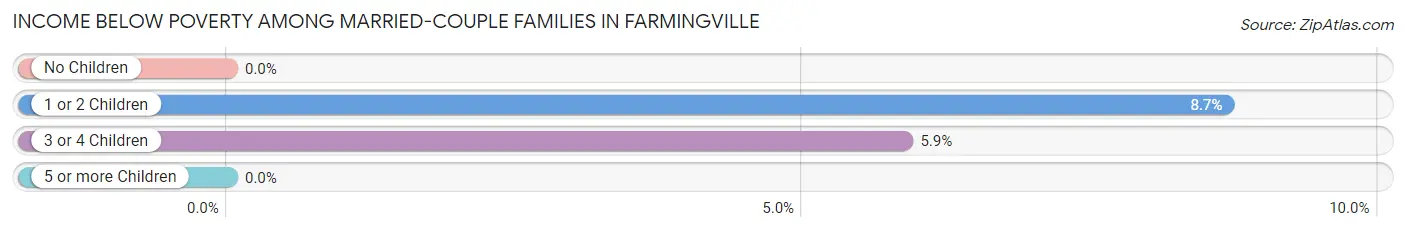
| Children | Above Poverty | Below Poverty |
| No Children | 1,596 (100.0%) | 0 (0.0%) |
| 1 or 2 Children | 1,159 (91.3%) | 110 (8.7%) |
| 3 or 4 Children | 144 (94.1%) | 9 (5.9%) |
| 5 or more Children | 20 (100.0%) | 0 (0.0%) |
| Total | 2,919 (96.1%) | 119 (3.9%) |
Income Below Poverty Among Single-Parent Households in Farmingville
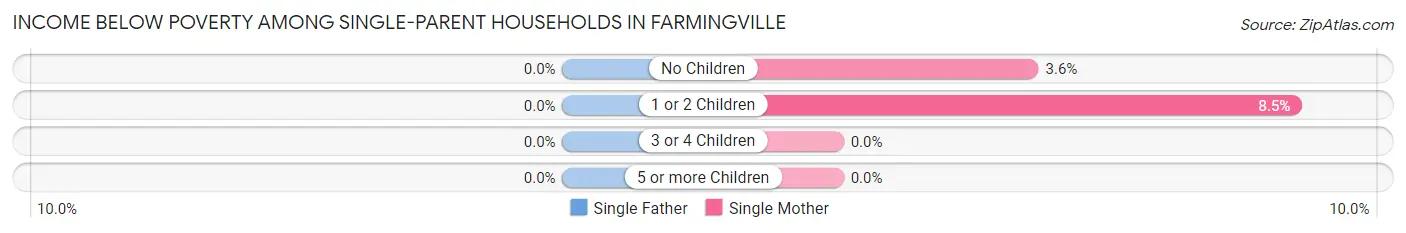
| Children | Single Father | Single Mother |
| No Children | 0 (0.0%) | 12 (3.6%) |
| 1 or 2 Children | 0 (0.0%) | 14 (8.5%) |
| 3 or 4 Children | 0 (0.0%) | 0 (0.0%) |
| 5 or more Children | 0 (0.0%) | 0 (0.0%) |
| Total | 0 (0.0%) | 26 (4.5%) |
Income Below Poverty Among Married-Couple vs Single-Parent Households in Farmingville
The poverty data for Farmingville shows that 119 of the married-couple family households (3.9%) and 26 of the single-parent households (2.5%) are living below the poverty level. Within the married-couple family households, those with 1 or 2 children have the highest poverty rate, with 110 households (8.7%) falling below the poverty line. Among the single-parent households, those with 1 or 2 children have the highest poverty rate, with 14 household (4.0%) living below poverty.
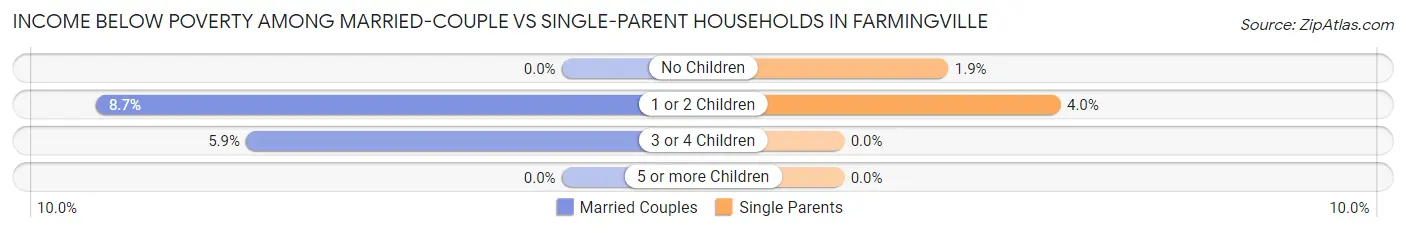
| Children | Married-Couple Families | Single-Parent Households |
| No Children | 0 (0.0%) | 12 (1.9%) |
| 1 or 2 Children | 110 (8.7%) | 14 (4.0%) |
| 3 or 4 Children | 9 (5.9%) | 0 (0.0%) |
| 5 or more Children | 0 (0.0%) | 0 (0.0%) |
| Total | 119 (3.9%) | 26 (2.5%) |
Employment Characteristics in Farmingville
Employment by Class of Employer in Farmingville
Among the 9,250 employed individuals in Farmingville, private company employees (6,501 | 70.3%), local government employees (1,065 | 11.5%), and not-for-profit organizations (540 | 5.8%) make up the most common classes of employment.
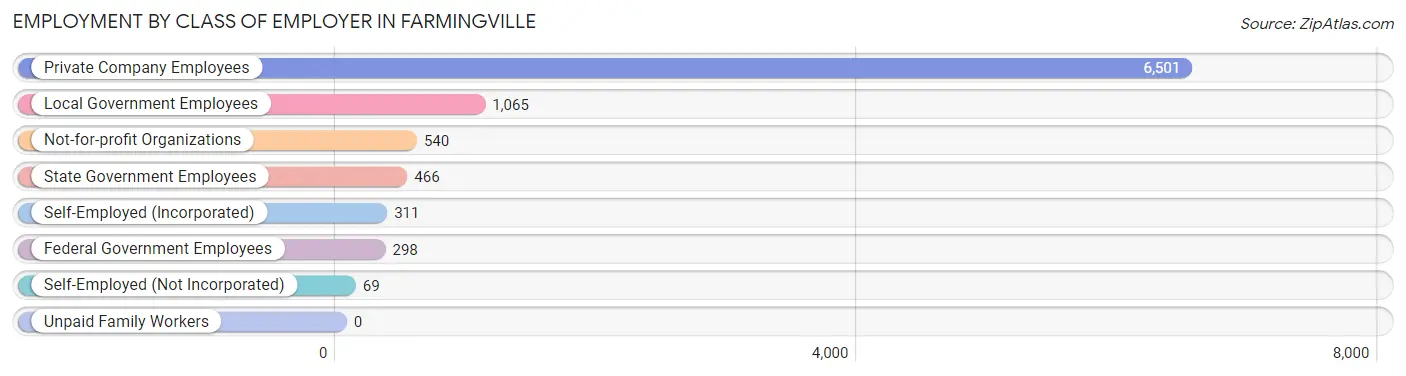
| Employer Class | # Employees | % Employees |
| Private Company Employees | 6,501 | 70.3% |
| Self-Employed (Incorporated) | 311 | 3.4% |
| Self-Employed (Not Incorporated) | 69 | 0.7% |
| Not-for-profit Organizations | 540 | 5.8% |
| Local Government Employees | 1,065 | 11.5% |
| State Government Employees | 466 | 5.0% |
| Federal Government Employees | 298 | 3.2% |
| Unpaid Family Workers | 0 | 0.0% |
| Total | 9,250 | 100.0% |
Employment Status by Age in Farmingville
According to the labor force statistics for Farmingville, out of the total population over 16 years of age (13,737), 70.8% or 9,726 individuals are in the labor force, with 4.0% or 389 of them unemployed. The age group with the highest labor force participation rate is 35 to 44 years, with 93.9% or 1,638 individuals in the labor force. Within the labor force, the 16 to 19 years age range has the highest percentage of unemployed individuals, with 22.0% or 100 of them being unemployed.
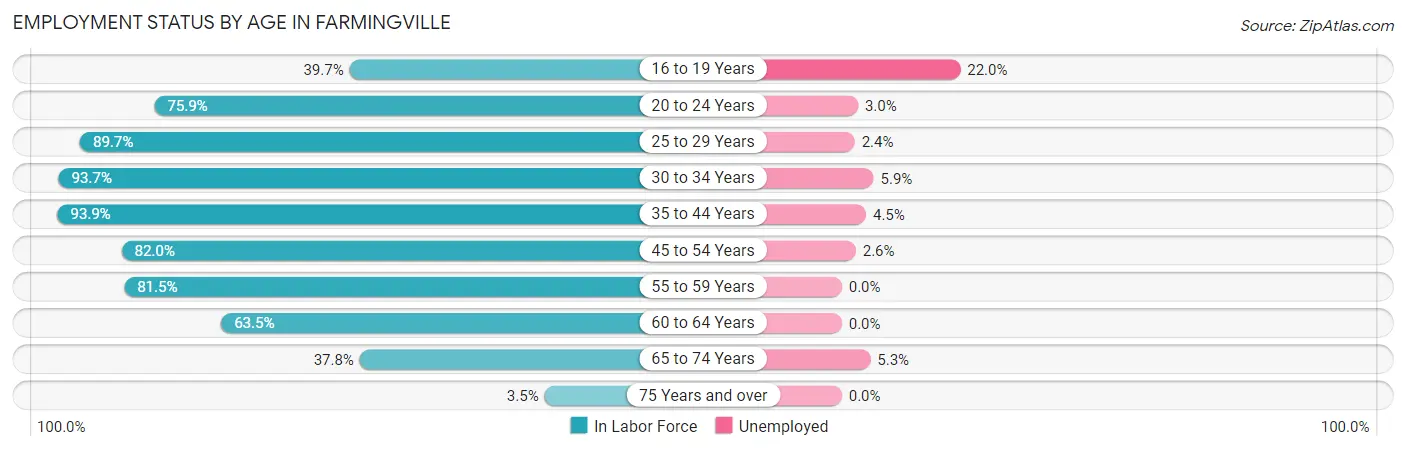
| Age Bracket | In Labor Force | Unemployed |
| 16 to 19 Years | 455 (39.7%) | 100 (22.0%) |
| 20 to 24 Years | 1,031 (75.9%) | 31 (3.0%) |
| 25 to 29 Years | 1,162 (89.7%) | 28 (2.4%) |
| 30 to 34 Years | 1,416 (93.7%) | 84 (5.9%) |
| 35 to 44 Years | 1,638 (93.9%) | 74 (4.5%) |
| 45 to 54 Years | 2,034 (82.0%) | 53 (2.6%) |
| 55 to 59 Years | 706 (81.5%) | 0 (0.0%) |
| 60 to 64 Years | 822 (63.5%) | 0 (0.0%) |
| 65 to 74 Years | 435 (37.8%) | 23 (5.3%) |
| 75 Years and over | 31 (3.5%) | 0 (0.0%) |
| Total | 9,726 (70.8%) | 389 (4.0%) |
Employment Status by Educational Attainment in Farmingville
According to labor force statistics for Farmingville, 84.6% of individuals (7,776) out of the total population between 25 and 64 years of age (9,191) are in the labor force, with 3.0% or 233 of them being unemployed. The group with the highest labor force participation rate are those with the educational attainment of bachelor's degree or higher, with 91.3% or 2,785 individuals in the labor force. Within the labor force, individuals with high school diploma education have the highest percentage of unemployment, with 6.9% or 141 of them being unemployed.
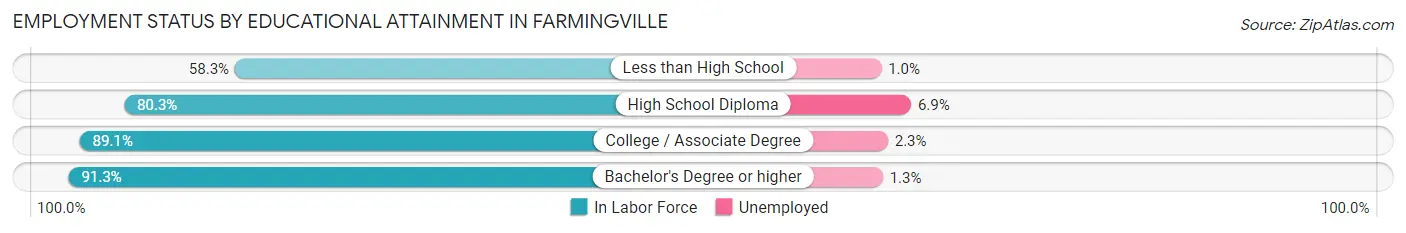
| Educational Attainment | In Labor Force | Unemployed |
| Less than High School | 489 (58.3%) | 8 (1.0%) |
| High School Diploma | 2,038 (80.3%) | 175 (6.9%) |
| College / Associate Degree | 2,463 (89.1%) | 64 (2.3%) |
| Bachelor's Degree or higher | 2,785 (91.3%) | 40 (1.3%) |
| Total | 7,776 (84.6%) | 276 (3.0%) |
Employment Occupations by Sex in Farmingville
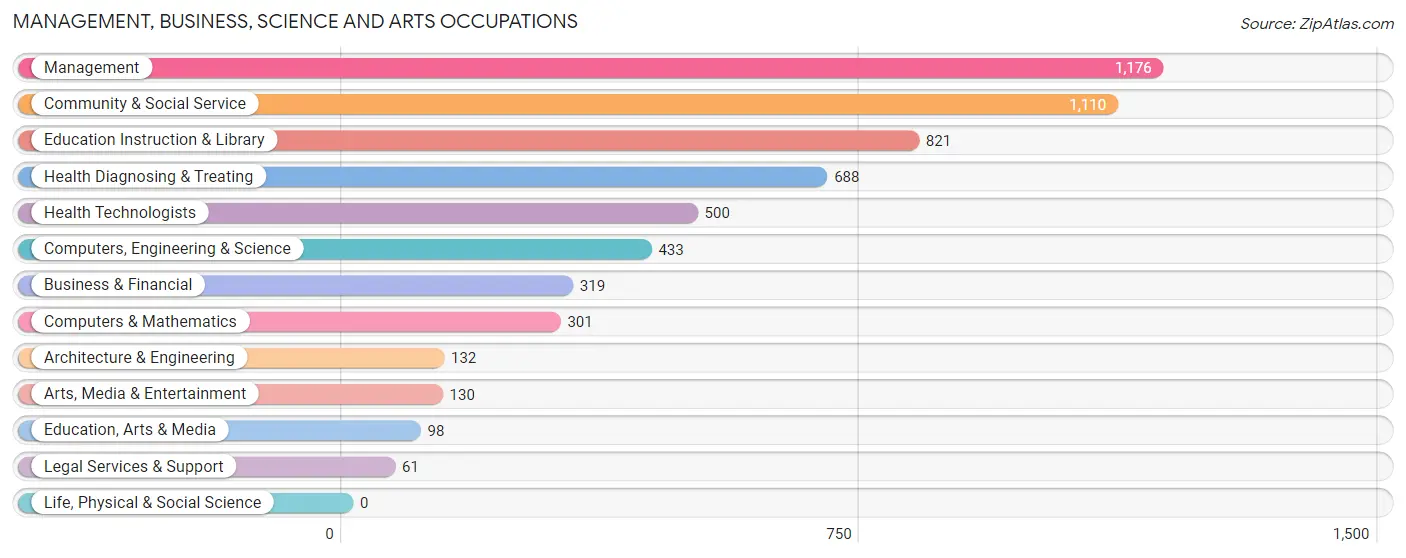
Management, Business, Science and Arts Occupations
The most common Management, Business, Science and Arts occupations in Farmingville are Management (1,176 | 12.6%), Community & Social Service (1,110 | 11.9%), Education Instruction & Library (821 | 8.8%), Health Diagnosing & Treating (688 | 7.4%), and Health Technologists (500 | 5.3%).
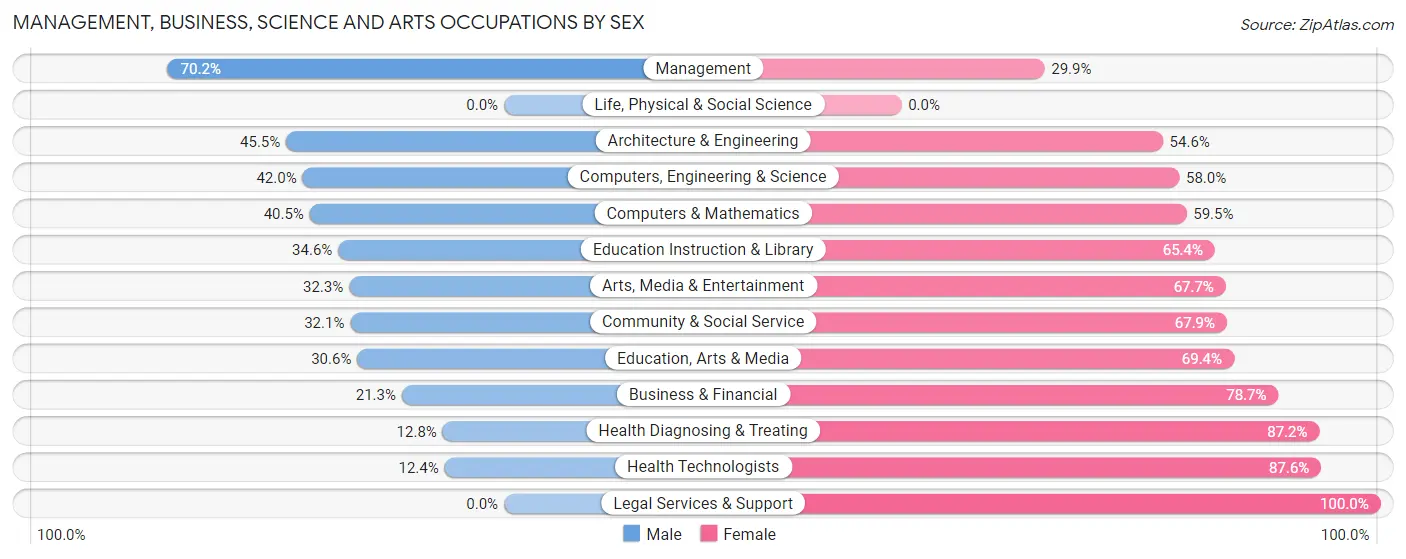
Management, Business, Science and Arts Occupations by Sex
Within the Management, Business, Science and Arts occupations in Farmingville, the most male-oriented occupations are Management (70.2%), Architecture & Engineering (45.5%), and Computers, Engineering & Science (42.0%), while the most female-oriented occupations are Legal Services & Support (100.0%), Health Technologists (87.6%), and Health Diagnosing & Treating (87.2%).
| Occupation | Male | Female |
| Management | 825 (70.2%) | 351 (29.8%) |
| Business & Financial | 68 (21.3%) | 251 (78.7%) |
| Computers, Engineering & Science | 182 (42.0%) | 251 (58.0%) |
| Computers & Mathematics | 122 (40.5%) | 179 (59.5%) |
| Architecture & Engineering | 60 (45.5%) | 72 (54.5%) |
| Life, Physical & Social Science | 0 (0.0%) | 0 (0.0%) |
| Community & Social Service | 356 (32.1%) | 754 (67.9%) |
| Education, Arts & Media | 30 (30.6%) | 68 (69.4%) |
| Legal Services & Support | 0 (0.0%) | 61 (100.0%) |
| Education Instruction & Library | 284 (34.6%) | 537 (65.4%) |
| Arts, Media & Entertainment | 42 (32.3%) | 88 (67.7%) |
| Health Diagnosing & Treating | 88 (12.8%) | 600 (87.2%) |
| Health Technologists | 62 (12.4%) | 438 (87.6%) |
| Total (Category) | 1,519 (40.8%) | 2,207 (59.2%) |
| Total (Overall) | 5,275 (56.5%) | 4,065 (43.5%) |
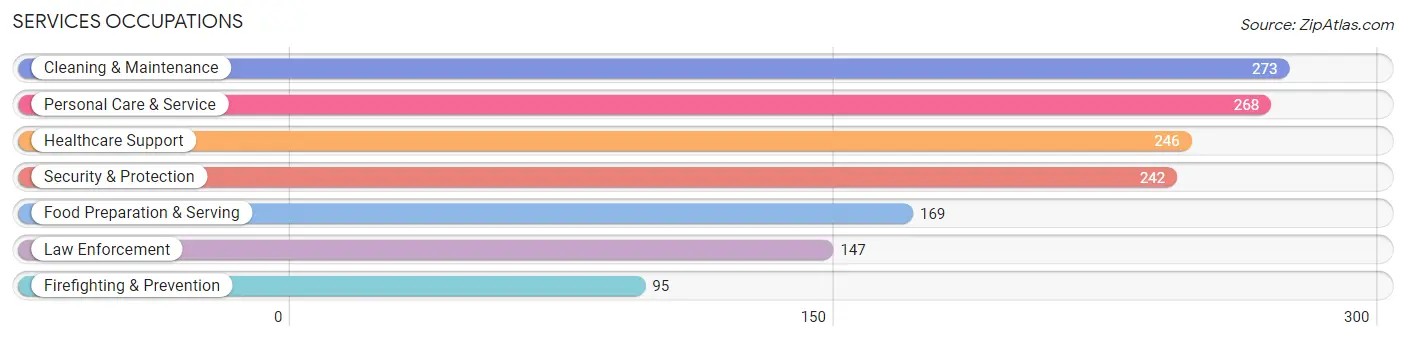
Services Occupations
The most common Services occupations in Farmingville are Cleaning & Maintenance (273 | 2.9%), Personal Care & Service (268 | 2.9%), Healthcare Support (246 | 2.6%), Security & Protection (242 | 2.6%), and Food Preparation & Serving (169 | 1.8%).
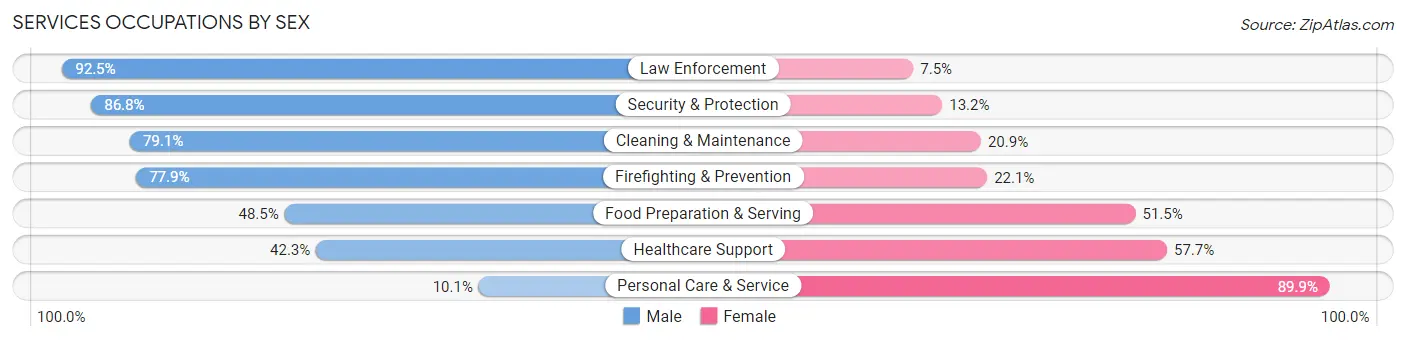
Services Occupations by Sex
Within the Services occupations in Farmingville, the most male-oriented occupations are Law Enforcement (92.5%), Security & Protection (86.8%), and Cleaning & Maintenance (79.1%), while the most female-oriented occupations are Personal Care & Service (89.9%), Healthcare Support (57.7%), and Food Preparation & Serving (51.5%).
| Occupation | Male | Female |
| Healthcare Support | 104 (42.3%) | 142 (57.7%) |
| Security & Protection | 210 (86.8%) | 32 (13.2%) |
| Firefighting & Prevention | 74 (77.9%) | 21 (22.1%) |
| Law Enforcement | 136 (92.5%) | 11 (7.5%) |
| Food Preparation & Serving | 82 (48.5%) | 87 (51.5%) |
| Cleaning & Maintenance | 216 (79.1%) | 57 (20.9%) |
| Personal Care & Service | 27 (10.1%) | 241 (89.9%) |
| Total (Category) | 639 (53.3%) | 559 (46.7%) |
| Total (Overall) | 5,275 (56.5%) | 4,065 (43.5%) |
Sales and Office Occupations
The most common Sales and Office occupations in Farmingville are Office & Administration (1,292 | 13.8%), and Sales & Related (979 | 10.5%).

Sales and Office Occupations by Sex
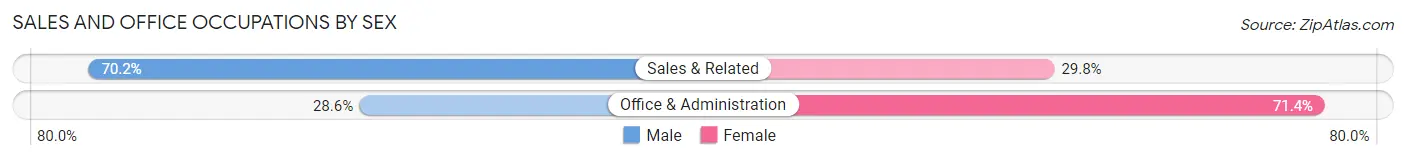
| Occupation | Male | Female |
| Sales & Related | 687 (70.2%) | 292 (29.8%) |
| Office & Administration | 369 (28.6%) | 923 (71.4%) |
| Total (Category) | 1,056 (46.5%) | 1,215 (53.5%) |
| Total (Overall) | 5,275 (56.5%) | 4,065 (43.5%) |
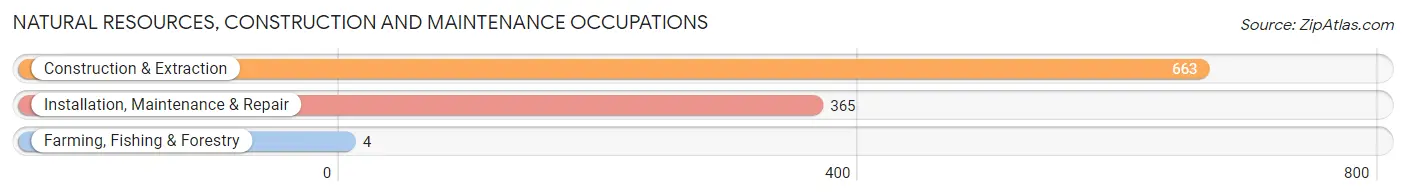
Natural Resources, Construction and Maintenance Occupations
The most common Natural Resources, Construction and Maintenance occupations in Farmingville are Construction & Extraction (663 | 7.1%), Installation, Maintenance & Repair (365 | 3.9%), and Farming, Fishing & Forestry (4 | 0.0%).
Natural Resources, Construction and Maintenance Occupations by Sex
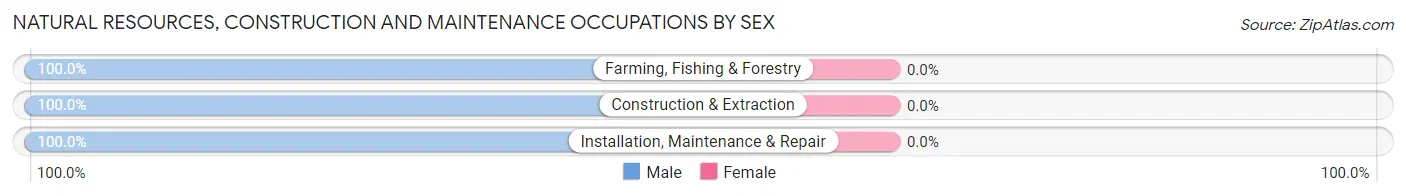
| Occupation | Male | Female |
| Farming, Fishing & Forestry | 4 (100.0%) | 0 (0.0%) |
| Construction & Extraction | 663 (100.0%) | 0 (0.0%) |
| Installation, Maintenance & Repair | 365 (100.0%) | 0 (0.0%) |
| Total (Category) | 1,032 (100.0%) | 0 (0.0%) |
| Total (Overall) | 5,275 (56.5%) | 4,065 (43.5%) |
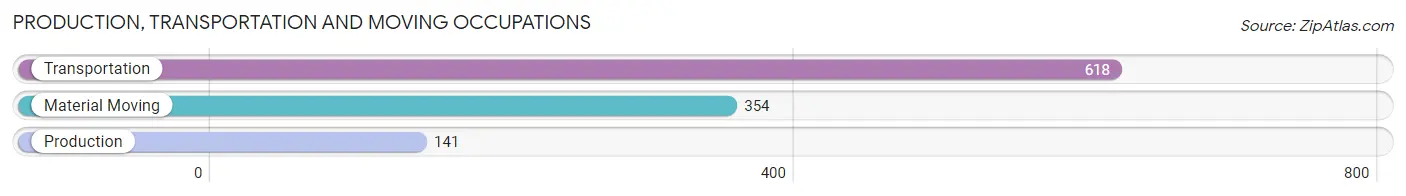
Production, Transportation and Moving Occupations
The most common Production, Transportation and Moving occupations in Farmingville are Transportation (618 | 6.6%), Material Moving (354 | 3.8%), and Production (141 | 1.5%).
Production, Transportation and Moving Occupations by Sex
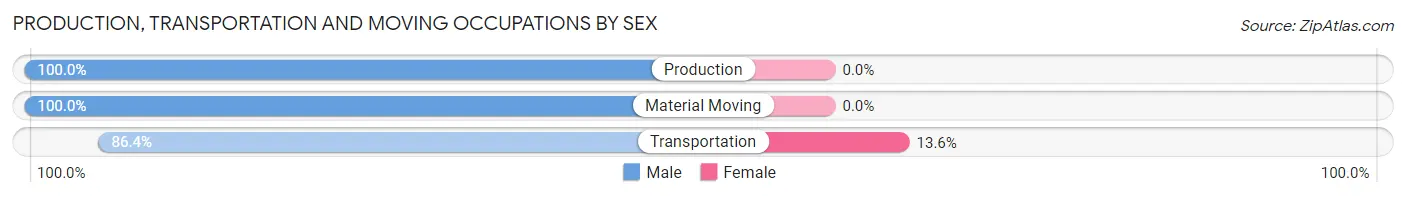
| Occupation | Male | Female |
| Production | 141 (100.0%) | 0 (0.0%) |
| Transportation | 534 (86.4%) | 84 (13.6%) |
| Material Moving | 354 (100.0%) | 0 (0.0%) |
| Total (Category) | 1,029 (92.4%) | 84 (7.5%) |
| Total (Overall) | 5,275 (56.5%) | 4,065 (43.5%) |
Employment Industries by Sex in Farmingville
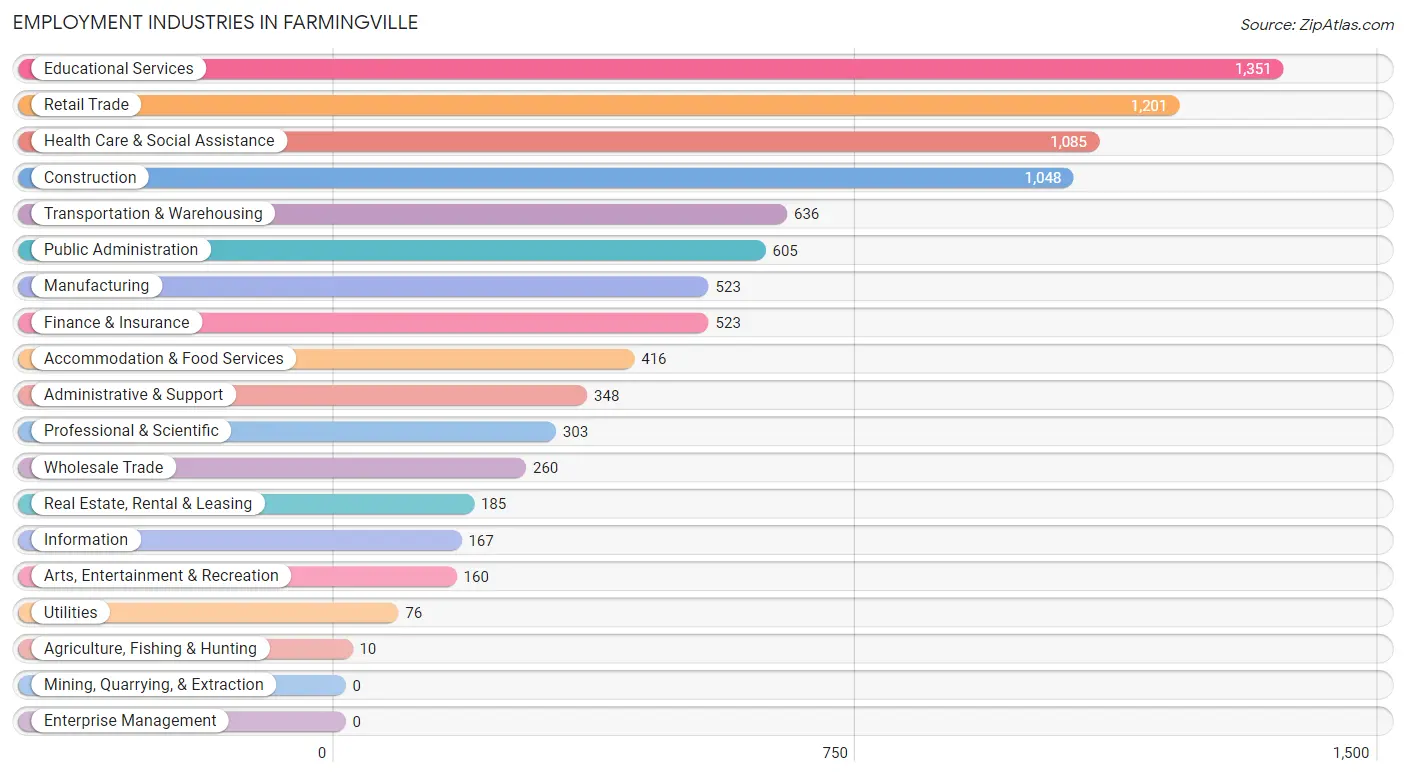
Employment Industries in Farmingville
The major employment industries in Farmingville include Educational Services (1,351 | 14.5%), Retail Trade (1,201 | 12.9%), Health Care & Social Assistance (1,085 | 11.6%), Construction (1,048 | 11.2%), and Transportation & Warehousing (636 | 6.8%).
Employment Industries by Sex in Farmingville
The Farmingville industries that see more men than women are Agriculture, Fishing & Hunting (100.0%), Utilities (100.0%), and Administrative & Support (97.4%), whereas the industries that tend to have a higher number of women are Health Care & Social Assistance (77.6%), Finance & Insurance (67.7%), and Professional & Scientific (65.3%).
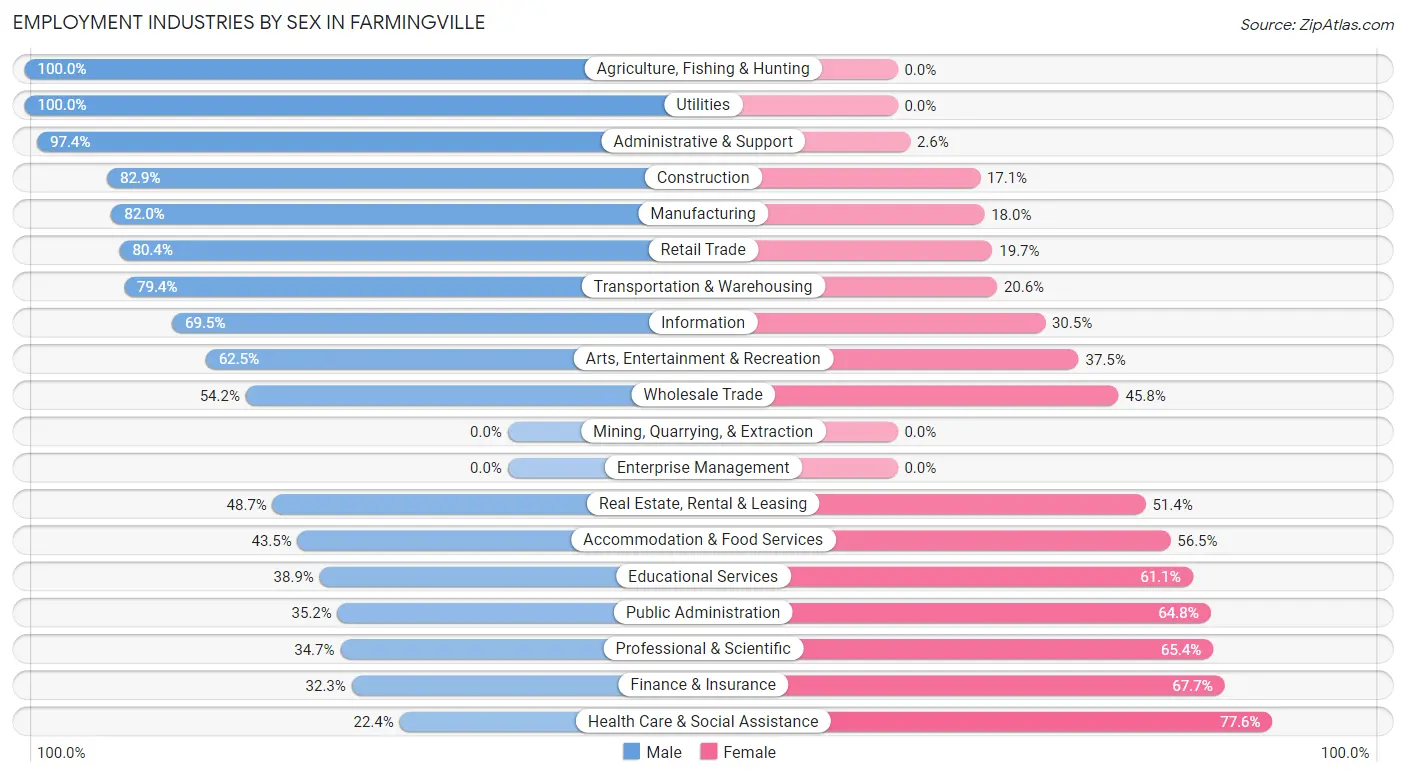
| Industry | Male | Female |
| Agriculture, Fishing & Hunting | 10 (100.0%) | 0 (0.0%) |
| Mining, Quarrying, & Extraction | 0 (0.0%) | 0 (0.0%) |
| Construction | 869 (82.9%) | 179 (17.1%) |
| Manufacturing | 429 (82.0%) | 94 (18.0%) |
| Wholesale Trade | 141 (54.2%) | 119 (45.8%) |
| Retail Trade | 965 (80.3%) | 236 (19.7%) |
| Transportation & Warehousing | 505 (79.4%) | 131 (20.6%) |
| Utilities | 76 (100.0%) | 0 (0.0%) |
| Information | 116 (69.5%) | 51 (30.5%) |
| Finance & Insurance | 169 (32.3%) | 354 (67.7%) |
| Real Estate, Rental & Leasing | 90 (48.6%) | 95 (51.3%) |
| Professional & Scientific | 105 (34.6%) | 198 (65.3%) |
| Enterprise Management | 0 (0.0%) | 0 (0.0%) |
| Administrative & Support | 339 (97.4%) | 9 (2.6%) |
| Educational Services | 526 (38.9%) | 825 (61.1%) |
| Health Care & Social Assistance | 243 (22.4%) | 842 (77.6%) |
| Arts, Entertainment & Recreation | 100 (62.5%) | 60 (37.5%) |
| Accommodation & Food Services | 181 (43.5%) | 235 (56.5%) |
| Public Administration | 213 (35.2%) | 392 (64.8%) |
| Total | 5,275 (56.5%) | 4,065 (43.5%) |
Education in Farmingville
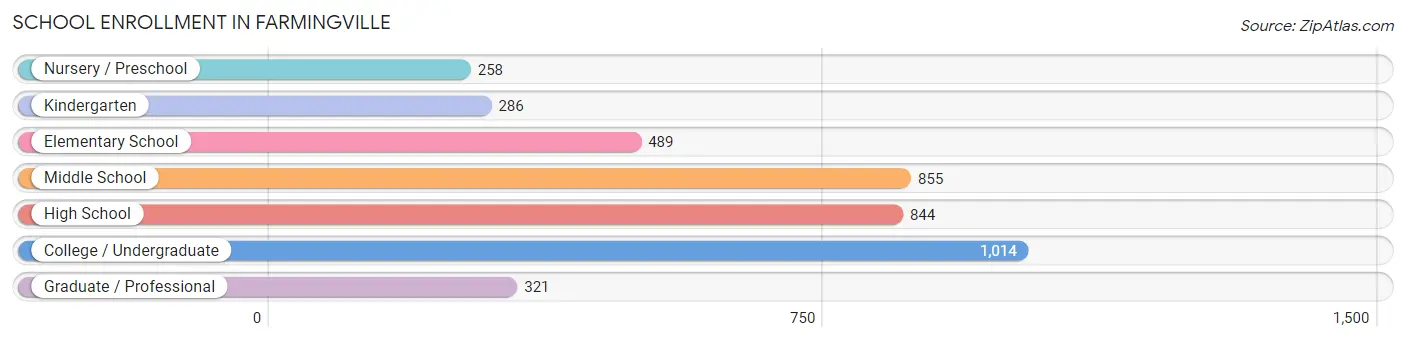
School Enrollment in Farmingville
The most common levels of schooling among the 4,067 students in Farmingville are college / undergraduate (1,014 | 24.9%), middle school (855 | 21.0%), and high school (844 | 20.7%).
| School Level | # Students | % Students |
| Nursery / Preschool | 258 | 6.3% |
| Kindergarten | 286 | 7.0% |
| Elementary School | 489 | 12.0% |
| Middle School | 855 | 21.0% |
| High School | 844 | 20.7% |
| College / Undergraduate | 1,014 | 24.9% |
| Graduate / Professional | 321 | 7.9% |
| Total | 4,067 | 100.0% |
School Enrollment by Age by Funding Source in Farmingville
Out of a total of 4,067 students who are enrolled in schools in Farmingville, 277 (6.8%) attend a private institution, while the remaining 3,790 (93.2%) are enrolled in public schools. The age group of 20 to 24 year olds has the highest likelihood of being enrolled in private schools, with 88 (17.6% in the age bracket) enrolled. Conversely, the age group of 5 to 9 year old has the lowest likelihood of being enrolled in a private school, with 741 (100.0% in the age bracket) attending a public institution.
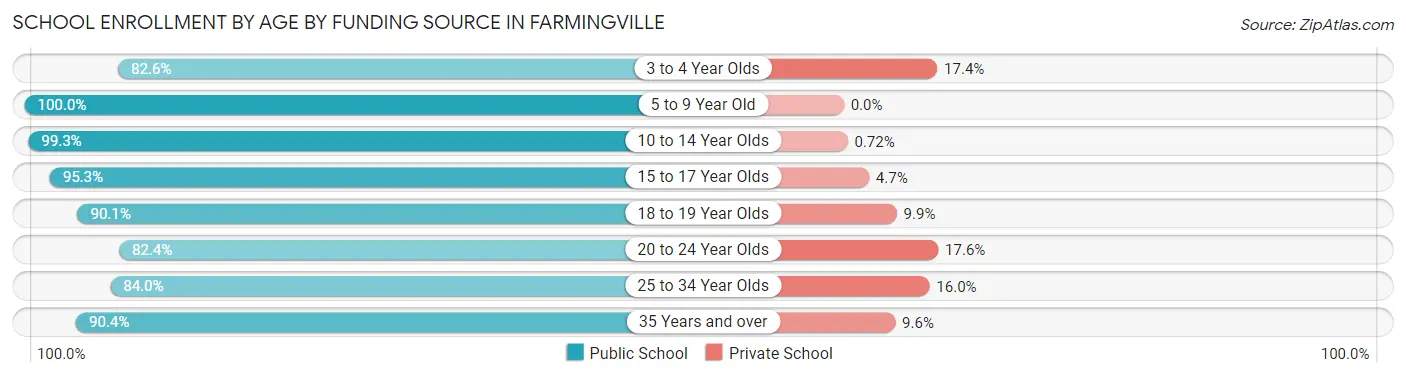
| Age Bracket | Public School | Private School |
| 3 to 4 Year Olds | 185 (82.6%) | 39 (17.4%) |
| 5 to 9 Year Old | 741 (100.0%) | 0 (0.0%) |
| 10 to 14 Year Olds | 963 (99.3%) | 7 (0.7%) |
| 15 to 17 Year Olds | 709 (95.3%) | 35 (4.7%) |
| 18 to 19 Year Olds | 347 (90.1%) | 38 (9.9%) |
| 20 to 24 Year Olds | 412 (82.4%) | 88 (17.6%) |
| 25 to 34 Year Olds | 300 (84.0%) | 57 (16.0%) |
| 35 Years and over | 132 (90.4%) | 14 (9.6%) |
| Total | 3,790 (93.2%) | 277 (6.8%) |
Educational Attainment by Field of Study in Farmingville
Business (858 | 24.4%), science & technology (587 | 16.7%), education (500 | 14.2%), liberal arts & history (217 | 6.2%), and visual & performing arts (190 | 5.4%) are the most common fields of study among 3,511 individuals in Farmingville who have obtained a bachelor's degree or higher.
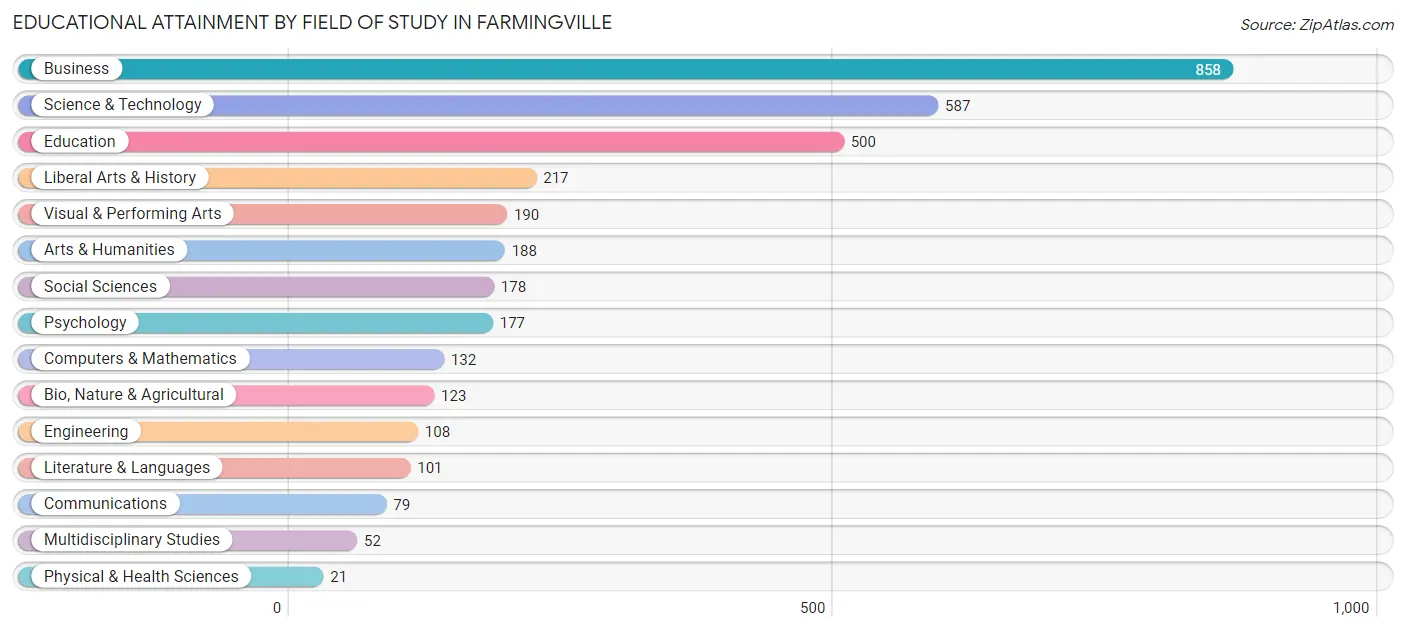
| Field of Study | # Graduates | % Graduates |
| Computers & Mathematics | 132 | 3.8% |
| Bio, Nature & Agricultural | 123 | 3.5% |
| Physical & Health Sciences | 21 | 0.6% |
| Psychology | 177 | 5.0% |
| Social Sciences | 178 | 5.1% |
| Engineering | 108 | 3.1% |
| Multidisciplinary Studies | 52 | 1.5% |
| Science & Technology | 587 | 16.7% |
| Business | 858 | 24.4% |
| Education | 500 | 14.2% |
| Literature & Languages | 101 | 2.9% |
| Liberal Arts & History | 217 | 6.2% |
| Visual & Performing Arts | 190 | 5.4% |
| Communications | 79 | 2.2% |
| Arts & Humanities | 188 | 5.3% |
| Total | 3,511 | 100.0% |
Transportation & Commute in Farmingville
Vehicle Availability by Sex in Farmingville
The most prevalent vehicle ownership categories in Farmingville are males with 2 vehicles (1,781, accounting for 34.3%) and females with 2 vehicles (1,305, making up 44.1%).
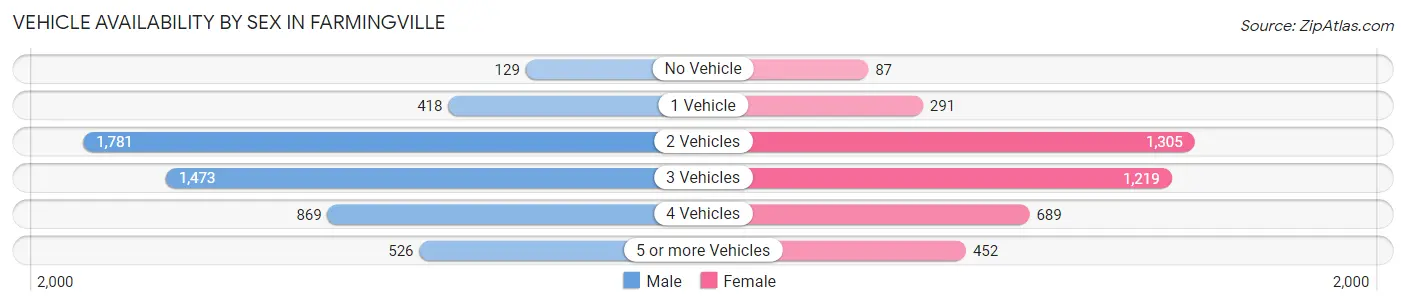
| Vehicles Available | Male | Female |
| No Vehicle | 129 (2.5%) | 87 (2.1%) |
| 1 Vehicle | 418 (8.0%) | 291 (7.2%) |
| 2 Vehicles | 1,781 (34.3%) | 1,305 (32.3%) |
| 3 Vehicles | 1,473 (28.3%) | 1,219 (30.1%) |
| 4 Vehicles | 869 (16.7%) | 689 (17.0%) |
| 5 or more Vehicles | 526 (10.1%) | 452 (11.2%) |
| Total | 5,196 (100.0%) | 4,043 (100.0%) |
Commute Time in Farmingville
The most frequently occuring commute durations in Farmingville are 30 to 34 minutes (1,697 commuters, 19.4%), 20 to 24 minutes (1,183 commuters, 13.5%), and 15 to 19 minutes (1,022 commuters, 11.7%).
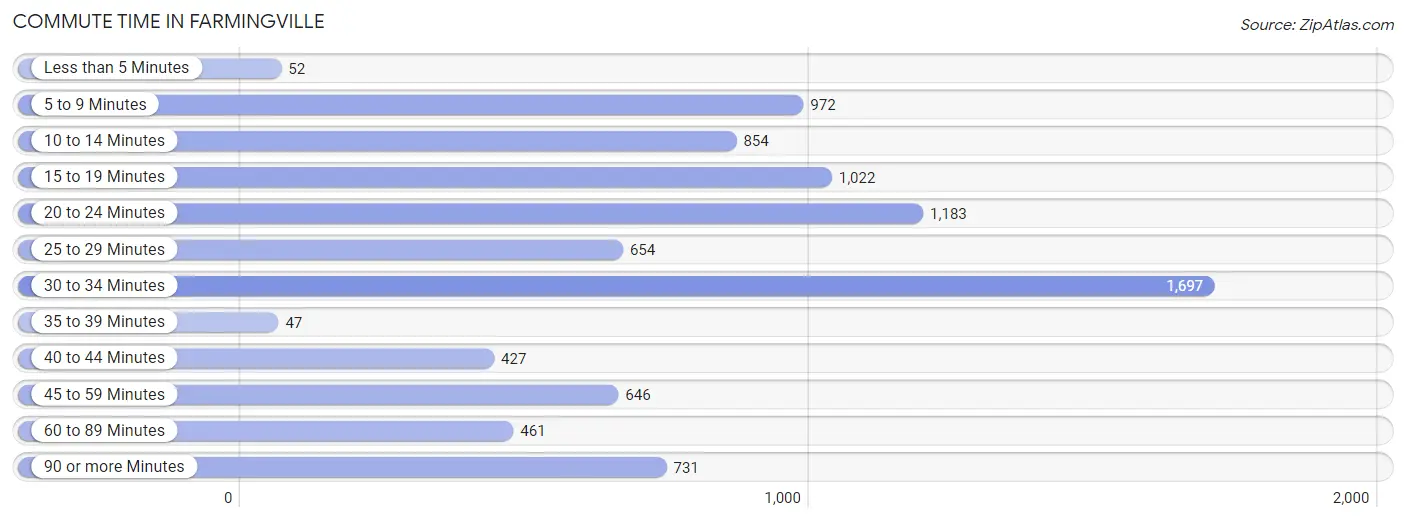
| Commute Time | # Commuters | % Commuters |
| Less than 5 Minutes | 52 | 0.6% |
| 5 to 9 Minutes | 972 | 11.1% |
| 10 to 14 Minutes | 854 | 9.8% |
| 15 to 19 Minutes | 1,022 | 11.7% |
| 20 to 24 Minutes | 1,183 | 13.5% |
| 25 to 29 Minutes | 654 | 7.5% |
| 30 to 34 Minutes | 1,697 | 19.4% |
| 35 to 39 Minutes | 47 | 0.5% |
| 40 to 44 Minutes | 427 | 4.9% |
| 45 to 59 Minutes | 646 | 7.4% |
| 60 to 89 Minutes | 461 | 5.3% |
| 90 or more Minutes | 731 | 8.4% |
Commute Time by Sex in Farmingville
The most common commute times in Farmingville are 30 to 34 minutes (790 commuters, 15.8%) for males and 30 to 34 minutes (907 commuters, 24.2%) for females.
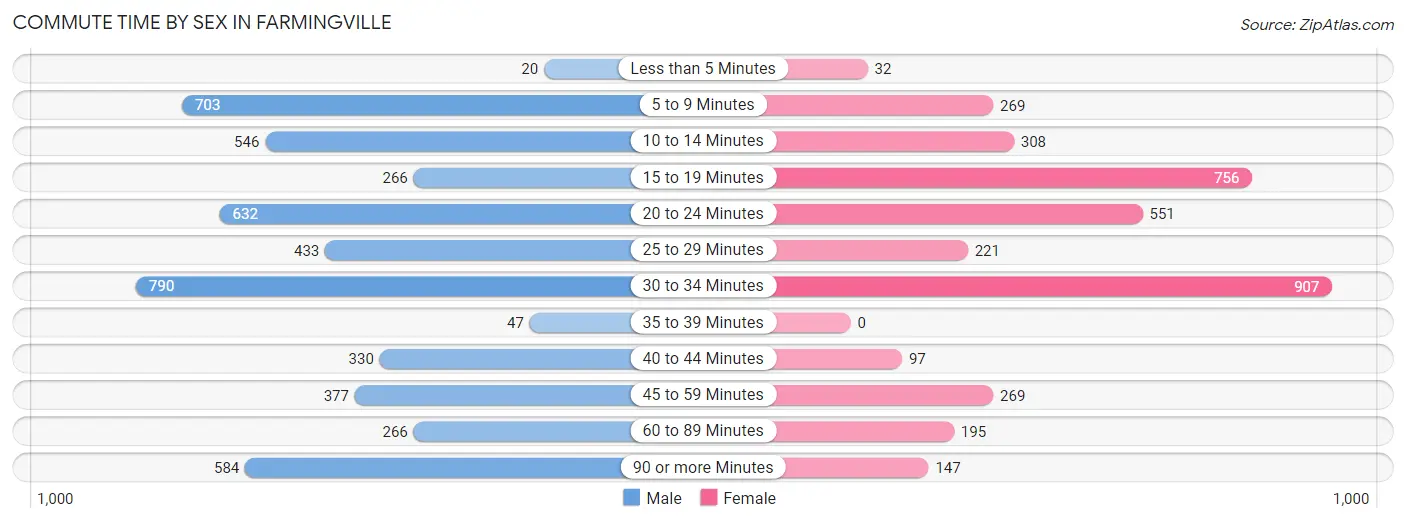
| Commute Time | Male | Female |
| Less than 5 Minutes | 20 (0.4%) | 32 (0.9%) |
| 5 to 9 Minutes | 703 (14.1%) | 269 (7.2%) |
| 10 to 14 Minutes | 546 (10.9%) | 308 (8.2%) |
| 15 to 19 Minutes | 266 (5.3%) | 756 (20.2%) |
| 20 to 24 Minutes | 632 (12.7%) | 551 (14.7%) |
| 25 to 29 Minutes | 433 (8.7%) | 221 (5.9%) |
| 30 to 34 Minutes | 790 (15.8%) | 907 (24.2%) |
| 35 to 39 Minutes | 47 (0.9%) | 0 (0.0%) |
| 40 to 44 Minutes | 330 (6.6%) | 97 (2.6%) |
| 45 to 59 Minutes | 377 (7.5%) | 269 (7.2%) |
| 60 to 89 Minutes | 266 (5.3%) | 195 (5.2%) |
| 90 or more Minutes | 584 (11.7%) | 147 (3.9%) |
Time of Departure to Work by Sex in Farmingville
The most frequent times of departure to work in Farmingville are 12:00 AM to 4:59 AM (566, 11.3%) for males and 7:00 AM to 7:29 AM (748, 19.9%) for females.
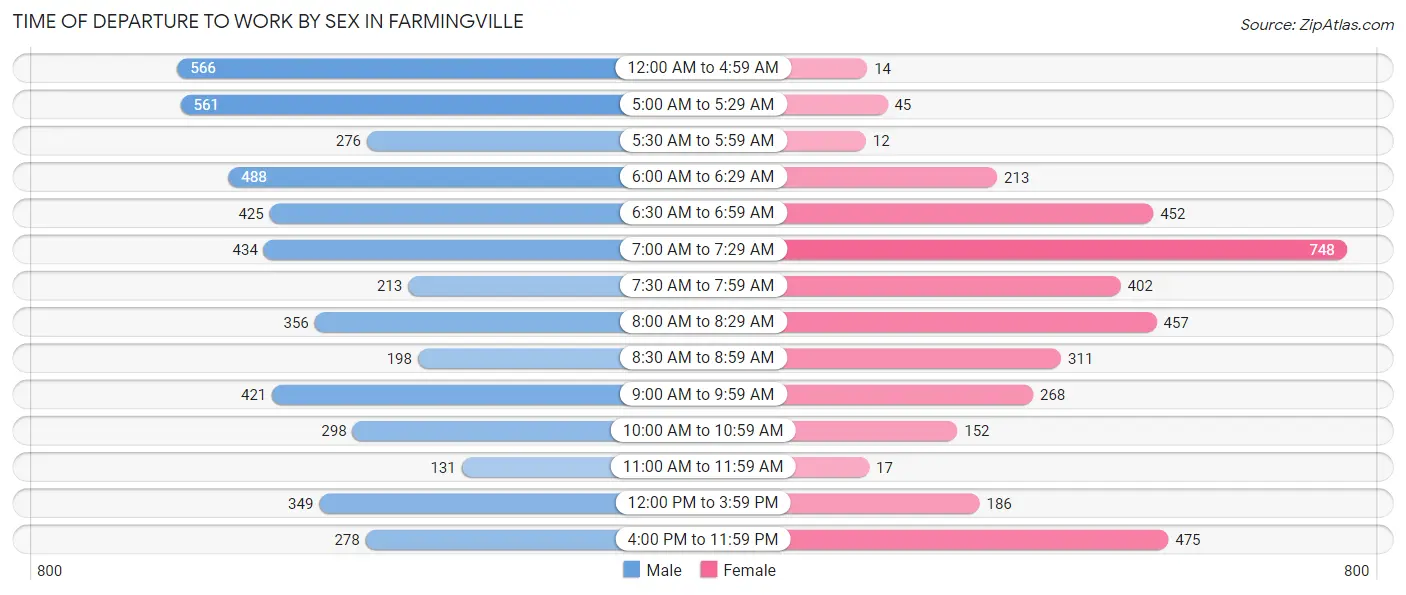
| Time of Departure | Male | Female |
| 12:00 AM to 4:59 AM | 566 (11.3%) | 14 (0.4%) |
| 5:00 AM to 5:29 AM | 561 (11.2%) | 45 (1.2%) |
| 5:30 AM to 5:59 AM | 276 (5.5%) | 12 (0.3%) |
| 6:00 AM to 6:29 AM | 488 (9.8%) | 213 (5.7%) |
| 6:30 AM to 6:59 AM | 425 (8.5%) | 452 (12.0%) |
| 7:00 AM to 7:29 AM | 434 (8.7%) | 748 (19.9%) |
| 7:30 AM to 7:59 AM | 213 (4.3%) | 402 (10.7%) |
| 8:00 AM to 8:29 AM | 356 (7.1%) | 457 (12.2%) |
| 8:30 AM to 8:59 AM | 198 (4.0%) | 311 (8.3%) |
| 9:00 AM to 9:59 AM | 421 (8.4%) | 268 (7.1%) |
| 10:00 AM to 10:59 AM | 298 (6.0%) | 152 (4.1%) |
| 11:00 AM to 11:59 AM | 131 (2.6%) | 17 (0.4%) |
| 12:00 PM to 3:59 PM | 349 (7.0%) | 186 (5.0%) |
| 4:00 PM to 11:59 PM | 278 (5.6%) | 475 (12.7%) |
| Total | 4,994 (100.0%) | 3,752 (100.0%) |
Housing Occupancy in Farmingville
Occupancy by Ownership in Farmingville
Of the total 4,889 dwellings in Farmingville, owner-occupied units account for 4,313 (88.2%), while renter-occupied units make up 576 (11.8%).
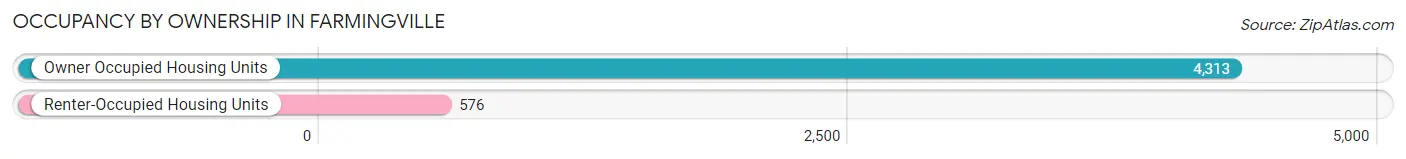
| Occupancy | # Housing Units | % Housing Units |
| Owner Occupied Housing Units | 4,313 | 88.2% |
| Renter-Occupied Housing Units | 576 | 11.8% |
| Total Occupied Housing Units | 4,889 | 100.0% |
Occupancy by Household Size in Farmingville
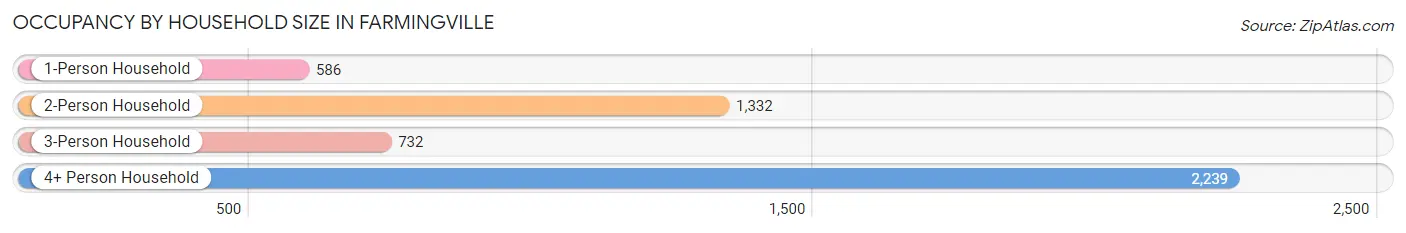
| Household Size | # Housing Units | % Housing Units |
| 1-Person Household | 586 | 12.0% |
| 2-Person Household | 1,332 | 27.2% |
| 3-Person Household | 732 | 15.0% |
| 4+ Person Household | 2,239 | 45.8% |
| Total Housing Units | 4,889 | 100.0% |
Occupancy by Ownership by Household Size in Farmingville
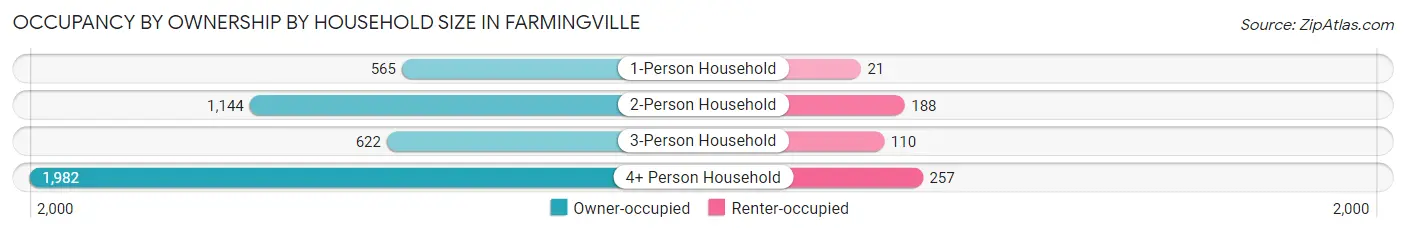
| Household Size | Owner-occupied | Renter-occupied |
| 1-Person Household | 565 (96.4%) | 21 (3.6%) |
| 2-Person Household | 1,144 (85.9%) | 188 (14.1%) |
| 3-Person Household | 622 (85.0%) | 110 (15.0%) |
| 4+ Person Household | 1,982 (88.5%) | 257 (11.5%) |
| Total Housing Units | 4,313 (88.2%) | 576 (11.8%) |
Occupancy by Educational Attainment in Farmingville
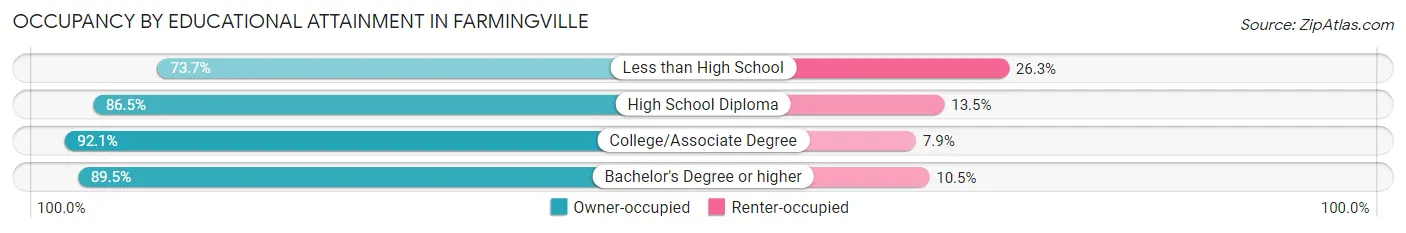
| Household Size | Owner-occupied | Renter-occupied |
| Less than High School | 252 (73.7%) | 90 (26.3%) |
| High School Diploma | 1,396 (86.5%) | 218 (13.5%) |
| College/Associate Degree | 1,426 (92.1%) | 122 (7.9%) |
| Bachelor's Degree or higher | 1,239 (89.5%) | 146 (10.5%) |
Occupancy by Age of Householder in Farmingville
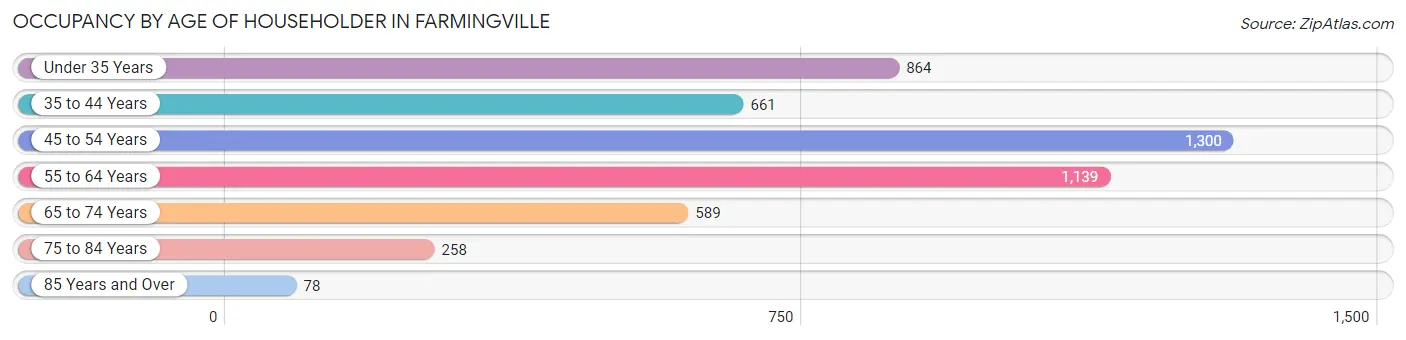
| Age Bracket | # Households | % Households |
| Under 35 Years | 864 | 17.7% |
| 35 to 44 Years | 661 | 13.5% |
| 45 to 54 Years | 1,300 | 26.6% |
| 55 to 64 Years | 1,139 | 23.3% |
| 65 to 74 Years | 589 | 12.0% |
| 75 to 84 Years | 258 | 5.3% |
| 85 Years and Over | 78 | 1.6% |
| Total | 4,889 | 100.0% |
Housing Finances in Farmingville
Median Income by Occupancy in Farmingville
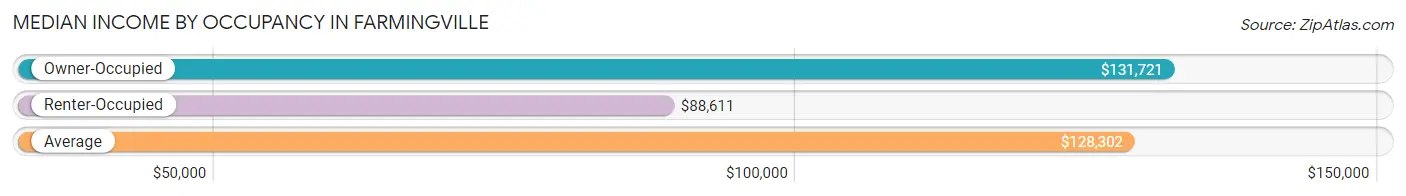
| Occupancy Type | # Households | Median Income |
| Owner-Occupied | 4,313 (88.2%) | $131,721 |
| Renter-Occupied | 576 (11.8%) | $88,611 |
| Average | 4,889 (100.0%) | $128,302 |
Occupancy by Householder Income Bracket in Farmingville
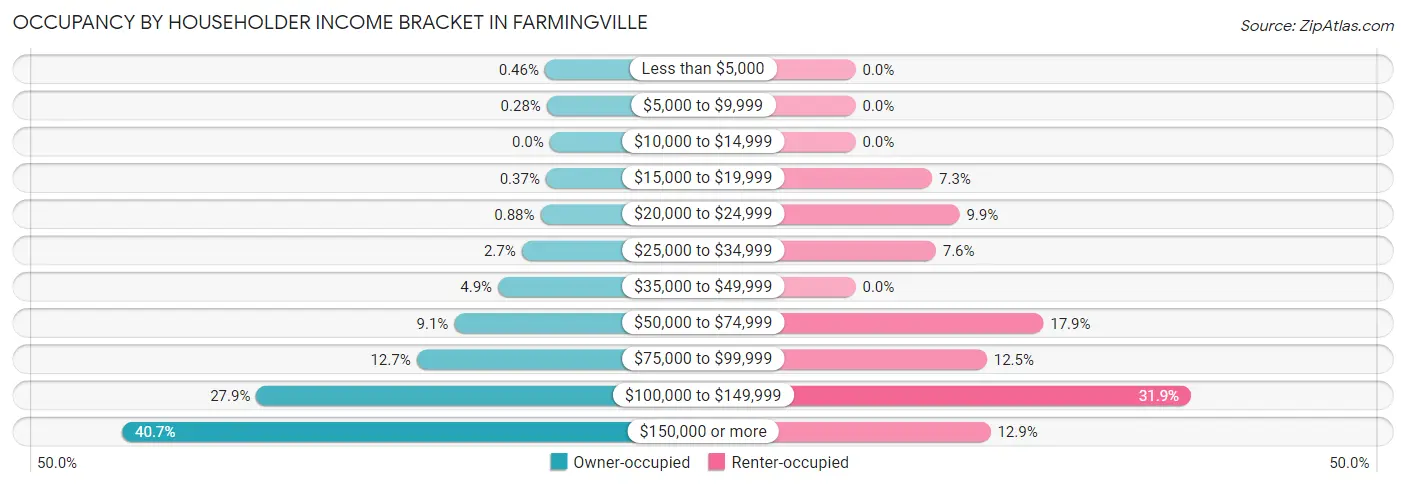
| Income Bracket | Owner-occupied | Renter-occupied |
| Less than $5,000 | 20 (0.5%) | 0 (0.0%) |
| $5,000 to $9,999 | 12 (0.3%) | 0 (0.0%) |
| $10,000 to $14,999 | 0 (0.0%) | 0 (0.0%) |
| $15,000 to $19,999 | 16 (0.4%) | 42 (7.3%) |
| $20,000 to $24,999 | 38 (0.9%) | 57 (9.9%) |
| $25,000 to $34,999 | 115 (2.7%) | 44 (7.6%) |
| $35,000 to $49,999 | 212 (4.9%) | 0 (0.0%) |
| $50,000 to $74,999 | 392 (9.1%) | 103 (17.9%) |
| $75,000 to $99,999 | 547 (12.7%) | 72 (12.5%) |
| $100,000 to $149,999 | 1,205 (27.9%) | 184 (31.9%) |
| $150,000 or more | 1,756 (40.7%) | 74 (12.9%) |
| Total | 4,313 (100.0%) | 576 (100.0%) |
Monthly Housing Cost Tiers in Farmingville
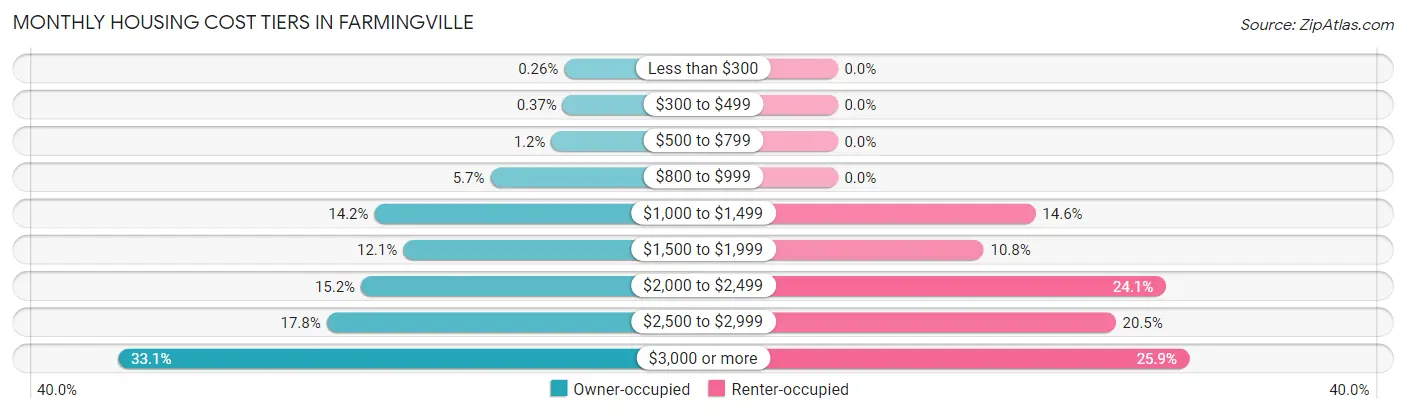
| Monthly Cost | Owner-occupied | Renter-occupied |
| Less than $300 | 11 (0.3%) | 0 (0.0%) |
| $300 to $499 | 16 (0.4%) | 0 (0.0%) |
| $500 to $799 | 52 (1.2%) | 0 (0.0%) |
| $800 to $999 | 246 (5.7%) | 0 (0.0%) |
| $1,000 to $1,499 | 614 (14.2%) | 84 (14.6%) |
| $1,500 to $1,999 | 523 (12.1%) | 62 (10.8%) |
| $2,000 to $2,499 | 657 (15.2%) | 139 (24.1%) |
| $2,500 to $2,999 | 766 (17.8%) | 118 (20.5%) |
| $3,000 or more | 1,428 (33.1%) | 149 (25.9%) |
| Total | 4,313 (100.0%) | 576 (100.0%) |
Physical Housing Characteristics in Farmingville
Housing Structures in Farmingville
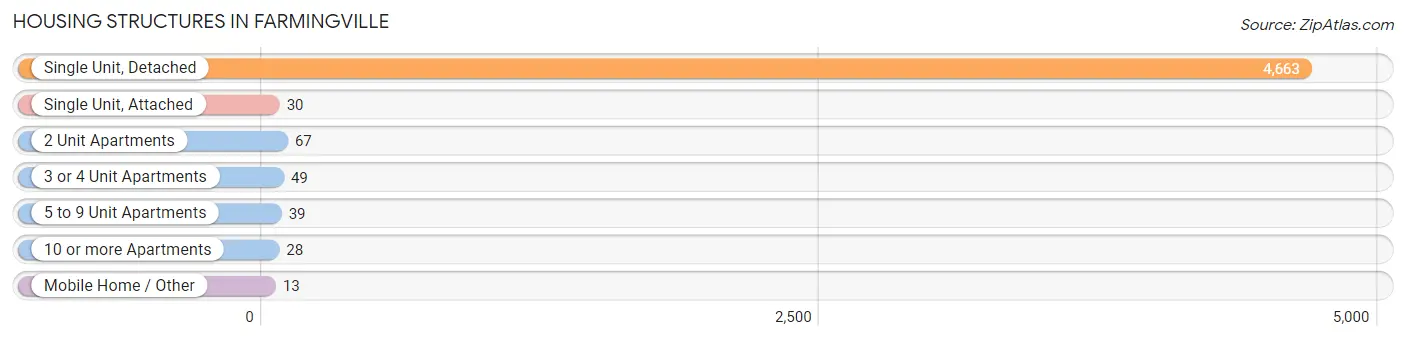
| Structure Type | # Housing Units | % Housing Units |
| Single Unit, Detached | 4,663 | 95.4% |
| Single Unit, Attached | 30 | 0.6% |
| 2 Unit Apartments | 67 | 1.4% |
| 3 or 4 Unit Apartments | 49 | 1.0% |
| 5 to 9 Unit Apartments | 39 | 0.8% |
| 10 or more Apartments | 28 | 0.6% |
| Mobile Home / Other | 13 | 0.3% |
| Total | 4,889 | 100.0% |
Housing Structures by Occupancy in Farmingville
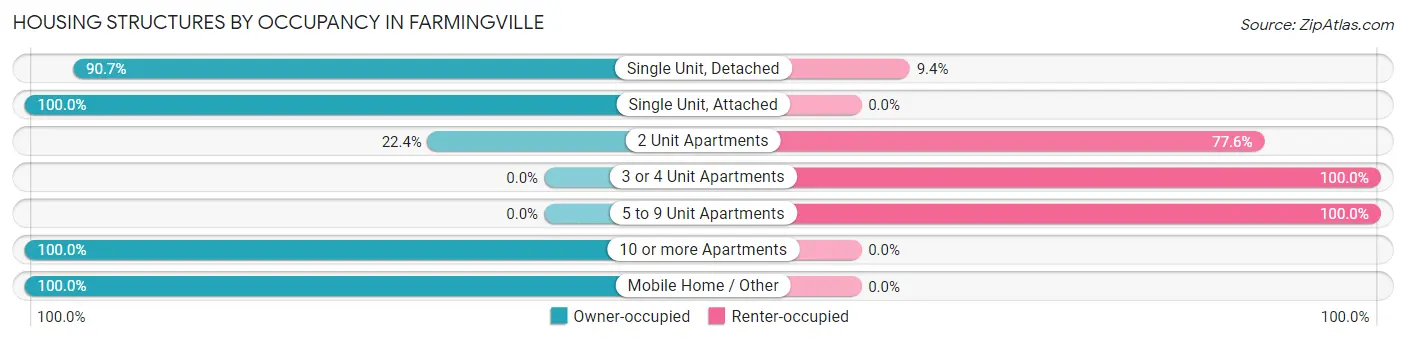
| Structure Type | Owner-occupied | Renter-occupied |
| Single Unit, Detached | 4,227 (90.6%) | 436 (9.3%) |
| Single Unit, Attached | 30 (100.0%) | 0 (0.0%) |
| 2 Unit Apartments | 15 (22.4%) | 52 (77.6%) |
| 3 or 4 Unit Apartments | 0 (0.0%) | 49 (100.0%) |
| 5 to 9 Unit Apartments | 0 (0.0%) | 39 (100.0%) |
| 10 or more Apartments | 28 (100.0%) | 0 (0.0%) |
| Mobile Home / Other | 13 (100.0%) | 0 (0.0%) |
| Total | 4,313 (88.2%) | 576 (11.8%) |
Housing Structures by Number of Rooms in Farmingville
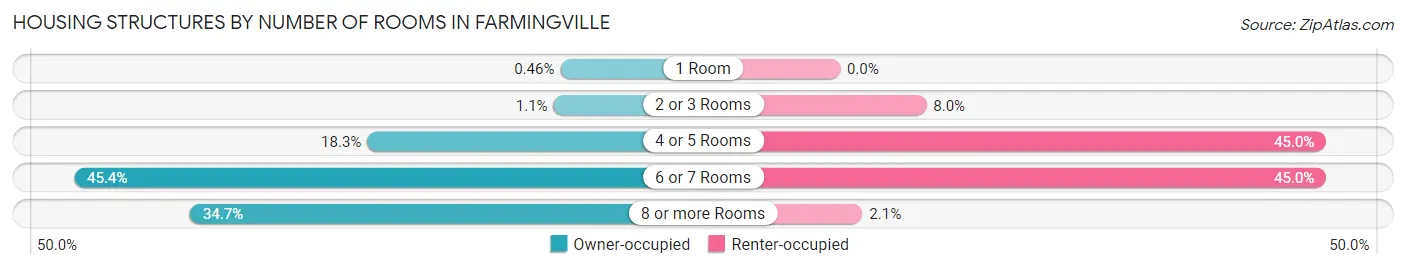
| Number of Rooms | Owner-occupied | Renter-occupied |
| 1 Room | 20 (0.5%) | 0 (0.0%) |
| 2 or 3 Rooms | 47 (1.1%) | 46 (8.0%) |
| 4 or 5 Rooms | 790 (18.3%) | 259 (45.0%) |
| 6 or 7 Rooms | 1,959 (45.4%) | 259 (45.0%) |
| 8 or more Rooms | 1,497 (34.7%) | 12 (2.1%) |
| Total | 4,313 (100.0%) | 576 (100.0%) |
Housing Structure by Heating Type in Farmingville
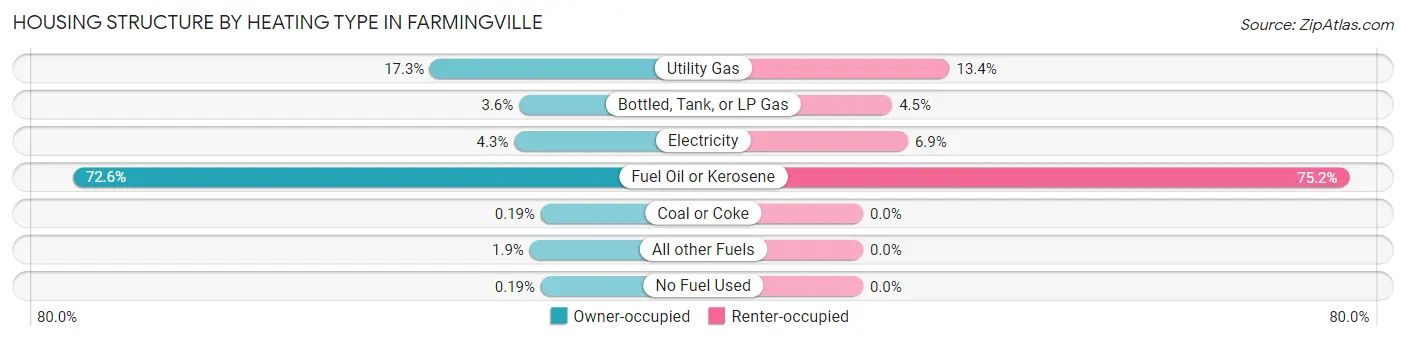
| Heating Type | Owner-occupied | Renter-occupied |
| Utility Gas | 746 (17.3%) | 77 (13.4%) |
| Bottled, Tank, or LP Gas | 153 (3.5%) | 26 (4.5%) |
| Electricity | 186 (4.3%) | 40 (6.9%) |
| Fuel Oil or Kerosene | 3,129 (72.6%) | 433 (75.2%) |
| Coal or Coke | 8 (0.2%) | 0 (0.0%) |
| All other Fuels | 83 (1.9%) | 0 (0.0%) |
| No Fuel Used | 8 (0.2%) | 0 (0.0%) |
| Total | 4,313 (100.0%) | 576 (100.0%) |
Household Vehicle Usage in Farmingville
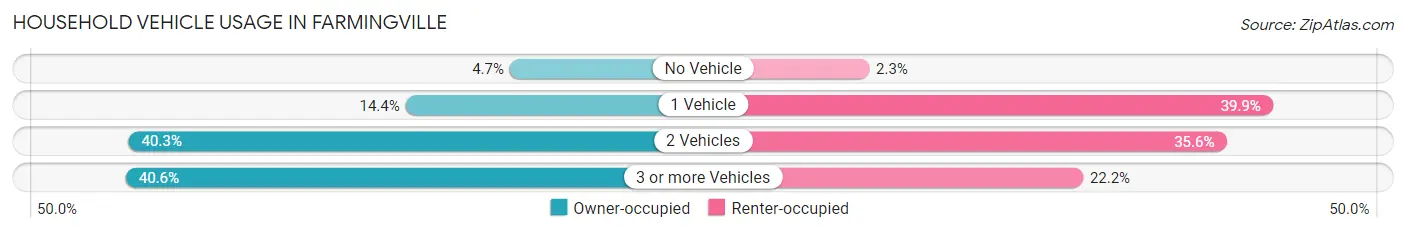
| Vehicles per Household | Owner-occupied | Renter-occupied |
| No Vehicle | 203 (4.7%) | 13 (2.3%) |
| 1 Vehicle | 623 (14.4%) | 230 (39.9%) |
| 2 Vehicles | 1,738 (40.3%) | 205 (35.6%) |
| 3 or more Vehicles | 1,749 (40.6%) | 128 (22.2%) |
| Total | 4,313 (100.0%) | 576 (100.0%) |
Real Estate & Mortgages in Farmingville
Real Estate and Mortgage Overview in Farmingville
| Characteristic | Without Mortgage | With Mortgage |
| Housing Units | 1,074 | 3,239 |
| Median Property Value | $409,500 | $429,100 |
| Median Household Income | $90,543 | $1,465 |
| Monthly Housing Costs | $1,234 | $1,428 |
| Real Estate Taxes | $7,553 | $18 |
Property Value by Mortgage Status in Farmingville
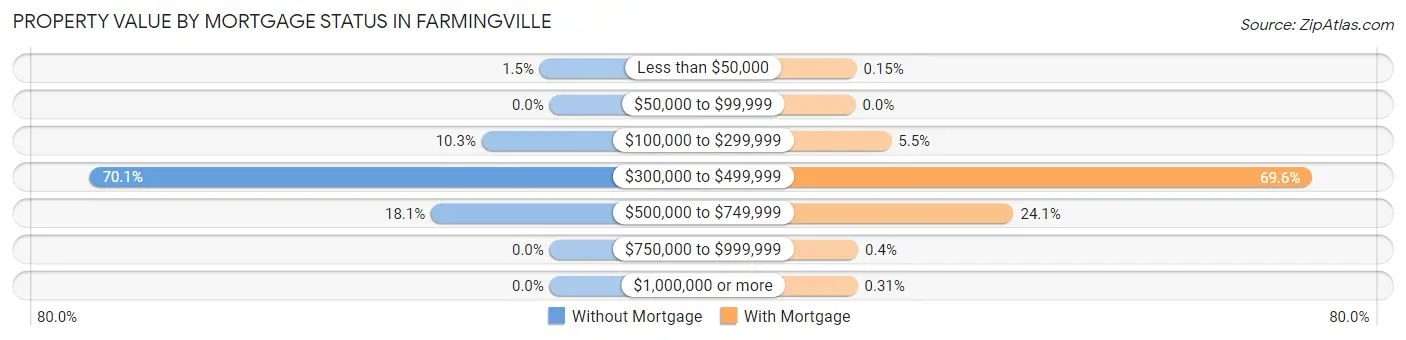
| Property Value | Without Mortgage | With Mortgage |
| Less than $50,000 | 16 (1.5%) | 5 (0.2%) |
| $50,000 to $99,999 | 0 (0.0%) | 0 (0.0%) |
| $100,000 to $299,999 | 111 (10.3%) | 177 (5.5%) |
| $300,000 to $499,999 | 753 (70.1%) | 2,254 (69.6%) |
| $500,000 to $749,999 | 194 (18.1%) | 780 (24.1%) |
| $750,000 to $999,999 | 0 (0.0%) | 13 (0.4%) |
| $1,000,000 or more | 0 (0.0%) | 10 (0.3%) |
| Total | 1,074 (100.0%) | 3,239 (100.0%) |
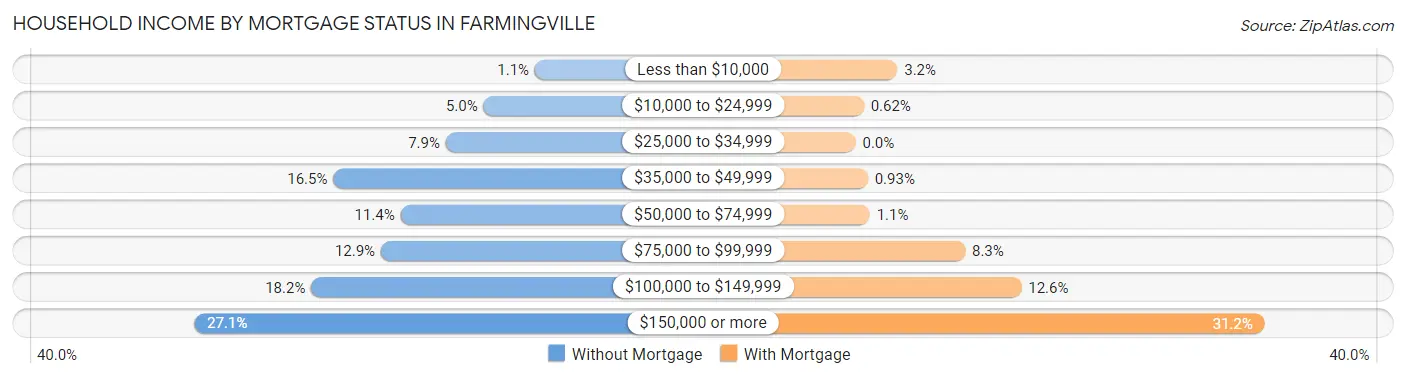
Household Income by Mortgage Status in Farmingville
| Household Income | Without Mortgage | With Mortgage |
| Less than $10,000 | 12 (1.1%) | 103 (3.2%) |
| $10,000 to $24,999 | 54 (5.0%) | 20 (0.6%) |
| $25,000 to $34,999 | 85 (7.9%) | 0 (0.0%) |
| $35,000 to $49,999 | 177 (16.5%) | 30 (0.9%) |
| $50,000 to $74,999 | 122 (11.4%) | 35 (1.1%) |
| $75,000 to $99,999 | 138 (12.9%) | 270 (8.3%) |
| $100,000 to $149,999 | 195 (18.2%) | 409 (12.6%) |
| $150,000 or more | 291 (27.1%) | 1,010 (31.2%) |
| Total | 1,074 (100.0%) | 3,239 (100.0%) |
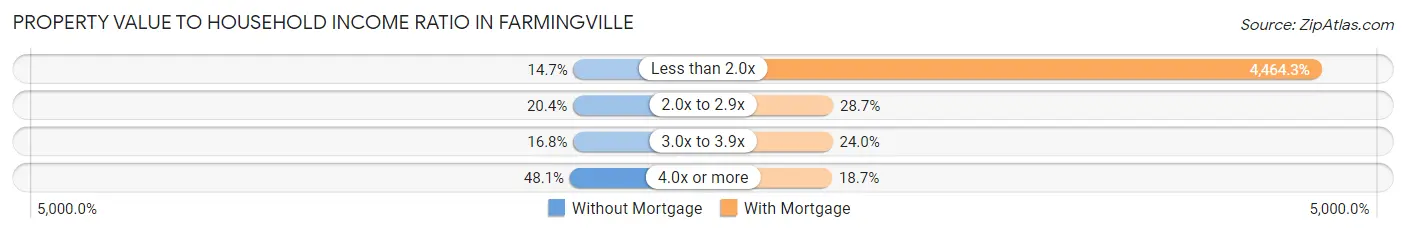
Property Value to Household Income Ratio in Farmingville
| Value-to-Income Ratio | Without Mortgage | With Mortgage |
| Less than 2.0x | 158 (14.7%) | 144,599 (4,464.3%) |
| 2.0x to 2.9x | 219 (20.4%) | 930 (28.7%) |
| 3.0x to 3.9x | 180 (16.8%) | 777 (24.0%) |
| 4.0x or more | 517 (48.1%) | 607 (18.7%) |
| Total | 1,074 (100.0%) | 3,239 (100.0%) |
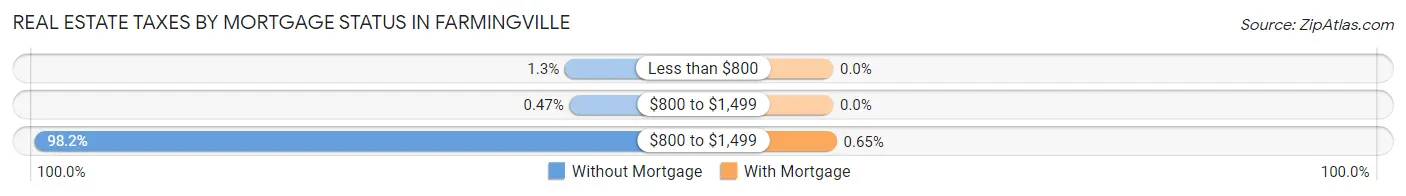
Real Estate Taxes by Mortgage Status in Farmingville
| Property Taxes | Without Mortgage | With Mortgage |
| Less than $800 | 14 (1.3%) | 0 (0.0%) |
| $800 to $1,499 | 5 (0.5%) | 0 (0.0%) |
| $800 to $1,499 | 1,055 (98.2%) | 21 (0.6%) |
| Total | 1,074 (100.0%) | 3,239 (100.0%) |
Health & Disability in Farmingville
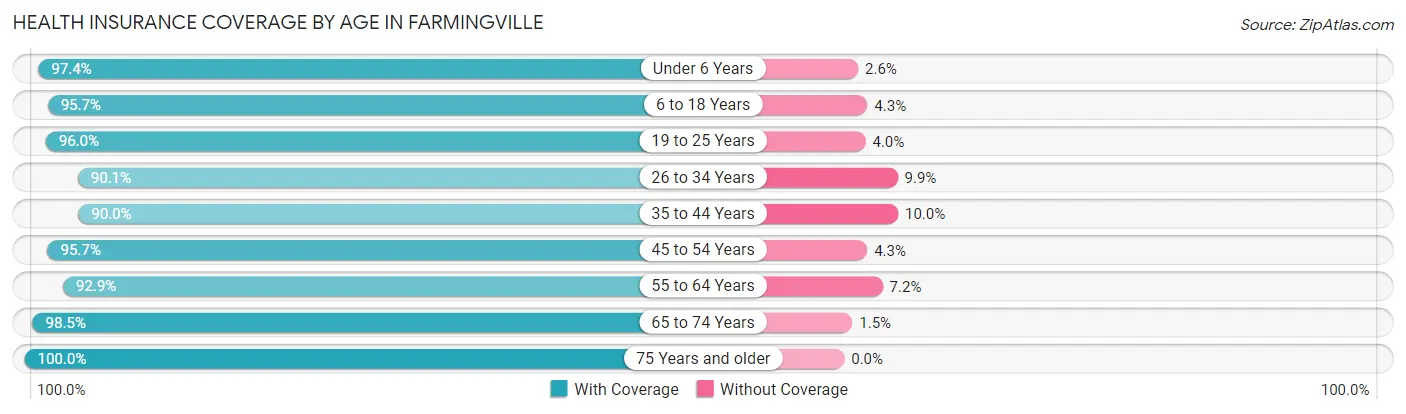
Health Insurance Coverage by Age in Farmingville
| Age Bracket | With Coverage | Without Coverage |
| Under 6 Years | 1,395 (97.4%) | 37 (2.6%) |
| 6 to 18 Years | 2,420 (95.7%) | 109 (4.3%) |
| 19 to 25 Years | 2,083 (96.0%) | 86 (4.0%) |
| 26 to 34 Years | 2,101 (90.1%) | 232 (9.9%) |
| 35 to 44 Years | 1,569 (90.0%) | 175 (10.0%) |
| 45 to 54 Years | 2,372 (95.7%) | 106 (4.3%) |
| 55 to 64 Years | 2,001 (92.8%) | 154 (7.1%) |
| 65 to 74 Years | 1,118 (98.5%) | 17 (1.5%) |
| 75 Years and older | 765 (100.0%) | 0 (0.0%) |
| Total | 15,824 (94.5%) | 916 (5.5%) |
Health Insurance Coverage by Citizenship Status in Farmingville
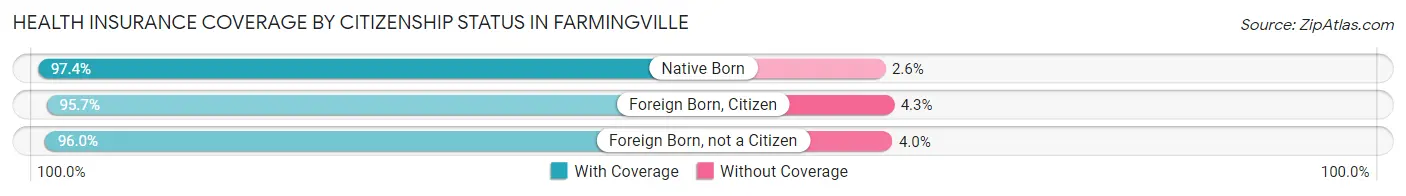
| Citizenship Status | With Coverage | Without Coverage |
| Native Born | 1,395 (97.4%) | 37 (2.6%) |
| Foreign Born, Citizen | 2,420 (95.7%) | 109 (4.3%) |
| Foreign Born, not a Citizen | 2,083 (96.0%) | 86 (4.0%) |
Health Insurance Coverage by Household Income in Farmingville
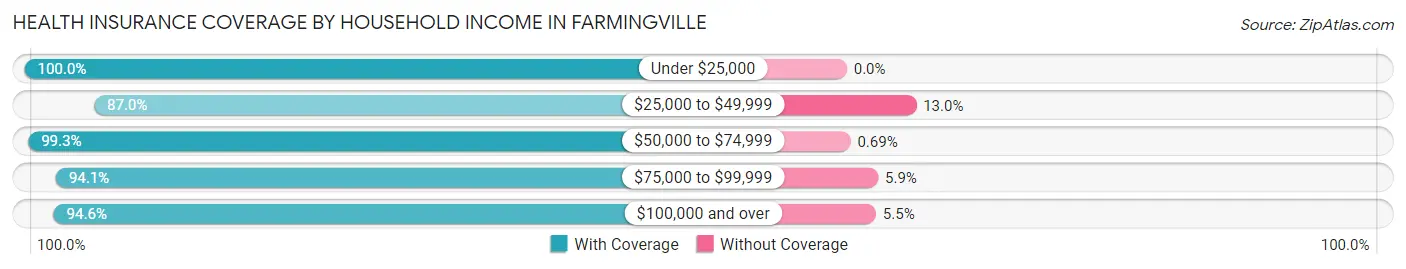
| Household Income | With Coverage | Without Coverage |
| Under $25,000 | 450 (100.0%) | 0 (0.0%) |
| $25,000 to $49,999 | 909 (87.0%) | 136 (13.0%) |
| $50,000 to $74,999 | 1,297 (99.3%) | 9 (0.7%) |
| $75,000 to $99,999 | 1,474 (94.1%) | 92 (5.9%) |
| $100,000 and over | 11,648 (94.6%) | 672 (5.4%) |
Public vs Private Health Insurance Coverage by Age in Farmingville
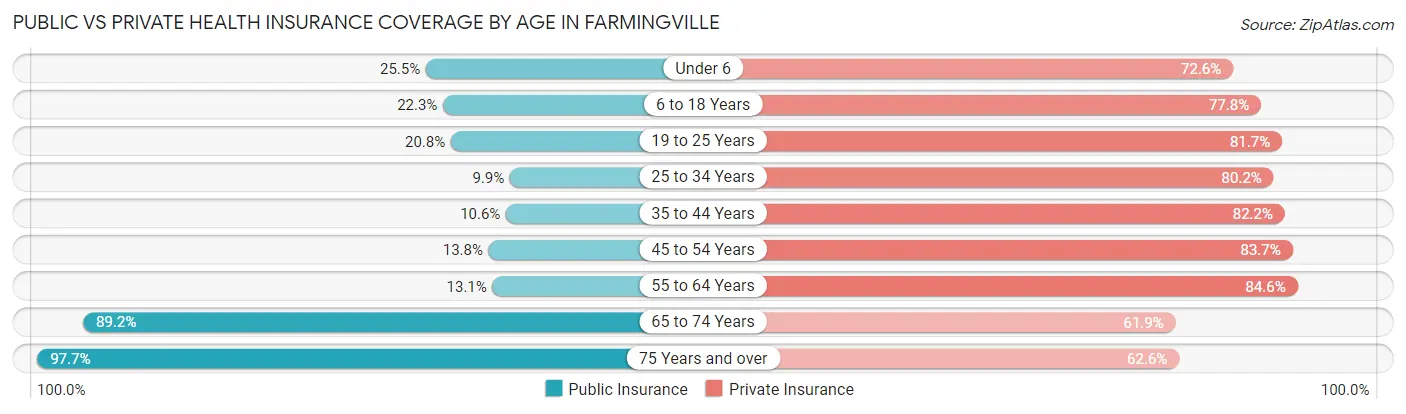
| Age Bracket | Public Insurance | Private Insurance |
| Under 6 | 365 (25.5%) | 1,040 (72.6%) |
| 6 to 18 Years | 564 (22.3%) | 1,968 (77.8%) |
| 19 to 25 Years | 452 (20.8%) | 1,772 (81.7%) |
| 25 to 34 Years | 231 (9.9%) | 1,870 (80.1%) |
| 35 to 44 Years | 185 (10.6%) | 1,434 (82.2%) |
| 45 to 54 Years | 343 (13.8%) | 2,073 (83.7%) |
| 55 to 64 Years | 283 (13.1%) | 1,823 (84.6%) |
| 65 to 74 Years | 1,012 (89.2%) | 703 (61.9%) |
| 75 Years and over | 747 (97.7%) | 479 (62.6%) |
| Total | 4,182 (25.0%) | 13,162 (78.6%) |
Disability Status by Sex by Age in Farmingville
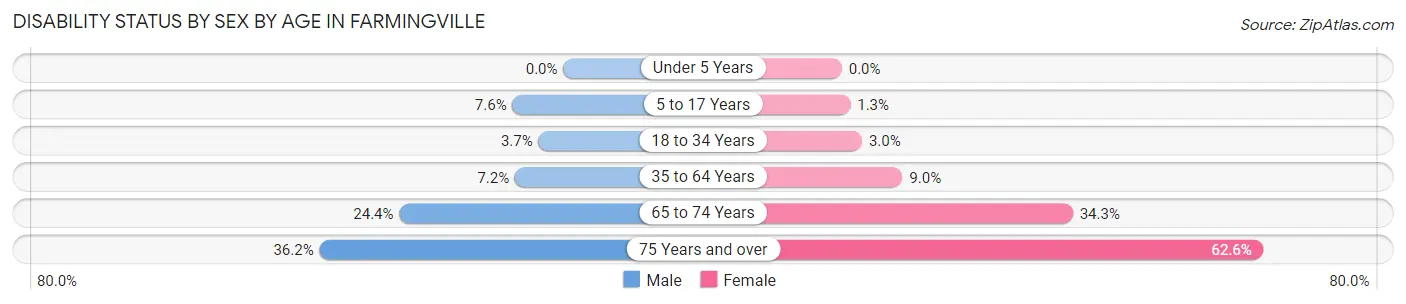
| Age Bracket | Male | Female |
| Under 5 Years | 0 (0.0%) | 0 (0.0%) |
| 5 to 17 Years | 115 (7.5%) | 13 (1.3%) |
| 18 to 34 Years | 97 (3.7%) | 63 (3.0%) |
| 35 to 64 Years | 235 (7.2%) | 279 (9.0%) |
| 65 to 74 Years | 140 (24.3%) | 192 (34.3%) |
| 75 Years and over | 151 (36.2%) | 218 (62.6%) |
Disability Class by Sex by Age in Farmingville
Disability Class: Hearing Difficulty
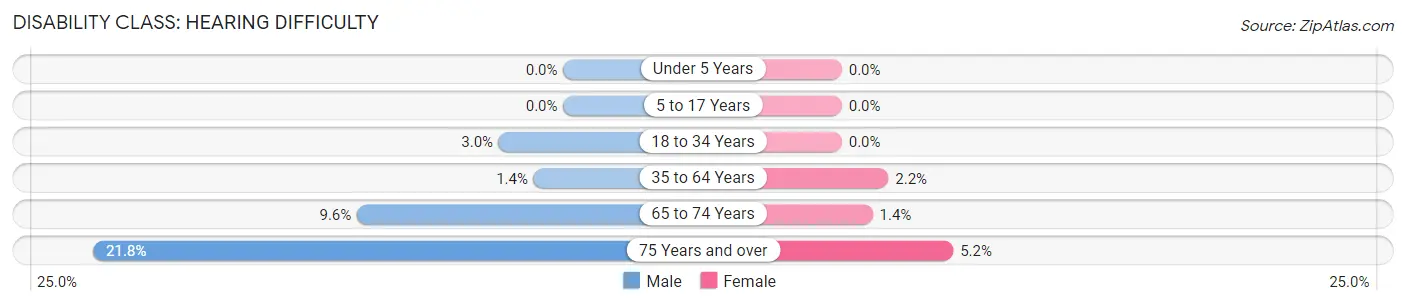
| Age Bracket | Male | Female |
| Under 5 Years | 0 (0.0%) | 0 (0.0%) |
| 5 to 17 Years | 0 (0.0%) | 0 (0.0%) |
| 18 to 34 Years | 79 (3.0%) | 0 (0.0%) |
| 35 to 64 Years | 45 (1.4%) | 67 (2.2%) |
| 65 to 74 Years | 55 (9.6%) | 8 (1.4%) |
| 75 Years and over | 91 (21.8%) | 18 (5.2%) |
Disability Class: Vision Difficulty
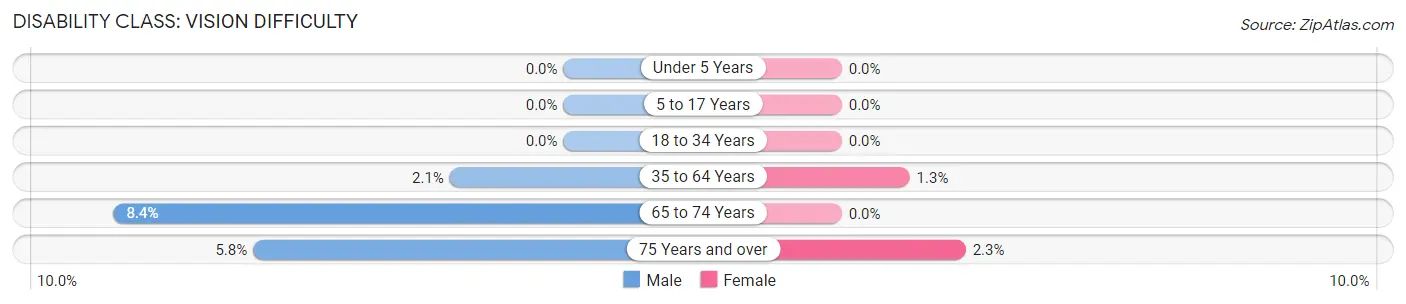
| Age Bracket | Male | Female |
| Under 5 Years | 0 (0.0%) | 0 (0.0%) |
| 5 to 17 Years | 0 (0.0%) | 0 (0.0%) |
| 18 to 34 Years | 0 (0.0%) | 0 (0.0%) |
| 35 to 64 Years | 69 (2.1%) | 39 (1.3%) |
| 65 to 74 Years | 48 (8.4%) | 0 (0.0%) |
| 75 Years and over | 24 (5.8%) | 8 (2.3%) |
Disability Class: Cognitive Difficulty
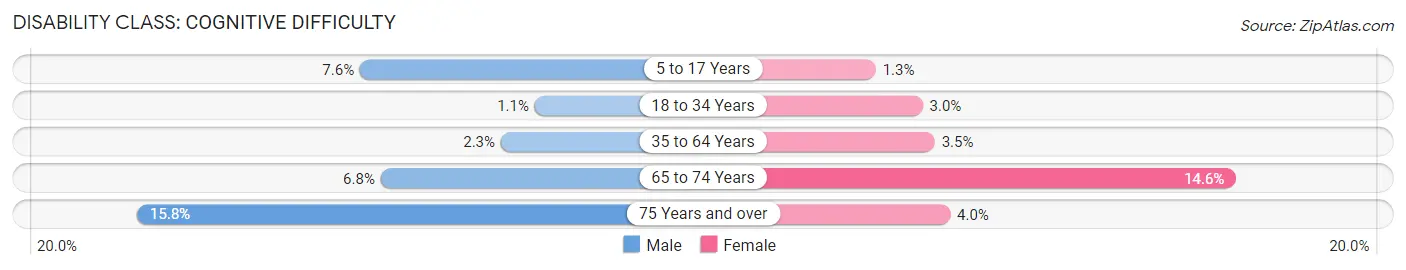
| Age Bracket | Male | Female |
| 5 to 17 Years | 115 (7.5%) | 13 (1.3%) |
| 18 to 34 Years | 28 (1.1%) | 63 (3.0%) |
| 35 to 64 Years | 76 (2.3%) | 107 (3.5%) |
| 65 to 74 Years | 39 (6.8%) | 82 (14.6%) |
| 75 Years and over | 66 (15.8%) | 14 (4.0%) |
Disability Class: Ambulatory Difficulty
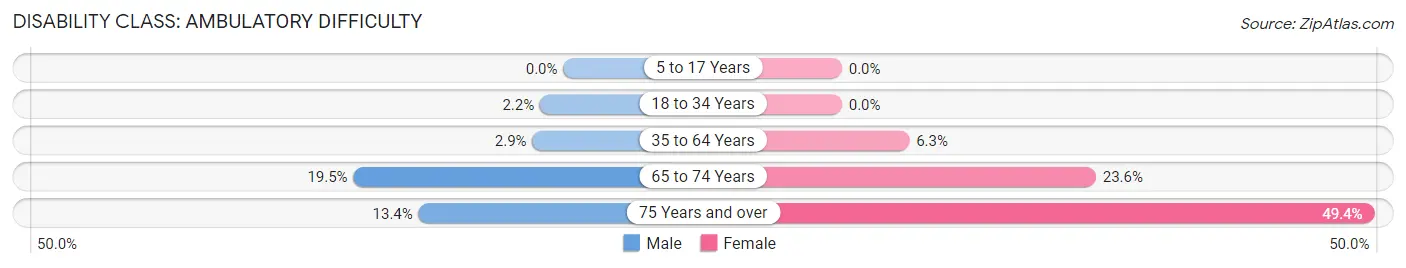
| Age Bracket | Male | Female |
| 5 to 17 Years | 0 (0.0%) | 0 (0.0%) |
| 18 to 34 Years | 57 (2.2%) | 0 (0.0%) |
| 35 to 64 Years | 94 (2.9%) | 194 (6.3%) |
| 65 to 74 Years | 112 (19.5%) | 132 (23.6%) |
| 75 Years and over | 56 (13.4%) | 172 (49.4%) |
Disability Class: Self-Care Difficulty
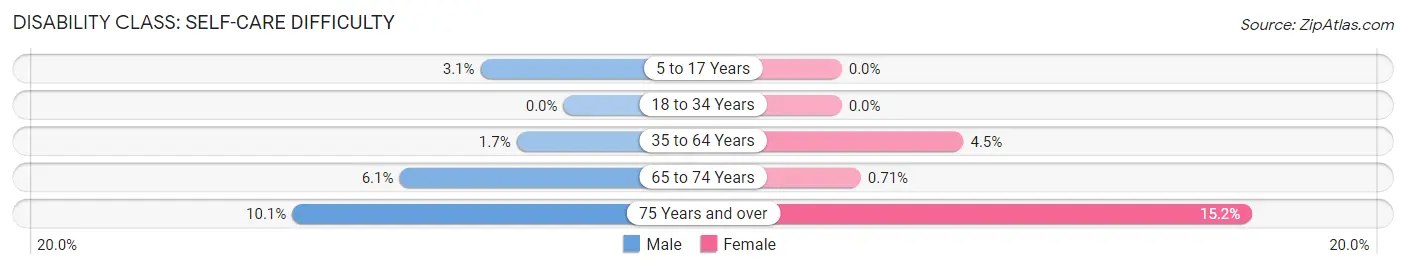
| Age Bracket | Male | Female |
| 5 to 17 Years | 47 (3.1%) | 0 (0.0%) |
| 18 to 34 Years | 0 (0.0%) | 0 (0.0%) |
| 35 to 64 Years | 57 (1.7%) | 140 (4.5%) |
| 65 to 74 Years | 35 (6.1%) | 4 (0.7%) |
| 75 Years and over | 42 (10.1%) | 53 (15.2%) |
Technology Access in Farmingville
Computing Device Access in Farmingville
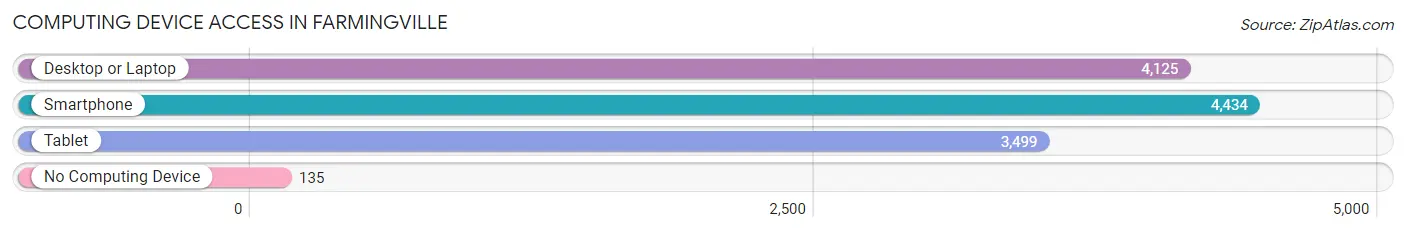
| Device Type | # Households | % Households |
| Desktop or Laptop | 4,125 | 84.4% |
| Smartphone | 4,434 | 90.7% |
| Tablet | 3,499 | 71.6% |
| No Computing Device | 135 | 2.8% |
| Total | 4,889 | 100.0% |
Internet Access in Farmingville
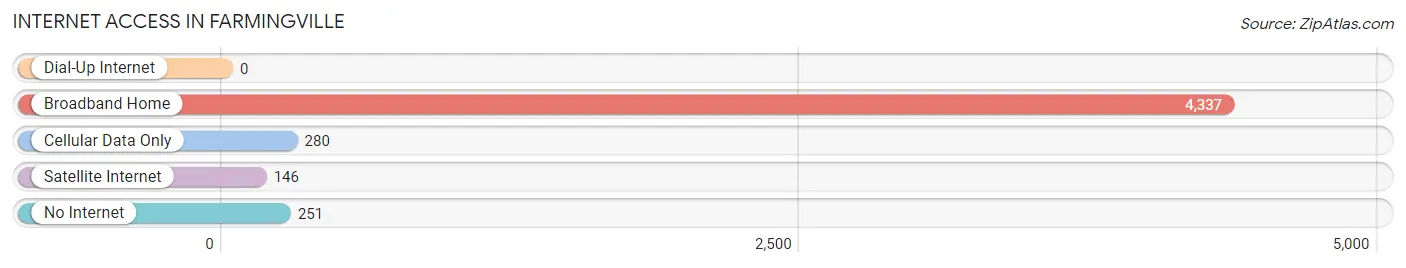
| Internet Type | # Households | % Households |
| Dial-Up Internet | 0 | 0.0% |
| Broadband Home | 4,337 | 88.7% |
| Cellular Data Only | 280 | 5.7% |
| Satellite Internet | 146 | 3.0% |
| No Internet | 251 | 5.1% |
| Total | 4,889 | 100.0% |
Farmingville Summary
Farmingville is a hamlet located in the Town of Brookhaven in Suffolk County, New York. It is located on the South Shore of Long Island, approximately 60 miles east of New York City. The hamlet is bordered by the hamlets of Ridge, Middle Island, and Yaphank. As of the 2010 census, the population of Farmingville was 15,481.
History
Farmingville was originally inhabited by the Setalcott Indians, a branch of the Algonquin tribe. The area was first settled by Europeans in the late 1600s, and the hamlet was officially established in 1750. The hamlet was named after the many farms that were located in the area.
In the late 1800s, Farmingville was a popular summer resort destination for wealthy New Yorkers. The area was known for its beautiful beaches and lush forests.
In the early 1900s, Farmingville began to experience rapid growth due to the development of the Long Island Rail Road. The hamlet became a popular destination for commuters who wanted to escape the hustle and bustle of New York City.
In the 1950s, Farmingville experienced a population boom due to the construction of the Long Island Expressway. The expressway made it easier for people to commute to and from New York City.
Geography
Farmingville is located at 40°48'N 73°2'W. The hamlet is located on the South Shore of Long Island, approximately 60 miles east of New York City. The hamlet is bordered by the hamlets of Ridge, Middle Island, and Yaphank.
The terrain of Farmingville is mostly flat, with some rolling hills. The hamlet is located in the Pine Barrens, a large area of pine forest located on Long Island. The area is known for its sandy soil and lush vegetation.
Economy
Farmingville is primarily a residential community, with most of its residents commuting to nearby towns and cities for work. The hamlet is home to several small businesses, including restaurants, retail stores, and professional services.
The hamlet is also home to several industrial parks, which provide employment opportunities for local residents. The industrial parks are home to a variety of businesses, including manufacturing, warehousing, and distribution companies.
Demographics
As of the 2010 census, the population of Farmingville was 15,481. The racial makeup of the hamlet was 79.3% White, 8.2% African American, 0.3% Native American, 5.2% Asian, and 6.9% from other races. Hispanic or Latino of any race were 16.3% of the population.
The median household income in Farmingville was $76,845, and the median family income was $87,813. The per capita income was $31,945. About 4.3% of families and 5.7% of the population were below the poverty line.
Conclusion
Farmingville is a hamlet located in the Town of Brookhaven in Suffolk County, New York. It is located on the South Shore of Long Island, approximately 60 miles east of New York City. The hamlet was originally inhabited by the Setalcott Indians, and was officially established in 1750. In the late 1800s, Farmingville was a popular summer resort destination for wealthy New Yorkers. In the early 1900s, Farmingville began to experience rapid growth due to the development of the Long Island Rail Road. The hamlet is primarily a residential community, with most of its residents commuting to nearby towns and cities for work. As of the 2010 census, the population of Farmingville was 15,481. The racial makeup of the hamlet was 79.3% White, 8.2% African American, 0.3% Native American, 5.2% Asian, and 6.9% from other races. The median household income in Farmingville was $76,845, and the median family income was $87,813. The per capita income was $31,945.
Common Questions
What is the Total Population of Farmingville?
Total Population of Farmingville is 16,889.
What is the Total Male Population of Farmingville?
Total Male Population of Farmingville is 9,192.
What is the Total Female Population of Farmingville?
Total Female Population of Farmingville is 7,697.
What is the Ratio of Males per 100 Females in Farmingville?
There are 119.42 Males per 100 Females in Farmingville.
What is the Ratio of Females per 100 Males in Farmingville?
There are 83.74 Females per 100 Males in Farmingville.
What is the Median Population Age in Farmingville?
Median Population Age in Farmingville is 35.0 Years.
What is the Average Family Size in Farmingville
Average Family Size in Farmingville is 3.6 People.
What is the Average Household Size in Farmingville
Average Household Size in Farmingville is 3.4 People.
What is Per Capita Income in Farmingville?
Per Capita income in Farmingville is $45,453.
What is the Median Family Income in Farmingville?
Median Family Income in Farmingville is $131,500.
What is the Median Household income in Farmingville?
Median Household Income in Farmingville is $128,302.
What is Income or Wage Gap in Farmingville?
Income or Wage Gap in Farmingville is 10.0%.
Women in Farmingville earn 90.0 cents for every dollar earned by a man.
What is Inequality or Gini Index in Farmingville?
Inequality or Gini Index in Farmingville is 0.35.
How Large is the Labor Force in Farmingville?
There are 9,726 People in the Labor Forcein in Farmingville.
What is the Percentage of People in the Labor Force in Farmingville?
70.8% of People are in the Labor Force in Farmingville.
What is the Unemployment Rate in Farmingville?
Unemployment Rate in Farmingville is 4.0%.